It was in May 2018 that StatsBomb began to offer precise defender and goalkeeper locations for all shots in the form of our ‘Freeze Frames’ – a snapshot taken at the moment of the shot that captures the location of all players involved in the event. This enables us and our customers to more accurately evaluate the context around each shot and measure the impacts of things we know to have an impact on the outcome of those chances, such as defensive pressure, answering one of the biggest questions posed in the football data industry in the process.
On March 17th 2021, we will bring you the latest innovations to come out of StatsBomb at our free online event StatsBomb Evolve, including upgrades to our current dataset and the launch of our revolutionary new data product StatsBomb 360. In the build up, we’re looking at some of the unique data points that already make StatsBomb Data the clear best in the industry, and the obvious choice for smart clubs and analysts.
Every shot recorded in the StatsBomb Database has a Freeze Frame attached to it, revealing the location of all players, attacking or defending, within the camera frame, as well as the goalkeeper’s position. Knowing where the goalkeeper is located has huge implications for the accuracy of our expected goals model.
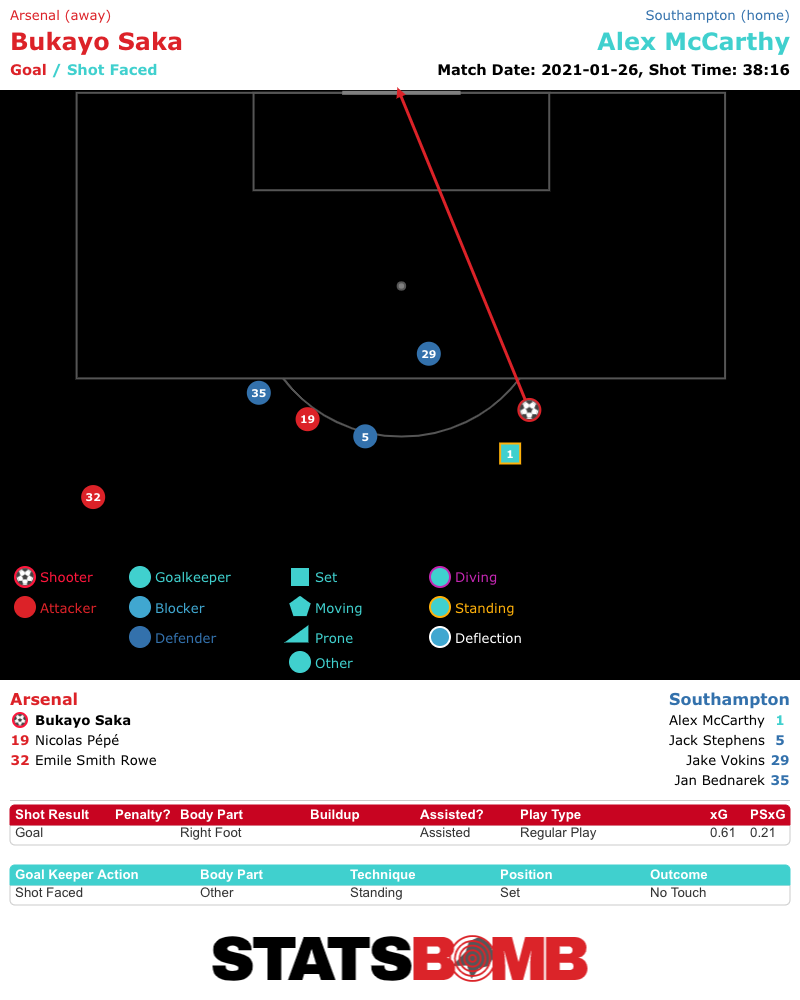
As does the location of defenders. Shots from central areas in the penalty area are typically easier to score, unless the defending team has covering defenders in position to make a block, for example, thus dramatically reducing the likelihood of the shot hitting the target let alone resulting in a goal.
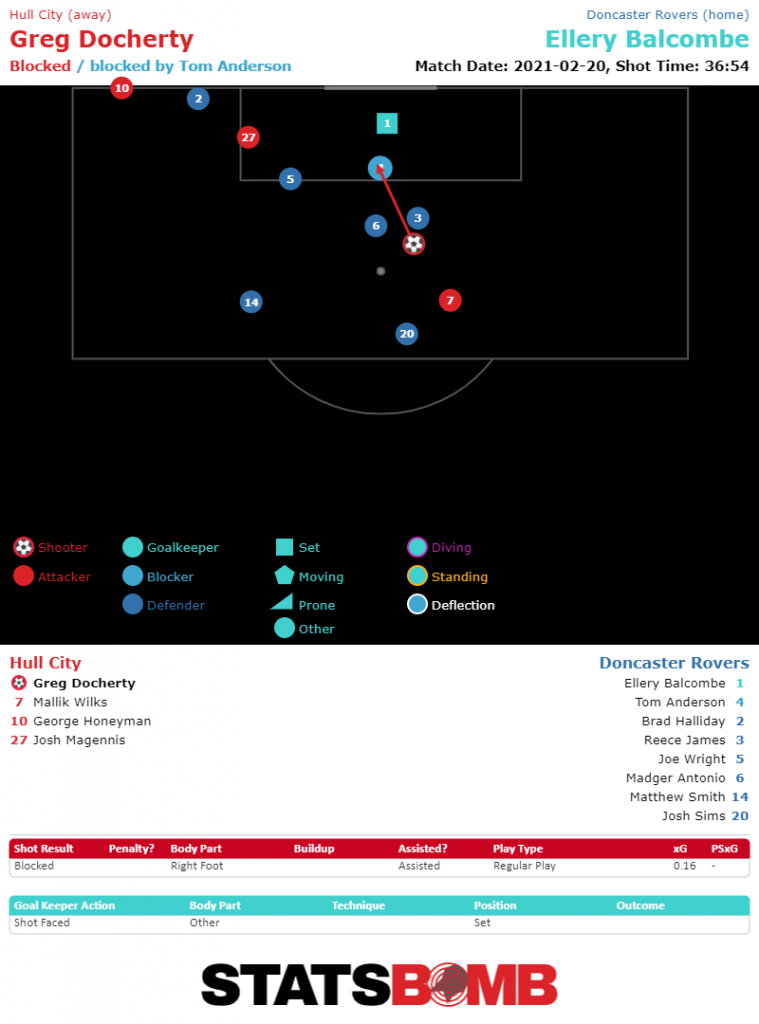
Of course, no model is perfect, but we believe that Freeze Frames, along with the addition of Shot Impact Height, means we have significantly more information around shots than that of other data providers, giving us a closer representation of reality and greatly enhancing the precision of our models. Besides being good for data integrity, Freeze Frames also give us the ability to derive a ton of other metrics around shooting. We’re going to look at a few of those today. For example, having more attacking players in the box is regarded as a worthwhile strategy when trying to score goals. So it'd be really cool to know how many players a team pushes into the box when they're shooting on goal, wouldn't it? Let's evaluate how this season's Premier League and EFL teams perform in this aspect.

Predictably, Manchester City and Liverpool generate the most shots in the box from Open Play and tend to have a large number of attackers in the box when shooting. We regularly see both of these teams build pressure on the opponents and urged forward by their attack-minded coaches, so it's no surprise to see them towards the top end in both of these metrics.
Though generating nearly half as many shots in the box as the Premier League pair, both Middlesbrough and Huddersfield average a higher number of attacking players in the box, committing bodies to the attack when in opposition territory. However, the trade-off between committing a large number of attackers is that there is often the same amount of defenders covering, usually more. It’s valuable to get bodies forward, but there’s also value in creating opportunities where you outnumber your opposition regardless of whether it's two or six players you have in the attack.
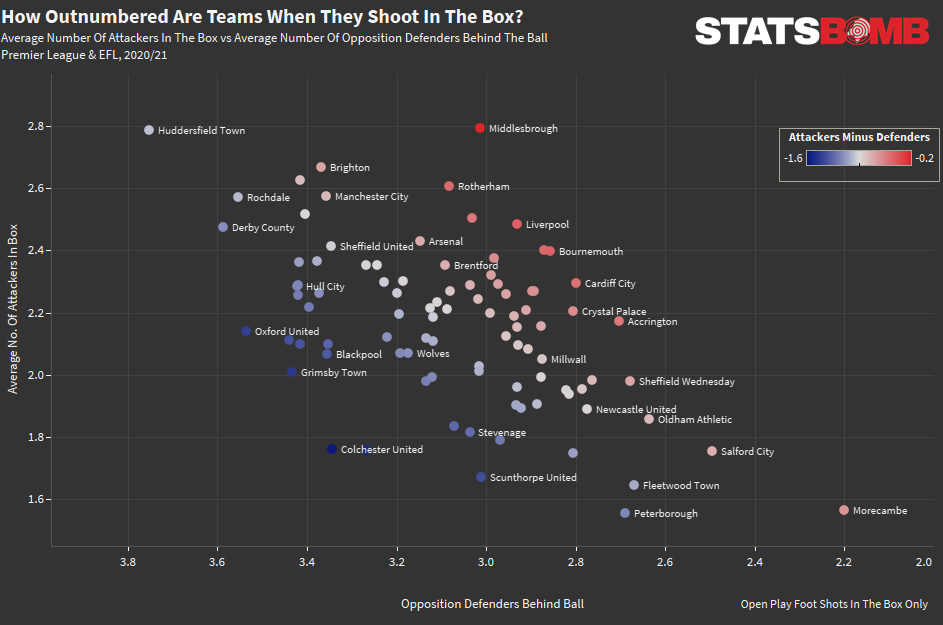
*(Defenders Behind Ball calculated as Defenders with an x-coordinate closer to goal than the shot location. It does not necessarily mean they were in a position to block the shot)
So, despite both committing a high number of bodies forward, Manchester City tend to face more defenders in the box when shooting than Liverpool. This is likely down to City preferring to focus on positional play in the attacking phase whereas Liverpool tend to favour quick transitions. Indeed, Liverpool have registered more counterattacking shots this season than their rivals, so this seems a likely explanation. Neil Warnock's Middlesbrough are a standout here.
Whereas Huddersfield match them for the number of attacking bodies they have forward when shooting in the box, the Teessiders are shooting against defences that are less tightly packed. Boro's box shots have an average of 3 defenders deeper than the shot location, whereas Huddersfield's have 3.75. League Two Morecambe are another major outlier in that they have the lowest average number of attacking players forward when shooting in the box, but also the fewest opposition defenders.
Indeed, there's an average of only 3.8 attackers in the box plus defenders behind the ball for Morecambe's box shots, contrasted with Huddersfield's 6.5, not far off twice as many bodies. The big clue as to how Morecambe are doing this lies in their Pace To Goal - the average speed (in m/s) of build-up for possessions that end in shots. Morecambe's Pace To Goal is the fastest in League Two, implying that they play forwards and transition quickly, finding space in the opponents half before their opposition are able to recover their positions.
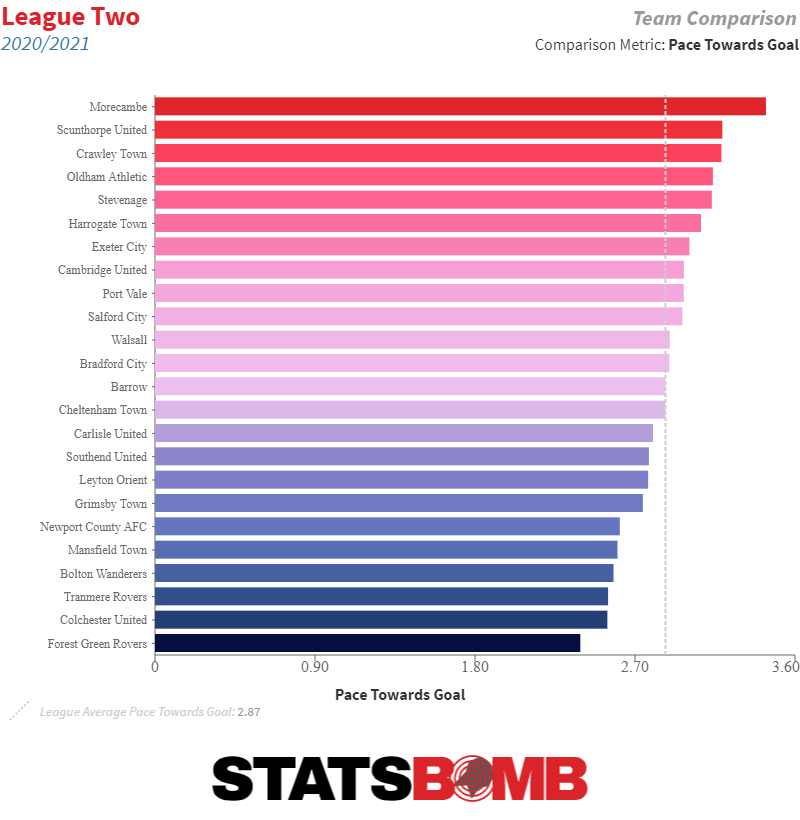
Contrast that with Colchester United, who rank 23rd in the Pace To Goal metric. The League Two strugglers seemingly combine a slow attack with a conservative approach to committing bodies forward. Their 1.7 Attackers In The Box vs 3.3 Defenders In The Box mean the opposition have nearly twice as many bodies defending when Colchester try to create chances in the penalty area. On the defensive end, we can look at teams who get bodies behind the ball to stifle the opposition, by applying pressure on the shot taker or by defending space.
Teams that defend higher up the pitch and apply pressure to the opposition backline have to work hard to recover their positions, whereas teams that look to stand off and regain their defensive shape tend to have more defenders in a position to defend the box once the opposition advance into their territory.
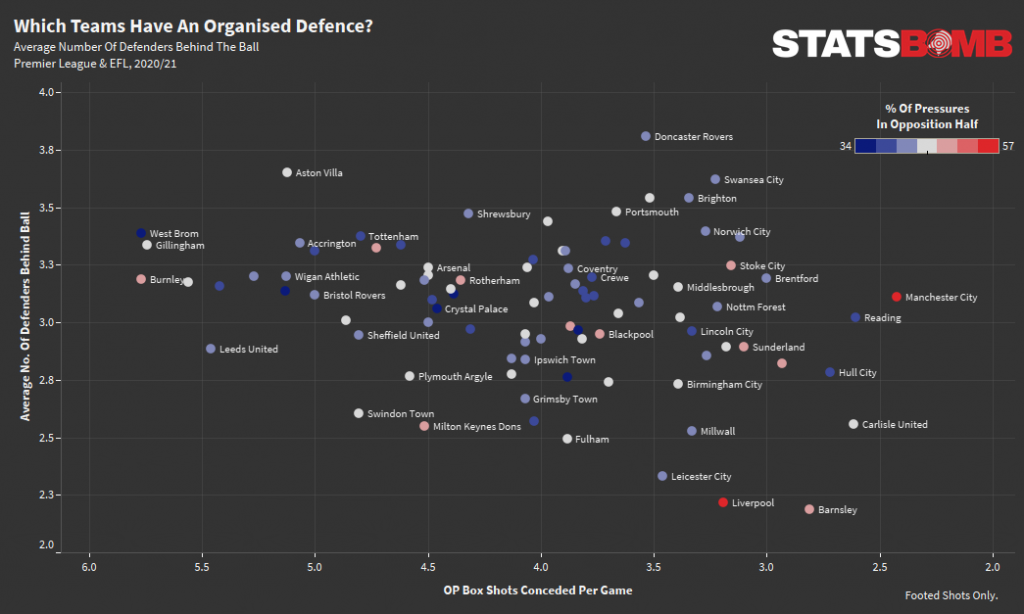
Liverpool and Manchester City are again worth looking further into here. Both apply a lot of pressure on the opposition backline and look to keep the game in the opposition territory as much as possible, but looking at this it would appear that this season Manchester City have been able to recover their positions more quickly, averaging a higher number of defenders behind the ball when their opponents shoot in the box.
That’s not to say Liverpool’s press isn’t effective though as they, like Barnsley in the Championship, press aggressively high up the pitch in order to suppress the number of opportunities the opposition are able to create in the first place. Barnsley have the fewest defenders behind the ball on average when conceding shots in the box, but the efficacy of their press means they only concede 2.8 footed shots in the box per game.
League One Doncaster average the highest number of defenders behind the ball when the opposition shoot, with nearly an entire back four's worth (3.9) of defenders, plus the goalkeeper, positioned behind the ball when the shot is taken.
It's also no surprise to see Championship promotion chasers Swansea show up well in this metric, having conceded the fewest goals in the second tier so far, succeeding in both getting bodies behind the ball and in suppressing the shooting opportunities of their opponents in the box. StatsBomb’s Freeze Frames also feature the ‘Keeper Cone’ – a cone drawn between the shot taker and the goalposts to highlight the amount of goal the shot-taker is able to see. This allows us to evaluate the goalkeeper’s position but also whether there are any covering defenders in position to block the shot.
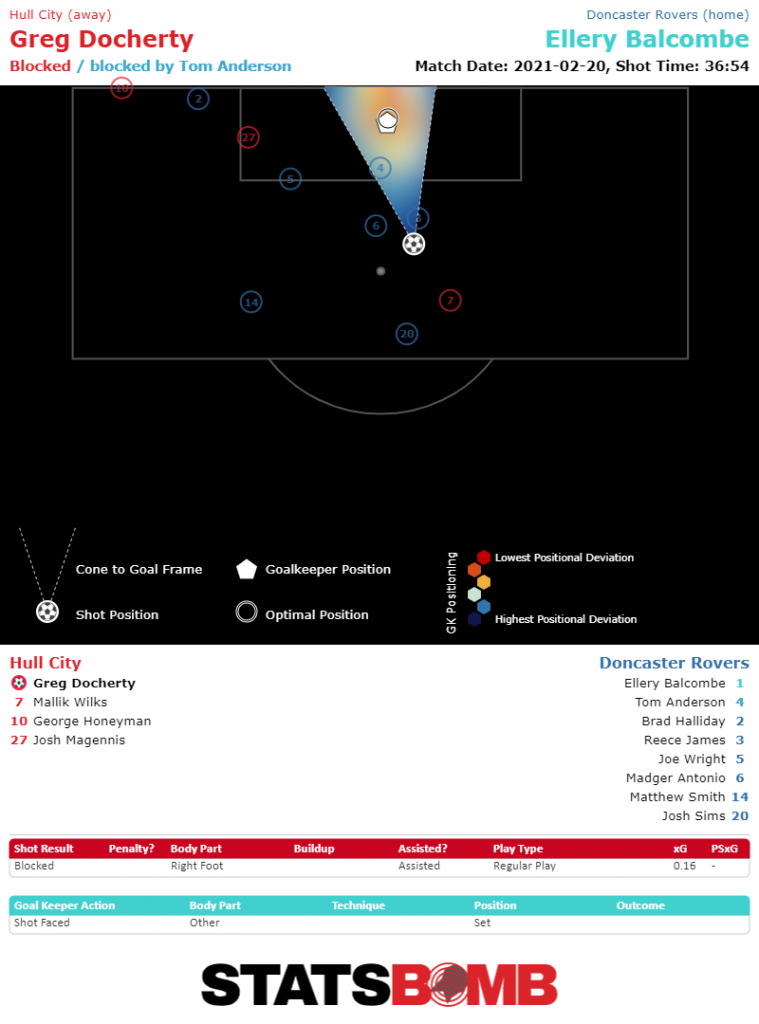
Defences that are able to get bodies between the ball and goal will naturally stand a better chance at blocking the shot and preventing it from even testing the goalkeeper, so let’s look at how regularly teams are able to get defenders into the Keeper Cone, and how effective they are at blocking shots in the penalty box.
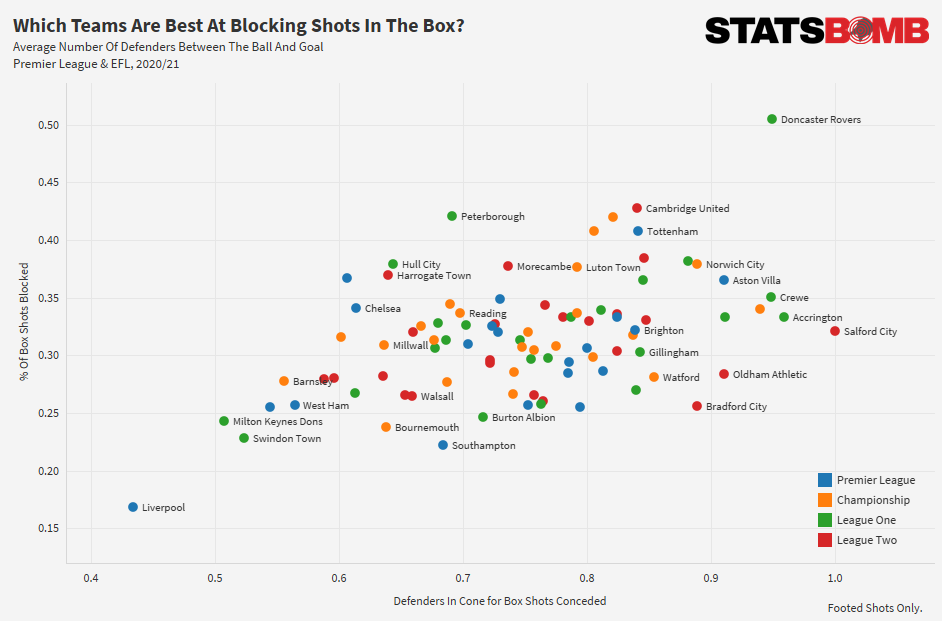
As we've seen, Doncaster tend to have plenty of covering defenders and are regularly able to get one of them between the ball and goal to reduce the likelihood of the opposition scoring. As a consequence they're blocking half of all their opposition’s box shots with feet, at least up to this stage of the season. In general terms, close-range shots with feet are regarded as the most dangerous chances a team can create.
By making sure only 1-in-2 of them test the goalkeeper, Doncaster are doing all they can to make it difficult for their opponents to score, evidenced by having the second-best xG per Shot Conceded in League One. There’s plenty more analysis that can be done with Freeze Frame data, but hopefully this has provided a snapshot of what’s possible when you collect more contextual information around shots, and a glimpse at the insight that can be gleaned into a team’s attacking or defensive game.
Join us at StatsBomb Evolve on March 17th 2021 to discover how we're going to change the football industry, including the launch of our new data product, StatsBomb 360. To find out more, click here.
