
What Are Expected Goals (xG)?
What is xG?
Put simply, Expected Goals (xG) is a metric designed to measure the probability of a shot resulting in a goal.
An xG model uses historical information from thousands of shots with similar characteristics to estimate the likelihood of a goal on a scale between 0 and 1.
For example, a shot with an xG value of 0.2 is one that we would generally expect to be converted twice in every 10 attempts.
But that's just the start of it. Read on for a guide to understanding one of the most common advanced metrics in soccer.


Expected Goals xG FAQ
- How is xG calculated?
- Why do you see different xG values for the same shot?
- Why is xG important?
- How was xG developed?
- How accurate are Expected Goals?
- How do xG models treat penalties?
How is xG calculated?
Each xG model has its own characteristics, but these are the main factors that have traditionally been fed into the large majority of Expected Goals models: distance to goal, angle to goal, body part with which the shot was taken, and type of assist or previous action (throughball, cross, set-piece, dribble, etc…). Based on historical information of shots with similar characteristics, the xG model then attributes a value between 0 and 1 to each shot that expresses the probability of it producing a goal.
Why do you see different xG values for the same shot?
Not all xG models take into account the same factors. For example, a standard Expected Goals model that only features distance to goal, angle to goal, body part, and type of assist or previous action might value a given shot at 0.30 xG. A more precise model such as Hudl Statsbomb xG adds key information such as goalkeeper position and status, the position of all attackers and defenders in frame, and shot impact height to give a more accurate picture of chance quality. For instance, knowing the goalkeeper was out of position, it might give the same chance a value of 0.65 xG.
Why is xG important?
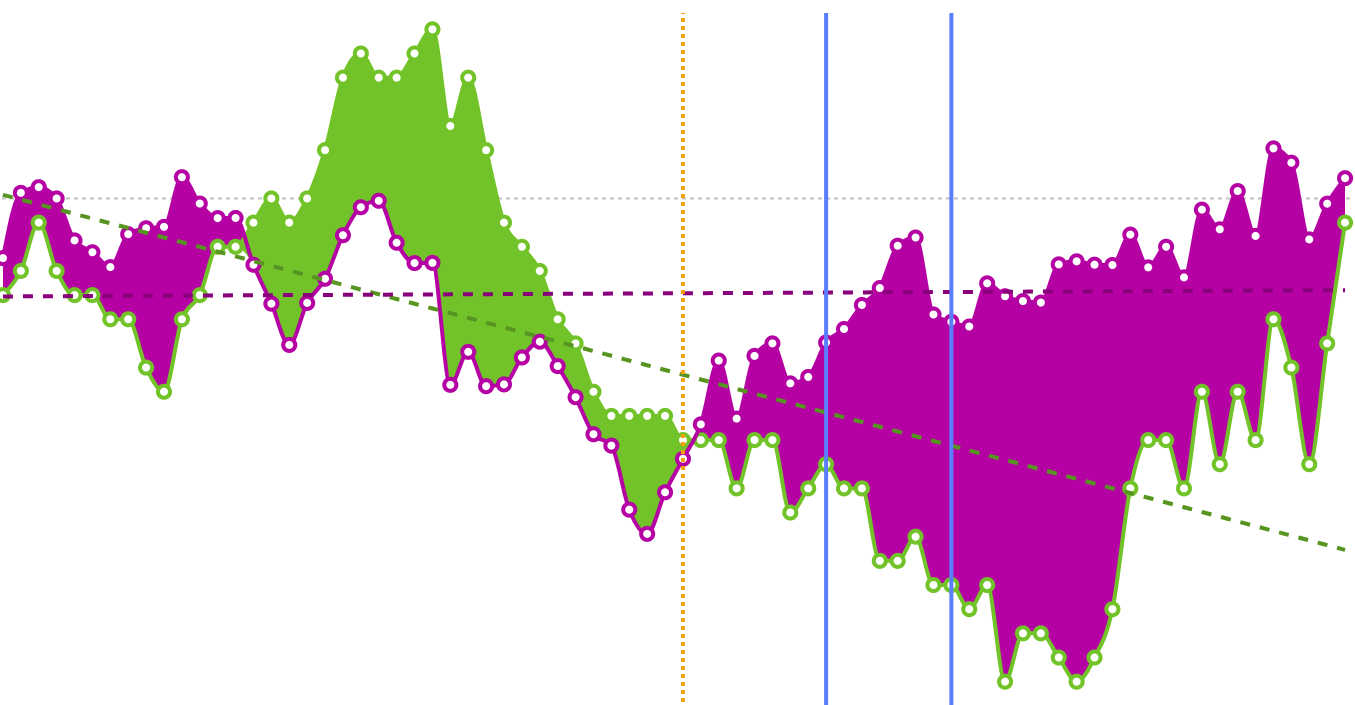
xG models are important because they are the most accurate predictor of future team and player performance available. At a team level, Expected Goals models are more predictive of future performance than both current goal difference and simple shot-count metrics such as Total Shots Ratio (TSR). xG models allow us to look beyond current results to get a better idea of the underlying quality of both teams and players.
How was xG developed?
Goals are the most important events in football, but they are also the most infrequent. In most leagues, there are only 2.5-3 goals per match. Variance plays a big role in results. So we first started to look at shots. There are 25 to 30 of those per match -- 10 times more. That gave rise to metrics such as Total Shots Ratio (TSR) that measured team dominance by their share of the shots in their matches. But not all shots are created equal. We needed a method to measure the quality of a given shot or set of shots, and so xG models were born.
How accurate are Expected Goals?
There is obviously a degree of residual variance between goals and xG over certain time periods given that shots have a boolean outcome of either goal or no goal, whereas xG values fall on a probabilistic scale between 0 and 1. An independent study by Lars Maurath suggests that depending on model quality, between 79% and 93% of team seasons should be expected to match xG to goals within a 95% confidence interval.
How do xG models treat penalties?
As all penalty kicks share the same characteristics, they are assigned a static value of 0.76 xG by the large majority of models, reflective of the historical conversion rate of penalties. The 2022 update of the Hudl Statsbomb xG model modifies this static value to 0.78 xG. Goals scored and xG generated from penalties are often removed from player and team totals when analysing performance.
What have xG models taught us?
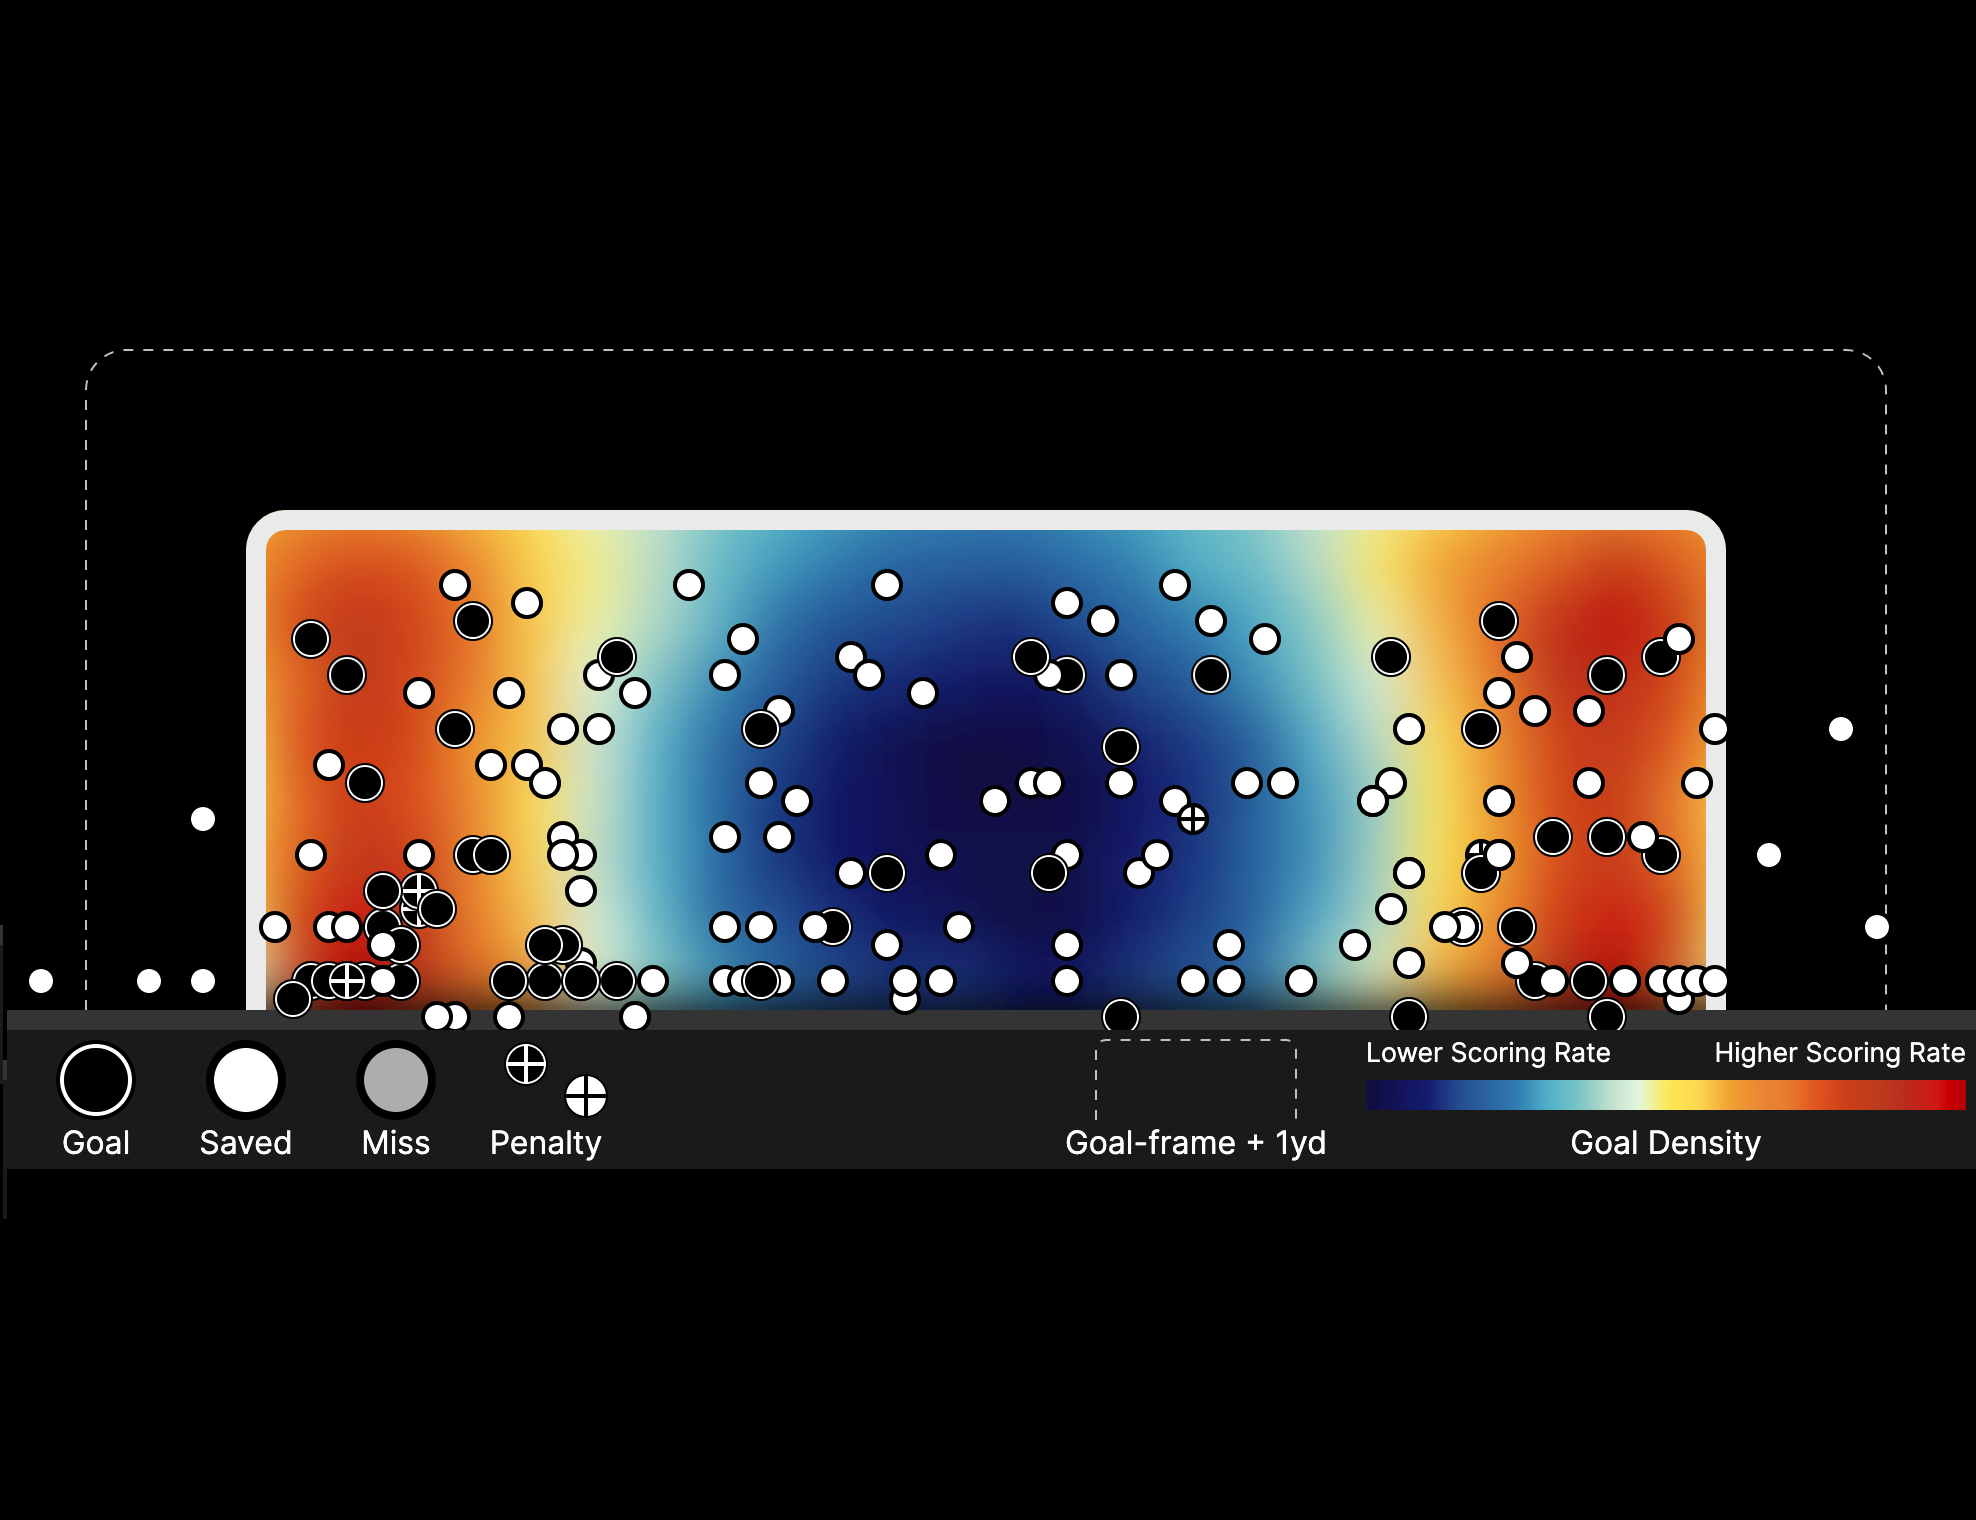
Many of the things we have learned from xG models are, to a degree, intuitive. Even the most casual supporter could tell you that a shot from inside the six-yard box has a greater chance of producing a goal than a shot from 30 metres out. But what an Expected Goals model provides is a statistical framework to systematically evaluate the value of each and every shot, and determine how much more likely one is to result in a goal than the other.
Central Shots Are Best
Shots from the central part of the penalty area are more valuable than those from tighter angles.
Feet Over Head
From the same distance, foot shots are more likely to result in goals than headed shots.
Crosses Are Hard
In general, crosses are more difficult to convert than ground passes, throughballs and shots after dribbles.
Shot Quality is Key
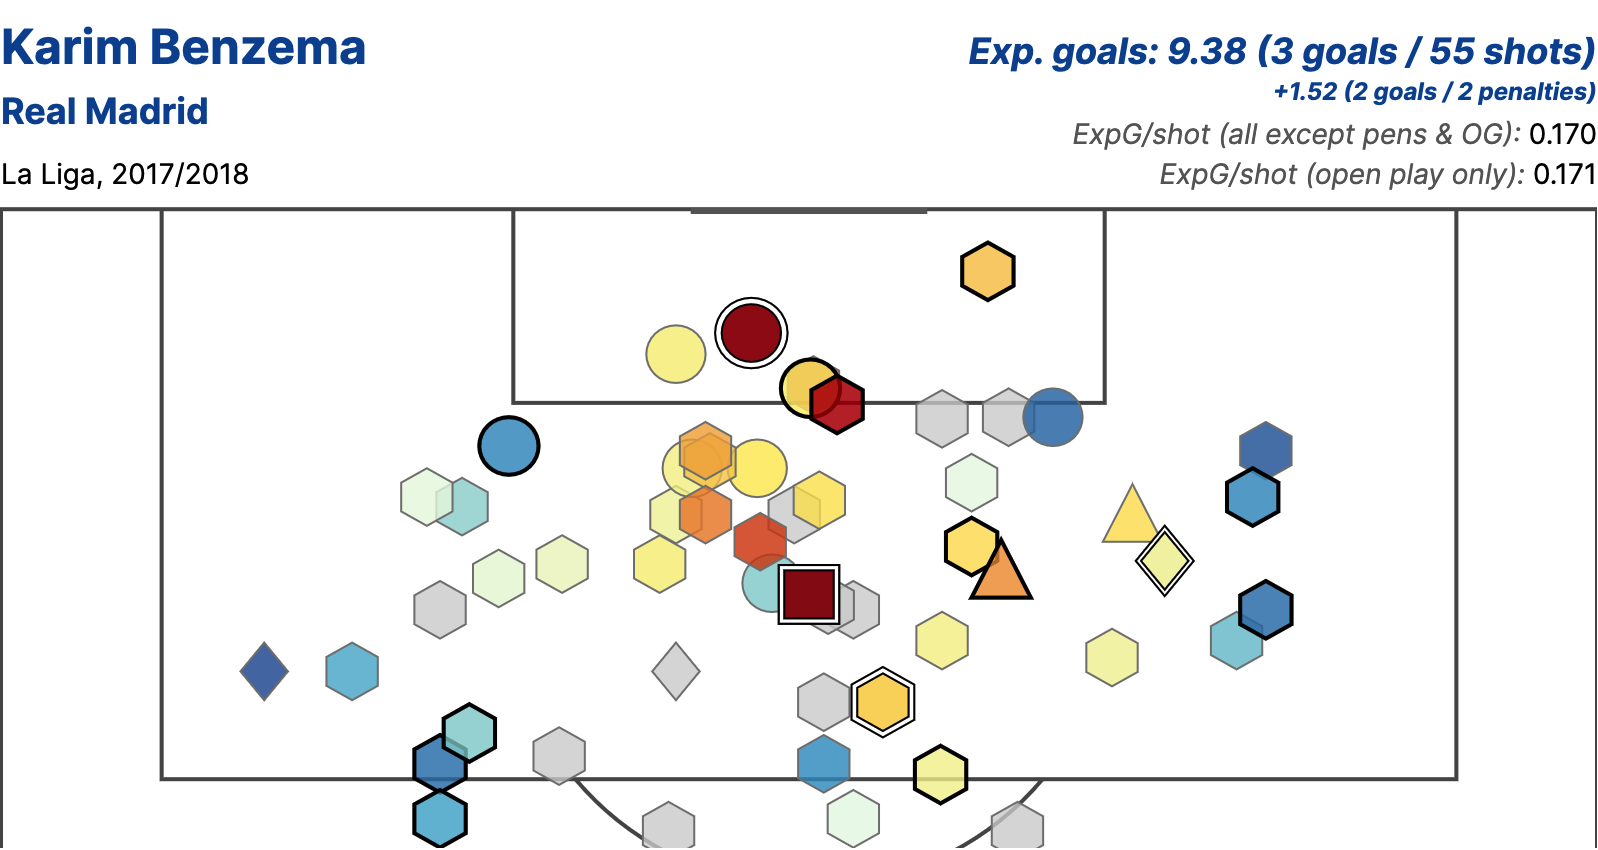
Given large enough sample sizes, it is possible to identify certain players who stand out for their finishing ability, but the large majority of players are close to average. In general terms, what differentiates good forwards isn't so much finishing chances at an above-average rate but generating shots from valuable locations.
How can xG be used?
Team Analysis
xG can be used to get a better idea of underlying team quality beyond current results, highlighting teams who are over or under-performing their expected numbers and whose results may soon begin to change.
Player Analysis
Expected Goals totals can be used to determine when a player might be in the midst of a hot or cold streak in front of goal, while looking at average shot quality (xG/shot) can highlight players taking good or bad shots.
Head Coach Scouting
xG models provide an objective measure of underlying team performance that can be used to highlight interesting coaches who are producing effective football.

Predictive Modelling
Expected Goals models are utilised by both bookmakers and professional gamblers as a cornerstone of predictive modelling around future results.
What is Post-Shot xG?
Post-Shot xG (PSxG) is calculated after a shot has been taken and generally considers shot placement, and if the model includes it, goalkeeper positioning in assigning a value between 0 (off-target) and 1 to every shot.
Traditionally, PSxG's primary utility has been in assessing goalkeeper shot-stopping ability, although newer models that include extra factors like shot velocity could provide further insight into finishing ability.


Further reading on xG
Some further reading on Expected Goals from around the Hudl Statsbomb website.


Want to learn more?
Our 100% online courses are ideal to get you started on your soccer analytics journey.