At StatsBomb we collect football data from both the NFL and NCAA using the same data specifications. We also create the same model derived metrics across both competitions, such as Completion Percentage Over Expected (CPOE) and Expected Points Added (EPA). In this article, we’ll explore some differences between the NCAA and the NFL and how we incorporate those differences into our models.
There are three potential options for modeling NFL and NCAA data:
- Fitting a separate model for each. This would allow the model to find the intricacies in each competition without any confounding at all from the other level. The main drawback of this approach is that it limits the amount of data available to train each model.
- Fitting a single model to cover both competitions, with no consideration for the level the game belongs to. This in essence treats the NFL and NCAA as identical in terms of the outcomes expected for each play.
- Fitting a single model, including a feature indicating to which competition a given game belongs. This should allow the model to pick up any differences between levels, while having an increased amount of data to draw broader conclusions from.
Having explored these options for our CPOE and EPA models, the third approach (using a single model with a competition feature) produces predictions of the desired accuracy across both levels of play. In our case, the increased sample size in a single model outweighs the individual gains that may be observed with two separate models and a smaller sample size used to train each. In comparing a single model with and without a competition feature, calibration within each level was far better for the model with the competition feature. Furthermore, both CPOE and EPA use an XGBoost model. Using a tree based method of this kind means that the impact of the competition feature is not fixed and can vary depending on the values of other features. This is an important characteristic, as we would not expect a consistent difference between levels for all plays. If a simpler regression based approach had been used, it would be trickier to implement a varying difference between NFL and NCAA, as it would require the specification of complex interaction terms between features.
Case Study: Catch completion model
A good example of the need for the flexibility afforded by the chosen approach is in our catch completion models. While the majority of football rules are consistent across both NFL and NCAA, one rule that differs is the definition of a successfully completed catch. In the NFL, the receiver needs two points of contact to complete the catch, whereas only one needs to be in bounds at the time of the catch by NCAA rules. This means that it is inherently more difficult to catch a pass at the sidelines in the NFL, regardless of the ability of the QB or receiver. Two of the features included in our model are the distance of the receiver from the sideline and from the endline at the time of the catch. Due to the difference in rules, we would expect that catches close to the sideline (or endline) would have a lower completion probability in the NFL compared to the NCAA. There are two ways we can see that the model predictions are aligned with these expectations.
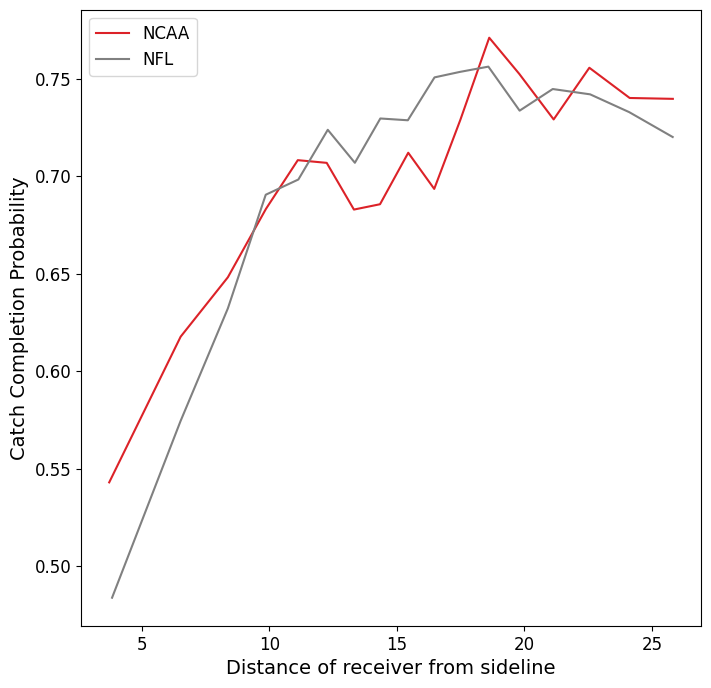
Firstly, we can look at the overall relationship between the sideline feature and predicted catch completion probability. In this plot, we look at all plays and plot the average completion probability (y-axis) against the average distance from the sideline (x-axis). We can see that the completion probability is lower for the NFL when the receiver is nearer to the sideline, compared to plays nearer the middle of the field which have less of a difference between the levels. This visualization groups all plays based on their level of play and distance from sideline alone, without accounting for the values of other features in the model. This means that we can’t be sure how much of this difference is due specifically to distance from the sideline, and how much due to other characteristics of these plays, such as receiver separation and pressure on the QB.

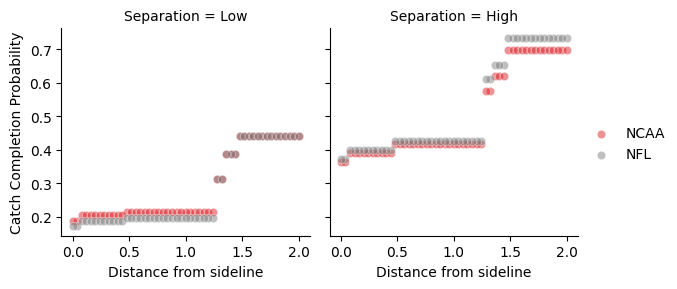
To further disentangle the impact of sideline alone for each level of play, we can generate sample data. We calculate the predicted catch completion probability for varying values of the distance between the receiver and the sideline (between 0 and 2 yards) across two different scenarios. Firstly, a ‘Low Separation’ scenario, where the receiving player has players from the opposition near to them (nearest player half a yard away and a relatively high soft pressure value, indicating multiple defensive players in the vicinity). The second scenario, ‘High Separation’, has the nearest defender two yards away and a comparatively lower soft pressure value, indicating a situation where the receiver is in more open space. The remaining features used in the model (e.g. yardline of the play and the pressure on QB) remain identical between both scenarios.
In the low separation scenario, we can see that the NCAA completion probability is higher than for the NFL when the receiver is closer to the sideline (within ~1.25 yards). After this point, the completion probabilities increase and are similar across both competitions. In this low separation scenario, the completion probabilities for plays where the receiver isn’t close to the sideline are almost identical between NCAA and NFL. In comparison, the NFL probability is higher than the NCAA for all distances from the sideline in the high separation scenario. If we assume that these results are reflective of the rules differences, they indicate that requiring two feet in bounds is more impactful when the catch attempt is closely contested by defensive players, which makes sense.

By considering these scenarios, we have seen how the distance from the sideline and separation of the receiver influence the catch completion probability for plays in the NFL and NCAA. Moreover, we can see that the difference between levels of play is not fixed and will vary based on the exact context of the catch attempt. Although the differences attributed to level of play observed here are small (the maximum difference is ~0.04), we have only considered a small subset of possible scenarios. Altering the values of other features within our sample data would change the predicted completion probabilities for each example, and it is almost certainly possible to find situations where the difference between levels is greater than those we have observed here.
In summary, ensuring that our models work well for all the data we have is an important part of the work we do. This involves looking at the model calibration individually for the NFL and NCAA to ensure that the model is performing well at a macro level, as well as examining the individual relationships between each feature and the model predictions. Although we have mainly focused here on our catch completion model, the same logic applies to all the models we produce.
