
Towards the beginning of his managerial career Xavi Hernandez gave an interview in which he commented “I understand football as space and time”. It’s a reasonably celebrated quote and one that is referenced in a lot of modern day tactical blogs.
The two elements combine in many aspects of the game, of course. But one such concept that comes with the marriage of time and space on a football pitch is the overload.
With StatsBomb’s 360 data we can measure space and, in turn, the number of bodies within a predefined area at a specific time. And because we know the identity of the team of each player within a 360 frame, we can count them, compare them, and ultimately identify instances in a game when a team has created an overload.
What follows is a summary of my thought process and methods for identifying Attacking Overloads, not necessarily in an effort to convince anyone of their merits, but more so in the hope that it can inspire further ideas and developments in the way that bespoke metrics can be created and KPIs can be evaluated.
What is an Attacking Overload?
Overloads in football occur when one team has more players than the opposition in a specific area of the pitch. An Attacking Overload can be defined as specifically when it is the attacking team that has the most players in that predefined area.
Why do overloads matter?
Overloads give the player in possession an upper hand in regards to the passing options available to them and gives defenders a decision to make as to where to focus their attention. They can help teams progress up the pitch and break into the final third more quickly.
Some football managers and coaches care about creating overloads; and if you care about something you should monitor it, otherwise you can’t vouch for its relevance or your proficiency for nurturing it.
Using Statsbomb 360 Data to identify Attacking Overloads
Now for the fun part. We need to make a few rules about how we identify Attacking Overloads. What follows is a set of parameters that I (with some help from StatsBomb colleagues) have come up with to identify Attacking Overloads, they are not a single source of truth. It is at this point that if you’re creating your own metrics I’d encourage you to take 30-40 minutes (or however long it takes) to sit down with relevant stakeholders and thrash out the finer details - keep it as simple as you can and be conscious that not everything can be measured as succinctly as you might wish. Sometimes a proxy towards what you want to measure is fine.
Alas, I have used the following process to define when an Attacking Overload occurs, and from hereon in whenever I reference an Attacking Overload, they have satisfied the following criteria:
- Define the space - I have used the latitudinal area between the left/right touchline and a theoretical line parallel to the left/right edge of the 6-yard box, and the longitudinal space between the edge of both 18-yard boxes. From hereon in, I will refer to this as the zone.
- Define the time - I’ve used the start point of any pass that happens within the zone (as defined above). You could also use Ball Receipts here too, but I feel that using the starting point of a pass is closer to what we are trying to identify when talking about an overload, as it gives teammates an opportunity to enter the zone once the ball has entered it, and create the overload.
The next step is to count and compare the number of players, but rather than a straightforward tallying of heads, I’ve added a few additional rules that align with my more subjective understanding of Attacking Overloads.
- More teammates than opponents in the zone - this is the obvious one and the fundamental premise of an Attacking Overload. However, there is a caveat here in that I have used a slightly larger zone for the defenders, a zone+, if you like. The zone+ is the parameters of the zone, but with some multiplication factor, making it slightly bigger. This helps to account for instances where a teammate just inside the zone is lined up man-for-man with an opponent just outside - we obviously wouldn’t want to class this as an overload.
- More teammates ahead of the ball than behind the ball - overloads tend to be (or at least the ones we care about) when in controlled possession, what I don’t want to highlight are instances where a player has broken away and the majority of teammates in the area are behind the action. That isn’t an Attacking Overload as I understand it.
- More than two teammates and more than two opponents in a frame - although a 2v1 could technically be described as an overload, without this condition you can pick up a lot of instances when play (or the broadcast camera) is only just shifting into the zone. 2v1s also tend to occur more so in breakaway/counter attack scenarios following a turnover of possession or quick switch of play - neither of which are the type of situation I want to capture when talking about Attacking Overloads.
- Number of teammates ahead of the ball is more than or equal to number of opponents ahead of the ball - for similar reasons to the above, I don’t want to identify instances where the majority of teammates are behind the ball, that clearly doesn’t help to satisfy the primary reason for creating Attacking Overloads; to progress the ball.
- Finally, when counting overloads, I don’t particularly want to have a count of, say, three overloads, if there are three quick passes in the same zone that are all part of the same instance where a team has created an overload. For this reason I have chosen to only count the first overload (in each zone) in each possession. If a subsequent overload happens in the same zone it is not counted.
All of the above leads to something that looks like the example below taken from a random fixture;
Red + Ball = In-possession team
Blue = Out-of-possession team
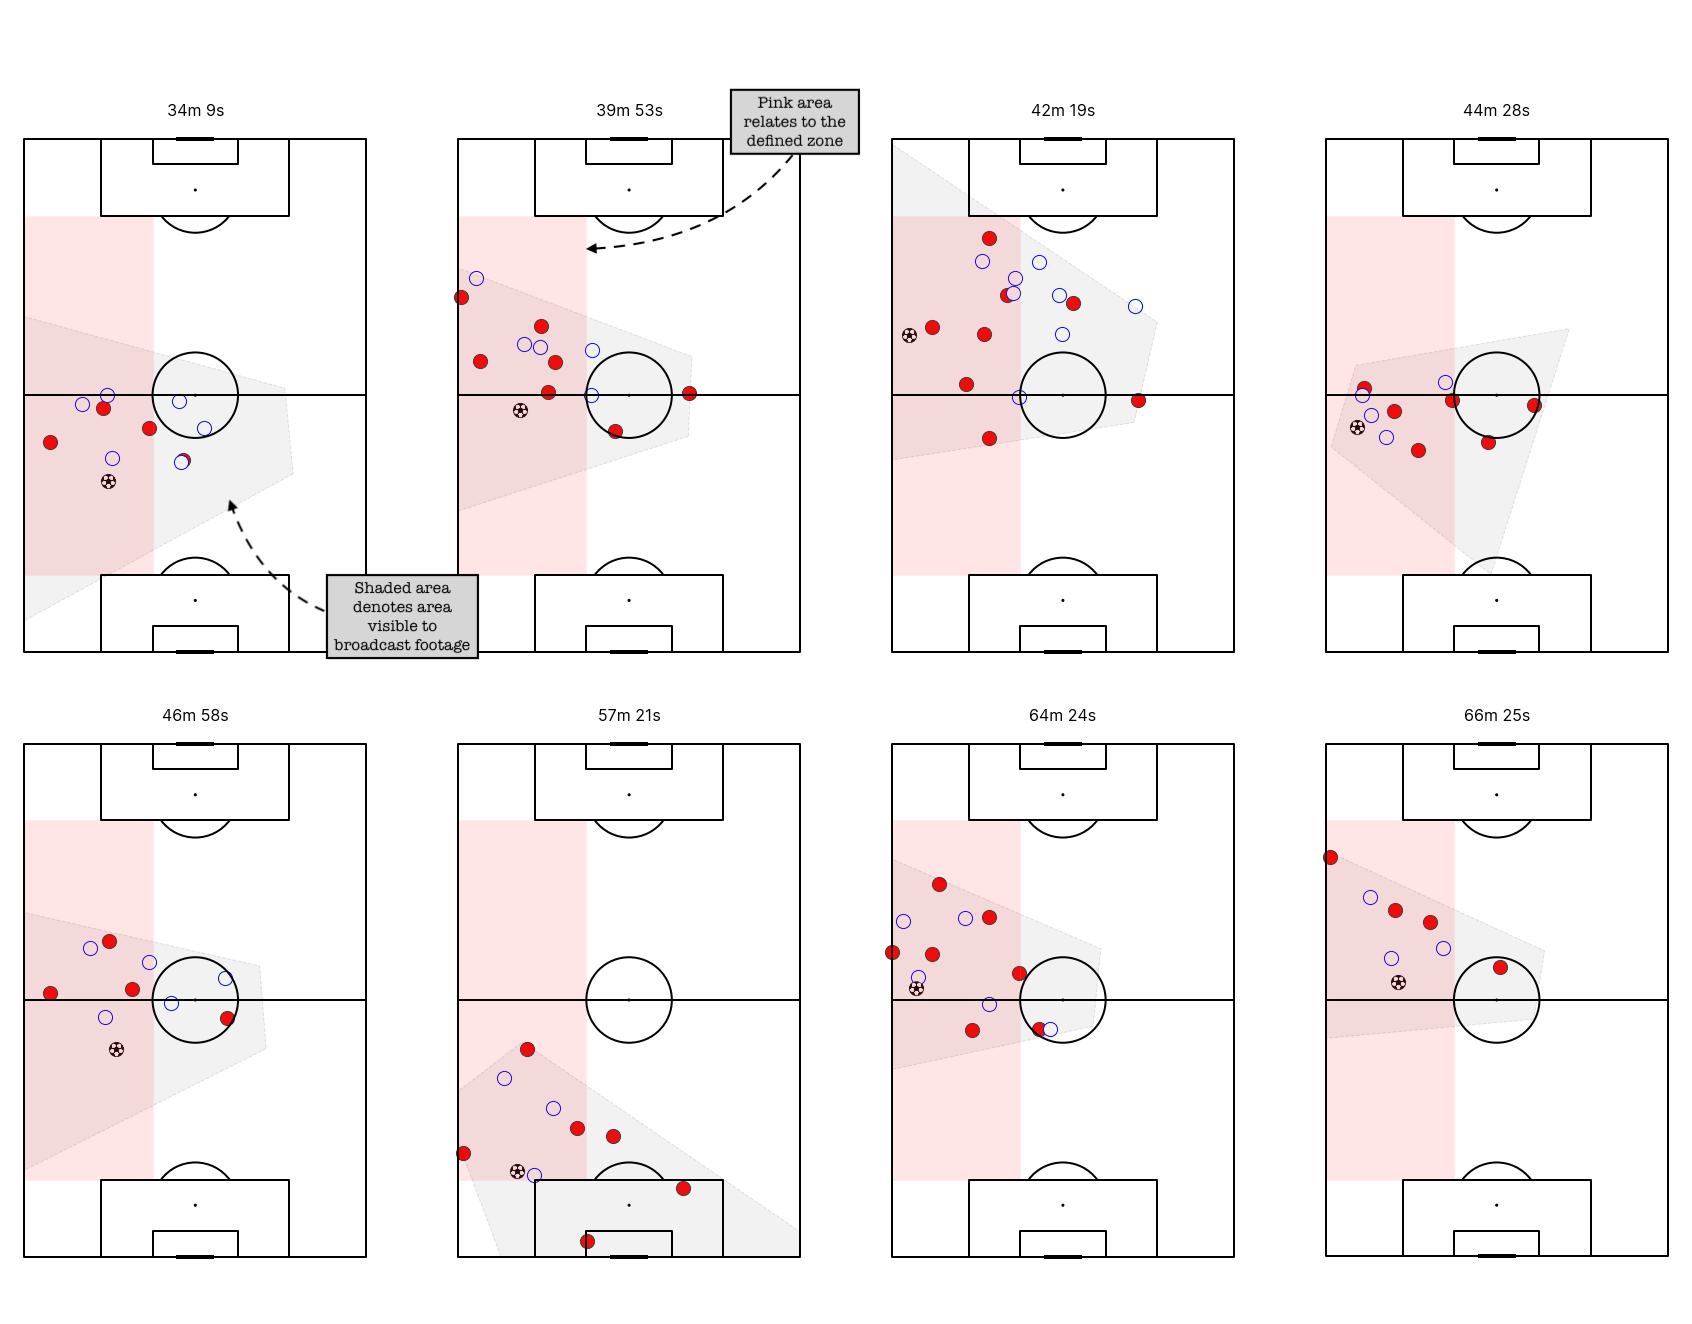
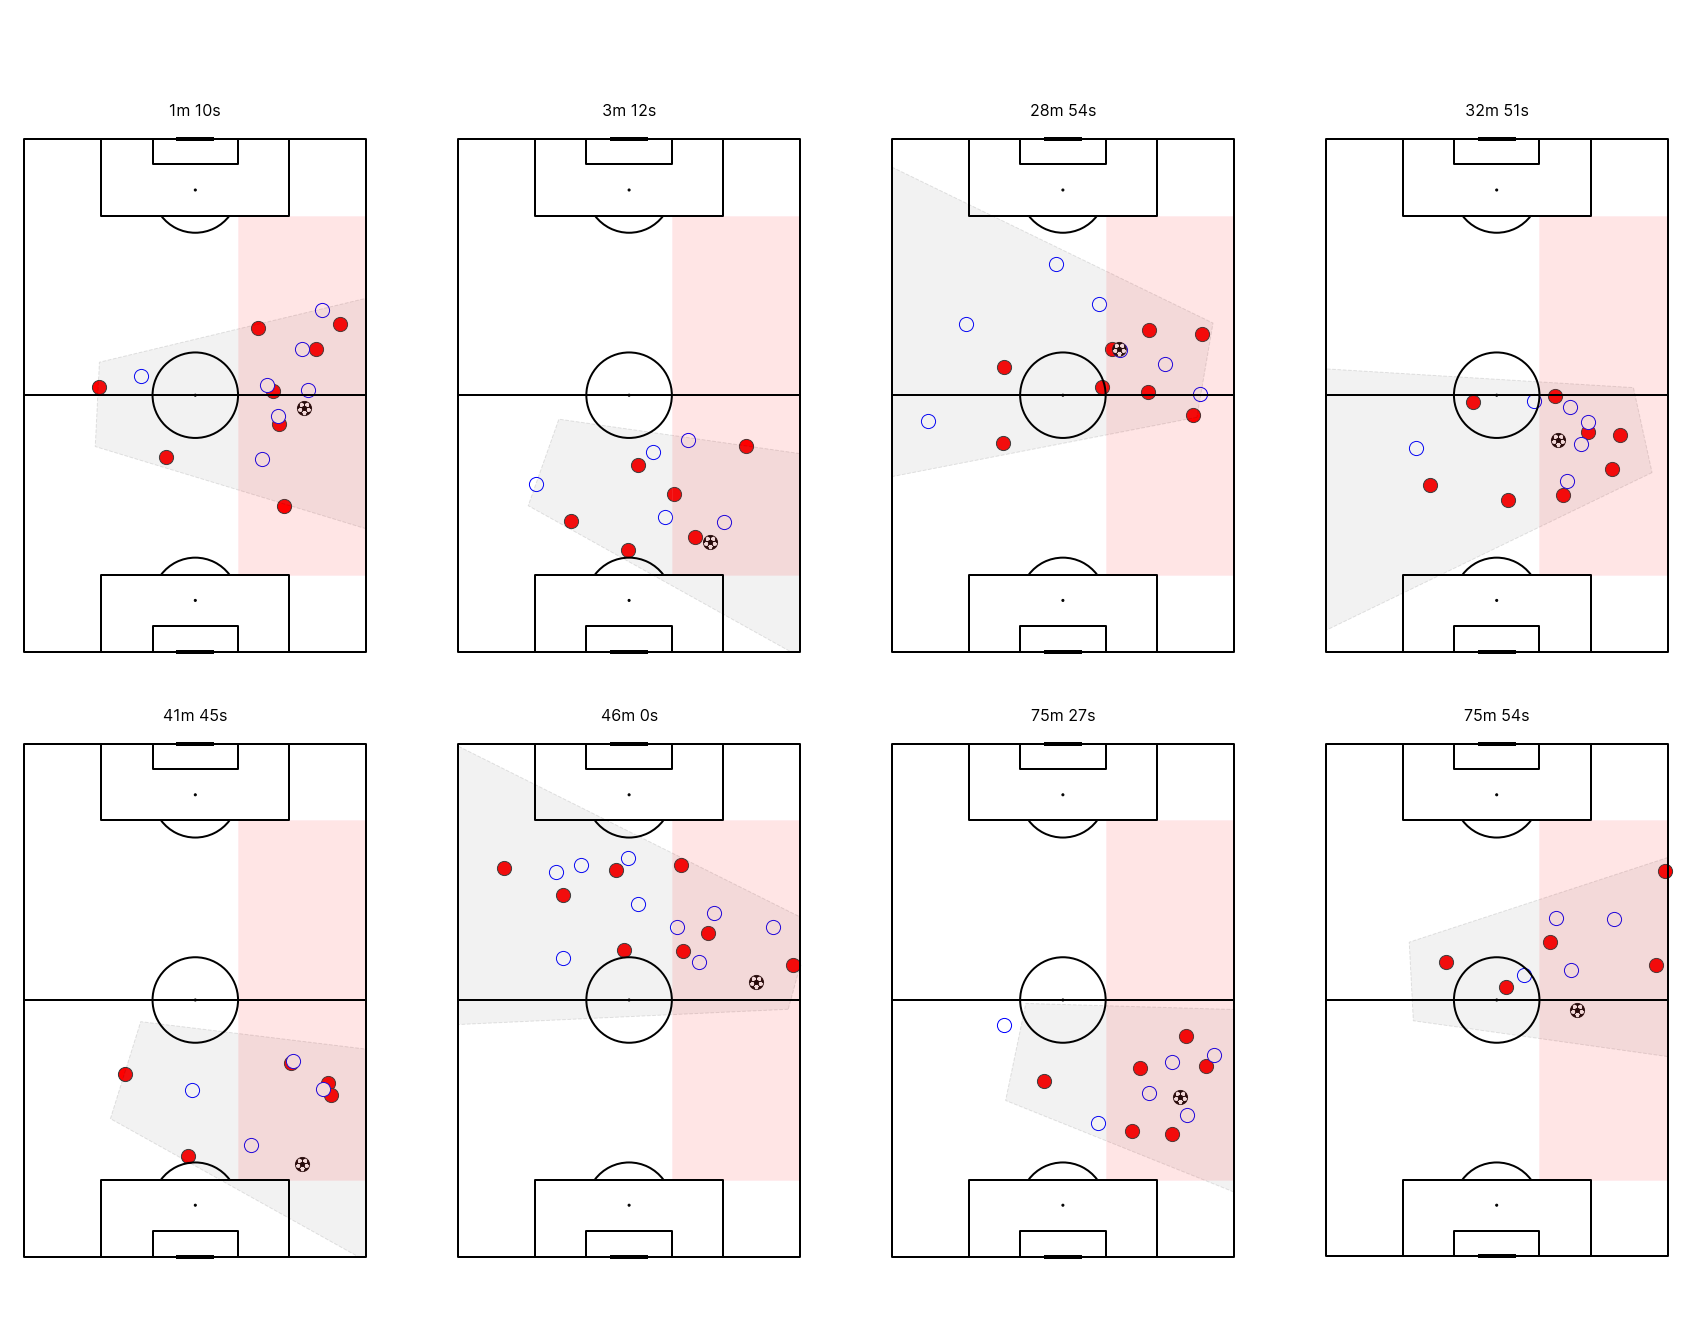
Conceptually you may disagree with the idea that one or two of them should be classed as Attacking Overloads, and there have certainly been some edge cases that I personally haven’t liked when going through this process, but for the most part I’m happy with the results. Especially when aggregated over a significant sample size.
How does this look in practice?
The litmus test for the practice of creating new metrics is whether or not the outputs, in general, correlate with your preconceived notions of a league that your familiar with (or group of players in the case of player metrics - typical that’s been a question of “Does Messi come out on top?”).
So let’s take a look at Attacking Overloads for the Premier League 23/24 season so far.
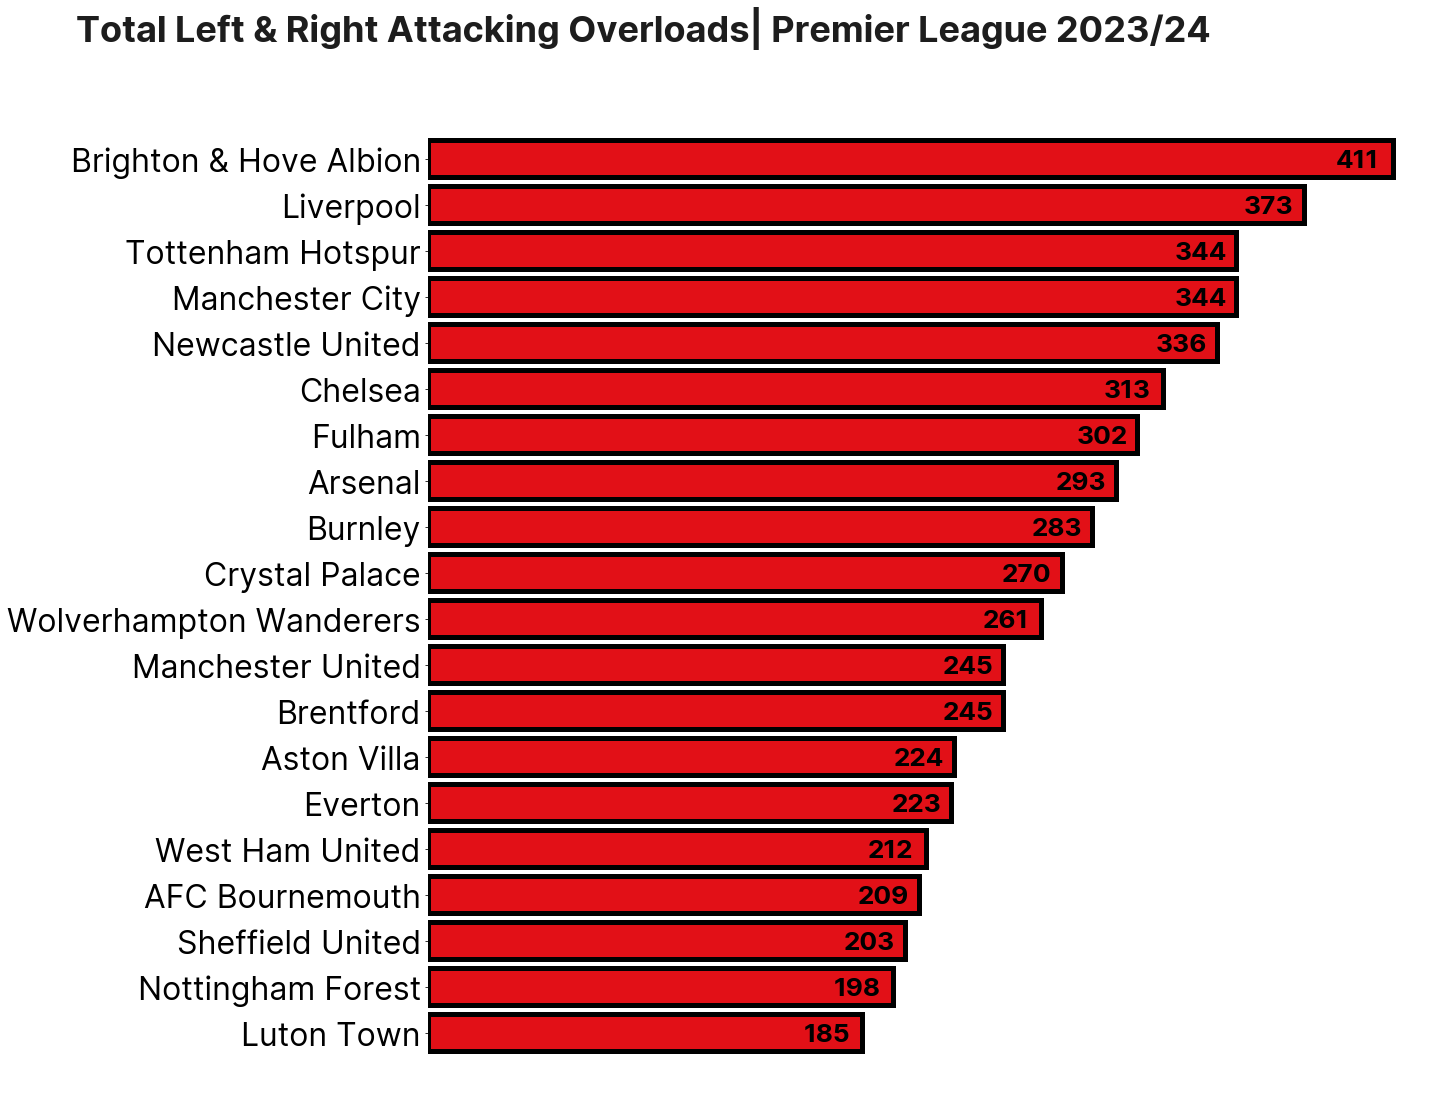
For the large part, I’m pretty happy with this. Teams that I expect to be toward the top of this list are there, and vice versa.
However… there is also an element of this simply picking out high possession teams. By the very nature of the way that I have defined an Attacking Overload, teams that have more possession will tend to have more of them - often by design but also on occasion by accident.
So if we want to identify teams that are particularly good at generating Attacking Overloads, relative to the amount of possession they have, we need to make some sort of possession adjustment. The methods that you can use here are numerous and possession adjustment in itself requires a blog post (or 10x) of its own. For the purposes of this exercise I’ve opted for a relatively simple method - that is, Attacking Overloads per zone possession. So, for example, if we have 20 possessions that include a pass originating in the left zone and one left side Attacking Overload we have a value of 0.05 Attacking Overloads per zone possession.
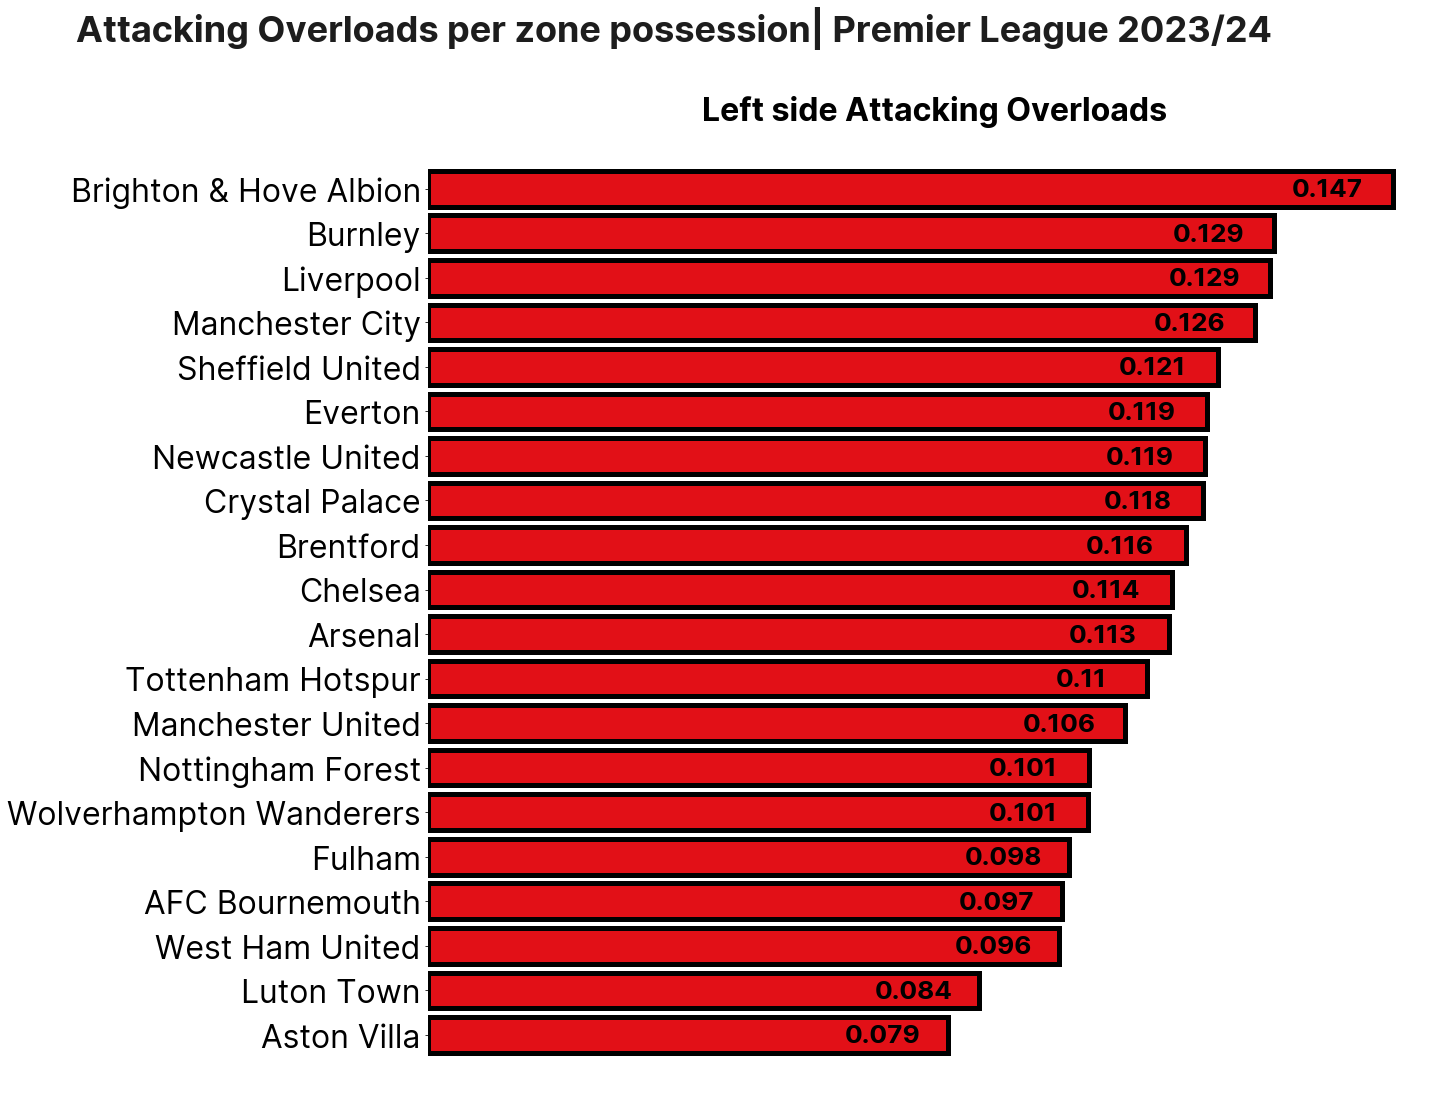
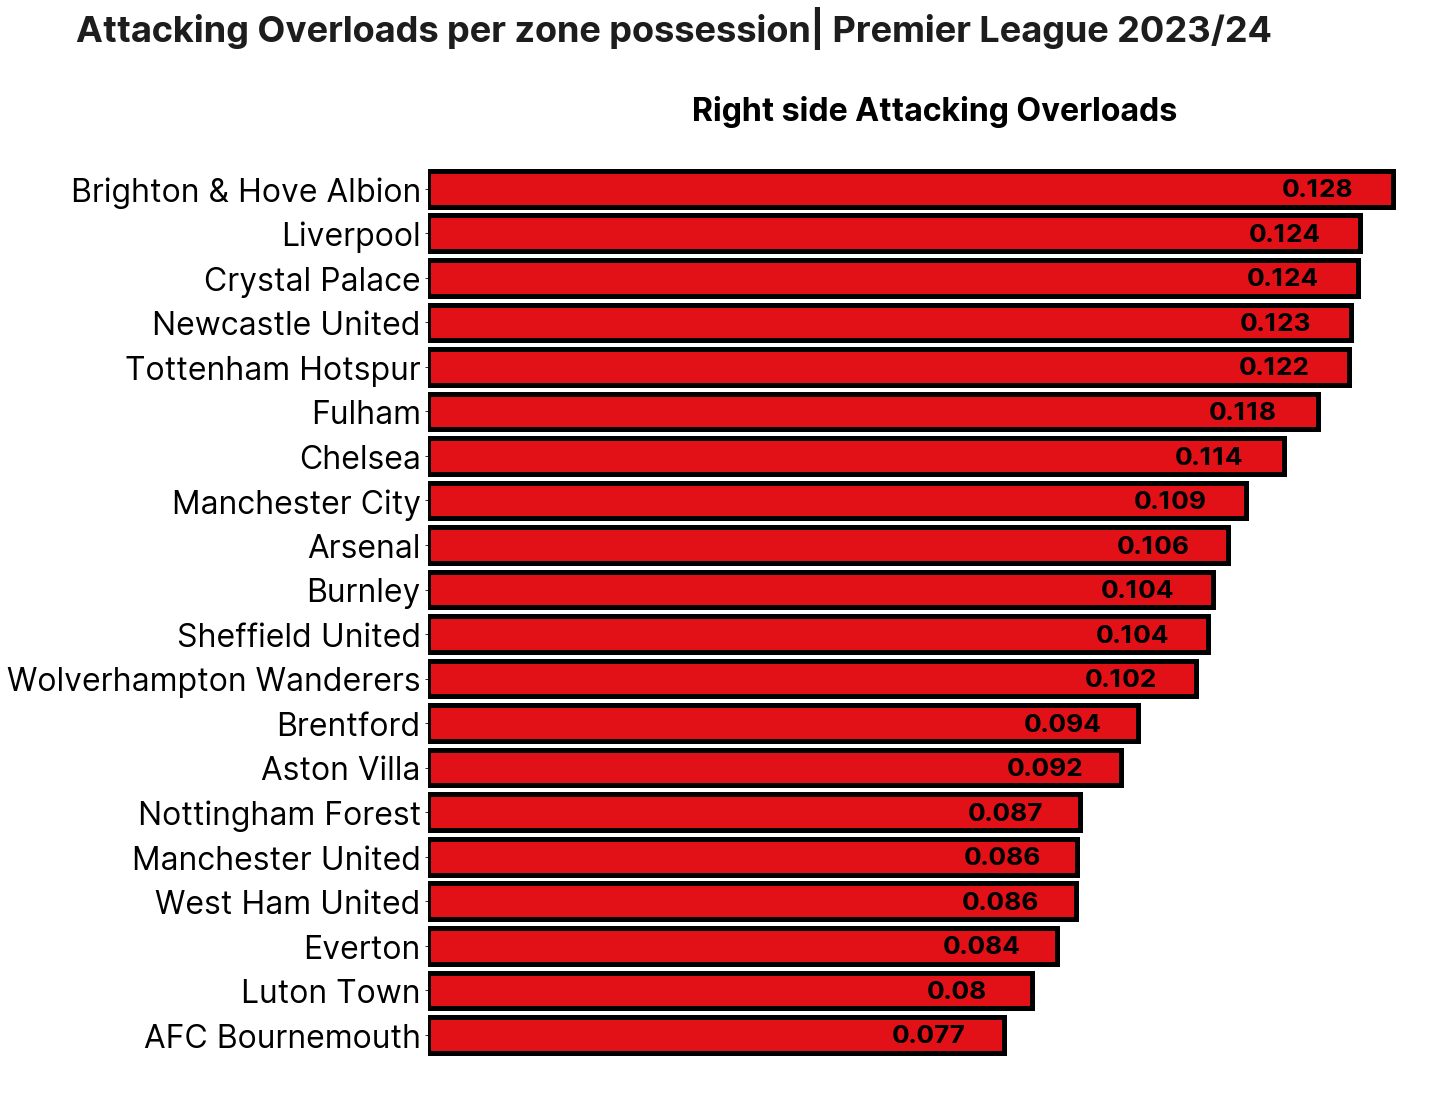
At this point there’s maybe one or two teams that are slightly surprising, but again we’ve got most of the teams that we’d expect toward the top end, and for those that you’d class as unexpected, you can make logical arguments for them being there. For example, we know that Burnley under Vincent Kompany are a team that likes to build from the back and manipulate the opposition.
So you’ve identified an overload. Now what?
Identifying overloads is one thing, and knowing how often you’re creating them can be informative, but in isolation there’s a bit of a “so what?” element to them. What we really want to know is “do the overloads that are being created have an impact on the outcome of the game?”.
One way of answering that question is to look at what happens within the same possession sequence or within a specified period of time after the overload has been created. We can look at any number of subsequent actions - final 3rd entries, penalty box entries, switches of play, goals, xG, etc, etc. - and ask how often they follow an Attacking Overload.
By way of example I’ve chosen to look at shots that are taken within 20 seconds of an overload being created. The plot below shows the number of shots within 20 seconds as a ratio of the number of Attacking Overloads created.
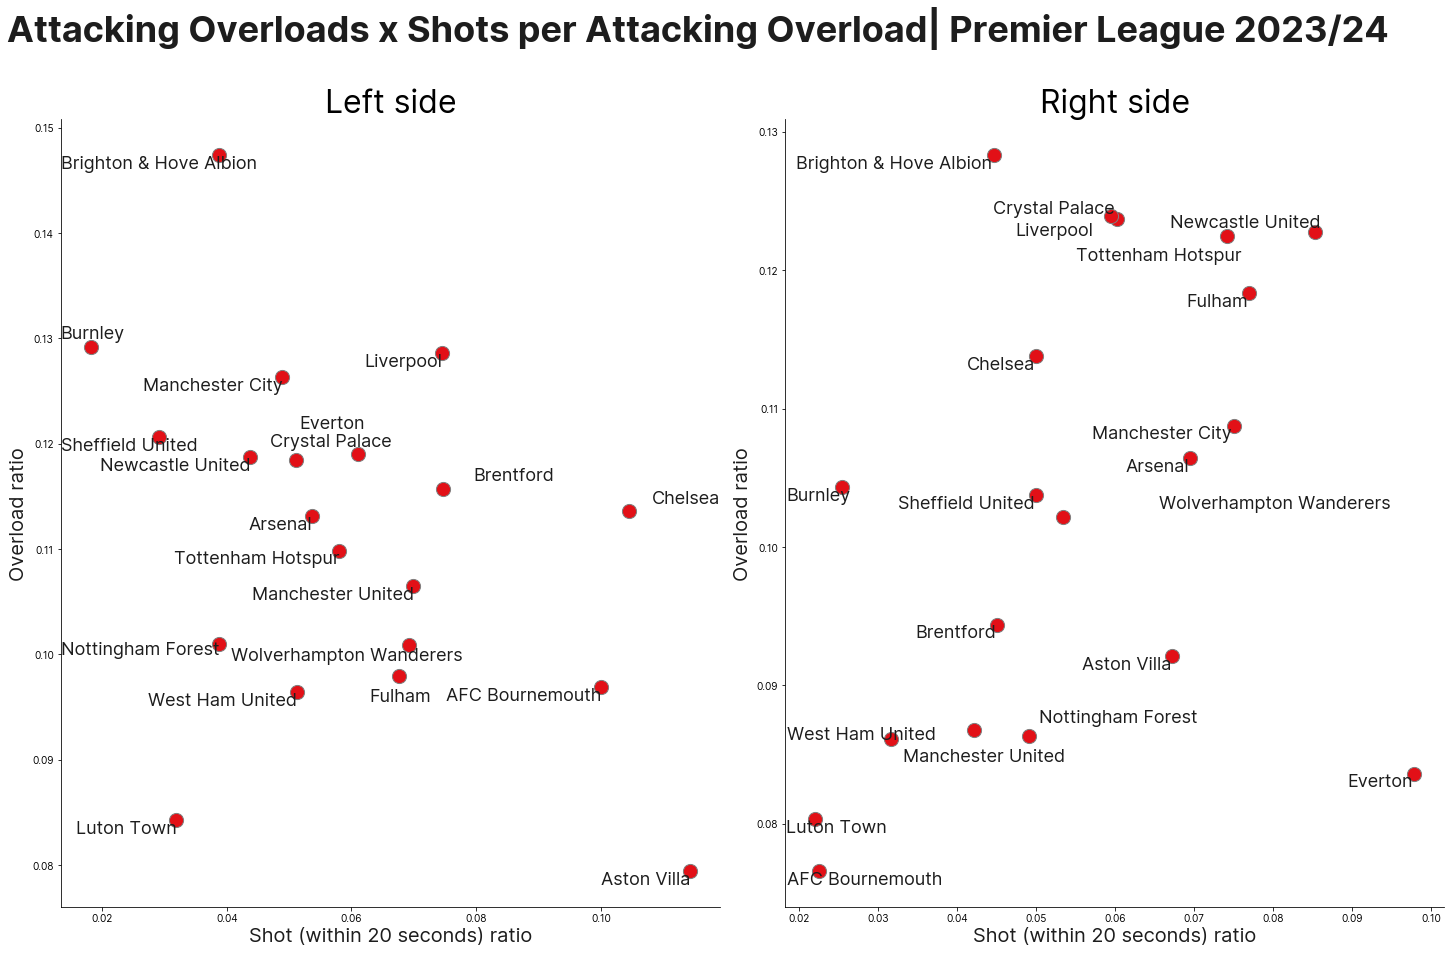
Now we can start to see some interesting narratives. We already know that Brighton are extremely good at creating Attacking Overloads, but we can now see that they are fairly inefficient at fashioning shots on goal from them (or at least they are within the 20s boundary that I have enforced). By contrast, Aston Villa don’t create many overloads, but when they do so they are very good at generating chances within 20 seconds (particularly on the left).
Newcastle, on the right, are both effective at creating overloads and making the most of them, Spurs could be categorised similarly. Whereas Luton are neither good at creating them, nor generating chances when they do so, on either side.
Conclusion
In the Xavi interview that I alluded to at the beginning of this piece the Spaniard also notes “I understand there are many methodologies, many ideas of play and I respect them. But I think I have more fun having the ball.”
Although an infinitely more nerdy setting, creating your own bespoke metrics can be much the same. Especially within the confounds of a fairly ambiguous concept such as Attacking Overloads.
You may disagree with some of the framework that I’ve set out above. That’s okay, I’m not offended. But hopefully there’s something in the thought process and methodology that you can take away and apply to identify and monitor your own KPIs.