Inherently, football has always been measured. The very nature of the sport is to measure which team scored more goals than the other and assign a points-based reward based on outscoring the opponent. We’ve always measured goals, but then we started measuring shots, and then we started measuring the quality of those shots with Expected Goals. But given just how little of football is shots – less than 1% of all actions on the pitch – there’s a whole bunch of football in the middle going unmeasured.
With the advent of advanced analysis quickly disappearing in the rear-view mirror as more and more teams adopt data into their day-to-day, analytics has finally reached the point of measuring what goes on between both boxes. Possession State Value (PSV) models were born, and we’d like to give a particularly warm welcome to ours and what we believe is a tangible (and importantly, measurable) upgrade on what has come before.
Let us introduce you to On-Ball Value.
StatsBomb customers already have access to the data and are implementing it into their performance and recruitment analysis. A white paper was sent out alongside the model’s release into SBData to explain the methodology and design decisions of the model, and we’re excited to now release details of On-Ball Value (OBV) into the public domain. There’ll be two parts to this introduction: next week we’ll chop and slice the data to show how to use it in the football world, but there’s an important question to answer in today’s piece – what is OBV?
The premise of PSV models is to objectively and quantitatively measure the value of each event on the pitch. You can do this by assessing the change in probability of a team scoring and conceding as a direct result of the event. You don’t need us to tell you that passes that move the ball closer to the opponent’s goal have a higher value towards increasing the probability of a team scoring compared to passes that move the ball away from the opponent’s goal. Equally, turnovers closer to a team’s own goal have a greater negative impact on said team’s likelihood of conceding compared to turnovers at the attacking end of the pitch.
In summary, there are two key benefits to PSV models that other common measures of build-up play – such as assists, xG Assisted, and xGBuildup – are unable to adequately account for:
a) An ability to differentiate between the value of different passes or actions within a possession chain that leads to a goal. That is to say, being able to accurately identify the actions that were more important towards the creation of a chance, and awarding them greater credit than actions identified to be less important.
b) An appropriate consideration of the opportunity cost of attempting high-risk actions and losing the ball. High-risk, high-reward players that are often key attackers on their team will be recognised and credited in this model – so long as the effect of their actions is a net benefit to the team overall.
There are several possession state value models out there, with the first known iteration (publicly at least) that of Sarah Rudd’s back in 2012, though it is worth mentioning that Charles Reep in 1997 developed a seminal model that could be considered a PSV model of sorts. The back catalogue of work is vast and to be applauded for moving football analysis forward. But work is there to be built and improved on – there are numerous reasons why we believe our methodology is an upgrade on what has come before.
The key merits of OBV’s approach are:
- The model is trained on StatsBomb xG. Many other models train directly on goals, but using xG to estimate the goals scored from each possession allows us to train models more accurately with the same amount of data by reducing the variance and class imbalance of purely goals scored or conceded. There are other PSV models out there known to be using xG, but our approach should be an improvement due to the xG model used, considering the shot freeze frames feature of StatsBomb xG and that it’s known as the most performant xG model available.
- We opted to train two separate models for the Goals For and Goals Against components of possession value, an approach unlike most others. This allows us to track each event’s impact on the team’s chances of scoring or conceding separately to resolve between the attacking and defensive contributions of each action, instead of just net Goal Difference (GD).
- We have chosen to not credit pass recipients. While there can be some value to receiving the ball and holding up play, most of that benefit comes from the movement of players off the ball. This is very challenging to quantify with event-level data. From the perspective of the ball location and event data, there is no intrinsic value to receiving a ball. If players go on to lose the ball every time they receive it, the outcome is largely indistinguishable from the players not receiving it in the first place, which indicates that the ball receipt itself does not add value. However, players that are able to put themselves in good positions to receive the ball give themselves an opportunity to follow that up with an action. Players that are good at receiving the ball are therefore rewarded (or penalised) indirectly based on the outcome of the subsequent event, which would not have occurred if the player had not successfully received the ball.
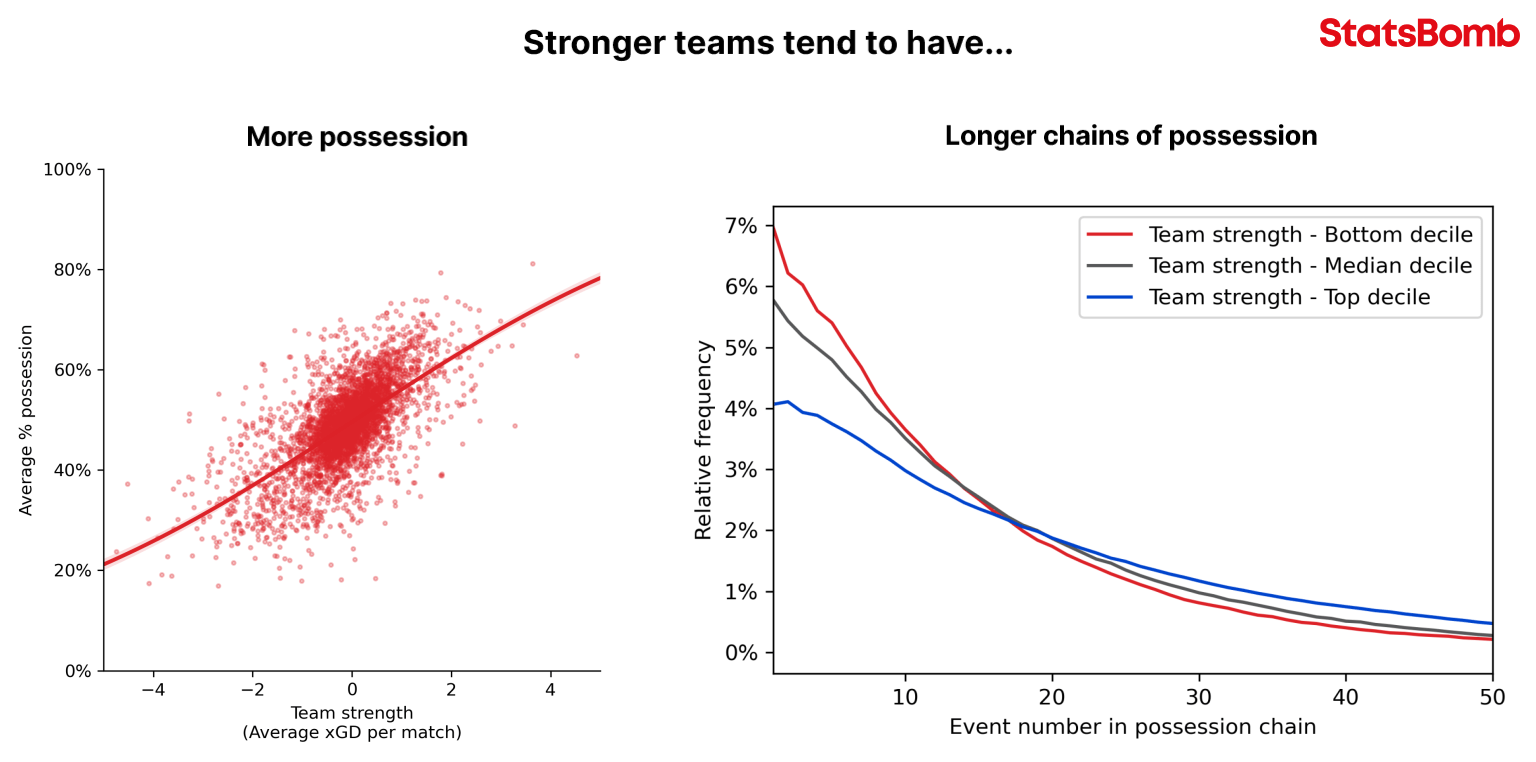
- Possession state features. We have chosen to include features describing the pitch location (x and y coordinates, distance to goal, angle to goal), action context (set play, open play, etc.), whether the event was carried out while pressured from an opposition player (as can only be done with StatsBomb Data), and body part used for the event (Head, Foot, etc.). We actively decided to not include “possession history” features, such as details of the previous events in the possession, as a proxy for likely opposition defensive structure, as some similar models have opted to do. It would be desirable for these variables to act as proxies for the availability and location of teammates as well as the positioning of the opponent but, in practice, many possession history features correlate strongly with other factors such as team play style and, more importantly, team strength. To give one example, other models overvalue passes made in longer possession chains, as stronger teams typically (and demonstrably) have longer chains of possession than teams of weaker strength. Our approach ensures that each event is valued independently of team strength.
Our white paper expanded on the latter, with average possession length correlating with team strength, as shown here:
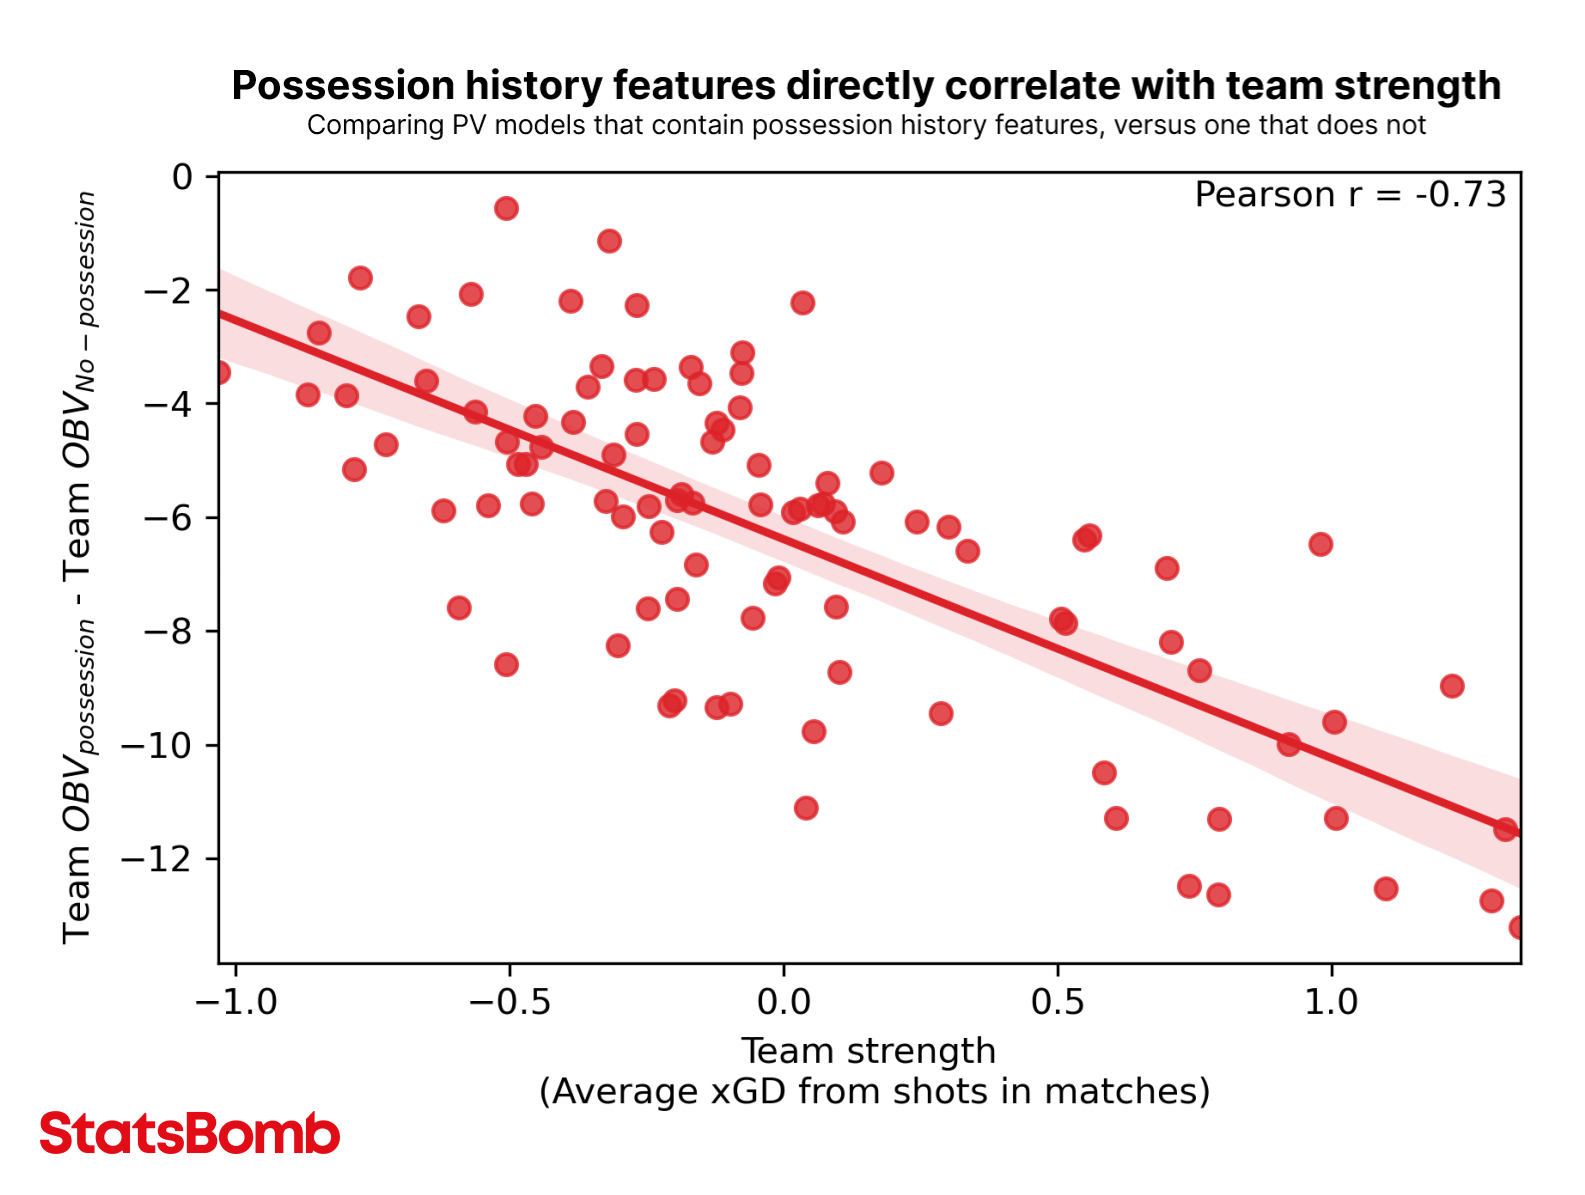
Also included in the white paper was the impact of including possession history features on the OBV model. If we evaluate all events at a team level using a model with possession history features and a model without possession history features, we see that there’s a difference in how the models value actions. And we can see that this difference directly correlates with team strength:
Our explainer video details how the model works with some practical examples:
Ok, enough words. You want proof and you want numbers. Here are the top 20 player seasons ranked by OBV in the Big 5 European leagues since 2016/17.
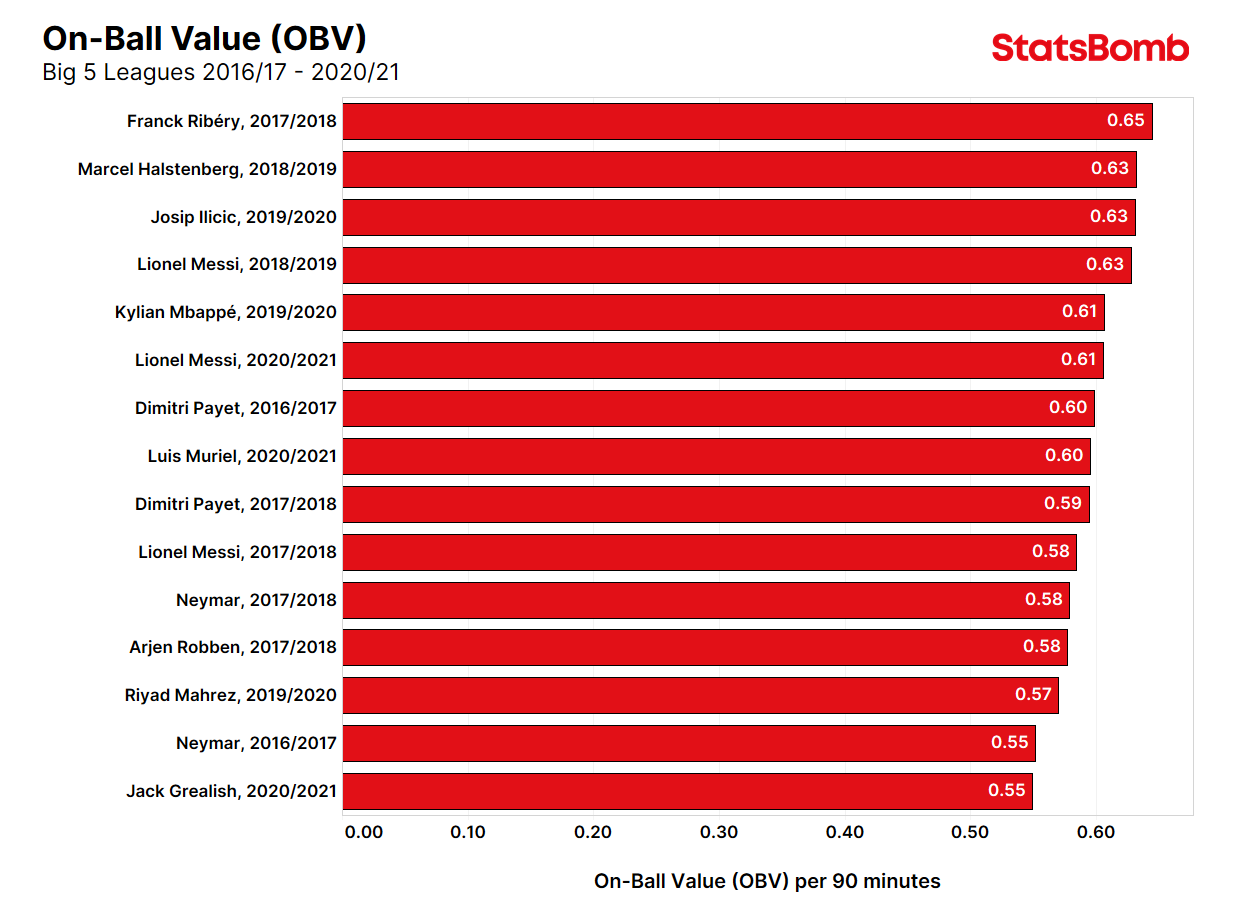
Three Lionel Messi seasons on the list? Seems about right.
But that’s just the overall score. We can be more granular if we want and split the data by numerous variables. As an example, here are the top 15 players by OBV for carries and dribbles in the Big 5 in the 2020/21 season:
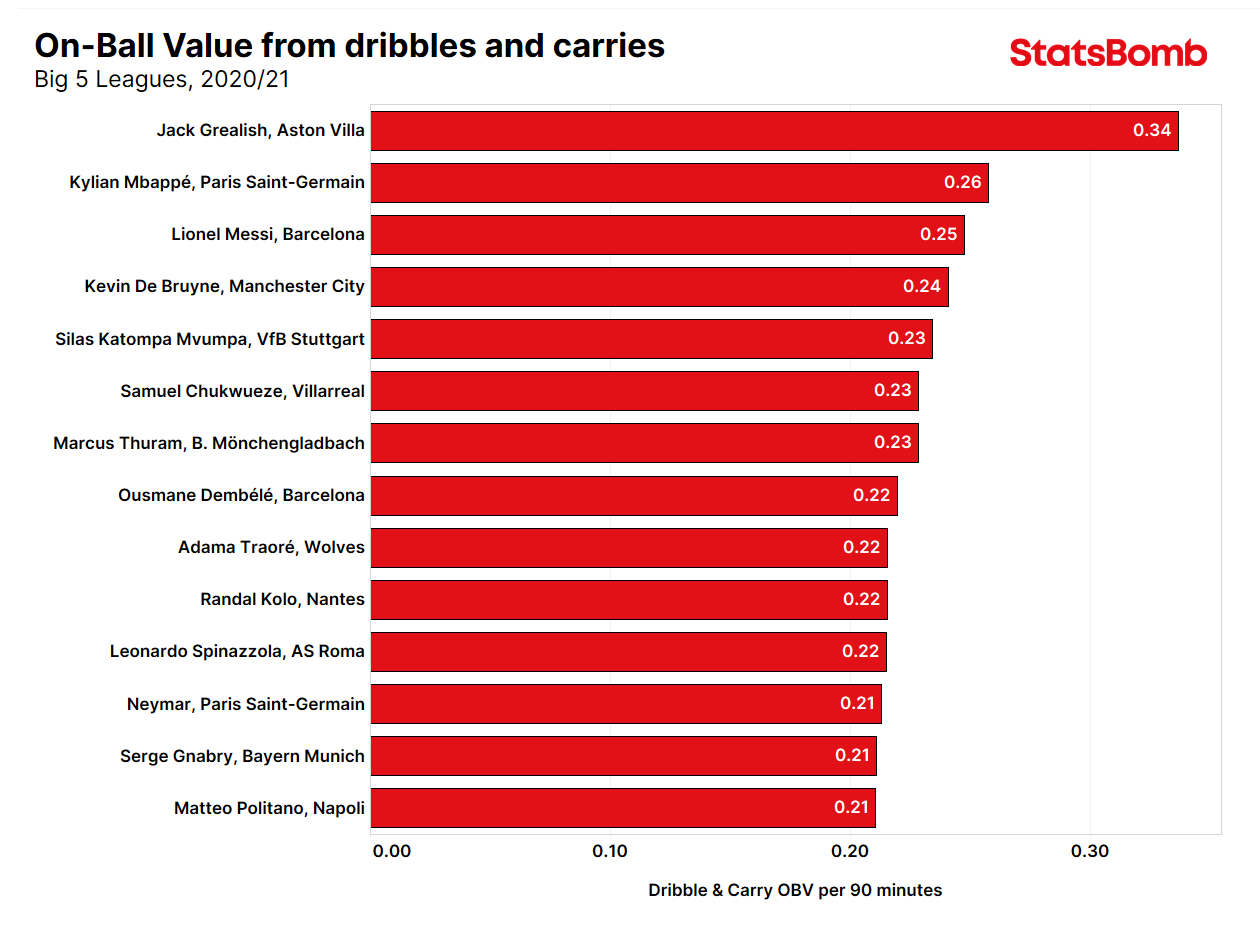
The list more or less stacks up with players we know to be good dribblers. But where before we judged this by looking at the volume and success rate of attempted dribbles, we can now assign credit based on whether the dribbles are moving the ball to high-value areas of the pitch or not. A dribble that carries the ball from the touchline to the edge of the six-yard box will be credited more highly than one that is less penetrative.
The best news is: this state-of-the-art data science is being delivered to customers at all levels of the game, from the Champions League down to the English League Two, and is included in the data for the 80+ competitions that we cover. Not all teams have the budget or the time to attempt to develop models of this sophistication, and that’s why we exist: we care about our customers’ success and and we deliver the tools to achieve this by developing best-in-industry products.
There’s plenty we can do with the new method we have to evaluate players. We can break it up by the type of event (Dribble, Pass, Shot, etc.), we can filter it by position (to compare players in each position against each other), or even analyse it on a team level to quickly evaluate how teams are generating their OBV value on the pitch, i.e. which types of passes are providing the most value? Which areas on the pitch are they creating the most OBV from?
Defending and Goalkeeping actions are also included in the model. Defenders can be judged based on the value of their defensive actions–most likely in preventing a goal being scored as judged by the Goal Conceded part of the model–but some defensive actions higher up the field could add value by making their team more likely to score, and the player will be credited as such. Goalkeepers are arguably the most important players in preventing their team from conceding goals, and OBV measures the impact that their goalkeeping actions (saves, claims, etc) and sweeping actions have on stopping the opposition from scoring, whilst also measuring whether their passing range and distribution is adding value to their team’s likelihood of scoring or not.
The second instalment of our Introduction to On-Ball Value will look into these things and more, so you can see the model in action and how it can provide value to clubs, scouts, and analysts. This will be released next week.
Finally, we want to close by acknowledging the hard work of the data science team at StatsBomb in developing and delivering this model. Not just for creating a possession state value model that is tangibly and measurably better than the competition (details included in the customer white paper), but also because this is the first of a BUNCH of upgrades that are coming off the conveyor belt at the moment.
Stay tuned for more.
StatsBomb