In my end of season Liverpool review I used some stats that showed Liverpool hadn’t actually taken any more shots from Fast Breaks than they had in the previous season. No doubt, anyone that watched much of Liverpool would point to the lightning fast breaks that Sturridge, Sterling and Suarez seemed to mount on a regular basis.
It is for this reason that I qualified the assertion that they didn’t create more Fast Break chances in this past season by saying that this conclusion was based on the Opta definition of Fast Break. I don’t think Opta publish their definition of Fast Break, so it is conceivable that their definition of a Fast Break is quite narrow, and so many of Liverpool’s attacks, whilst fast, may not have tripped the Opta Fast Break qualifier.
I did say in the Liverpool review article that I would like to take another look at this subject and as StatsBomb now has access to several seasons of Opta's most detailed on the ball data I’m now in a position to look beyond just the Opta definition of Fast Break, and perform some advanced analysis on the speed that teams attacked with.
Does Speed of Attack matter?
It certainly seems intuitive that having fast attacks should be a great way to launch efficient attacking moves. The attacking team has the chance to drive forward against an opposition that doesn’t have time to set itself or possibly has gaps in its otherwise well drilled defensive shape. Contrast that with a slow, laboured approach and the barriers that such pedestrian attacks must overcome to score. Of course the highly technical teams, such as Barcelona in their tika taka prime, have players that can retain possession long enough to eventually force the opposition to make a mistake. But this tends not to be the attacking type of choice for most of the world’s football teams.
So, although faster attacking moves would seem to be a more efficient way of scoring than slower moves let’s first establish some baseline numbers.
I have set out detailed methodology at the bottom of this article for the techniques that I used, but in summary I generated a metric for speed of attack (in metres per second, or m/s) for every shot in the Barclays Premier League over the last 4 seasons (from 10/11 to 13/14).
To start off, I simply sorted the data set by the Speed of Attack and divided the data into two groups at the median Speed of Attack value (2.684m/s) – this gave me two groups with an equal number of shots in each.
In this case, it is reassuring to see that the numbers back up the widely held assumption that attacking with speed and purpose is much more likely to lead to a goal than the shots that result from very slow attacks. Due to the large sample sizes the difference in conversion rates between the two groups are significant from a statistical point of view, with a p-value of <0.00001. Thus, we can confidently conclude that there is an advantage in having shots from fast attacks in comparison to slow attacking moves. Ok, so that’s not ground breaking but we needed to stick some foundation pegs in the ground.
Deciles
If we divide the data sample into more groups does the relationship of faster attacks equalling higher conversion rates still hold?
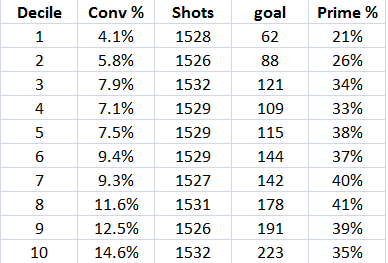
To answer this question I divided the data set into deciles, with each decile containing just over 1,500 shots. The summary information for each decile can be seen in the table below:
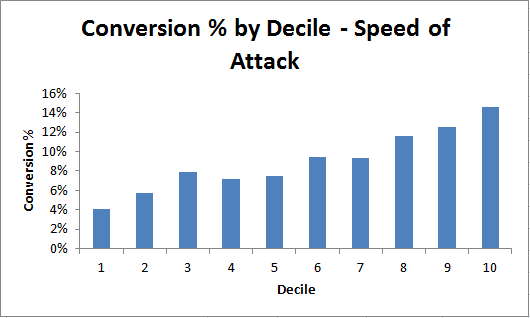
…and in graph format we can see the very strong correlation with the shot conversion rate increasing almost in line with the step up in decile number.
I appreciate that I have only plotted 10 data points in this chart but we can see that there is a very good, uniform correlation between the speed of the attack and the conversion rate of the shots coming from those attacks.
Shot Location vs Speed of Attack
I think it’s worth looking at some of the above figures in detail; specifically how the conversion rate changes depending on the decile of Speed of Attack and how that in turn relates to shot location.
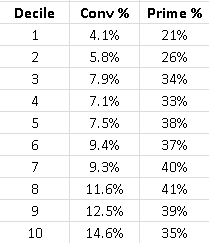
This table plots the conversion rate for shots for each decile as well as the proportion of shots that were taken from the area that I term as the Prime Zone, ie the central portion of the penalty area.
At this stage, I imagine that everyone is aware that shot location should be taken into account when evaluating how the raw shot numbers translate into shot quality. However, the above table is super important as it seems to suggest that the Speed of Attack may actually be even more important than the location of the shot.
It can be seen that the two groups with the fastest attacks (Deciles 9 and 10) had the best conversion rates. Groups 7 and 8 had a higher proportion of shots in the Prime Zone yet had a slightly lower conversion rate than 9 and 10.
Generally, the shot location correlates well with the Speed of Attack, in that the very slowest attacks also tended to have the shots from the worst locations. This will be partly due to the fact that the slow, or even backwards in some cases, attacks will have allowed the defence to get set and force the attacking team to shoot from bad locations. Possibly a little out of necessity and a little out of sheer frustration.
However, the key takeaway here is that the swiftest attacks can overcome any potential advantage that working the ball into the best locations might bring. Of course, in many instances these two aspects will be intertwined as it will be easier to get into Prime locations from faster attacks than it is from slower attacks.
In Speed of Attack we have a metric that rivals, and perhaps even bests, shot location in terms of its impact on a shot resulting in a goal.
2013 Premier League
As well as calculating the speed of each attack I’ve also been able to count the number of touches (attacking events) that Opta assigned to each attacking move prior to the shot. This information can be used to provide an objective measure of how direct each team’s attacks were on average last season.
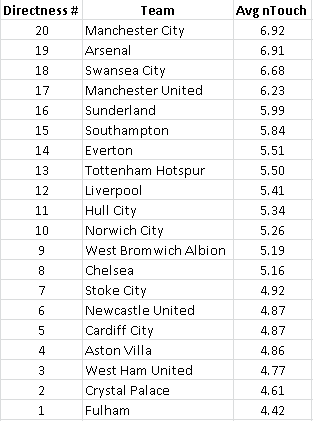
Directness of Attack This table includes the shots from my filtered down data set (see the Methodology piece at the bottom of this article), but in summary it includes any attacking moves that started in open play and seen at least 2 attacking events occur before the shot. It shows the average touches that each team took in their attacking moves prior to the shot.
It’s always comforting when a list of numbers that is calculated in a scientific method passes the eye test, and this table has achieved that. The teams at the zenith of this table are certainly the teams that are happiest when in control of the ball; Man City, Arsenal and Southampton.
Sunderland
It may be surprising to see Sunderland appear so highly up the average number of touches table, as in general, weaker teams tend to play a more direct style of football. However, Sunderland’s rank should come as no surprise to those who know their manager Gus Poyet. In fact, last November he pleaded for patience from their fans as he said:
I want the team to learn to be calmer, to pass the ball better. It is going to take time to get this way of football going but trust me, the fans will like it in the end.
Not only was Poyet successful in keeping the Black Cats in the Premier League this season, but he also succeeded in changing the way that his team played. Sunderland’s average touches per shot of 5.99 this season compares very favourably with the figures of 4.30, 4.46 and 4.53 recorded respectively in each of the three previous seasons. As can be seen from the above table, the jump from an average of 4.4 touches per shot to 6 is substantial and requires an entirely different playing style. Poyet deserves a large amount of credit for successfully pulling off such a transformation.
Most Direct Teams
At the other end of the table we see the very direct teams. This group includes Fulham, Crystal Palace, West Ham and Aston Villa; none of whom seem out of place in these positions. On the other hand, Chelsea’s place in this table sticks out with them being the 8th most direct team, yet they are undoubtedly one of the three best teams in the league. The Blues differ from the other top teams as they are extremely comfortable without the ball and are happy to sit back, soak up pressure and hit teams on the counter attack.
All in all, the simple measure of the average number of attacking events prior to each shot seems to objectively encapsulate the various playing styles of each of the teams in the Premier League.
Speed of Attack
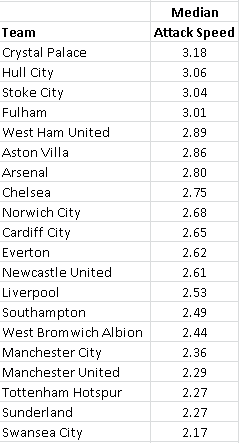
Don't worry, I haven't forgotten that this article is supposed to be about the speed that teams attack with. To keep things simple to start, I calculated the median Speed of Attack for each team (in m/s).
However, using this method causes a problem which can clearly be seen when I plot the average touches per attacking move with the median Speed of Attack.
Apart from a few noticeable exceptions, namely Hull, Man City and Arsenal we can see that there is a very strong correlation between the two measures. This is entirely understandable as effectively we are plotting the average Speed of Attack against the average number of touches in the attack and thus we would expect a strong negative correlation, which can be clearly seen. It is apparent that we need a slightly different measure.
Although it is interesting to see the average (or median to be correct) Speed of Attack of each team, this metric isn’t what I set out to investigate as the median number will be compressed due to its nature. It is entirely feasible that a team (such as Liverpool) could have an average attacking speed of x m/s, but a chunk of their attacks are substantially faster than that. It is the ability of a team being able to mount fast attacks that I set out to measure.
The method I finally settled on was to look at the Speed of Attack for each team’s 95th and 90th percentile for Speed of Attack. I used a percentile basis instead of simply looking at the speed of the (for example) 10th or 25th fastest attack for each team as the teams that took relatively few shots would be at a disadvantage. The teams that took more shots would be expected to have a greater diversity in their Speed of Attacks, ie more very fast and very slow attacks.
95th Percentile
The following table shows the attacking speed of each team’s 95th percentile, ie each team had 95% of their attacks slower than their respective values in this table:
It will probably surprise most readers of this article to learn that, when looking at the speed of the fastest 5% of each teams’ attacks, Hull City emerged as the Premier League team that had the fastest attacks. It’s important to note that The Tigers haven’t got to that position just by playing long balls, unlike say, West Ham who also appear towards the top of the table. In the table I included above we observed that Hull were in the middle of the pack in terms of how directly they tended to play.
Although we have seen that Arsenal take a lot of touches per attacking move, it is clear that they can occasionally launch very quick attacks, as the speed of their 95th percentile attacking move is almost 7.5m/s.
Needless to say, I am somewhat surprised to see Liverpool only appear in 7th place on this measure.
At the foot of the table, it appears that Swansea take their passing methodology and desire to retain the ball to an extreme. The pace of their 95th percentile attack is decidedly pedestrian (remember 95% of their shots are from attacks that are slower than this value) when compared to the other Premier League teams. I would suggest that the ability to mix up their tactics and introduce some pace, a la Arsenal, should be high on Gary Monk’s “To Do List” next season.
The above table provides yet another reason why Man United struggled under David Moyes last season. His team simply seemed incapable of attacking with pace.
90th Percentile
In this next table I looked at the speed of the 90th percentile attack of each team, ie 90% of each team’s attacks were slower than this rate:
As with the 95th percentile table, Hull had the fastest attacks on this measure – this shows that they didn’t just have a very few fast attacks, but were able to maintain a fast attacking tempo fairly consistently. In doing this, they achieved what Arsenal was unable to do, as the Gunners slid down this table compared to the 95th percentile one.
We can see the teams that tend to play in a more direct fashion rise up this table. This is to be expected as we move towards the median speed of attack that we observed earlier in this article.
Liverpool
Once again, Liverpool is ranked right in the middle of the table. Despite what our memories and recall told us about Liverpool’s attacks last season, it does indeed look like I arrive at the same conclusion as I did in my end of season review. It appears that The Reds were not attacking faster than they were the previous season. The number of Fast Breaks as defined by Opta suggested this, and after looking at the speed of each individual attack I am not finding any evidence to contradict this assertion. I would guess that the terrific success rate that Liverpool enjoyed on their Fast Breaks this season, where they converted 33% of such attacks, has meant that subconsciously we remembered a lot more of their fast attacks than we did for other teams.
Hull
When I first planned the mechanics behind this article I had assumed that I would have seen Liverpool posting the fastest attacks. However, this was certainly not the case. Instead I was very surprised to see that Hull claimed this accolade, and as stated above, these quick attacking movement numbers don’t seem to have been earned by them playing a very direct style. I’m sure that their numbers are flattered by the fact that they didn’t see very much of the ball or didn’t have a huge number of shots. According to Whoscored, only 5 teams had less possession of the ball than Hull and only 3 teams shot less than they did.
This meant that the environment existed for them to launch fast attacks. However, other teams that ceded possession should also have been in a position to do this, but Hull managed to do it better than everyone else.
I would contend that Hull were arguably unlucky with the outcomes of their fast attacks. They failed to score with their 12 fastest attacks (measure in m/s), and their 13th fastest attack resulted in a goal scored by Jake Livermore which can be seen below. I even think I can offer a suggestion as to why The Tigers drew a blank with the shots that came from their 12 fastest attacks this season – 8 of them fell to either Shane Long or Nikica Jelavic.
Perhaps they need Jake Livermore on the end of a few more of them…… Fast forward to 3:11 in this video to see the perfectly exectuted fast attack. [youtube id="kB0z-30FRfQ" width="633" height="356"]
Speed of Attack Methodology
For each shot, I worked backwards until I reached the start of the possession chain, and I noted the x co-ordinate of the start of the attacking move, the x co-ordinate of the shot position and the time that elapsed between those two events. I was only interested in the speed of the vertical movement of the attack, so I ignored the y co-ordinates for this exercise.
I calculated the vertical distance in metres of the attack with the formula {(shot x – move_start x)*1.05} and then divided that distance by the duration of the attack (in seconds) to give me a metres/second (or m/s) value for each attack.
At this point I should mention that where a shot was the first action of an attacking team in the move, ie from a free kick, a penalty, or scoring directly from an opposition touch that such a shot would not be assigned a speed of attack. Shots from these events were excluded in this study.
It would be unfair to compare attacks from open play with those that originated from a set piece or a goal kick as the latter attacks would generally face a solidly set defence. To combat this I am only looking at attacks where the first event in the move was not one of: goal kick, free kick, throw in or corner kick.
Own Goals were excluded from the data set.
I added two more filters to that data set that could be construed as objective, but I am happy with the rationale for my inclusion of them. The first of these is that I excluded any shots where the move began from a location with an Opta x co-ordinate of less than 17, ie inside the teams’ own 18 yard line. I introduced this to reduce the chances of a goalkeeper kicking a long clearance to his striker who has a shot. I’ve no doubt that such a move would have an exceptionally fast Speed of Attack number, but this tactic isn’t what I’m trying to analyse here.
The final filter that I applied is that an attacking move had to have at least two Opta attacking events before the shot was taken, ie at least two passes or a successful take on and a pass. In reviewing tape of attacks that had just one event preceding the shot many of them came from a defensive header from inside the box or other instances where the defence didn’t really have full control of the ball. The clearances were passed back into the box and a shot was taken. As the attacking sequence was very short, at just a couple of seconds, these attacks registered a very fast m/s value. Once again, this type of attack isn’t what this analysis is about and so I didn’t want the outcomes of these attacks (be they good or bad) contaminating the data set which will mainly contain longer attacking moves.
All the above resulted in a final data set of 15,289 shots, out of more than 40,000 total shots across these four seasons.
I am aware that there could be some debate about which attacking moves to include in the study. It is extremely difficult to come up with water tight logic that will see that the study only includes “proper” attacking moves. As soon as the defence touches the ball I am working on the basis that the original attacking move has ended and a new one begins; even if it is the case that the defence only had a brief touch and didn’t have the ball under control. Of course, I can see how this isn’t ideal but we need to draw the line somewhere in terms of objectively deciding when one move stops and another one starts.
Despite that, I don’t feel that changing the data rules about which attacks ended up in the final data set would materially change any of the conclusions reached in the data. I’m merely acknowledging that there is no right or wrong answer in terms of how to piece together attacking moves, even from the detailed Opta data files.


