
In the words of a great philosopher “It's not about how hard you hit. It's about how hard you can get hit and keep moving forward. How much you can take and keep moving forward.”, and who can argue with a guy that also uttered immortal lines such as “Adriaaaaaan” and "I feel like a Kentucky Fried Idiot!".
When StatsBomb released their xPass (or Pass Success Probability) metric earlier this year, I started poking around with it to see if there were any interesting insights that I could derive.
At around about the same time, StatsBomb’s Director of Football, James Yorke, also posted a data viz on one of our internal Slack channels that displayed each Premier League team’s xG created by game state. And thus an idea was born.
Could the difficulty of passes (xPass) that a player or team plays when winning, losing or drawing, give us an insight into their playing style and/or mindset? How do the best teams close out games when they’re leading? Do some players go into their shell when they’re losing? When they’re on the ropes, how much can teams take and keep moving forwards, sticking to their game plans, abiding by their philosophies?
What is an xPass?
Before we get into analysing the data, a little explainer on what xPass is.
The definition that you’ll find on our Assist website is: The estimated likelihood of an attempted pass being completed successfully based on the location of the pitch and context the pass is attempted under, and location of the target location of the pass.
In its simplest form it is a measurement of the difficulty of completing a pass. A pass with a high pass success probability (xPass) is likely to be completed a high percentage of the time - you can think of these as safe, low-risk passes. A pass across the back between two CBs, who aren’t being pressured, would have a high xPass value, for example.
By contrast, a pass with a low xPass value is likely to be completed a low percentage of the time - you can think of these as risky, more direct passes. Consider a full back playing a ball from his own half into the channels, whilst being pressured by an opponent, for example.
Loosely speaking, playing more high xPass passes would equate to being more measured in possession and playing more ‘safe’ passes, whereas playing passes with a lower xPass value would indicate a more direct style of play.
What can we do with xPass?
So can we use xPass to get a proxy towards team style and, more pertinently, whether that style changes depending upon the game state?
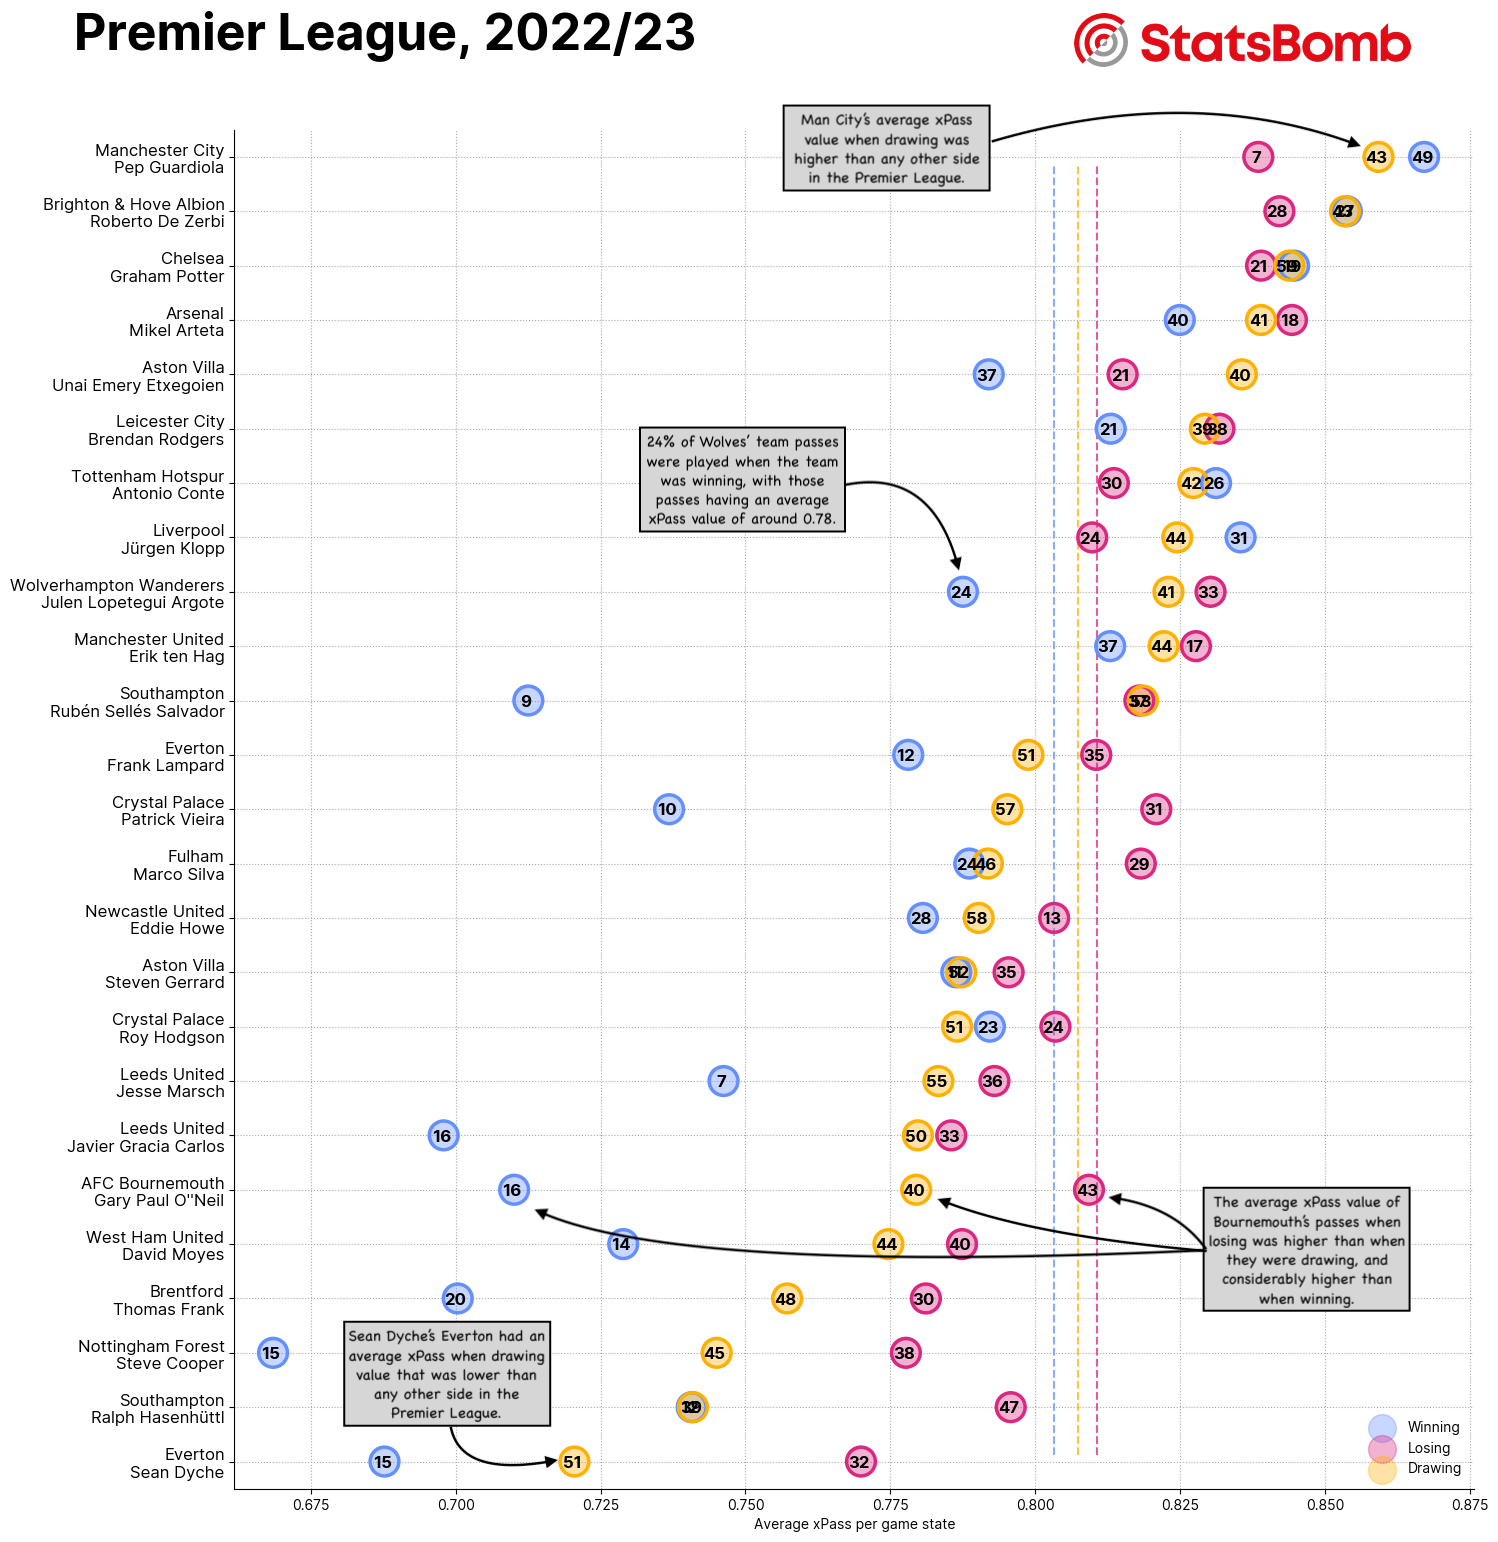
In the below visualisation I have plotted a team’s average xPass value for when they are winning, losing and drawing. The numbers inside the circle represent the % of overall passes that each team has played in the related game state - which adds some much needed context for teams that spend very little time either winning or losing. They’re ordered (high to low, top to bottom) by the average xPass value of all passes when drawing. The dashed lines show the league averages per game state. And I’ve also considered teams under different managers separately (with a minimum threshold of 10 games).
As with most data analysis, we need to apply some logic, with the understanding that not all of these will hold true all of the time;
- The way a team plays when drawing is the closest (of all three game states) to their intended style of play. In this game state there’s a relatively equal balance between wanting to attack to find a winner versus needing to defend in an attempt to avoid conceding, and it’s also the game state that most teams find themselves in the majority of the time. The caveat to this would be that in some games or scenarios a draw could be seen as a desirable result, so perhaps teams aren’t playing to their ‘normal’ style. Think of Bournemouth hanging on for a point at the Etihad, or the converse where City are throwing everything at Bournemouth to get the win, for example.
- There are two forces in effect that we need to be considerate of. The types of passes that a team play might not necessarily be the ones that they want to play, they could in part also be a consequence of what their opponents are allowing or forcing - i.e. a winning team may be happy to sit off the ball and allow their opponents possession at the back, whereas a losing team may increase the intensity of their press, forcing the opponents to be more direct.
- Not all teams will set up to play the same way in all games. Teams lower down the league table will, of course, often adjust their style of play when coming up against those towards the top of the table. Some teams will also set up differently when playing home or away. When averaging this sort of data over a large set of games there will inevitably be some nuances lost, we should be mindful of this.
And so with all of that in mind, we can make the following assumptions;
- Teams that feature towards the top of these visuals play a more possession based style.
- Teams towards the bottom deploy a more direct style of play.
- Markers to the left of a team's xPass when drawing indicates that the team's passes are more expansive/direct (than when drawing) in that particular game state.
- Markers to the right of a team's xPass when drawing indicates that the team's passes are more conservative/intricate in that particular game state.
What does xPass tell us?
When running this for each of the top 5 leagues, the first thing that jumps out to me is that teams who have a higher average xPass when drawing, are generally more wedded to that style regardless of game state, and vice versa. i.e. the grouping of the average xPass totals is tighter in the teams towards the top of the lists than those at the bottom.


Another high level observation is that weaker teams tend to get a lot more direct/play riskier passes when winning. This is quite intuitive and what we would generally come to expect. Points are precious at both ends of the table but for those towards the bottom, when they do take the lead, there’s more of an emphasis on protecting that lead than pushing forwards to get another. Hence we see teams are more likely to clear their lines and move the ball away from their own goal.
You're more likely to turn over possession with these types of passes, but the change in territory is deemed to outweigh the negative effect of losing control of the ball. Whilst a low average xPass score indicates a direct style of play there's plenty of nuance to playing direct football and some teams will do so in a far more effective manner than others. You can read more about this in Scott Johnson’s recent blog post - Exploring The Efficiency of Route One Football.
Comparing differences at clubs that changed managers midway through the season also throws up some interesting observations. See the difference between Frank Lampard and Sean Dyche’s Everton teams, for example. They spent a similar amount of time in each game state but the starting point (when drawing) and changes in xPass values when winning and losing highlights a considerable difference in style. In fact viewing Dyche’s Everton through this prism relative to the rest of the league serves to highlight why he developed the reputation of being a route one manager.
That’s not a stick to beat Dyche with, however. Things quite obviously weren’t working under Lampard, he recognised that, made changes, and did enough to keep the club in the Premier League. The team’s underlying numbers improved too; from an xGDiff per game of -0.43 under Lampard to -0.38 with Dyche in charge, as they went from picking up 0.8 points per game to 1.11 points per game.
By contrast, Villarreal lost Unai Emery after a fairly strong start to their La Liga campaign, but Quique Setién came in and maintained a similar style - at least in terms of xPass values - and led The Yellow Submarine to a 5th place finish. A subplot to this observation would be a pat on the back to the Villarreal hierarchy for identifying a manager that was suited to continue Emery’s good work.
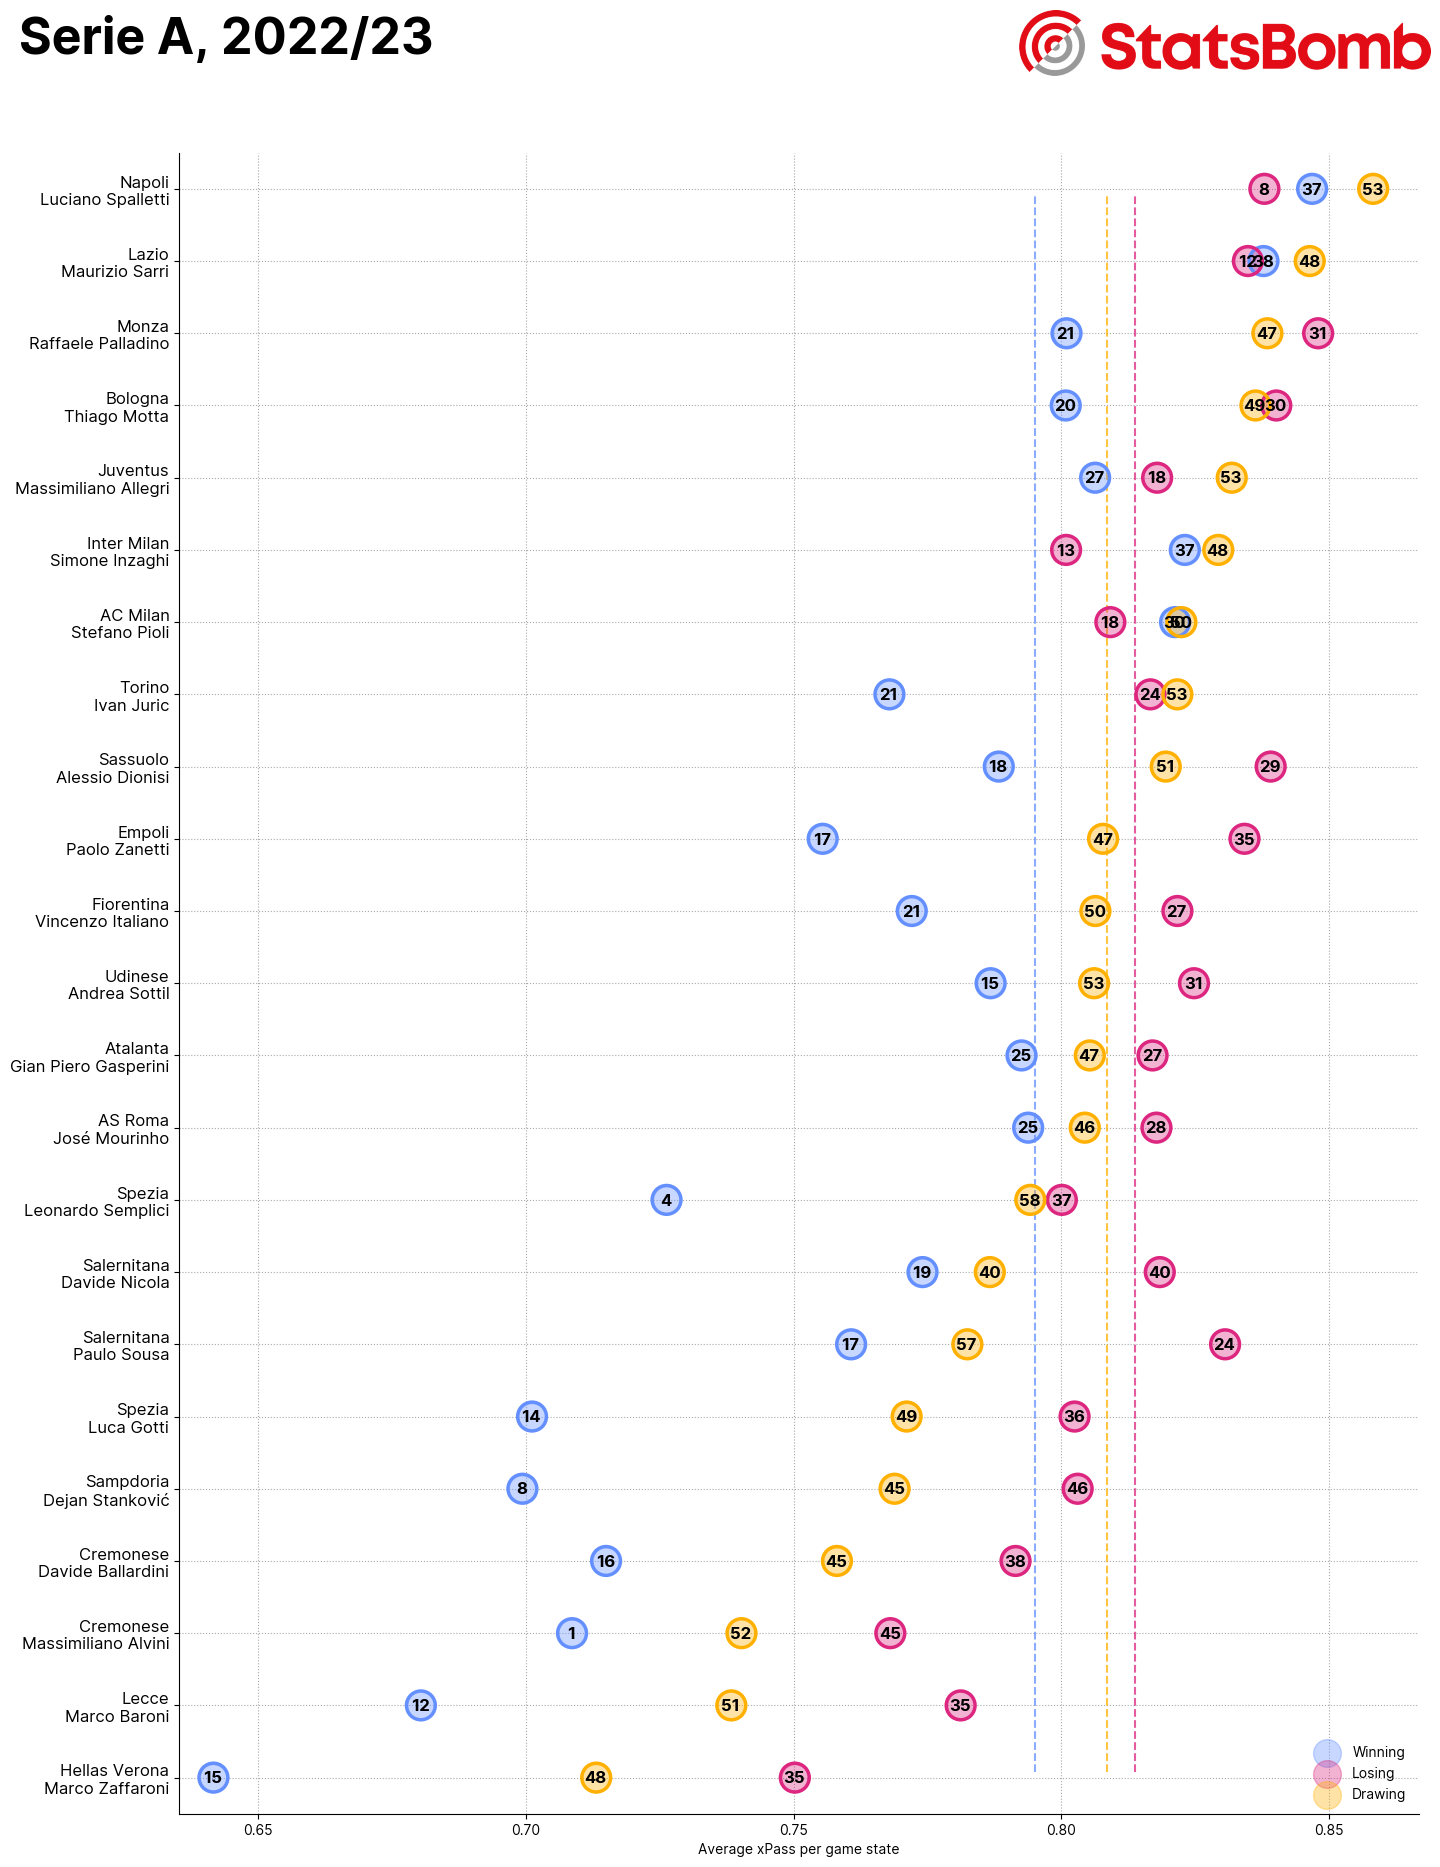
Lastly, a shout out to a notable outlier. Raffaele Palladino’s Monza side were one of the more possession heavy teams in Serie A last season when drawing, but also spent around 31% of their time behind in games. Yet they doubled down on that philosophy when losing and actually became more patient with their passing when chasing the game. And it paid off, as they finished 11th in their first ever season in Serie A. A nod to the notion of getting hit and keeping moving forwards.
Does xPass matter?
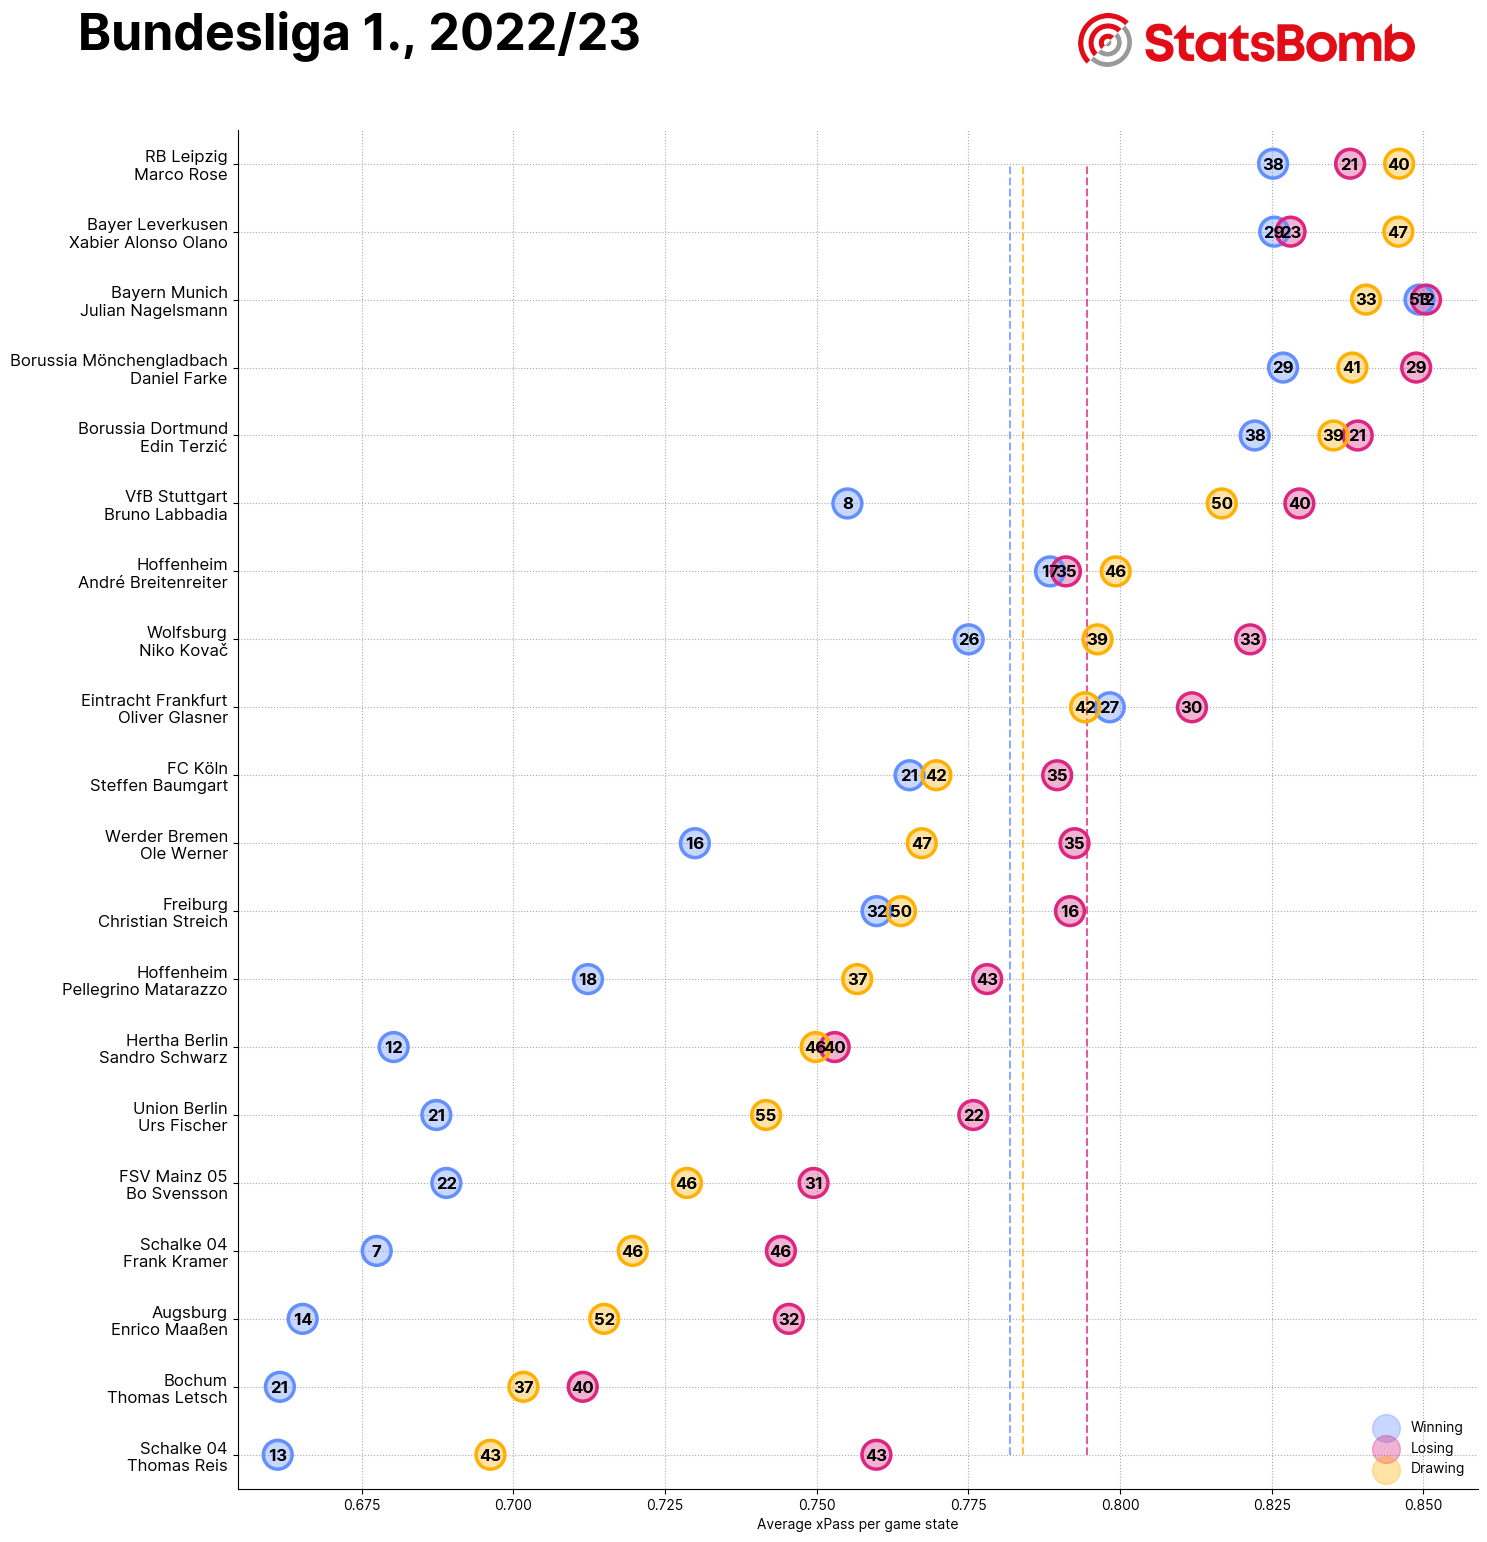
Something that you’ve probably noticed from eyeballing the data points for each of the five competitions is that the stronger teams gravitate towards the top end of the ordering (they have a higher average xPass in a game state when drawing).
That’s not too surprising. Stronger teams tend to play more of a possession based game in the modern era, they also have better players that are more comfortable on the ball, and the opposition are more likely to sit in a low or mid block and allow them to play out from the back - hence a higher proportion of high xPass passes between defenders in the build-up phase.
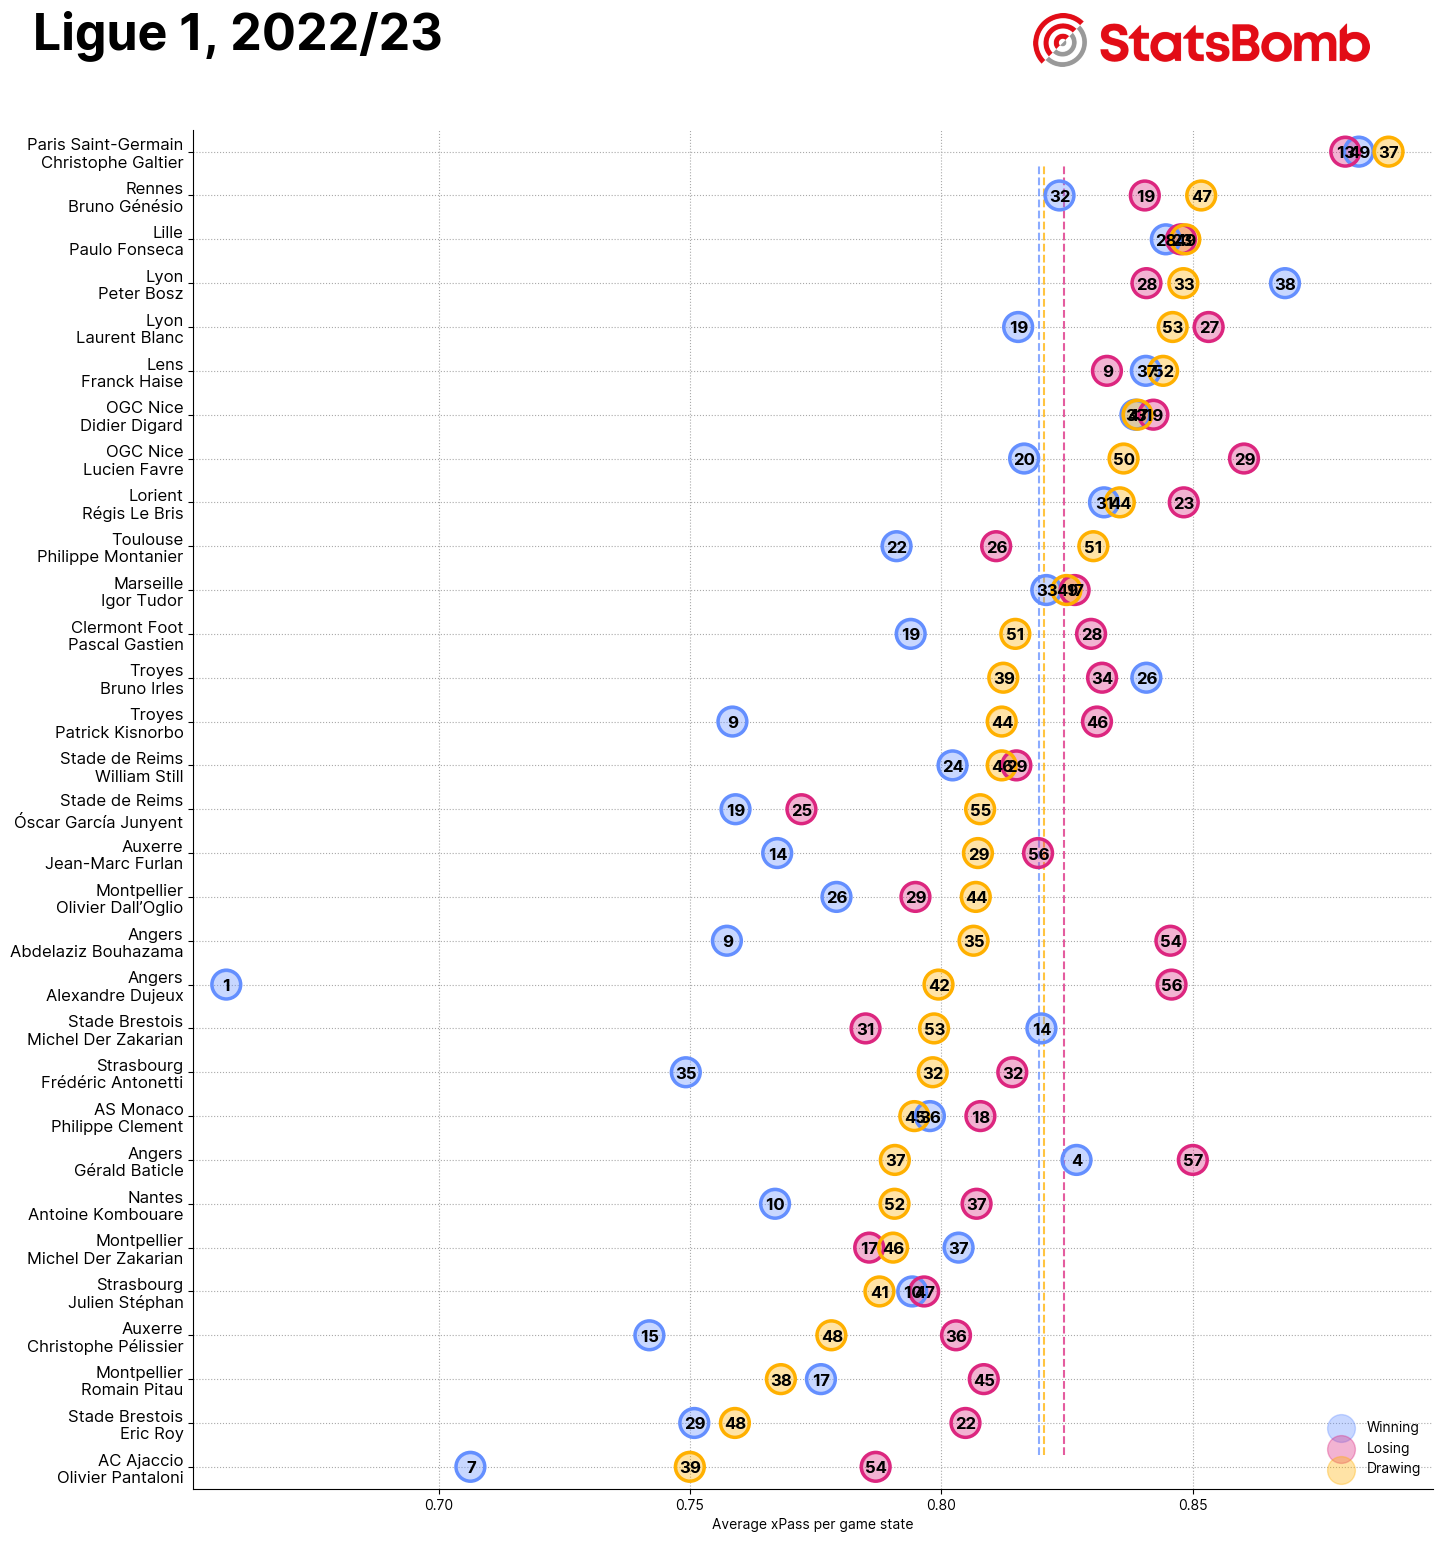
What also stood out to me was that it appeared that the ‘better’ teams were more consistent with their xPass value regardless of game state - even for those that appeared further down the list of teams based on their xPass when drawing. Newcastle, for example, had a fairly low divergence from their mean state, as did Roy Hodgson’s Crystal Palace, as well as the likes of Marseille, Roma, Eintracht Frankfurt and Real Sociedad.
To test this theory I made a very basic calculation of the difference between a team’s average xPass value when drawing and those same values when winning and drawing, and called this the Divergence Score. A low Divergence Score indicates a team that plays a similar style regardless of game state, a high Divergence Score suggests a team that varies their approach when winning or losing.
Plotted against a team’s season xG Difference, gives us the below;

The results suggest that perhaps there is something in this theory, as we can see a fairly notable correlation between xG Difference and the Divergence Score. With a standout clump of top performers in the top right.
Maybe it’s not just a case of how hard you can get hit and keep moving forward but also a bit of how much you keep moving forward when you’re hitting.
How can xPass help us?
So why does any of this matter? What actionable insights can we generate?
Manager assessment
My primary instincts feel that this could be a really useful step in the identification of managerial candidates for clubs. I theorise that a manager who has his team playing in a consistent style regardless of game state (a low Divergence Score) has;
- Got his players well drilled and communicated his ideas clearly so that his intentions can be implemented on the pitch.
- Developed a strong enough buy-in and trust from his players so that they do not diverge from the gameplan when the going gets tough.
Now I understand that some would, and have, interpreted the same information in a way that suggests a manager is too stubborn and/or doesn’t have a plan B. It’s an accusation that has been thrown at Mikel Arteta in the past, and was quite possibly the downfall of Graham Potter’s time at Chelsea.
And I wouldn’t entirely disagree with those arguments. But, I think if you can wed the above with strong results on the pitch (in relation to other metrics such as xG and OBV, or even just points won), then you can perhaps get some signal towards identifying up and coming managers - particularly if you were to carry out some similar analysis on leagues outside of the big 5.
I should also point out that the converse isn’t necessarily true. A manager-team combination with a high divergence score most certainly isn’t a poor manager just because of this. It may well be that he wants his team to play differently when winning, losing and drawing, and that he has communicated those ideas strongly and got full buy-in from his players.
Performance analysis
If you work at a club and have the luxury of the additional context that can be provided by your first team manager and coaching staff, then you can really get stuck into this data as a tool to analyse your own performance.

Swansea have one of the most distinctive styles of play in the EFL, and have one of the lowest Divergence Scores to accompany that. But something clearly didn’t quite click in the game against Luton - a match which they also lost 1-0, and had just a 4% chance of winning based on xG.
Obviously Luton are a strong physical team that also have a distinctive style of play. Were Swansea ill prepared for that? Did they deliberately try to change things up to combat it and got it wrong?

With the answers to these questions and the insights from this data analysis, you can start to work toward solutions that can help avoid similar mistakes in the future.
Vis-à-vis, if Swansea are our next opponents, can we use this information to our advantage? Maybe it’s worth paying extra attention to the video and dig deeper into the data from their game against Luton to identify what it was that knocked them off their stride and disrupted their usually strong bond with their style of play.
Player analysis
Can we also learn something about individual players here? Both in a recruitment setting, and an opposition analysis?

Take the information above about the average xPass value of individual Sunderland players. Let’s look specifically at the two Centre Backs, Danny Batth and Dan Ballard. Batth plays similar types of passes when the team is drawing or losing and goes more direct when winning, whereas Ballard is more consistent in his passing style when winning (relative to drawing) but is notably more considerate and patient with his passing when the team is losing.
Can we use that information in deciding how we press Sunderland’s backline in our upcoming game against them?
Furthermore, how might we differ our approach to the game if we know that Edouard Michut is playing in the CDM role as opposed to Corry Evans or Dan Neil, for example?
Recruitment
And can this information be used as a factor in your recruitment process? Say we’re looking for a CDM who can slow things down in the middle of the park, a player who doesn’t get easily flustered and will retain and recycle possession, laying the ball off to more creative teammates to progress play. Michut’s high xPass values in all game states could be one pointer towards him being this type of player.
Conclusion
I’ve only scratched the surface in this analysis and would most certainly need to dig deeper before proposing the findings as anything conclusive - perhaps introducing some controls for team strength and considerations for time spent in each game state. I present it as a discussion starter. Hopefully it sparks a few ideas and I’d invite anyone reading this to get in touch with suggestions on how it can be developed further and to point out any pitfalls that I haven’t already acknowledged.
I do, however, believe that attaching xPass to game state can give us a level of insight into team and player style. That information can be used in a myriad of ways relating to league, team, manager and player analysis. It can be used in performance analysis, opposition analysis and data-informed recruitment.
Perhaps the most interesting offering is what it can tell us about a manager and their impact on a team. It’s certainly the aspect that I am most excited about from this initial exploration, and one that I intend to follow up on with a dedicated blog post in the future.
It can also provide a window for assessing an individual or group’s intentions, as well as their mindset and loyalty to those intentions in the face of adversity. It can be a pointer towards how hard you can get hit and keep moving forward. How much you can take and keep moving forward.