Club América, one of both Mexico and Latin America’s most prestigious clubs, have been StatsBomb customers since 2021.
Right from the beginning, América have demonstrated their intention to be at the forefront of the use of data and other new technologies in football, seeking a competitive advantage by integrating these modern tools into their decision-making processes.
We had the opportunity to speak with Enrique Cházaro, Coordinator of Sporting Intelligence, to get a clearer understanding of how the club use StatsBomb’s data and analysis solutions in their day-to-day operations, and to find out more about the new processes they have been developing with the help of our Customer Success team.

Why StatsBomb?
Club América were already using other data sources and analysis platforms prior to signing up for StatsBomb’s services. So, why did they decide to add our solutions to their range of tools?
“Inside the club, we are always innovating and seeking out new tools that can help us with our internal processes,” explains Cházaro.
“We could see that StatsBomb’s IQ platform was very easy to use, that it was quick and easy to obtain and export visualisations. In addition, there were various R packages that we could use through the API. That ease of use was one of the things we liked most about StatsBomb.”
In addition, Cházaro was happy to put his trust in StatsBomb xG, our expected goals model that includes important variables such as the position and state of the goalkeeper and the height of the ball at the point of impact that are not found in the models of other providers.
“StatsBomb xG was the most convincing for me,” he says. “We know that we can access expected goals through all the other providers but we have put our trust in this one because of the number of variables that it takes into account.”

The Usability of StatsBomb IQ
América have recently started to use advanced data in their scouting processes, but principally use it in their opposition analysis work, identifying the key features of opposing teams’ approaches and their strengths and weaknesses.
In this work, they are heavy users of StatsBomb IQ, our advanced analysis and scouting platform.
“Of all the football data analysis tools that we’ve used, StatsBomb IQ is one of our favourites because it is exceptionally easy to use,” Cházaro explains.
“It is an easy way in for people who don’t want to work with the raw data. There is a lot of added value to having things like radars so easily available, and being able to create visualisations where you can choose and edit the variables. That everything is so user-friendly is a big plus.”
His department make use of various metrics and visualisations to create reports for the coaching staff, trying to provide them with the best possible quantity and quality of information in line with their requirements.
“As a starting point, I generally jump straight into the radars that allow us to see the opponent’s performance compared to the league average,” says Cházaro. “They allow me to get a picture of the reality of the team we are going to face.”
Cházaro also mentions the utility of the trendline feature within IQ that allows him to see the fluctuations and/or consistencies in the opponent’s output across various metrics and then easily export a graphical representation to include in the report.
From there, he delves into a deeper analysis of the opponent’s play style through the IQ Tactics portal.
“We use IQ Tactics to identify how the opponent plays because it allows us to see if they regularly seek forward passes or if they prefer to circulate play through the flanks, or at a player level, the types of passes they attempt from different areas of the pitch,” he explains.
In addition, they analyse things like where on the pitch the opponent regains possession, how they move the ball into the final third or where they aim their crosses.
América have established a workflow with IQ that has functioned very well for them up to this point, however they are now also beginning to work with the raw data to further personalise their reports.

Working with the Raw Data
StatsBomb IQ is designed to allow our customers to derive instant value from our industry-leading dataset, providing them with access to a huge variety of metrics and visualisations that help them make more informed decisions. But we always encourage our customers to also work with the raw data to take full advantage of all of the possibilities our data offers.
Our dedicated Customer Success team help empower them to do so.
“The Customer Success team have guided us through the whole process of accessing the raw data,” Cházaro explains. “They have helped us out when complications have arisen with the code, providing excellent service in resolving questions and helping us with whatever we’ve required.”
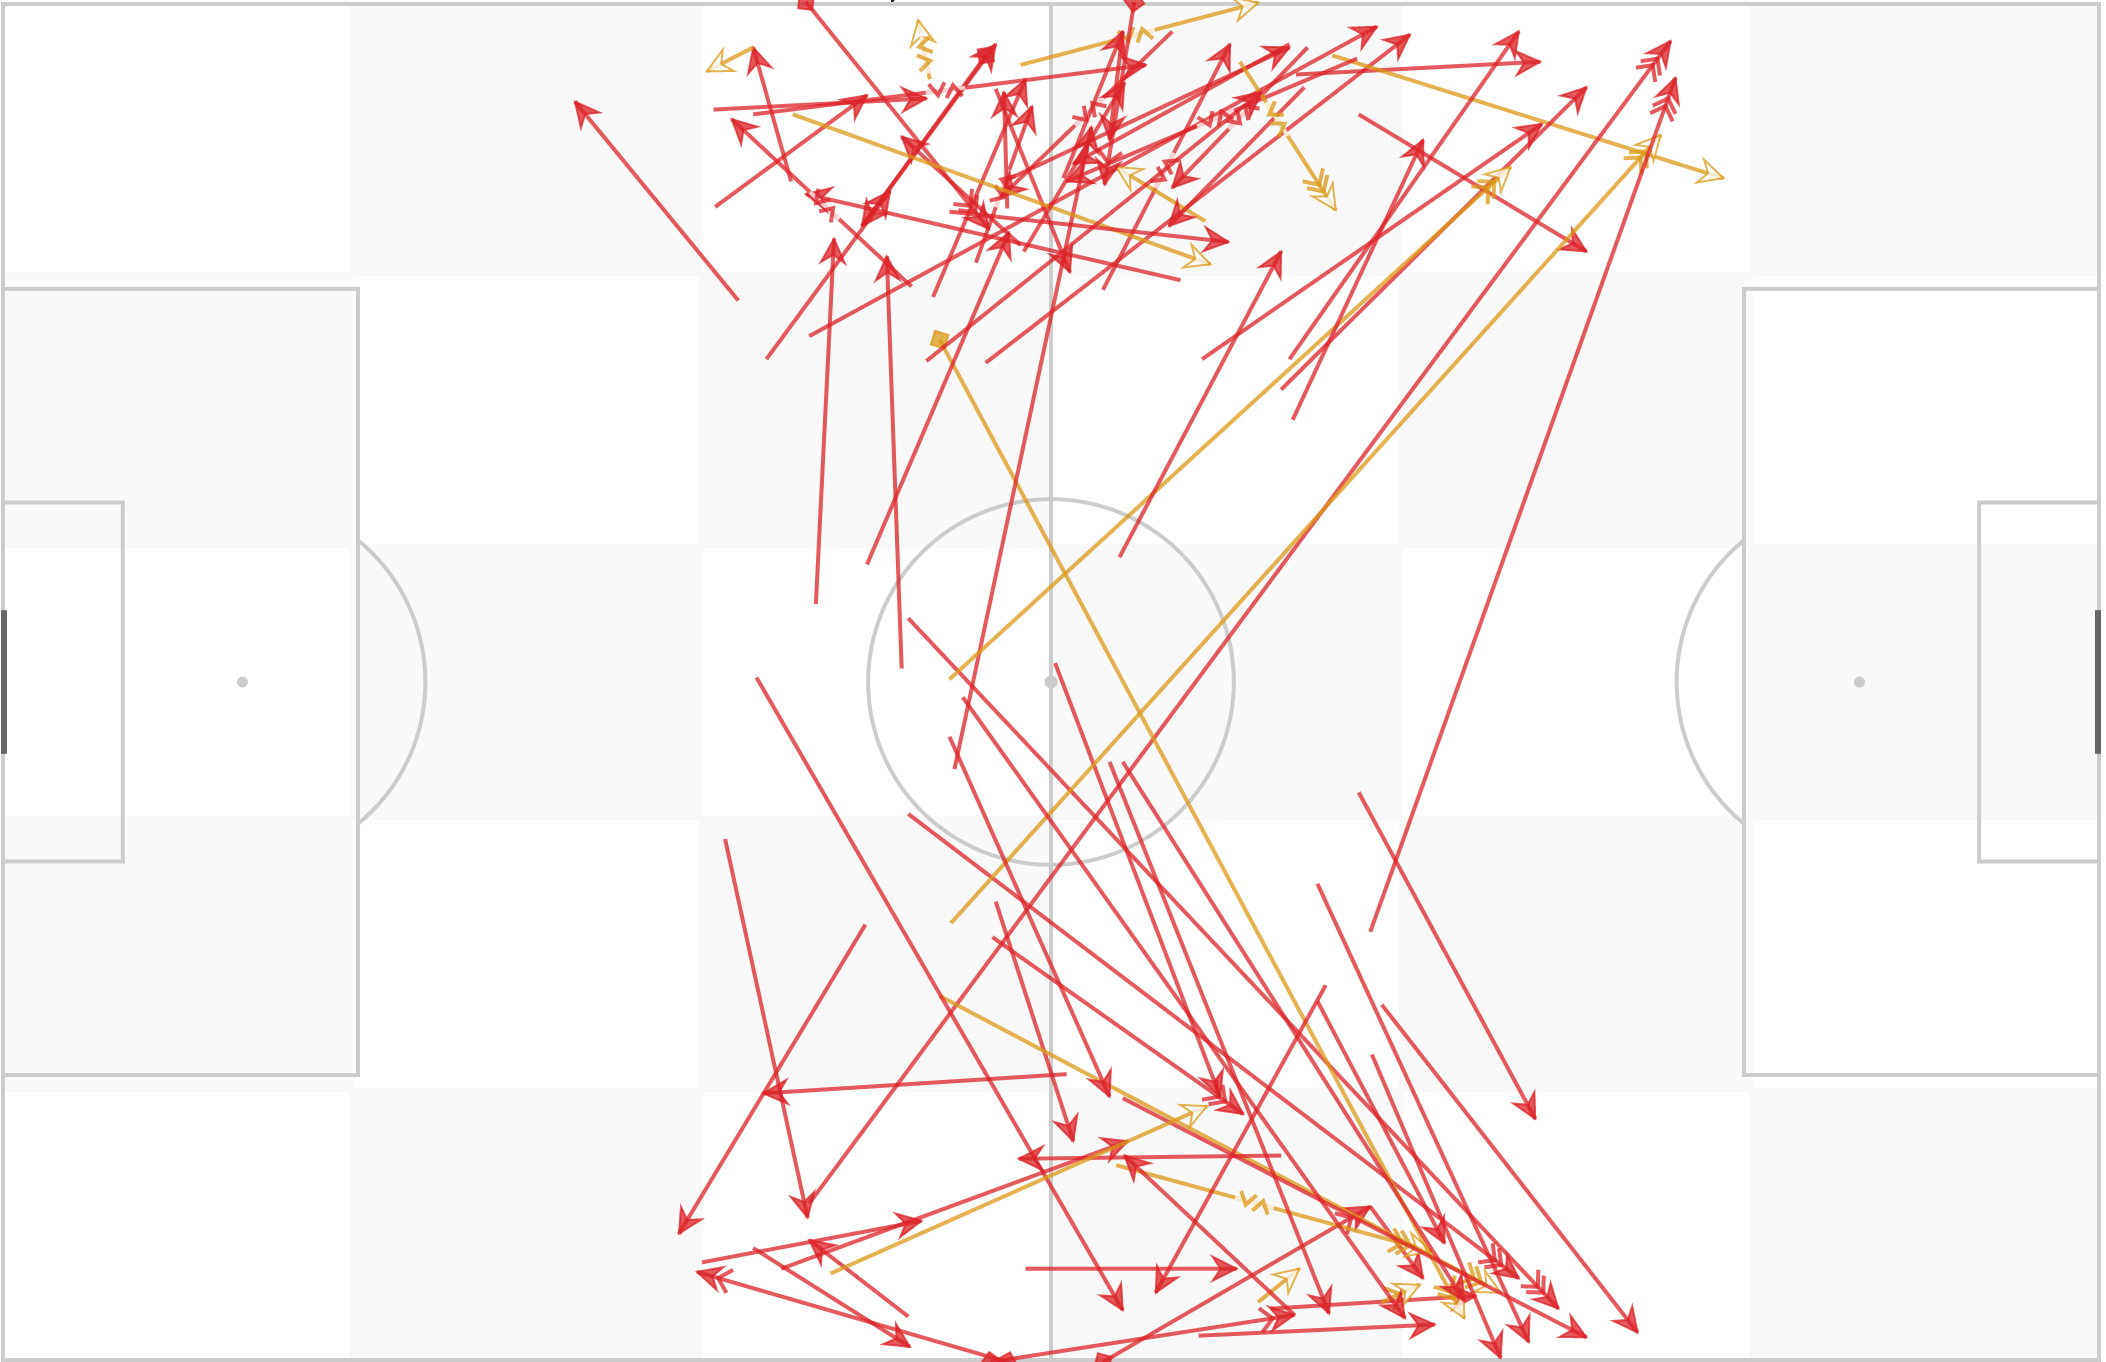
His department accesses the raw data through StatsBombR, our package for the programming language R that comes preloaded with various helpful functions. They have started to create their own visualisations, like a progressive passes map that takes information from our On-Ball Value (OBV) model, a method of valuing on-ball actions, and presents it in a way that is easily understood by any stakeholder at the club.
They are also experimenting with new ways of visualising various other data points to include in their reports.
It is a process that has only recently been initiated but that in the medium to long term will represent an important part of the work of a club who have demonstrated the advantages of trusting in new ways of working and not only that, but in consistently seeking to develop and fine-tune then to improve outputs.
If you work for a club, media outlet or gambling company and want to know more about what StatsBomb’s solutions can do for you and your organisation, please get in touch.
