In early February, we pulled back the curtain to announce the impending release of our brand new data product StatsBomb 360, as well as revealing details of our upcoming #StatsBombEvolve event on March 17th to launch it into the world. We're one week out from the event, so let's recap all that's been going on since the announcement. In the initial announcement, we explained the concept behind StatsBomb 360 Data and gave a glimpse of the information that was previously unattainable in existing data, but would now be unlocked by 360. 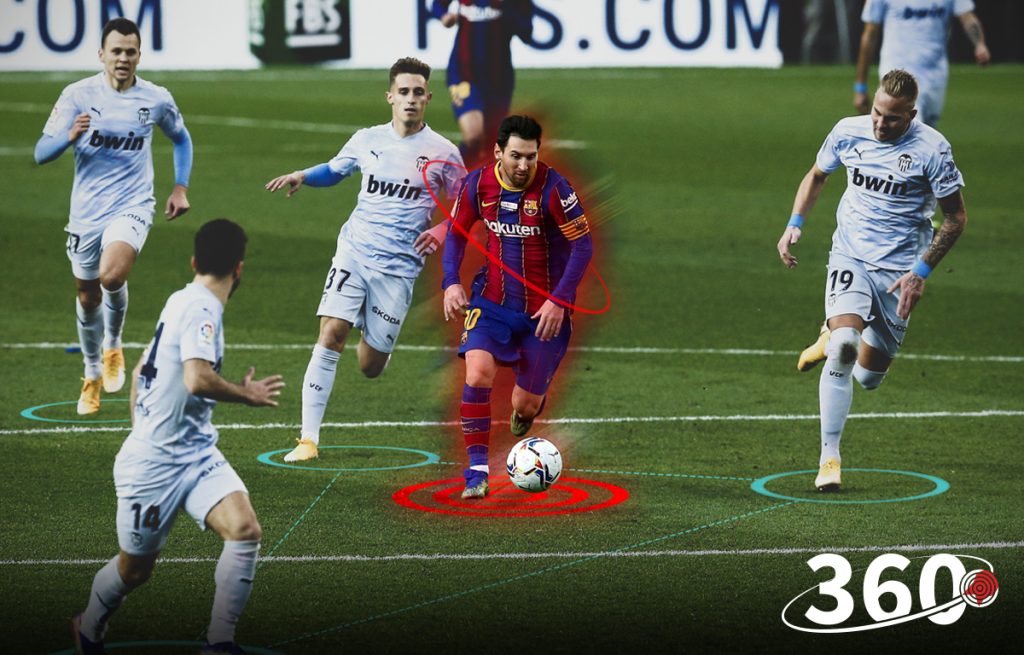 "StatsBomb 360 is contextual event data. What that means is that we are now collecting a freeze-frame showing all players on camera for every event we collect - approximately 3300 events per match. 360 is also going to allow us to uncover a host of new information about the game that was either difficult to see or completely hidden in basic event data. We will now be able to deliver things like:
- Line-breaking passes
- Ball receipts in space
- Distance to all defenders in the frame
- Passing lanes
- Defensive Island Events (DIEs) - a new event looking at when teams leave/create 1v1s with defenders by themselves, far from defensive help
- Defensive shape around every event
All delivered straight into the event API. And honestly, that’s barely scratching the surface for what will be possible with StatsBomb 360." Our customers first heard about 360 back in January to allow them to prepare for launch, and got their hands on sample 360 data a couple of weeks ago. The questions and feedback we've had since then have only reinforced our belief that 360 data will dramatically change what can be possible with event data. It brings us one step closer to "football reality". It won't just be 360 that will be unveiled at Evolve. There'll be talk of StatsBomb LIVE ahead of it's release in mid-2021, updates on the latest innovations coming out of our Data Science team (including information about our On-Ball Value (OBV) model enhancements), plus insight from our Collection and Quality Assurance teams to hear more about how we keep our data at the top of the industry. StatsBomb Evolve will be taking place online and is free to everyone to attend. All you have to do is sign-up here.
In the lead up to the event, we've been taking a look back on how we changed the football data industry when we launched StatsBomb Data back in May 2018. The launch of StatsBomb Data represented a serious upgrade to the quality and granularity of data that was already out there, and introduced a host of new datapoints and metrics to the industry. Since then, our data has empowered our customers to deliver greater insights within their analysis framework. We exampled a few of those in our StatsBomb Data Case Studies series, with a few excerpts from each piece below:
Pressures
Full piece here. In a season where teams across the world are looking to conserve energy just to survive the condensed fixture schedule, Leeds have barely taken their foot off the gas, continuing to press and engage the opposition all over the pitch. Wherever the ball is, Leeds are going after it. We knew that adding pressure data to our data specification back in 2018 would introduce significant context that was previously missing when evaluating a team’s approach out of possession, allowing for a deeper level of analysis and a more complete picture of the game. For example, here’s Leeds’ defensive activity map this season, relative to the rest of the Premier League, without pressures included: 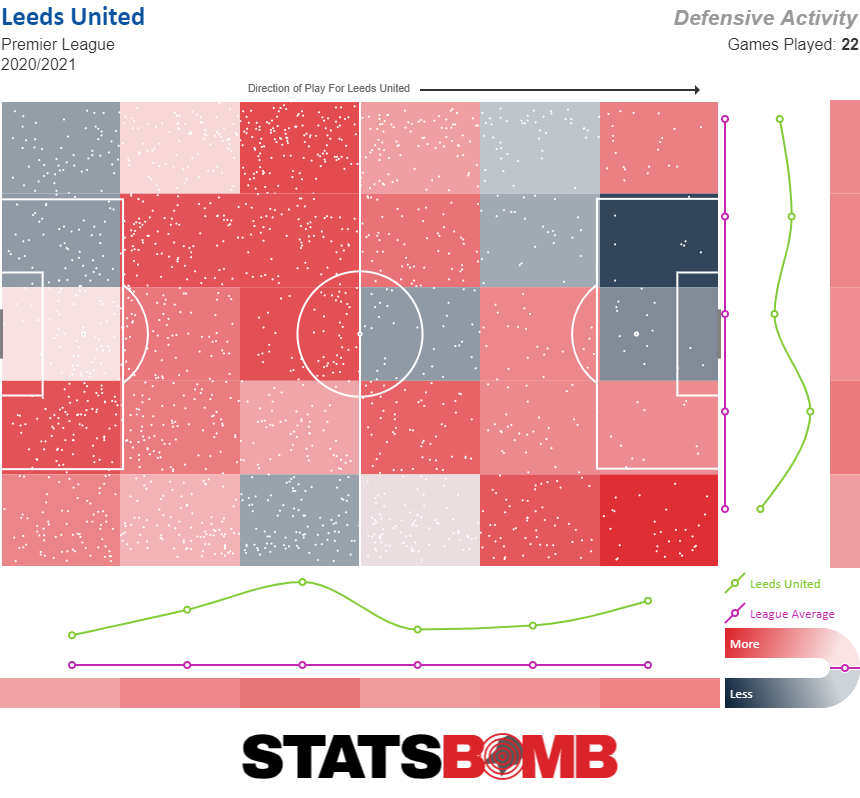 As you can see, it would suggest that Leeds are fairly active off the ball, but not significantly more than other teams in the league, particularly in the opposition half where they appear to be a shade above average. Including pressures tells a different story.
 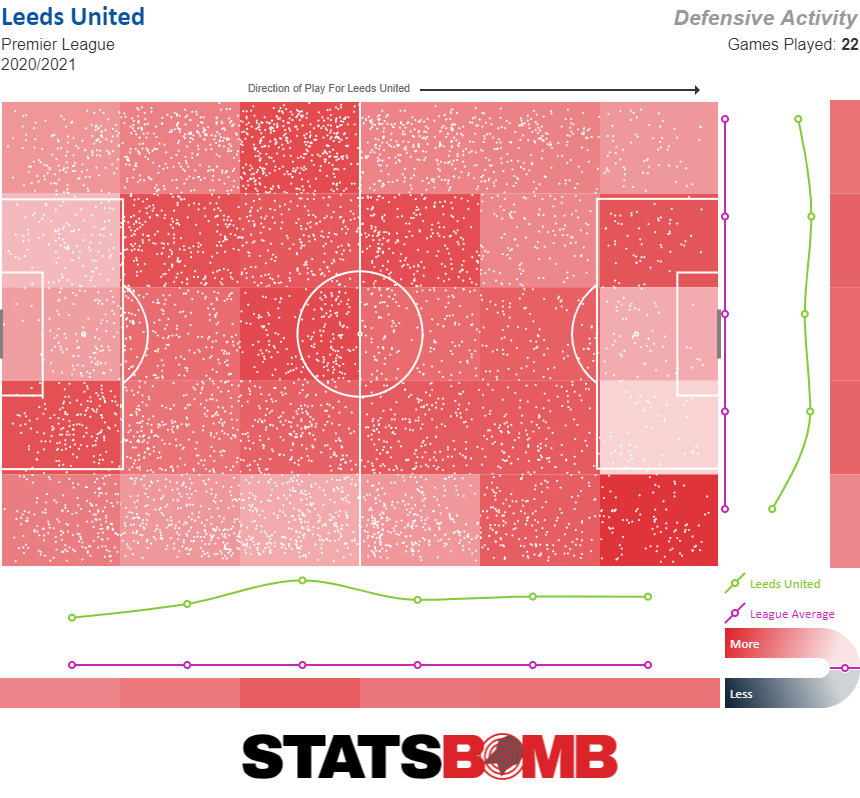 Now we can see an accurate reflection of just how active Bielsa’s side are out of possession. To read the full Pressures piece, click here.
Actions Under Pressure
Full piece here. With attacking teams regularly employing a counterpress after losing the ball in the attacking third these days, having players that can handle the ball under pressure when building out from the back straight after a turnover is vital. We're looking for players that receive the ball under pressure in the defensive half and examining whether their next actions are successful in retaining the possession, either through a dribble, carry, or pass. 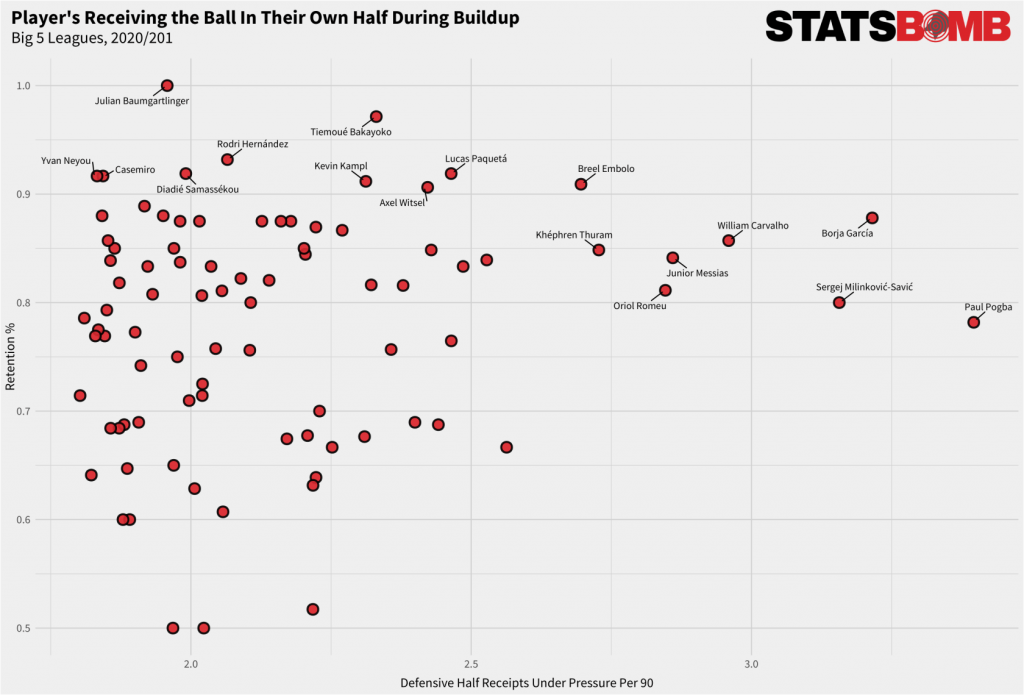 Julian Baumgartlinger takes the crown this season, having kept the ball 100% of the time when receiving under pressure in his own half, though he has only registered 1.9 under pressure receipts in the defensive half per 90. Contrast that with Paul Pogba who receives the ball under pressure nearly twice as often at 3.4, but has retained the ball only 78% of the time. Despite a mixed few seasons since his 2017 move to Chelsea, Tiémoué Bakayoko’s control under pressure sees him second only to Baumgartlinger with a retention rate of 97%, and this coming from more pressured receipts than Baumgartlinger too. This is a consistent strength of Bakayoko's having been similarly reliable when receiving under pressure last season as well. Whilst at AS Monaco in 2019-20, Bakayoko had the best retention rate in Ligue 1, keeping the ball 97% of the time from 2.7 under pressure pass receipts per 90. To read the full Actions Under Pressure piece, click here.
Pass Height And Pass Footedness
Full piece here. So, Wolfsburg are the only team in the top European leagues that make more passes with their left feet than right. To better visualise this, we can compare the average pass locations of their players, as well as the footedness of those players, with those of the most right-footed team in the Big 5, AS Roma. 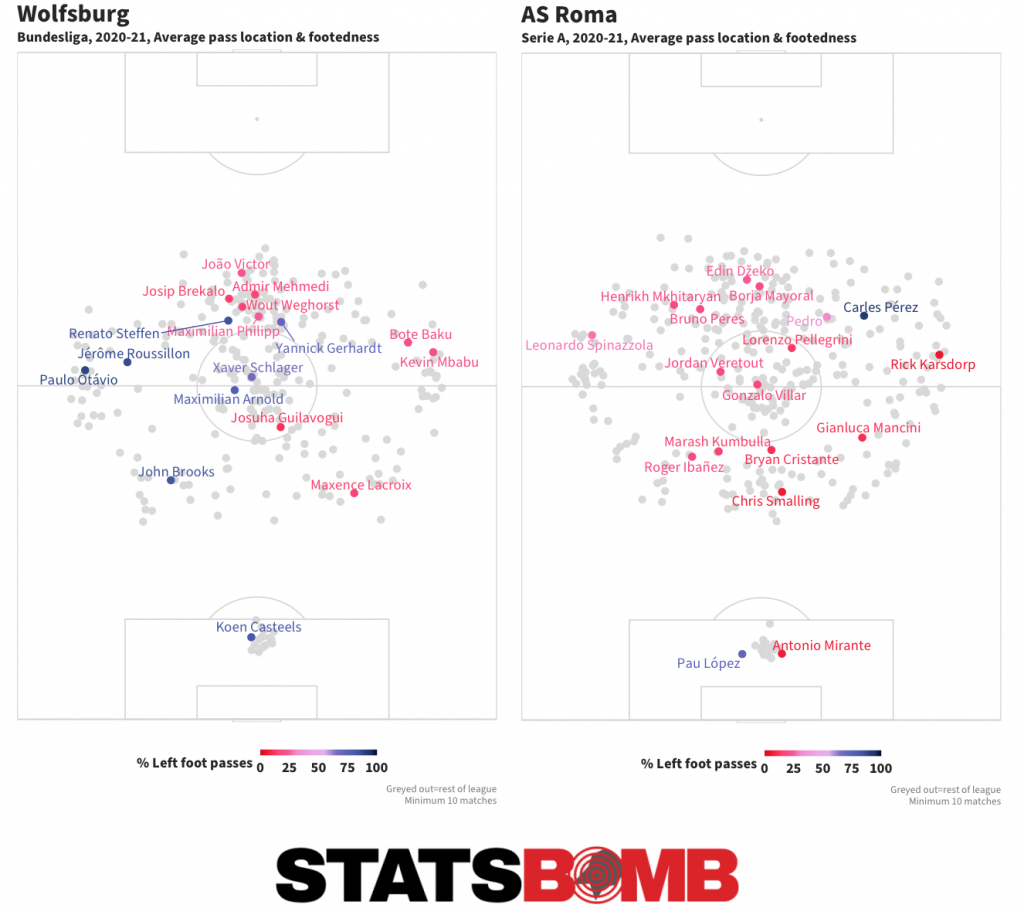 It’s stark that even Roma left wingback Leonardo Spinazzola is predominantly right-footed, whereas Wolfsburg have a perfect balance between left and right footers, allowing wide players Renato Steffen and Josip Brekalo to swap wings with regularity, or rotate for Bote Baku on the right wing if the team needs a little more width. To read the full Pass Height And Pass Footedness piece, click here.
Freeze Frames And Defender Locations
Full piece here. On the defensive end, we can look at teams who get bodies behind the ball to stifle the opposition, by applying pressure on the shot taker or by defending space. Teams that defend higher up the pitch and apply pressure to the opposition backline have to work hard to recover their positions, whereas teams that look to stand off and regain their defensive shape tend to have more defenders in a position to defend the box once the opposition advance into their territory. 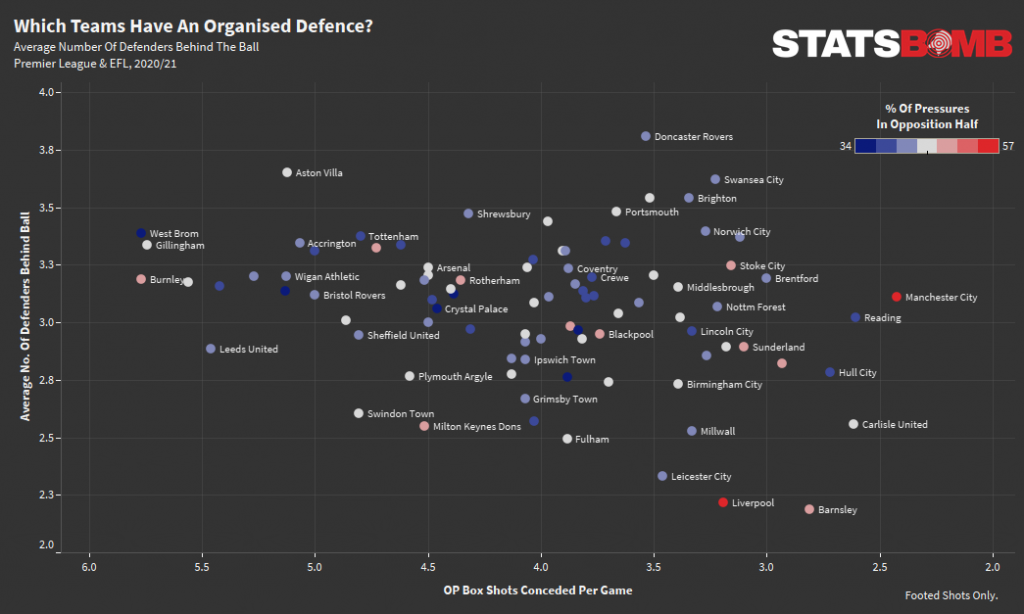 Liverpool and Manchester City are again worth looking further into here. Both apply a lot of pressure on the opposition backline and look to keep the game in the opposition territory as much as possible, but looking at this it would appear that this season Manchester City have been able to recover their positions more effectively, averaging a higher number of defenders behind the ball when their opponents shoot in the box. That’s not to say Liverpool’s press isn’t effective though as they, like Barnsley in the Championship, press aggressively high up the pitch in order to suppress the number of opportunities the opposition are able to create in the first place. Barnsley have the fewest defenders behind the ball on average when conceding shots in the box, but the efficacy of their press means they only concede 2.8 footed shots in the box per game. To read the full Freeze Frames And Defender Locations piece, click here.
That's just a sample of the unique datapoints and variables, without even mentioning Shot Impact Height (the height of the ball at the time it was struck), that already make StatsBomb Data the best in the industry. But we'll never be content with standing still. We will continue to innovate. Always. We've changed the game once. In one week, with the launch of StatsBomb 360, we're going to do it again.
Join us at StatsBomb Evolve on March 17th 2021 to discover how we're going to change the football industry, including the launch of our new data product, StatsBomb 360. To find out more, click here.

