A few months ago I read a quote that struck a chord with me. In the prologue to his book “The Drunkard’s Walk” Leonard Mlodinow wrote:
The human mind is built to identify for each event a definite cause and can have a hard time accepting the influence of unrelated or random factors
It is important to realise that any given outcome (in football parlance this can be considered to refer to a win or a loss) can sometimes arise neither from great skill or incompetence but from “fortuitous circumstances”. Results, no matter how they were achieved, do not change and league points cannot be deducted or added to after the event. However, the use of analytics can help us begin to make assessments about whether certain results have arisen from great skill or were possibly due to some combination of “fortuitous circumstances”.
This takes me onto the 2014 version of Borussia Dortmund. As the German Bundesliga enters its mid-season Winter break, Jürgen Klopp’s side remarkably find themselves in 17th place in the league table. The mighty Black and Yellows spared only the ignominy of being bottom at the half way mark due to scoring one more goal than Freiburg.
Have BVB lost their edge due to the new breed of aggressive pressing, high paced teams that are now common place throughout the Bundesliga? Has Roger Schmidt replaced Klopp as the coach that other managers aspire to copy and be compared against? Do the players need to hear a new voice at the helm after listening to Klopp’s team talks and tactics for almost seven years?
Any of those things could be possible. But could the league winners of 2012, and runners-up the last two seasons (as well as Champions League runners up in May 2013) really have deteriorated that quickly?
I wanted to find out by talking an analytical look at Borussia Dortmund’s opening half of the 2014/15 Bundesliga season.
Goal Difference of -8
A first look at the numbers tells me that Dortmund certainly aren’t playing like a relegation threatened team. Our Expected Goals model (which basically assigns the probability of each shot being scored) has Klopp’s team in for scoring approximately 25 goals so far this season and a conceded total of 17 goals; this gives an Expected goal difference of +8 goals. The reality of what happened on the pitch is very different however, with the concession of 26 goals dwarfing the 18 goals that they have actually scored – that is a swing of 16 goals between the Expected Goal Difference as calculated by us and their real Goal Difference. And all of that occurred in just 17 games.
It is sometimes possible for a team to under perform their Expected Goal Difference without having a significant adverse impact on their league position. For example, a team may win by just 1 goal despite an emphatic performance, or get beat by 3 or 4 goals when the numbers would suggest that they should have suffered a narrow defeat. In both these cases the underperformance of Expected goals doesn’t actually cost the team any league points. Unfortunately however, Dortmund have not had the good fortune to be in this position this season as they have recorded six single goal defeats and three draws from their 17 league games played. In other words, an additional goal here or there would almost certainly have resulted in additional league points for BVB.
Using our ExpG model, when I run thousands of simulations on all the shots taken in the games played so far in the Bundesliga this season I arrive at a league table that looks as follows at the top:

It's noticeable that, with the exception of Dortmund, all of the other teams have approximately as many league points as our model has predicted.
Not only do I not have Dortmund in relegation trouble, but I actually have them in 4th position and, on my simulated table, they are within 1 league point of Wolfsburg. The lack of league points won by Dortmund this season, given the shots taken in their games, is extraordinary. The extent of their underperformance in terms of Expected Goals and actual goals is not something that I think I have seen before and even if their underlying performances don’t improve I’m confident that it’s only a matter of time until Dortmund begin their ascent up the table.
Despite that assertion I wanted to take a look at some of the metrics I keep an eye on to see if I could pick something else out that might help us get an idea of what has changed for the Black and Yellows this season.
Why so few goals?
The first part of the BVB puzzle that interested me was the lack of goals scored by them. As noted above, our model had expected them to score almost 25 goals; however they only troubled the scoreboard operator 18 times. I am the first to acknowledge that our model is not perfect as it may under- or over-estimate the goal probability of certain shots, but it’s normally pretty accurate. What about those 7 potential goals that would have made such a difference to Dortmund’s league position going into the Winter break?
As well as generating an Expected goal value at the moment the shot was taken we can also generate an ExpG value after the shot has been taken. This metric is greatly influenced by the final placement of the shot, but it is also driven by the factors that were used in calculating the original ExpG value (ie location and shot type etc). This after-shot Expected Goal value can be used to assess how well the shots that a team, or player, had were struck. A shot that is wide or blocked has an after-shot ExpG value of 0 (as it cannot be scored), whereas a shot that is arrowed towards one of the top corners will have a very high after-shot ExpG value.
With traditional stats we can only see how many shots were scored, and by definition the remainder were missed or saved. However, the use of this after-shot ExpG value over a large number of shots can give us some additional information and provide explanations around why a team has scored the number of goals that they have.
In Dortmund’s case, their after-shot ExpG this season totalled just 21 goals; this compares rather unfavourably with the 25 Expected Goals initially suggested by their shots. It is still in excess of the 18 goals they actually have scored, but the quality of BVB’s finishing looks to have caused them to undershoot their ExpG total by approximately 4 goals.
The following table lists all the BVB players that have taken more than 12 shots this season. The first two columns show the initial ExpG and after-shot ExpG values for each player. The final column shows the difference between those two columns; a positive number suggests that they finished their shots well, while a negative numbers indicates that their shooting was not up to par.
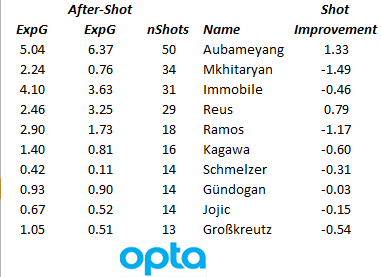
Only two BVB players, Aubameyang and Reus come out well on this metric. The other eight players troubled the opposition goalkeepers less than their shots suggested should have been the case. At this point it is worth making the disclaimer that this analysis has been compiled using the very detailed on-the-ball data that Opta compiles. However, I do not have access to defensive pressure or know the location of any players other than the player taking the shot.
Mkhitaryan and the Adrian Ramos have been the players that will have disappointed Dortmund the most with their shooting so far this campaign. Mkhitaryan has shot 34 times, but only 7 of those shots have been on target and none have found the net (he's the only player with more than 21 shots that hasn't yet scored a goal in the league). Ramos’ shooting numbers are really stark when we remember that he was signed to score goals as a replacement for Robert Lewandowski.
So I put 4 of Dortmund’s shortfall in goals scored down to their shooting. The other “missing” 3 goals I attribute to better than average opposition goalkeeper performances.
Over a small number of shots (which is unfortunately what half a season is) any signal in relation to the skill of shooters or goalkeepers is drowned out by noise. The conversion of the chances is what matters as far as the league table is concerned, but the underlying ability to generate the chances is much more important in assessing the quality of a team and as a predictor of what is likely to happen in the future.
Although BVB certainly haven’t set the Bundesliga on fire this season as an attacking force, five teams have generated higher total ExpG values than Dortmund, Klopp is entitled to feel a little aggrieved at the paucity of goals scored by his charges.
Shots Taken
Dortmund as a team still take lots of shots; only Bayern and Leverkusen have taken more shots than Klopp’s charges this season. BVB’s shot volume has stayed largely consistent over the past three seasons, however there has been a noticeable drop off in shot quality during this campaign. Each shot that has been taken this season has, on average, a 2% lower chance of being scored than the shots taken in the previous two league campaigns. In fact, only Koln and Paderborn have a lower average shot quality figure than that posted by Dortmund amongst the 18 top tier German teams this season.
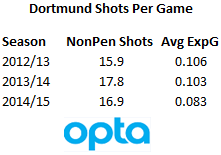
Shot quality is about more than just the distance of the shot. Whether the shot is taken with the head or the foot is very important, as is how the team has worked the ball to the shooting location. However, the distance of the shot is a very siginificant driver of shot quality (ExpG values) and it is an easily understood metric.
The following table lists the median distances for all non-penalty shots taken by Bundesliga teams over the past two and a half seasons.
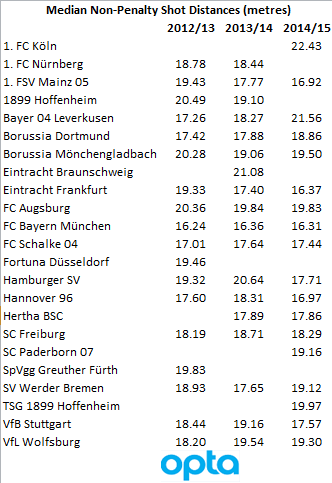
In 2012/13 and 2013/14 Dortmund’s median shot distance was 17.4 and 17.9m respectively. BVB’s median shot distance for this current season is almost 19 metres. In absolute terms, the difference between 17.9m and 18.9m doesn’t seem like a significant amount, but when the median distances in that table cover such a narrow range each metre is very important.
Dortmund was ranked in 4th and 6th positions respectively in the two previous seasons for median shot distance. However, this season, the distances of their shots has increased to the point that there are nine teams that have shorter median shooting distances than BVB. This additional shooting distance helps us understand why Dortmund’s shot quality has reduced this season.
Individual Player Shots
The table below shows the shots that have been taken by Dortmund’s players over the past two seasons. The left side of the table reflects the figures from the current season, while the right side shows comparative figures from last year. Each dataset shows the number of shots, the average ExpG per shot and the average ExpG per 90 minutes generated by each player.
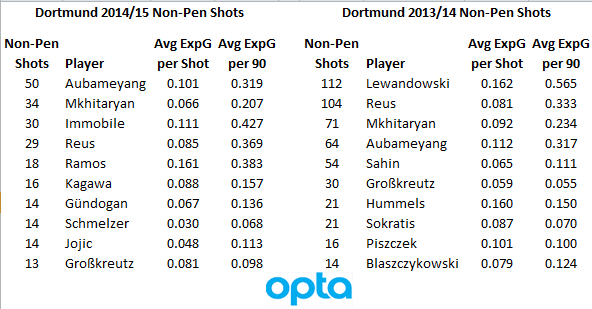
It quickly becomes apparent that at least part of the reason for the drop off in quality of Dortmund’s shots this season has been the loss of Robert Lewandowski to Bayern Munich. In Lewandowski, Dortmund was in the fortunate position of having a player that had fairly good shot volume combined with terrific shot quality.
Although the conversion rates of individual players, when compared with Expected Goal values, show a pretty weak correlation from season to season the average ExpG value per shot that a player takes is relatively consistent. This means that it is highly unlikely that a player will post an average ExpG per shot value of 0.10 in one season and then see that increased to 0.16 the next. Players have individual tendencies; the positions they take up, the runs they make and the awareness to be in the right place at the right time. I’ve no doubt that there will be a few examples where players have been able to adapt their game, but generally speaking, if a club wants to replace a striker that takes very high quality shots they should replace him with a player that has proven that they have the know-how to get into those same spots.
Following his transfer to Munich, Lewandowski was always going to be a very difficult player to replace. Adrian Ramos has posted high average ExpG numbers per shot, but he hasn’t been able to spend long enough on the pitch to make any real impact. Dortmund’s other striker acquisition of summer 2014, Ciro Immobile, was not a direct “like for like” replacement for Lewandowski as his shot quality (ExpG) during his final two seasons in Italy was in the 0.10 – 0.11 range.
On average, Pierre-Emerick Aubameyang is still taking the same type of shots that he took when Dortmund could rely on Lewandowski to have better chances; he hasn’t made the step up to be at the end of those better chances.
Never mind finishing the chances that came his way, right now Dortmund don’t seem to have anyone that can even get into the same positions with the ball at their feet (or head) as the big Polish striker was able to achieve on a regular basis. If Ramos cannot clock up more minutes on the pitch then this is an area that Dortmund should look to improve upon.
Incidentally, Lewandowksi’s average ExpG value for this season as a Bayern Munich player is 0.157. There is no doubting that Bayern create better chances than any other team in Germany, but this again demonstrates that the types of shots a player will take can be predicted fairly confidently in advance. If only predicting how they would finish those chances were as easy……...
Dortmund’s High Press
Earlier this year I created a metric (Passes per Defensive Action “PPDA”) that objectively calculated how aggressively teams pressed when the opposition was in possession. Specific details about this metric can be found in some of my earlier articles such as this and this.
In summary, the PPDA metric gives us the ratio of opposition passes allowed to defensive actions made by a team in attacking areas of the pitch. The lower the ratio of passes allowed the more aggressive the press employed by the team in question. The main benefit of creating an objective metric using Opta data to measure the intensity of a press is that it facilitates easy comparison, both against other teams and also across different timeframes.
Eighteen months ago after defeat in the Champions League final to their great nemesis Bayern Munich, Jürgen Klopp was quoted as saying:
I can promise that everything will work out in the end. We are building a new team, a new pressing machine.
Not only have Dortmund failed to ratchet up their pressing since that statement, but they are actually pressing less now than when Klopp made that assertion. Perhaps the vast number of injuries inflicted on BVB during this campaign may provide some mitigating factors, but this looks to be one area that Dortmund could improve upon in the second half of the season.
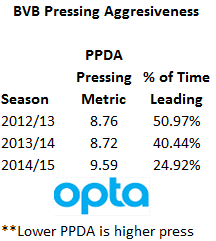
The above table shows Dortmund’s pressing values for each of the last three seasons. On average, they are allowing the opposition almost one more additional pass this season before they are able to effect defensive pressure on the opposition ball carrier. That fact in itself would presumably disappoint Klopp, as their high pressing, fast tempo style is often cited as one of the main contributing factors to BVB’s success over the last few seasons.
However, when shown in its proper context their pressing performance is actually even weaker than suggested by those raw PPDA values. You will see that the previous table also includes the proportion of game time that Dortmund were leading during the three seasons in question.
Given Dortmund’s struggles this year it’s no surprise to see that they have been leading games for just under 25% of the available minutes. This compares rather unfavourably with the 40% and 50% of available game time that they led in each of the two previous seasons.
Teams naturally press more aggressively when they are trailing and sit back a little deeper when they are in control of a game. Given this context of game state, BVB’s pressing figures this term look even more worrying and this is something that Klopp should try to understand during the Winter Break. Assuming the aggressive press is still part of his gameplan he needs to troubleshoot what exactly has been going wrong with it in this campaign.
Lack of Pressing from Individual Players
The pressing metric I used above is calculated and assessed on a team level. I don’t use it at a player level as although I know which player has performed the defensive action (tackle, challenge, interception or foul) I have no way of knowing which of the attacking players were in the vicinity of the area of the pitch at that time and therefore could have made a defensive action.
For the purpose of this analysis I wanted to drill down to player level to try to see where the reduction in pressing was coming from. The following tables includes all BVB players that played at least 40% of minutes and had an average Opta x co-ordinate of greater than 45 (based on all touches across the season). In Opta parlance x=50 is halfway, so I wanted to remove all the defensive players for the purpose of this analysis.
It is important to note that to simplify the analysis I am also only including defensive actions that took place in the opposition half (the main PPDA metric includes all passes and actions for x > 40 so these values will be different to the overall PPDA figures).
Last season (2013/14) appears first:
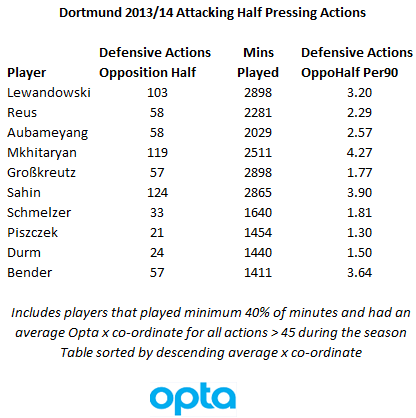
The table is sorted by pitch verticality, so the players at the top of this table played highest up the pitch. Lewandowski was reasonably busy at the top of the pitch with 3.2 defensive action and Mkhitaryan was exceptionally busy with almost 4.3 actions per 90 in the opposition half last season.
Fast forward 12 months and the table for the current season appears as follows:
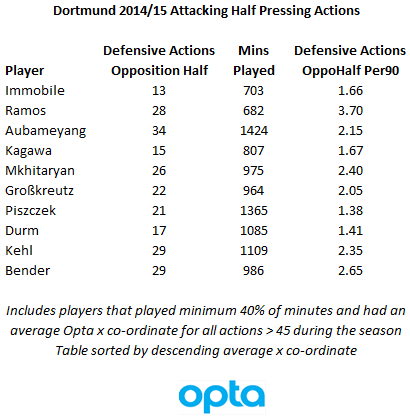
Adrian Ramos has fitted right into the Dortmund way of playing with a very impressive 3.70 defensive actions per 90 in the opposition half. Unfortunately, the rest of the individual pressing numbers are more disappointing across the board.
As the player that plays furthest up the pitch, Ciro Immobile’s figures poor pressing figures are probably the most notable, but the Italian is not alone. Most of the players are exerting less pressure on the opposition in high areas of the pitch this season; examples include Mkhitaryan decreasing from 4.27 defensive actions to 2.40 and Aubameyang down from 2.57 per90 to 2.15 during this season.
I ensured that these pressing numbers aren’t being skewed by the volume of opposition passes as there has just been a 1% change (out of 285) in the number of passes per game the opposition teams have played in their own half this season compared to last season.
There’s definitely something in the water at the Signal Iduna Park that has diluted the high tempo, aggressive pressing system favoured by previous Klopp teams. While teams like Roger Schmidt’s Bayer Leverkusen and Hamburg have increased the intensity of their high press and Bayern Munich have managed to maintain their position as the gegen-pressing kings it looks as if Dortmund are unfortunately sliding in the other direction.
Perhaps BVB have sold one star player too many to their more vaunted rivals or suffered one too many injuries. But whatever the reason Klopp will need to arrest this decline unless he dramatically changes the tactics that have served Dortmund so well in recent seasons.
Defensive Numbers
As well as underperforming our Expected Goals model going forward, BVB have been in the unfortunate position of also being on the wrong end of things from a defensive point of view.
Some of Dortmund’s defensive lowlights:
- 15% of all shots taken against them have been scored (this is the highest in the league)
- Allowed 6.3% of shots taken from outside the penalty area to be scored. The league average is 3.6% and only Leverkusen (7.5%) have conceded a higher percentage this season
Our model expected Dortmund to concede approximately 16.5 goals so far this season; however they have conceded 26. The vast majority of these “additional” goals don’t seem to be due to exceptional strikes from opposition forwards as our after-shot ExpG model attributes just 17.5 goals to the shots faced by the two goalkeepers used by Klopp this season. Very simply, Dortmund’s two goalkeepers have had a season to forget thus far.
Weidenfeller, who started the season as first choice conceded 18 goals compared to the 13.2 goals suggested by our after-shot ExpG model. Weidenfeller then fell out of favour and was replaced at the end of November by Langerak, but unfortunately for BVB, Langerak’s shot stopping figures are even worse than Weidenfeller’s as he has conceded 7 goals versus the 4.20 suggested by our model.
It’ll not be of much comfort to Klopp right now, but even when adjusting for shot location and placement, there is enormous volatility in saves made by goalkeepers in any given sample of shots. In an in-depth look at this subject a couple of months ago I discovered that over a sample of 75 on target shots (which is just about as many as the BVB goalkeepers have faced during this campaign) there is almost no correlation in saving performances between consecutive sets of shots. As football fans it may be difficult to accept, but over half a season the shot stopping performances of top flight goalkeepers tend to be mostly noise.
There is very little predictive utility in a small number of on target shots faced, so the poor performance of the two Dortmund goalkeepers will more than likely have very little bearing on how Dortmund defend shots against them in the second half of the season. Even if they were to face the same shots again, the laws of probability would suggest that their goals conceded figure would look a lot smarter than it currently does.
Conclusion
Based on their underlying performances, Borussia Dortmund can count themselves very unfortunate to be second bottom of the Bundesliga table at the mid-season break. Even if their performances didn’t improve on what they have exhibited to date I see only a small chance of them being in relegation trouble at the end of the season.
This doesn’t mean that everything is perfect. There are certainly areas that the coaching staff should work on; these include correcting the drop in shot quality and the lack of pressing which can be seen by lower defensive actions from most of the attacking members of the team.
However, there are probably as many, if not more, aspects that have negatively impacted on BVB’s results which are outside the immediate control of the team management. The succession of injuries to their key personnel, their horrible rate of saving opposition shots while seeing goalkeepers performing above average at the other end of the pitch and the apparent desire for their marque players to leave the club for sexier destinations count amongst them.
I simulated the remaining fixtures in the 2014/15 season using our prediction algorithm which generated the following final league position probabilities:
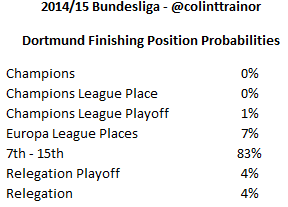
With an 8% chance that BVB will see themselves fall into the bottom three places at the season’s end and just a 1% probability that they can finish in the Top 4 it looks like the Black and Yellows have little more than pride to play for during the remainder of the season. In fact, given recent media speculation, whether Jürgen Klopp remains in place to see out the rest of the season at the head of the Good Ship BVB seems to be less likely than them retaining their place in next season’s Bundesliga.