“Three things can happen when you pass, and two of them are bad.” The origin of the old nugget of coaching wisdom is in dispute. Big Ten country would claim Woody Hayes, the South would posit Darrell Royal.
Regardless of who said it first, the phrase stuck and pervaded the football world for years and years. With some notable outliers (ahem, LaVell Edwards and BYU, ahem), running the ball was king. "Three yards and a cloud of dust" was just how football was meant to be played.
Fast forward to 2022. Offensive records are being broken every year. The NCAA record of passing efficiency (not at all the be-all-end-all metric, but still) has been broken each year for the past six seasons. Last season Bailey Zappe set the NCAA record for yards and touchdowns in a season. Knowing how to have an effective, and explosive, offensive passing game has never been more important.
Earlier this week, Seth Partnow introduced some of the ways in which StatsBomb data can help examine the quarterback’s role in the passing game. Seth demonstrated how our heatmap tool could help visualize where a given quarterback tends to throw the ball. As shown, Brennan Armstrong of UVA threw the ball over the middle of the field, especially around the hashes, a lot last season:
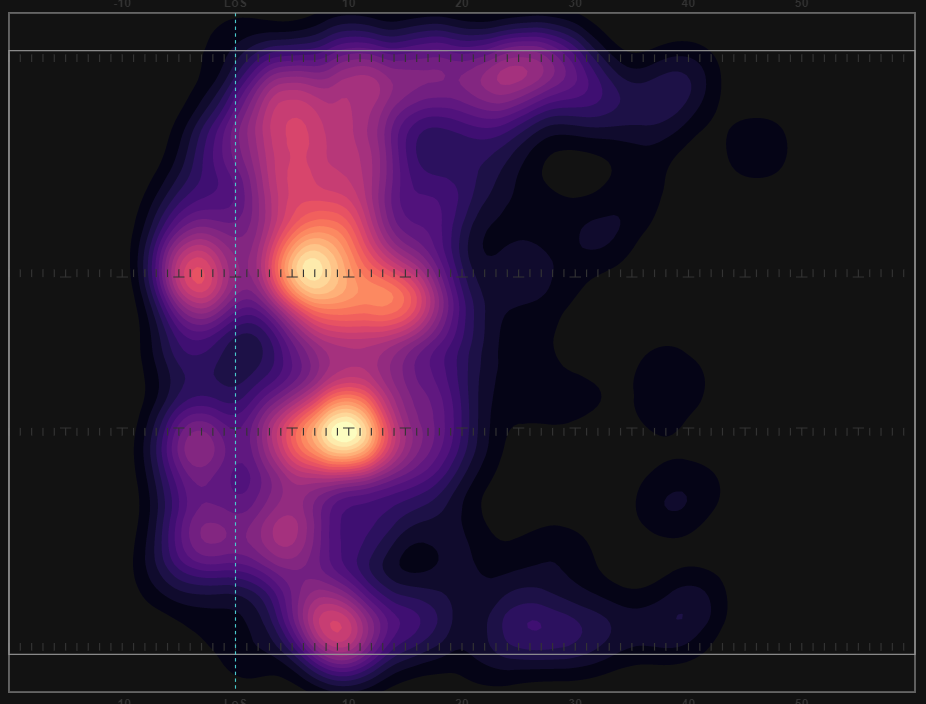
But the location of a pass’s target only tells part of the story of a team’s passing attack, so today I want to dive a little deeper into how the info we provide can help teams and coaches build a better passing game plan.
Let’s look at what was happening over the middle of the field for the University of Virginia last season.
Route Trees
How does a team target the middle of the field? Let’s look at the passes of players that have to go the shortest distance to get to the middle of the field: slot receivers and tight ends. Last week, I referenced looking at routes run by a specific player - UVA wide receiver Billy Kemp - from a specific area on the field. The chart had all of the paths the player took and was broken down by color based on if he was targeted or not.
Our Route Trees go one step deeper and classifies those runs by route type.
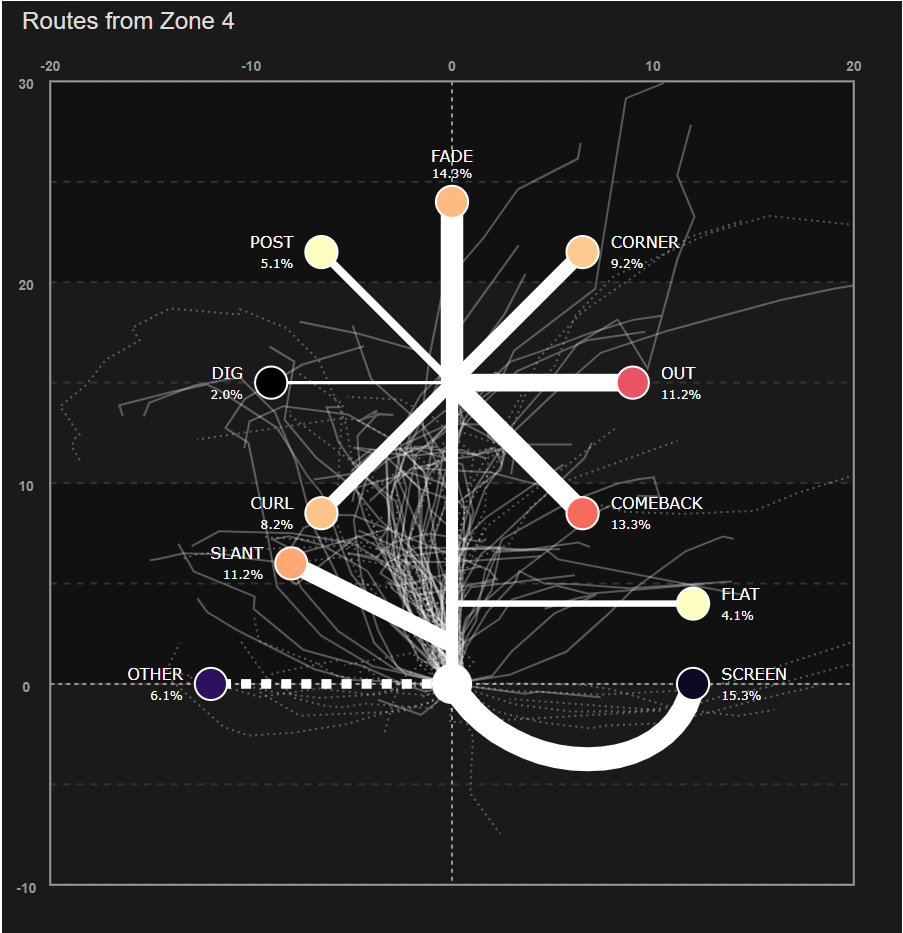
As we can see, many of Billy’s routes that had him going over the middle of the field were slants, seams, or comebacks, with a few posts and digs mixed in. Combining the target information from the chart last week with this information gives you more context about how Billy is being included in the passing game over the middle of the field.
Pass Placement
Going back to Brennan Armstrong. One of his favorite targets last season was tight end Jelani Woods. A 6'7", 250 pound matchup nightmare for opposing defenses that went on to be a third-round pick for the Indianapolis Colts in the 2022 NFL Draft.
The diagram below shows Jelani’s targets over the middle of the field. Using this, you can get a feel for both a quarterback’s accuracy, and a receiver’s catch radius. At 6'7", you might think it hard to throw high on a target that big, but you have the ability to place the ball high because he is able to get hands on the ball where the opponents guarding him would not.
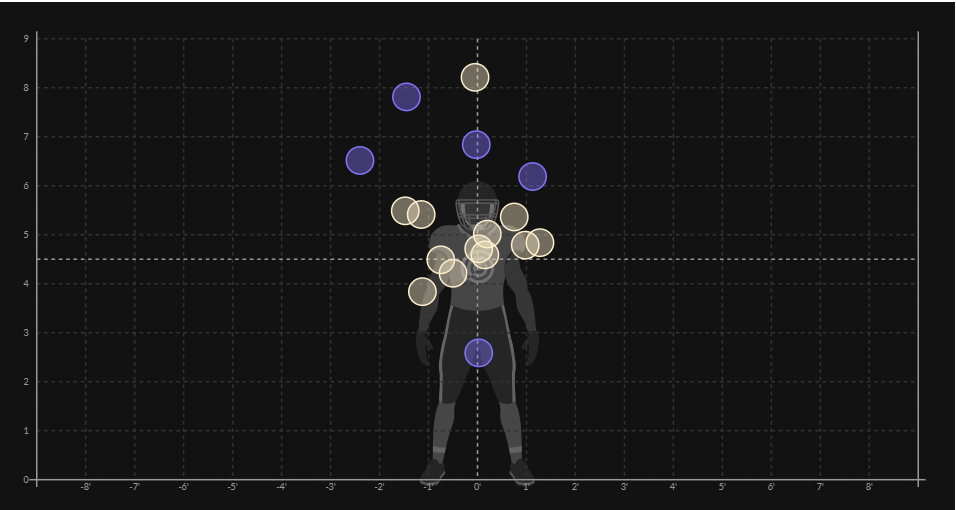
From this, we can see that the connection from Brennan to Jelani was consistently good when the ball was thrown close to “center mass”. Jelani had one nice catch on a high ball, but the pair struggled completing passes when they were away from Jelani’s body. These could have been dropped by Jelani, or maybe broken up by a defender. A coach could take a look at why those passes were incomplete and see what can be done to give the players a better chance at completing those passes in the future.
Play Example
It's one thing to have the best football data in the space. But it's another to have world class data scientists who can take the data and turn it into even deeper insights and models.
Thanks to the work of StatsBomb Senior Data Scientist Will Morgan, we're getting close to being able to derive physical and athletic performance insights - speed, acceleration and separation - from the raw StatsBomb football data. The play below shows some of what his model allows us to see:
There's a whole load of information here that can be used to gain an edge:
- Who is getting to top speed on gameday
- How quickly they are able to get to top speed in routes
- How good wide receivers are at creating separation
- What play concepts help get wide receivers in space
And that's only scratching the surface.
People often like to talk about “cheat codes” in football. Play Action is a cheat code, 12 personnel with versatile tight ends is a cheat code, etc. Information is the real cheat code. With the most detailed and in depth data on the market, coaches can find ways to take advantage of their teams unique personnel, as well as how to best attack opponents.
I can’t wait to see how that plays out on game days this fall!
Matt Edwards
Head of American Football Analysis - StatsBomb
matt.edwards@statsbomb.com
@thecoachedwards on Twitter
