When we first launched StatsBomb Data, we were excited to introduce pressure events, when a player closes down or blocks a passing lane. This was in response to a common complaint about event data, that it only captures what's on the ball - with StatsBomb Data you're able to find out much more about the defending team's positioning and pressing triggers than with previous datasets. But pressures are a slightly blunt instrument - actions are either under pressure or they're not, there's no grey area in between.
StatsBomb 360 gives you a much better window into what a defensive team is doing and where, so today we're going to put our raumdeuter hats on and look at where teams allow or deny raum, and which players are good at deutering it. We can do this because 360 gives you teammate and opponent positions on every single event, and so finding how much space a player has while performing an event is as simple as measuring the radius to the nearest defender, like so:
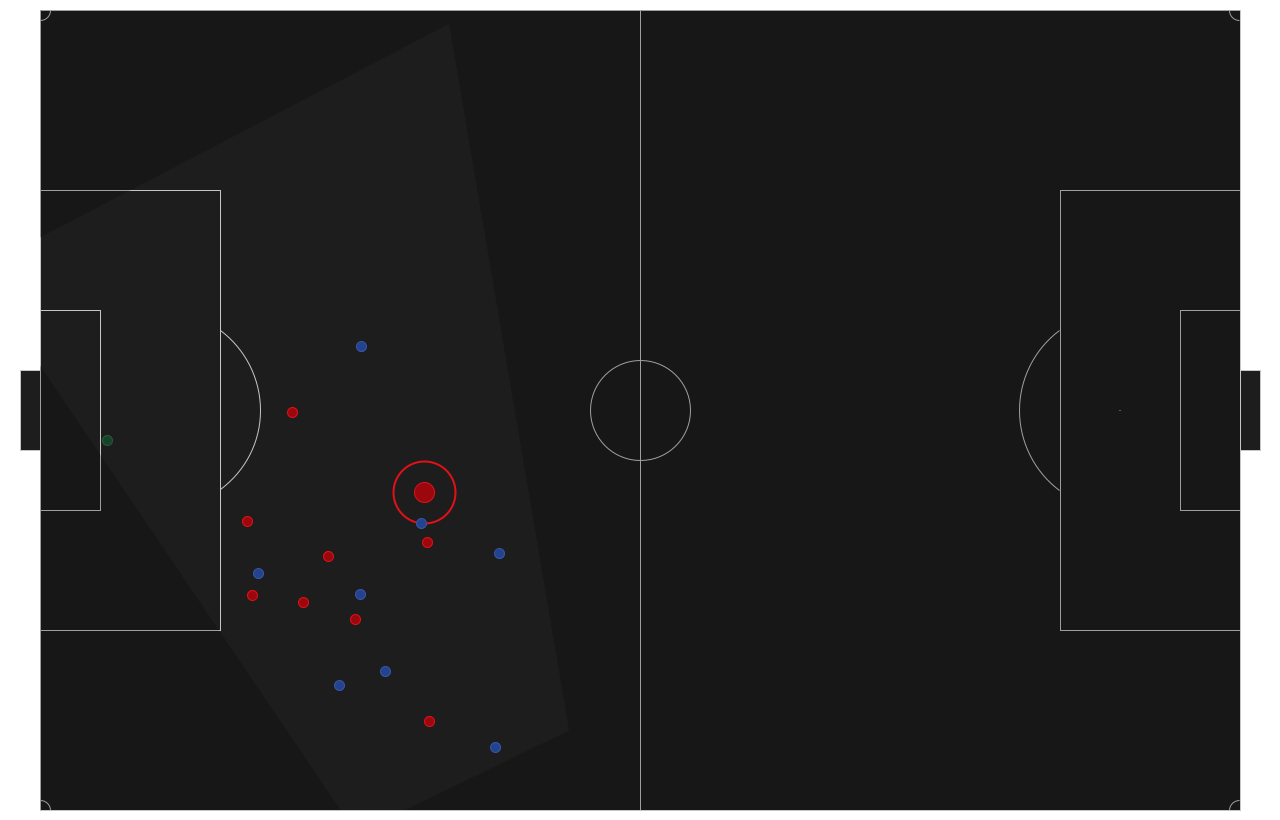
You don't have to do this yourself though, we'll be adding the distance to the nearest defender (both any defender and the nearest goalside one) in the 360 dataset for the new season. To give some context, let's look at each position in a typical formation so you know how much space they're working with on average:
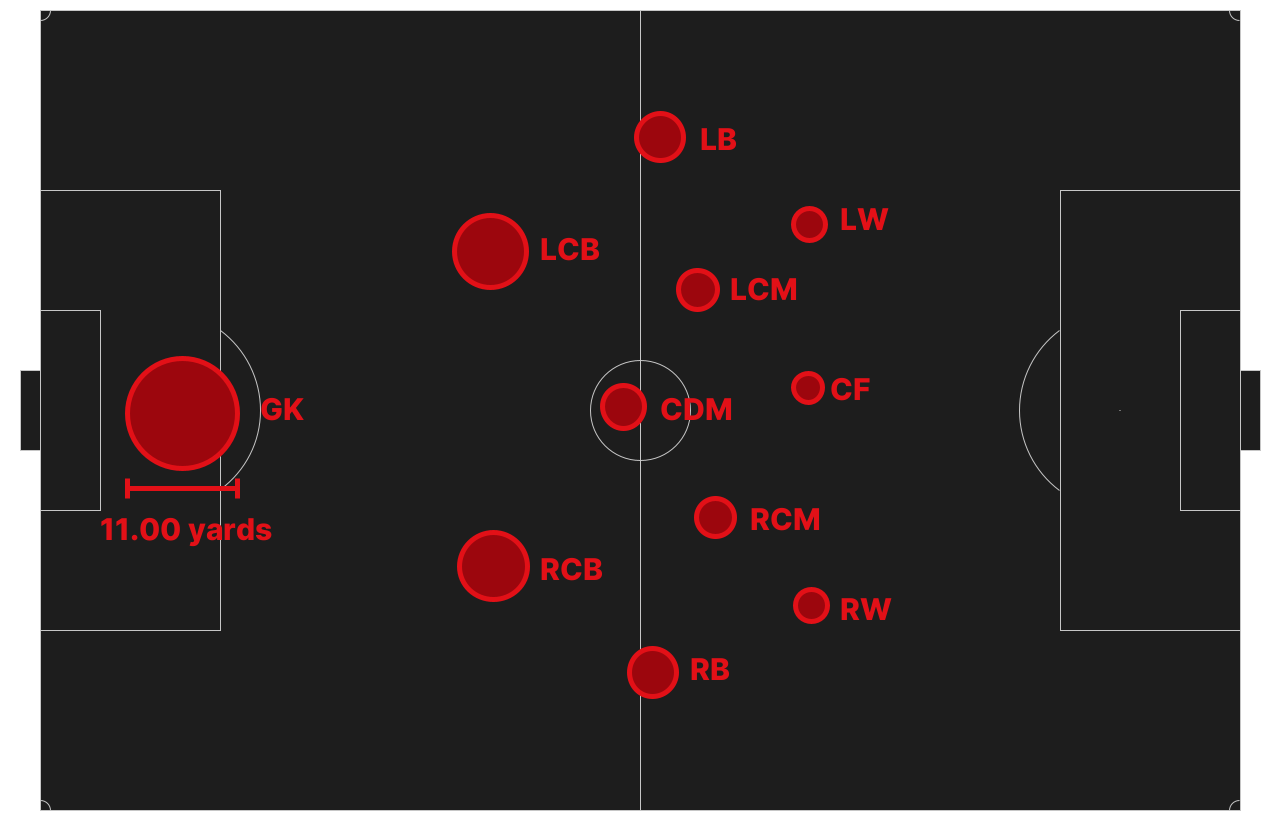
As you'd expect, the closer to the business end of the pitch, the less space to work in. This isn't a particular revelation, so let's spend some time looking at some specifics about teams and players.
Team Pressure
Here are last year's EPL teams plotted by how much space they allow compared to the league average in various zones on the pitch. Picture yourself as the opponent, attacking upwards, with pressure coming from each particular team top to bottom. Red means less space to operate in, blue means more:
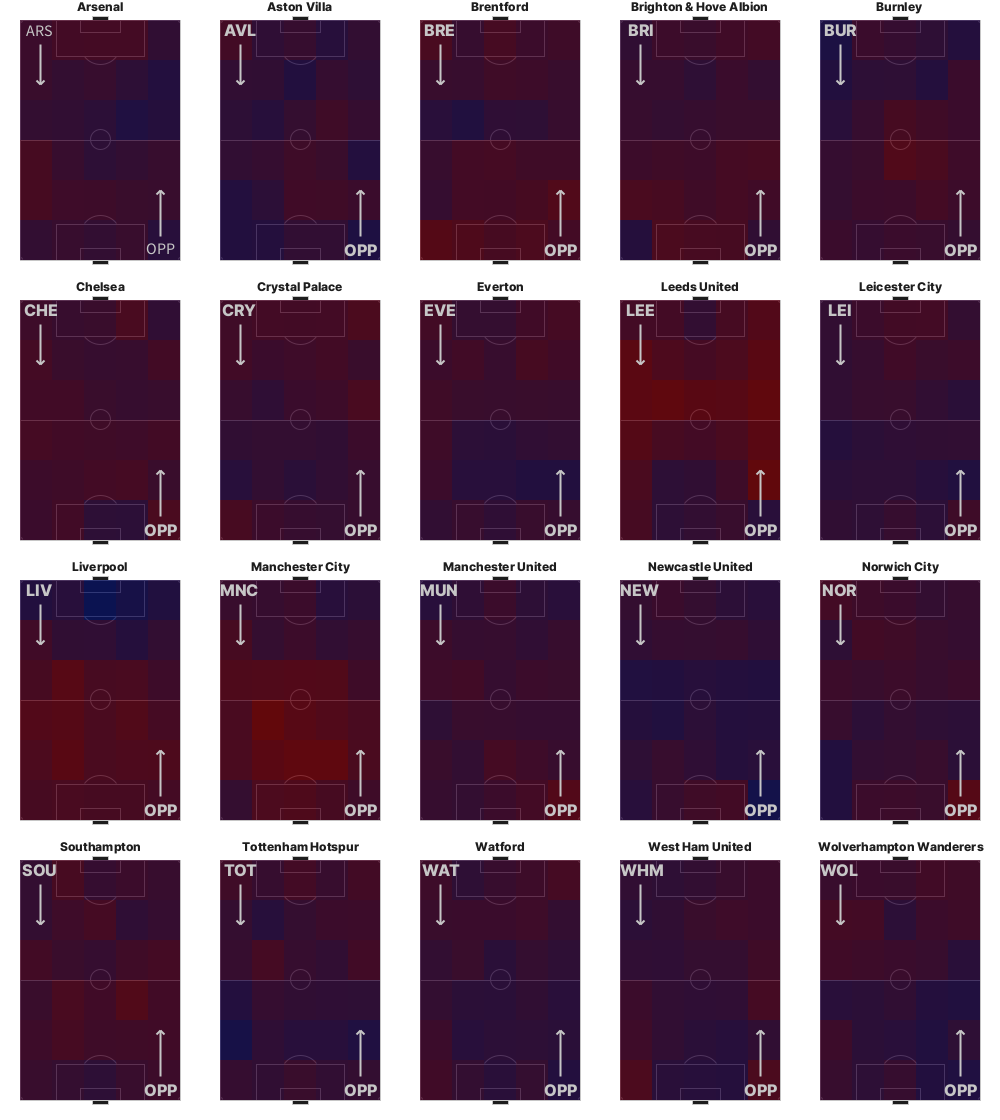
There are some interesting highlights here:
- As you'd expect, the big counter-pressing teams like Liverpool, Man City and Leeds show up fairly red.
- A few teams that struggled last year (Newcastle, Everton, Watford etc) are notable for allowing a lot of space in their opponents' half.
- Liverpool leave a lot of space at the back! On the whole, if you manage to beat the press and mount an attack, you're not facing many defenders and Liverpool are relying on Alisson to bail them out.
- There are some interesting openings here, for example down the right wing against Arsenal and the left against Burnley.
This is just a very simple overview of averages, but if you spent time with the 360 you'd quickly be able to start revealing much more detail about team's pressing triggers etc.
Space & Value
As we saw above, closer to an opponent's goal you have less space, but these are the more valuable areas to attack. Let's have a look at the space/value tradeoff and see which players perhaps stand out in the ability to create space in valuable areas or succeed in tight spaces. This chart shows various players, with their position on the X axes showing the average space in which they receive passes, and the Y axis showing the average OBV value for their team upon receipt:
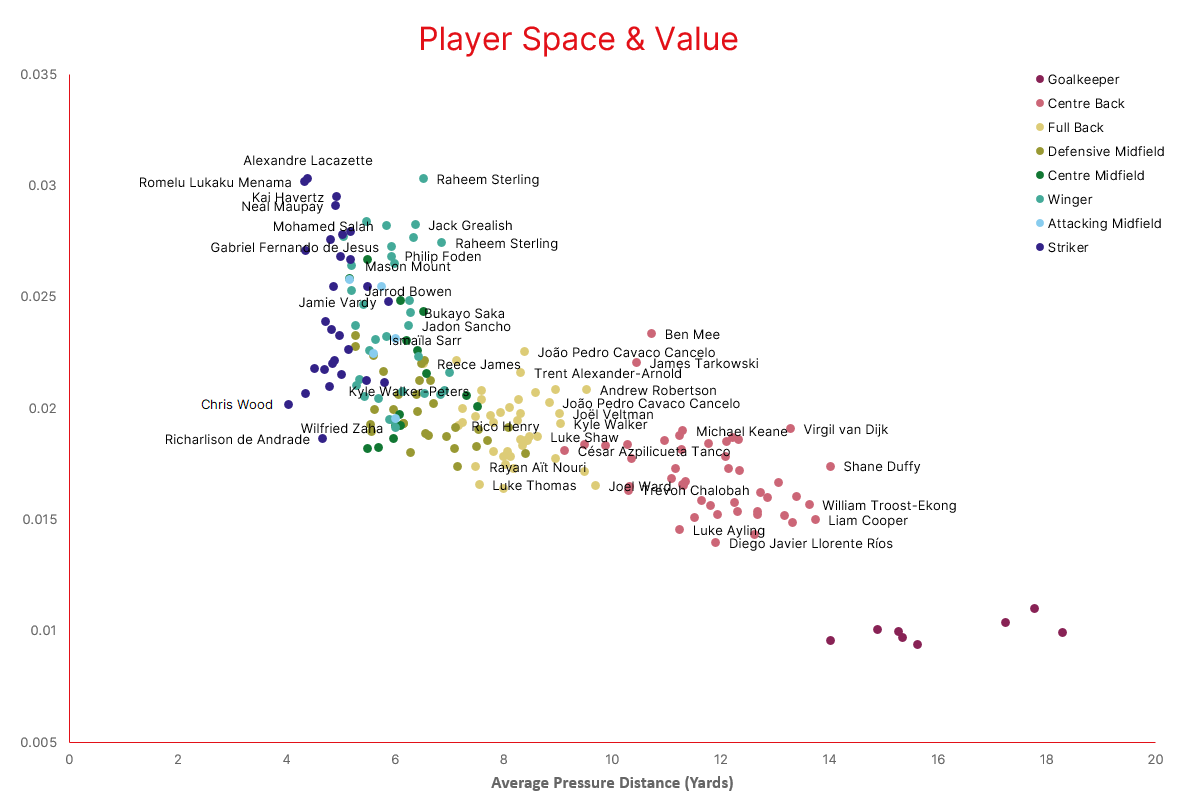
As you can see, the relationship is mostly linear - defending teams pressure the ball in direct relation to how dangerous a situation is. But it's interesting to spot a few players riding high or low above the line:
- Raheem Sterling stands out as operating in highly valuable spaces but with a lot more space than others. He actually appears twice, on two different wings, so it'll be interesting to see how he's deployed at Chelsea.
- Jamie Vardy finds himself in space more than most strikers, as you'd expect from someone connecting onto a lot of direct counter-attacks.
- Contrast players like Lacazette and Lukaku who operate in tight, high value spaces, with Chris Wood and Richarlison who gain barely any more space in much lower value spaces.
- Note Ben Mee and James Tarkowski of Burnley pushing further forward into smaller more valuable spaces than most centre backs.
- See Alexander-Arnold and Cancelo pushing into tighter spaces and generating value compared to many wide defenders.
However, just a raw plot of these values doesn't tell us very much. We're much more interested in specifically where players are operating with the ball, and whether they manage to find additional space in those values. If we could build a model to measure this, we might be able to start valuing a player's off-ball movement, in a way that's impossible with current event data.
To do this, I built a model called Space eXpected, or XSpace for short. Let's see if it blows up on the launchpad.
XSpace
The model is a pretty simple gradient boosted trees approach that takes in some simple features like the type of action, where on the pitch an action takes place, some player positional info, the current OBV situation and the identity of the opposition, because different teams allow different amounts of space in various zones. We train this on passes, carries, receipts and shots. In the ideal world the model would also take into account your own team's ability to create space, so we could measure that independent to individual players, but this will do for now.
We can then compare the XSpace of each action with the actual distance to the nearest defender. I use a simple ratio of real space to expected space to measure Space Above Expected, or SAX. Who are the best SAX players?
Top 10 attackers
Here's the list of the best creators (wingers, AMs etc, excluding strikers):
| Player | SAX |
|---|---|
| Raphinha | 1.19 |
| Michael Olise | 1.18 |
| Raheem Sterling | 1.16 |
| Bruno Fernandes | 1.16 |
| Gabriel Jesus | 1.15 |
| Manuel Lanzini | 1.14 |
| Riyad Mahrez | 1.13 |
| Daniel James | 1.13 |
| Pablo Fornals | 1.12 |
| Jack Harrison | 1.12 |
Sterling stands out here like before, but he's beaten out by new Barcelona man Raphinha (so good at finding space he can even find room in Barcelona's budget). Leeds' other winger Jack Harrison also makes the top 10, clearly highlighting some team effects here. Also near the top is 20-year-old Michael Olise at Crystal Palace, who has been cashing in well on the space he's given, as he also appears in the top 10 for assists per 90 last season. Olise has been subject to rumours about a move to Newcastle in recent weeks.
We can visualise where these players are finding room in the space map below, each circle representing an action and the distance to the nearest defender, which brighter red being more space above expected and more transparent blues being less:
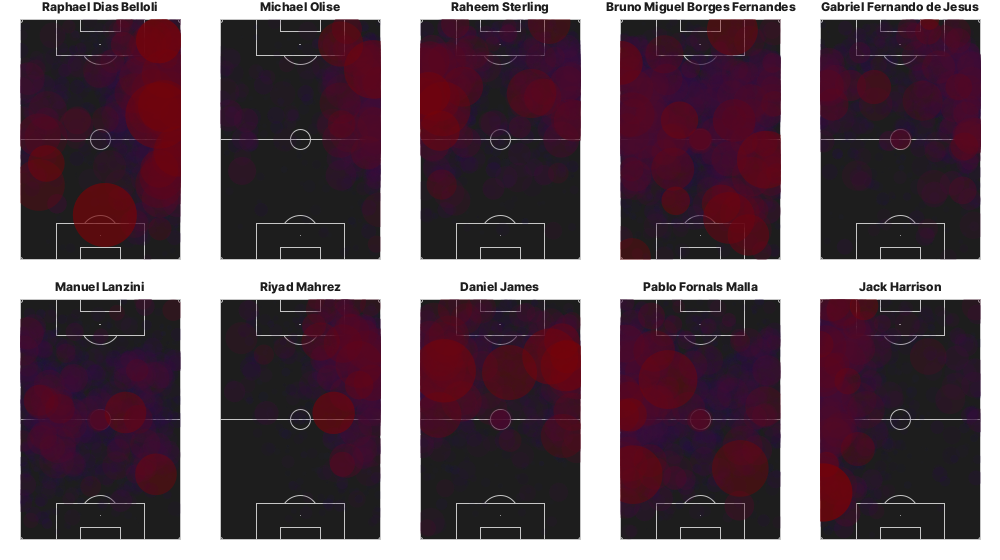
Yes, after two years of pandemic this looks a little like something untoward growing in a petri dish but garish shapes are my bread and butter. Hopefully there's enough signal to noise here:
- Raphina, Olise and Mahrez finding good space on the right.
- Jack Harrison the best leftie on the list.
- Sterling and Daniel James operating on both wings and also finding regular space in the box.
- Gabriel Jesus notably popping up above expectation despite some tight spaces.
- Bruno Fernandes finding space everywhere.
- West Ham duo Lanzini and Fornals finding space deeper on the pitch.
Top 10 full-backs
Here are the top full-backs:
| Player | SAX |
|---|---|
| Andrew Robertson | 1.28 |
| Aaron Cresswell | 1.20 |
| Joel Ward | 1.18 |
| Kyle Walker | 1.17 |
| Ben Johnson | 1.13 |
| Konstantinos Tsimikas | 1.12 |
| Joël Veltman | 1.12 |
| Matt Ritchie | 1.11 |
| Vladimír Coufal | 1.11 |
| Kieran Tierney | 1.11 |
And here's the space map:
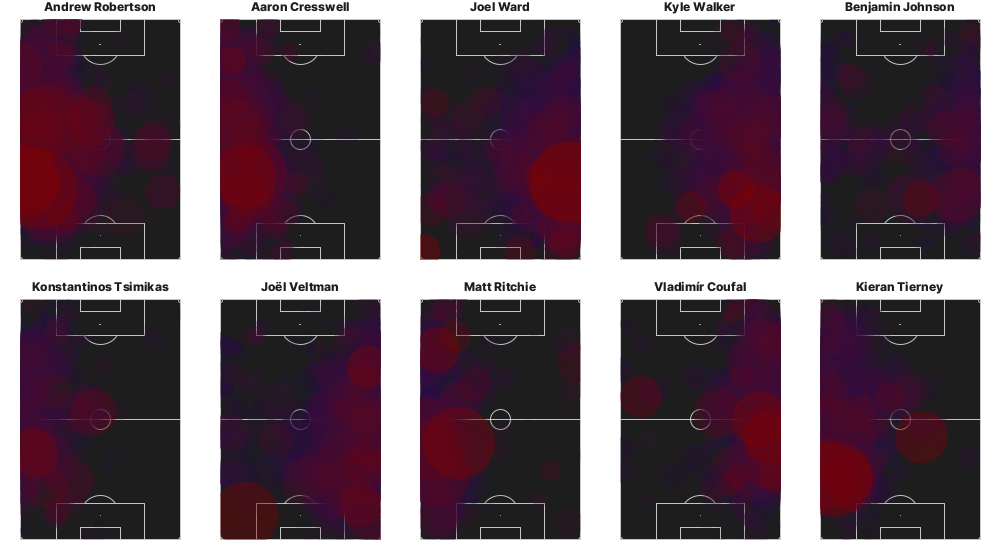
Sad to see Robertson here and not Alexander-Arnold, but this isn't to say TAA isn't creating value. In fact if anything, he's such a known quantity in attack that he probably draws a lot of pressure, and perhaps this benefits his teammate on the other wing. Either way, Robertson is clearly excellent up and down the length of the pitch. Tsimikas deputises ably, but you can see a clear difference in magnitude between the two.
Conclusion
It's important to note that whatever you think of the results here, and of xSpace and SAX themselves, they are only possible because of the existence of StatsBomb 360. There's a huge wealth of knowledge waiting to be unearthed in the dataset, as already shown in James Yorke's recent piece about line-breaking passes, and we've got much more to come as we delve deeper and ship new data to our existing 360 customers.
