StatsBomb and radars will forever be inextricably linked. While we cannot claim to have invented radar plots -- sometimes also known as spider charts -- we were the first to use them in any meaningful way in a football context, and it was certainly us who popularised their use to the point that they have now become almost ubiquitous within the game.
EDIT: New versions of the radars were created in Summer 2023. The new explainer article can be found here.
So why radars? What's wrong with analysing data via tables or bar charts? The short answer is that radars are more engaging. They create shapes that brains want to process. Once you get used to what they show and how they display it, they can be interpreted far more quickly than a table of numbers or a simple bar chart.
From the start, we’ve been conscious of their limitations -- as summarised here -- but we still believe they represent one of the best ways of efficiently visualising the statistical output of a player. That is not to say there aren’t valid alternatives. In early 2020, amongst various updates, we added distribution plots to the range of visualisation options in our analysis platform StatsBomb IQ.
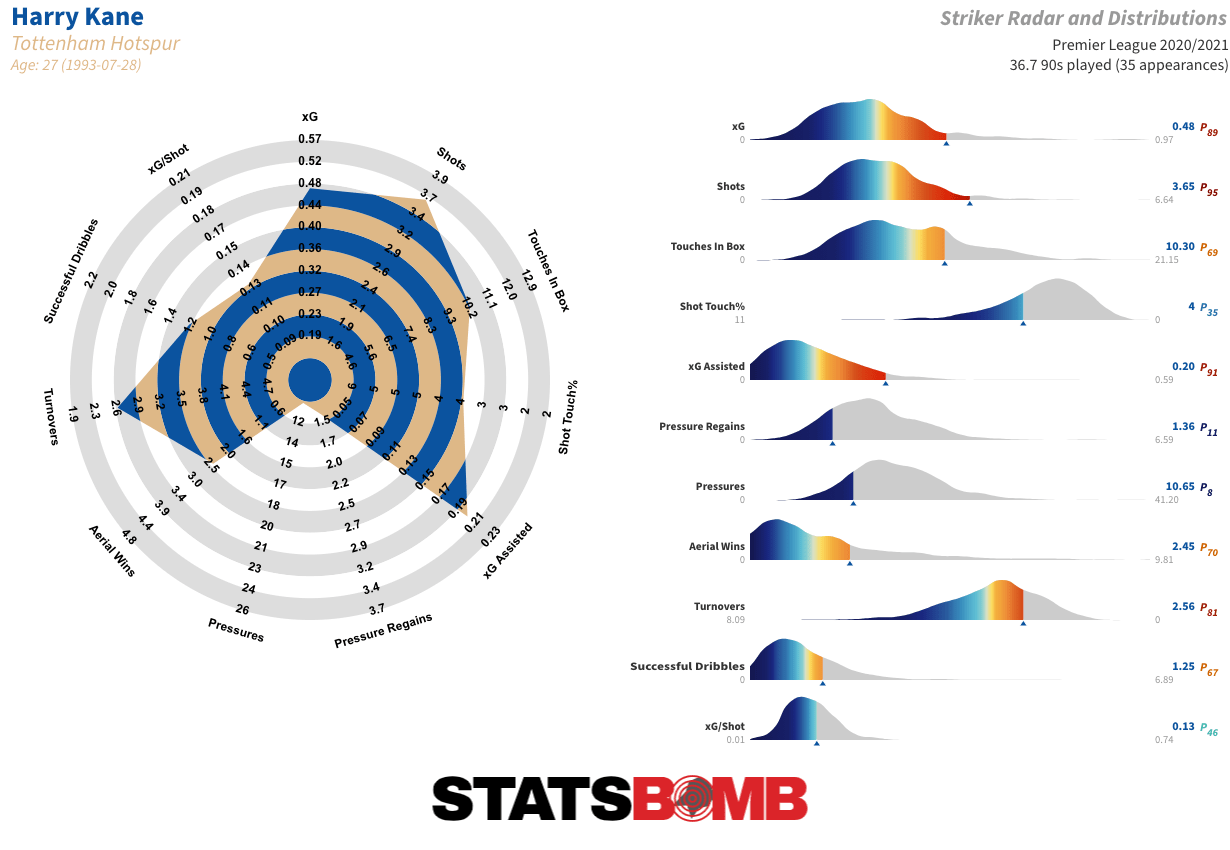
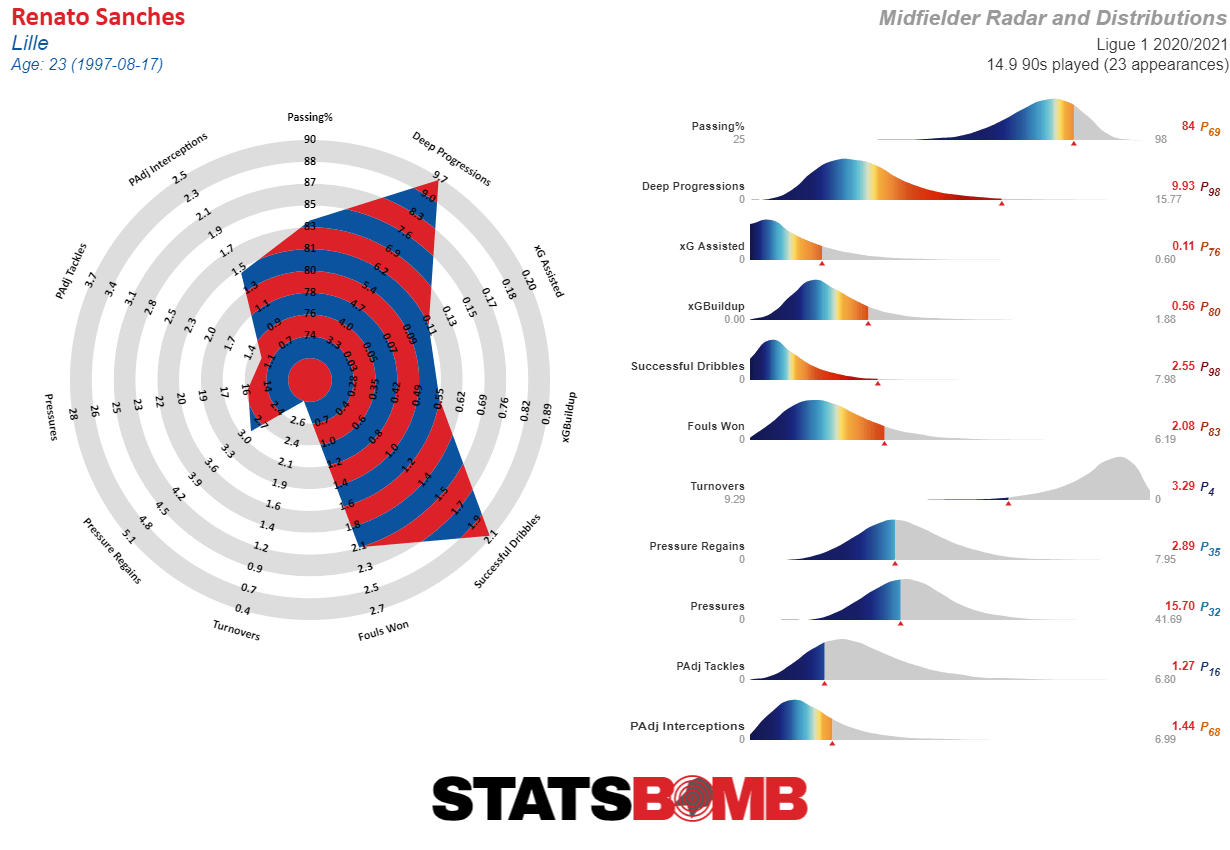
The two can now sit side by side:
So how should our radars be read? We’ll get on to an explanation of the included data points and metrics later on, but here are some universal things to have in mind:
- The radar boundaries represent the top and bottom 5% of all statistical production by players in that position across various seasons of data from the top five European leagues: Bundesliga, La Liga, Ligue 1, Premier League and Serie A
- When we make reference to xG, we are talking about expected goals, the most widely used advanced metric in football analysis. In simple terms, xG models take into account various factors and variables -- distance to goal, angle to goal, body part, assist type... and exclusively in the case of StatsBomb data: location and status of the goalkeeper, location of the defenders and attackers, shot impact height -- to assign a value between 0 and 1 to each shot based on the historic conversion rates of shots with similar characteristics
- All of the relevant data points and metrics on our radars are calculated on a per-90-minute basis. This is a practical way of normalising outputs across players who have seen varying amounts of game time. Here is an introduction to the 'Per 90' Metric.
- We also adjust a number of the defensive metrics to account for the amount of possession the player's team has. Again, this is a practical way of normalising outputs across players to account for their opportunity to accumulate defensive actions. Here we introduce posession-adjusted player stats. Here we discuss possession adjusted defensive stats.
- It’s worth noting that not all of the data points and metrics included on the radars measure the quality of the player or their output. Many of them are stylistic markers, particularly in the case of defenders
Positional Templates
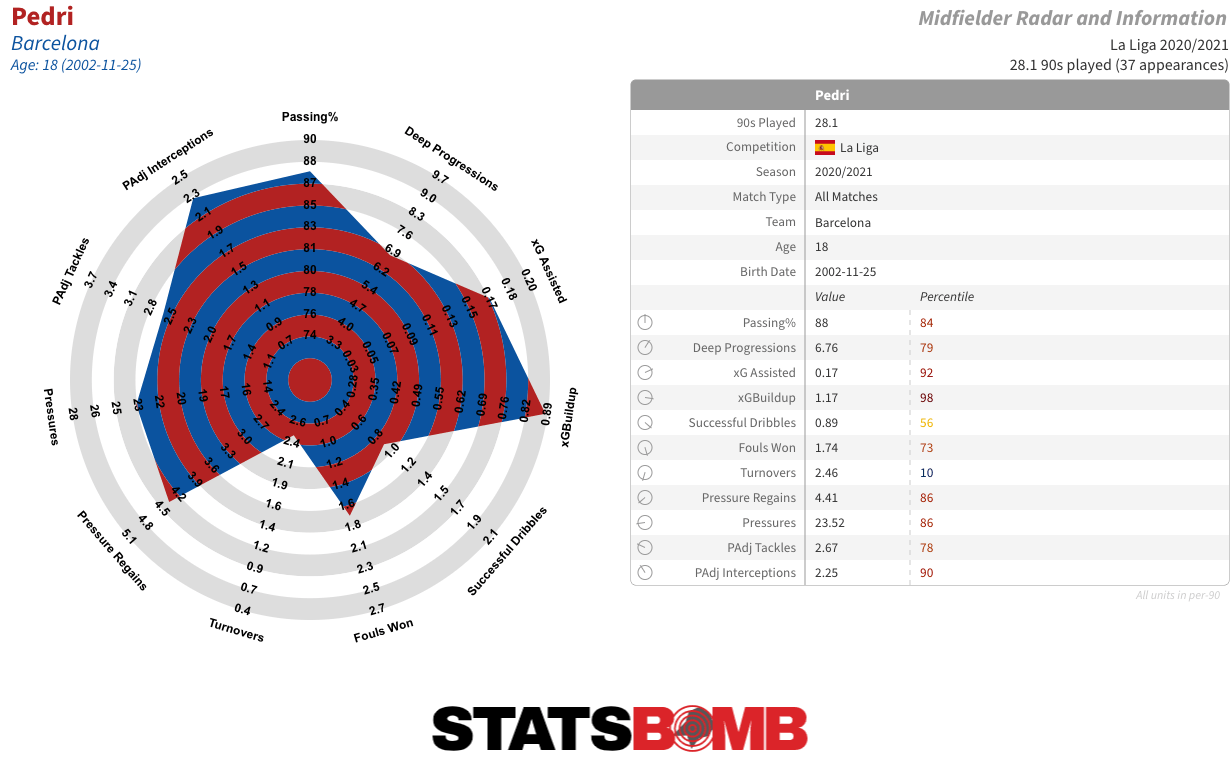
StatsBomb IQ comes preloaded with radar templates for each of the five main outfield positions: centre back, full back, midfielder, attacking midfielder/winger and striker. These include some of the data points and metrics we consider most important for each position.
But we also know that our customers don’t want to be restricted to predefined templates, so we have added a variety of customisation options. Users can create their own custom templates by selecting the data points and metrics they want to include, setting new upper and lower boundaries for each of them and amending the playing positions that are taken into account for the distributions.
A couple of examples of the utility of these customised radars in terms of player recruitment can be found here and here.
But going back to the standard positional templates, the ones you’ll most often see us share in our articles and on social media, here is a breakdown of the data points and metrics included in each of them.
Centre Back
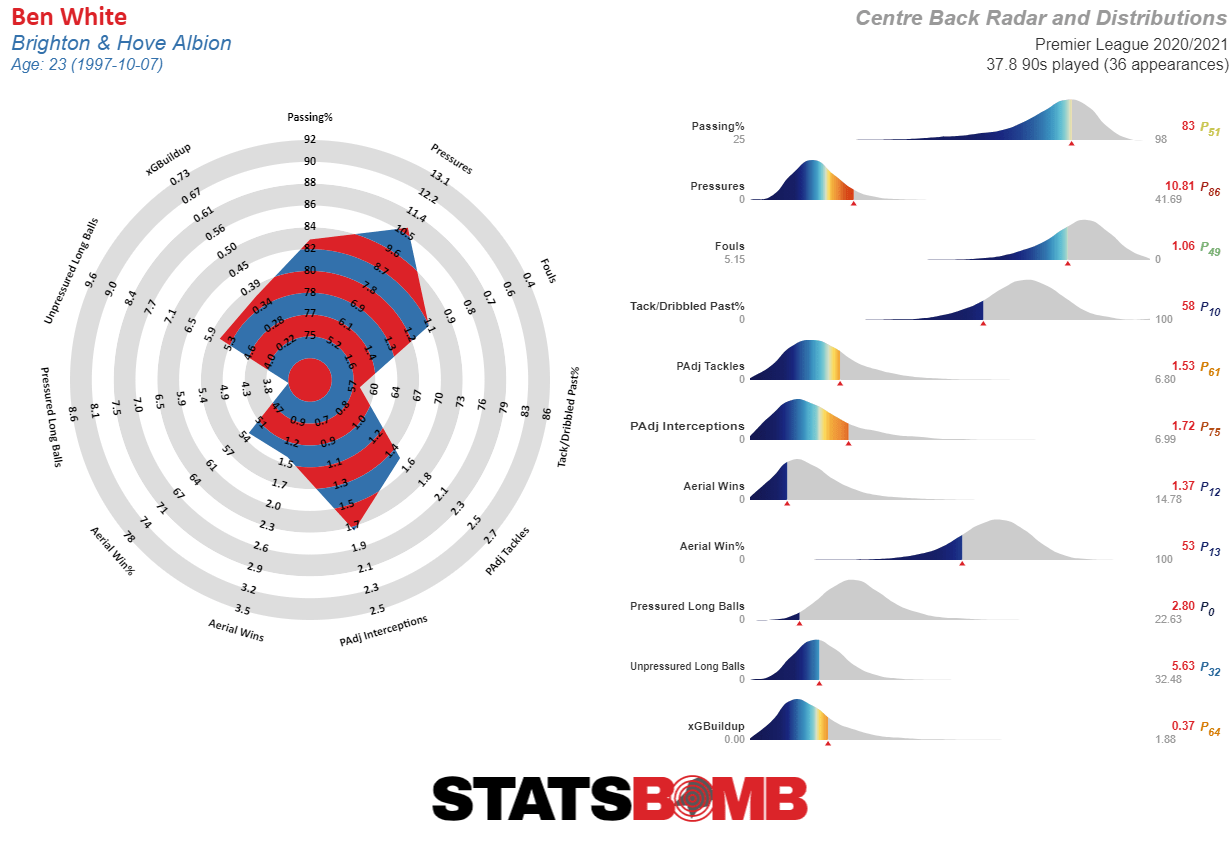
- Passing %: Percentage of all passes attempted that were completed
- Pressures: The number of times a player pressures an opposition player
- Fouls: How many fouls a player commits
- Tack/Dribbled Past%: Percentage of times a player makes a tackle when going into a duel vs. getting dribbled past
- PAdj Tackles: Number of tackles adjusted proportionally to the possession volume of a team
- PAdj Interceptions: Number of interceptions adjusted proportionally to the possession volume of a team
- Aerial Wins: Number of aerial duels a player wins
- Aerial Win%: Percentage of aerial duels a player enters that they win
- Pressured Long Balls: Number of clearances or long balls attempted while under pressure
- Unpressured Long Balls: Times a player plays a long ball while not under pressure
- xGBuildup: A model that attributes the xG value of the final shot to all players involved in the entire possession. While another metric named xGChain attributes this value to all players involved in the entire possession, xGBuildup omits xG and xG Assisted to focus on possession work prior to the end of the chain
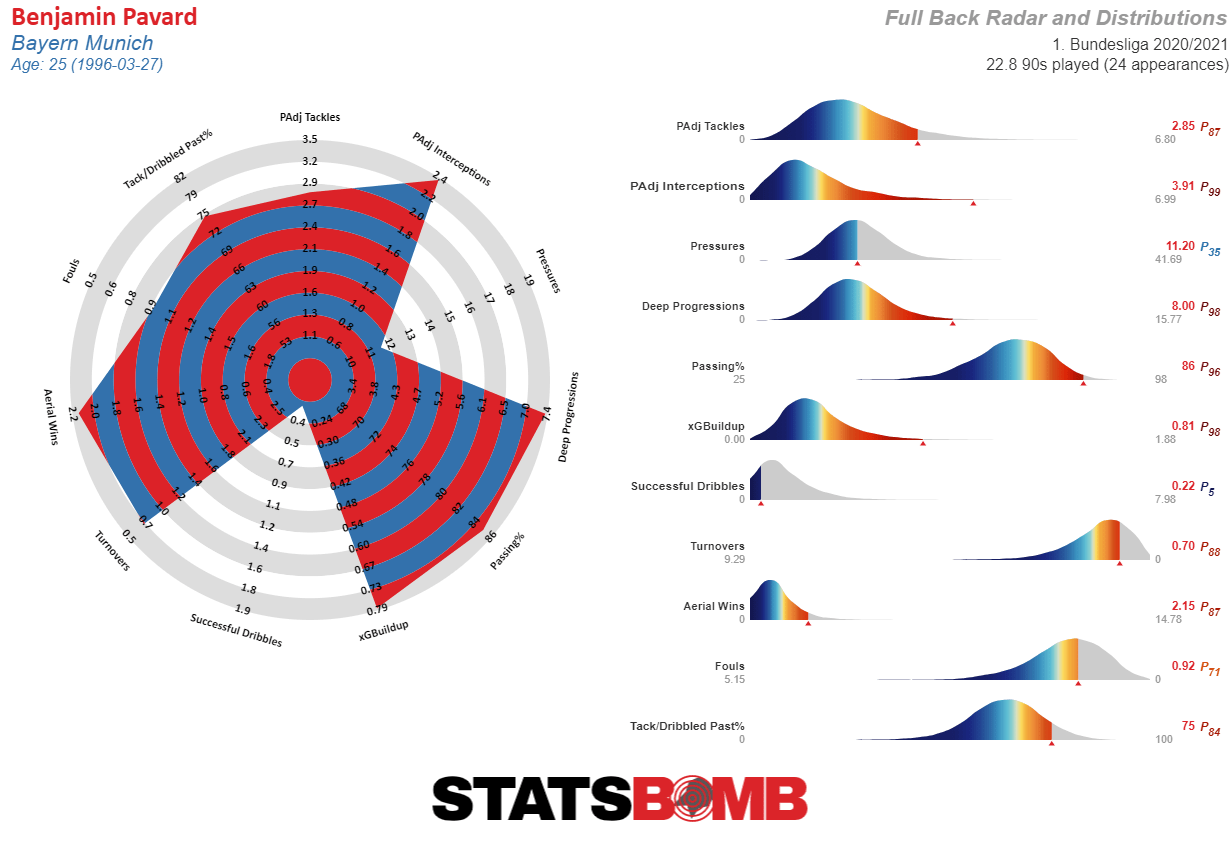
- PAdj Tackles: Number of tackles adjusted proportionally to the possession volume of a team
- PAdj Interceptions: Number of interceptions adjusted proportionally to the possession volume of a team
- Pressures: The number of times a player pressures an opposition player
- Deep Progressions: Passes and dribbles/carries into the opposition final third
- Passing%: Percentage of all passes attempted that were completed
- xGBuildup: A model that attributes the xG value of the final shot to all players involved in the entire possession. While another metric named xGChain attributes this value to all players involved in the entire possession, xGBuildup omits xG and xG Assisted to focus on possession work prior to the end of the chain
- Successful Dribbles: How often a player successfully dribbles past an opponent
- Turnovers: How often a player loses the ball via a miscontrol or a failed dribble
- Aerial Wins: Number of aerial duels a player wins
- Fouls: How many fouls a player commits
- Tack/Dribbled Past%: Percentage of times a player makes a tackle when going into a duel vs. getting dribbled past
- Passing%: Percentage of all passes attempted that were completed
- Deep Progressions: Passes and dribbles/carries into the opposition final third
- xG Assisted: This is calculated from the expected goal value of the assisted shot
- xGBuildup: A model that attributes the xG value of the final shot to all players involved in the entire possession. While another metric named xGChain attributes this value to all players involved in the entire possession, xGBuildup omits xG and xG Assisted to focus on possession work prior to the end of the chain
- Successful Dribbles: How often a player successfully dribbles past an opponent
- Turnovers: How often a player loses the ball via a miscontrol or a failed dribble
- Pressure Regains: Times a player’s team won the ball back within 5 seconds of the player pressuring an opponent
- Pressures: The number of times a player pressures an opposition player
- PAdj Tackles: Number of tackles adjusted proportionally to the possession volume of a team
- PAdj Interceptions: Number of interceptions adjusted proportionally to the possession volume of a team
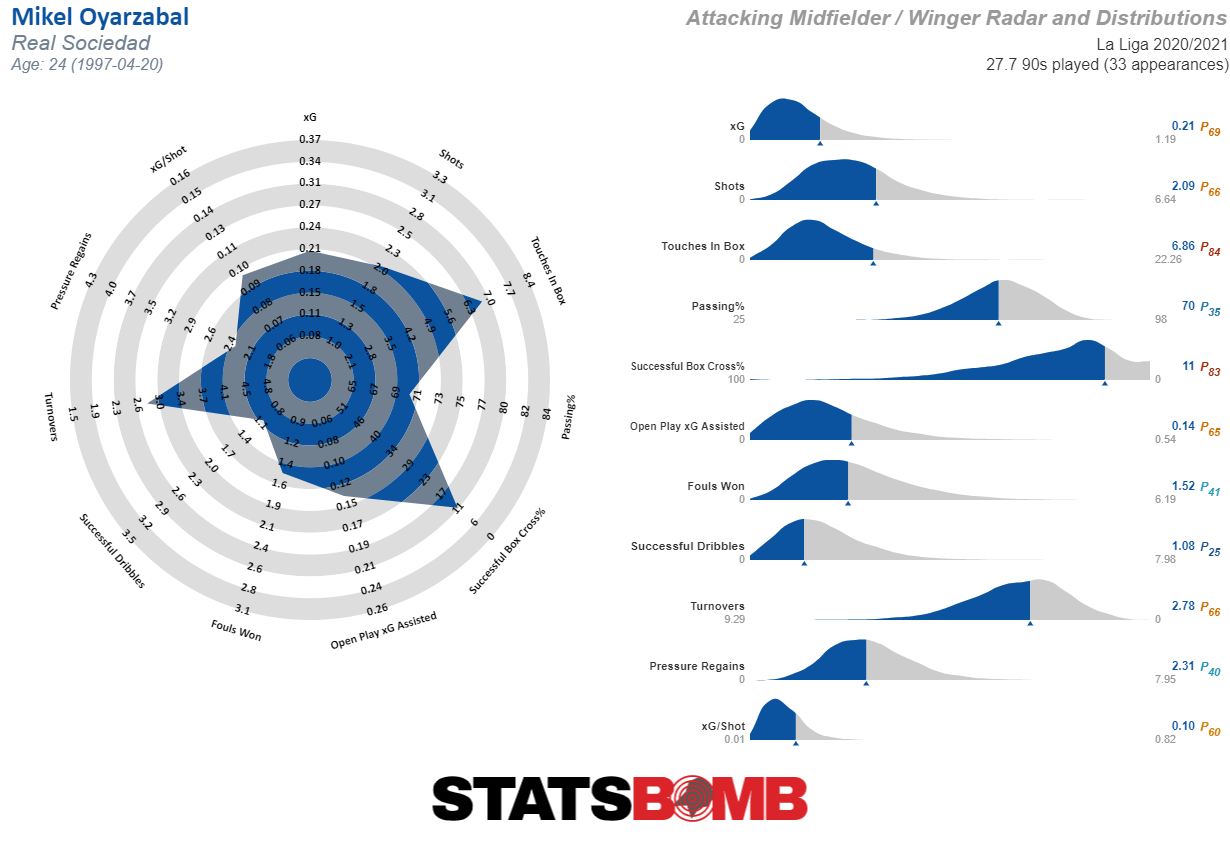
- xG: Non-penalty expected goals
- Shots: Number of non-penalty shots a player takes
- Touches in Box: Successful footed touches inside the box (including shots)
- Passing%: Percentage of all passes attempted that were completed
- Successful Box Cross%: The percentage of a player's completed passes into the box are crosses
- Open Play xG Assisted: xG Assisted from open play
- Fouls Won: How many times a player is fouled
- Successful Dribbles: How often a player successfully dribbles past an opponent
- Turnovers: How often a player loses the ball via a miscontrol or a failed dribble
- Pressure Regains: Times a player’s team won the ball back within 5 seconds of the player pressuring an opponent
- xG/Shot: A measure of shot quality, this looks at the average non-penalty expected goal value per shot a player takes
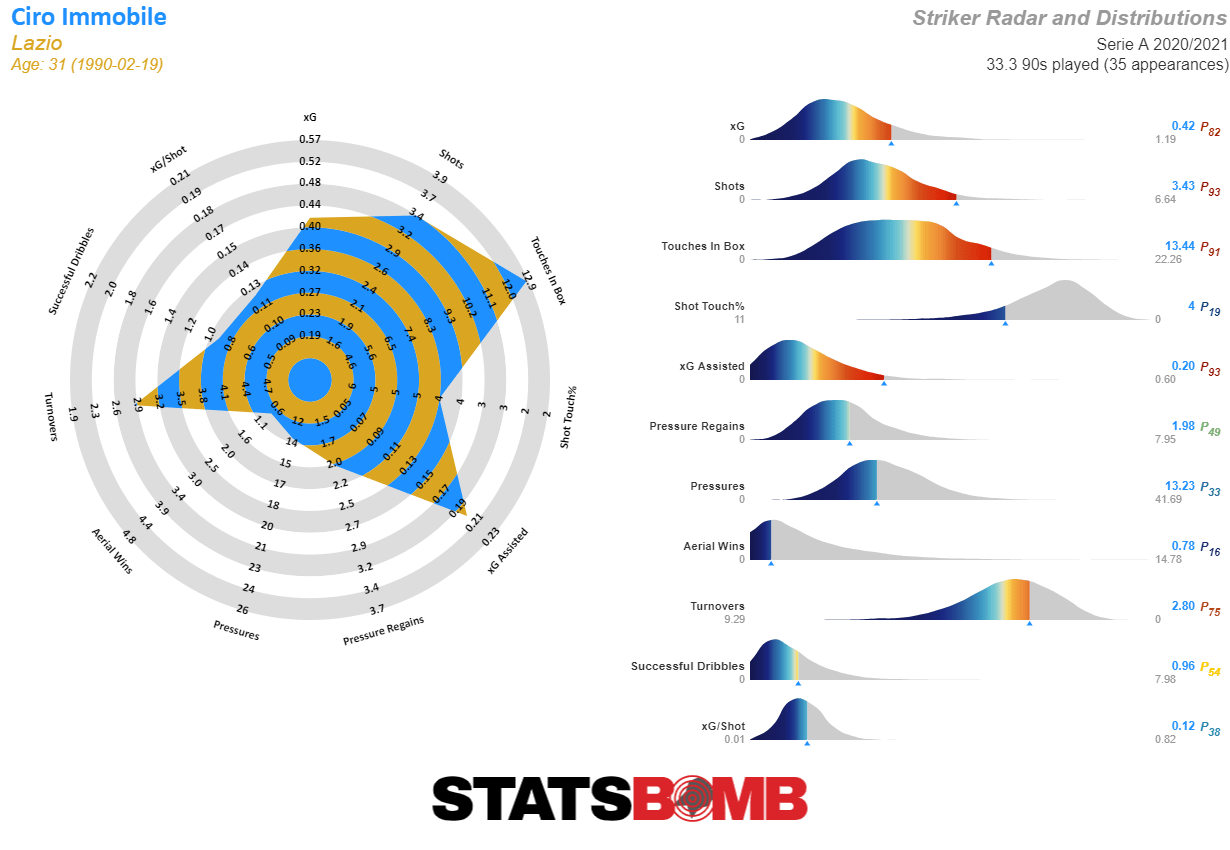
- xG: Non-penalty expected goals
- Shots: Number of non-penalty shots a player takes
- Touches in Box: Successful footed touches inside the box (including shots)
- Shot Touch%: The amount of shots a player takes as a proportion of their touches of the ball
- xG Assisted: This is calculated from the expected goal value of the assisted shot
- Pressure Regains: Times a player’s team won the ball back within 5 seconds of the player pressuring an opponent
- Pressures: The number of times a player pressures an opposition player
- Aerial Wins: Number of aerial duels a player wins
- Turnovers: How often a player loses the ball via a miscontrol or a failed dribble
- Successful Dribbles: How often a player successfully dribbles past an opponent
- xG/Shot: A measure of shot quality, this looks at the average non-penalty expected goal value per shot a player takes
Do you want to want find out more about the data and metrics that are becoming ever more widespread within football? Our online course Introduction to Football Analytics is the ideal starting point, featuring modules on expected goals (xG), attacking and defensive approaches, set pieces, opposition analysis and more... Sign up here: https://courses.statsbomb.com/courses
