Messi or Ronaldo? Kroos or Modric? Mbappe or Neymar? Every football fan loves to argue over who they think is a better player. Depending on where your loyalties lie, arguments can range from simple statistics; like the number of goals they’ve scored or the trophies they have won, to advanced metrics like expected goal values from ghosting. To the layman football fan, the former argument is almost certainly more digestible. But for the rest of us, we often want a metric that’s more objective, more extendable, and more rigorous, while still being able to understand it and explain it to your counterpart to assert your football dominance.
The evolution of football analytics - how we got to non-shot expected goals models.
Every football analytics nerd understands the (slow) evolution of football statistics. The story begins with football’s notorious and frustratingly difficult objective of scoring goals, the historic hindrance for American spectating. Analyzing goals scored and goals conceded appeased few and people quickly realized the value of shot volume for depicting a team’s performance and ability. The obvious pitfall in comparing shot volume was the quality of a shot can vary drastically. This led to everyone under the sun defining their own expected goals (xG) model to objectify chance quality and aggregate goal likelihood as a better metric for attacking production. xG is now omnipresent in football analytics as a tool for attackers’ and teams’ performance. Most recently in the sports analytics community, people have extended the concept of expected goals to allocate ball progression contributions throughout a team’s possession of the ball.
Commonly referred to as “non-shot expected goals (NSxG) models”, these models are effective tools to quantify passes and carries into dangerous areas of the pitch, assigning value to actions other than shots and allowing for the comparison of attacking contribution of ALL players. Fivethirtyeight even uses a non-shot xG model as a component in their soccer projections.
The original research - before “non-shot expected goals” became a thing - was by Sarah Rudd, presented at NESSIS in 2011. Rudd used markov models to assign individuals offensive production values defined as the change in the probability of a possession ending in a goal from the previous state of possession to the current state of possession.
For example, imagine a player standing 30 yards from the goal line, close to the sideline. They are in a non-threatening position and that possession will rarely result in a goal. Let’s say it has a 1% chance of resulting in a goal. Now, that player gets a cross off, the defender clears it out of bounds for a corner kick. Corner kicks resulted in goals approximately 4% of the time. This play would attribute a +3% change in NSxG for the player who crossed the ball.
As data becomes increasingly utilized and accessible, the variants of NSxG models grow just as xG models did. Mark Taylor further explains NSxG models here. Nils Mackay defines “xG added” to grade passing skill and extends it to allocate value for carries and structures as a possession based model. Similarly (and most recently), Karun Singh published his version of xG added, introducing xG threat, explaining it with beautiful interactive visualizations.
All of this publicly facing research has been pivotal in advancing the applications and effectiveness of sports analytics. Today, I am going to walk through a tutorial on StatsBomb’s first iteration of a Ball Progression Model. I like to refer to NSxG as “contribution”, simply because it's easier to say and not everything in football analytics needs an “x” in it.
Markov Model - Framework and Methodology.
Adopting the framework set forth by Rudd, we construct a possession based markov model we call our “Ball Progression Model”. We define attacking possessions to have two possible outcomes, a Goal or a Turnover. In a markov model, these two outcomes are known as the “absorption states”. The most crucial condition of an absorption state is that the probability of transitioning out of the state is 0 and the probability of remaining in the state is 1, given that it is the end of a possession this condition holds and the data must be structured as such (this condition makes it more difficult to consider shots or xG bins as potential absorption states). Leading up to the absorption state, a possession can transition between any number of “transient states”. We define transient states based on the context of the state and the geographical location of the possession at a current state. Extending the states defined by Rudd and applying to StatsBomb data, we define the following context-based transient states:
- Attacking Third Free Kick
- Central Third Free Kick
- Defending Third Free Kick
- Attacking Third Throw In
- Central Third Throw In
- Defending Third Throw In
- Corner Kick
- Penalty Won
We then define the following geographic zones as transient states:
![]() Since a state can depend greatly on defensive pressure, we define the geographic zones each when they are absent of pressure and when they are under pressure. This leaves us with 76 geographic zones (38 with pressure, 38 without pressure) and 8 contextual zones for a total of 84 transient states.
Since a state can depend greatly on defensive pressure, we define the geographic zones each when they are absent of pressure and when they are under pressure. This leaves us with 76 geographic zones (38 with pressure, 38 without pressure) and 8 contextual zones for a total of 84 transient states.
Transient states can transition between other transient states and ultimately an absorption state based on some observed transition probability. The transition probability is dependent only on the current state of the possession and is independent of previous states. This is known as the markov property and is a key assumption in markov models (in the discussion we consider this a limitation and propose extensions to this property). For instance, if you have the ball in zone 21, the probability that you pass the ball to zone 28 is the same regardless of the fact that the ball came from zone 14 as opposed to any other zone. This is known as the “memoryless” property.
Quick notation - n is the number of transient states (in our case 84), r is the number of absorbing states (in our case 2). Q is the matrix of transition probabilities, Q is n x n. R is the matrix of absorption probabilities, R is n x r. N is known as the fundamental matrix and it is calculated as the inverse to the n x n identity matrix, I, minus the transition matrix Q, formally N = (I - Q)-1 .
Calculations - for each transient state, we can calculate the expected number of plays (progressing actions: passes, carries, and shots) until absorption as the row sums of the fundamental matrix. Then, the probability of reaching either absorption state for the current transient state is equal to N x R. For more on the theory behind markov models, please see here. Special thanks to Ron Yurko for the code.
Results
We prepare the data (this is the most time consuming portion) and run our ball progression model for Europe’s big five leagues, England Championship and England League One for the 2017/2018 and 2018/2019 (through 2/18/19) seasons.
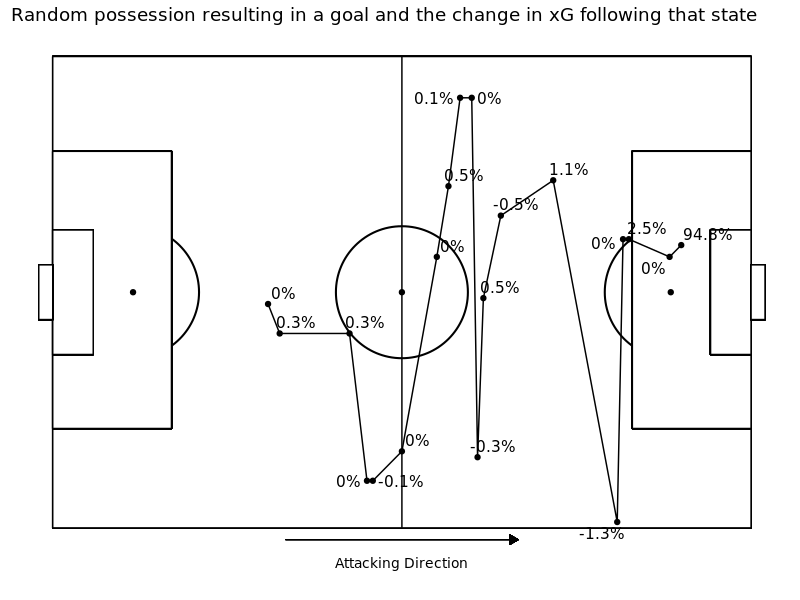
For each transient state, we calculate the probability of a goal in absorption as well as the expected number of plays until absorption. The three most likely states to result in a goal are (refer to geographic zones above): 36 w/ pressure (Pr(Goal) = 19.2%), 31 w/ pressure (Pr(Goal) = 9%), and 36 w/o pressure (Pr(Goal) = 8.3%). The three most likely zones to result in a turnover are: 1 w/ pressure (Pr(Turnover) = 99.5%), 3 w/ pressure (Pr(Turnover) = 99.5%), and 2 w/ pressure (Pr(Turnover) = 99.5%). We present a possession that resulted in a goal below, with the contribution value for each action.
We then calculate our “contribution” metric as the change in the probability of a goal from the current state to the next state. Formally,
contribution = Pr(Goal|Statet+1) - Pr(Goal|Statet) for each transient state at time t.
We can also calculate total attacking contributions for each individual, i, as the sum of all of their attacking contributions,
contributioni = ∑Pr(Goal|Statet+1) - Pr(Goal|Statet)i ·I(action by player i)
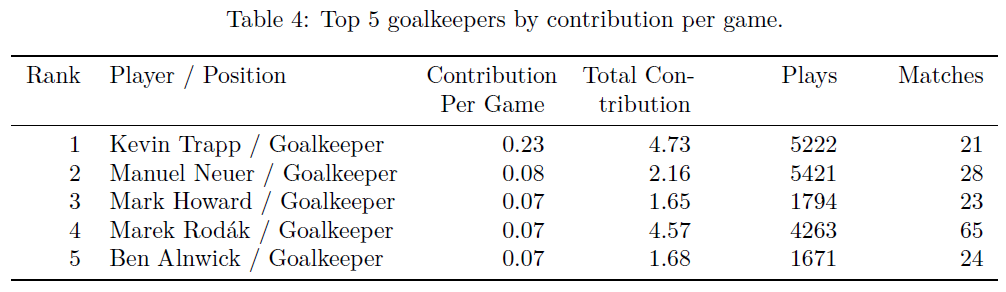
We then scale their total contribution by the number of matches played to get a player’s “contribution per game”. We choose to leave the contribution per game metric raw, not standardizing by league strength. This is to simply to see the crude output from the model, giving every player a fair chance to shine regardless of where they play. The top five contributors for each position (attackers, midfielders, defenders and goalkeepers) are presented in the tables below:
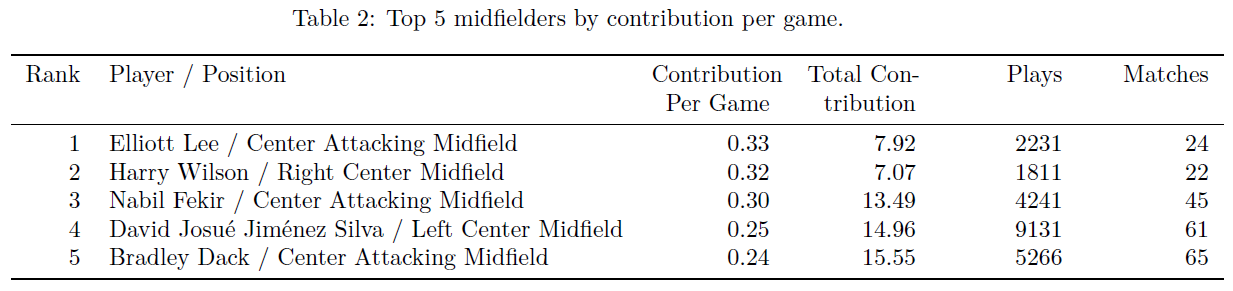
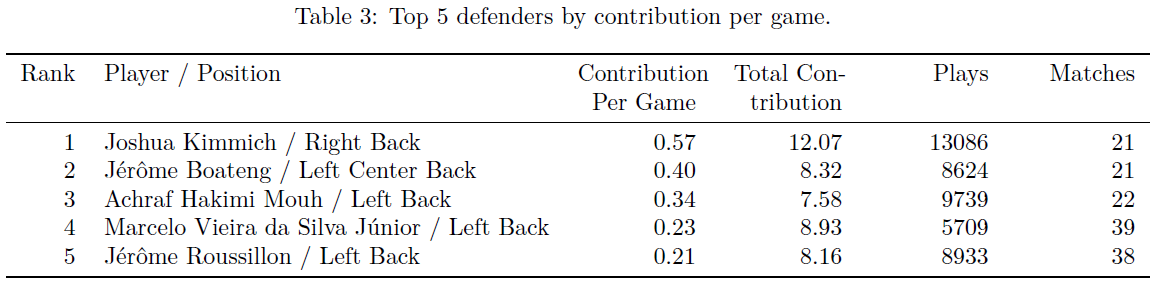
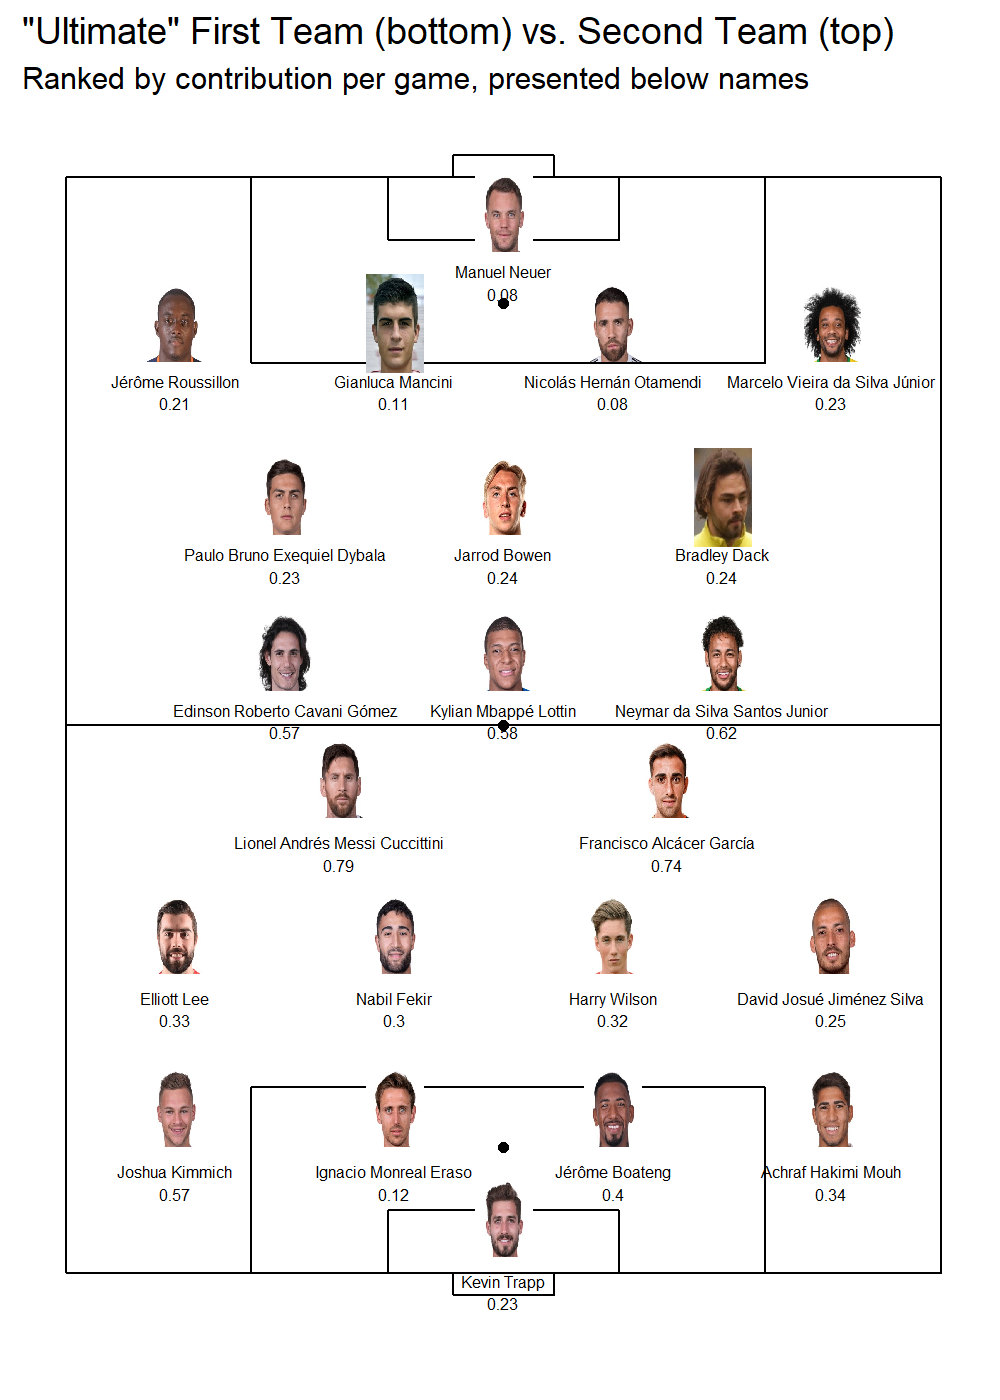
We also formulate a hypothetical “Ultimate Team” for the top contributors for each position of a standard 4-4-2 against a 4-3-3. Again, we purposely make the naive assumption that contributions between different leagues are equal. We also, in order to show you some names you might know, purposely didn't stress that the ultimate teams are extremely broad and unrealistic when it comes to positional categorizations. The two squads we formulate highlight plenty of young stars to remember during the next transfer window.
 Discussion
Our ball progression model has clearly identified the top players across Europe, and offers some justification for the money needed to acquire them. We have clearly designed a model that is easily interpretable even by the less-technical analytics sides. And ultimately, the model works without much computational power. Markov models are good at handling sequences of arbitrary length (as possessions in soccer can be anywhere from one event to 100s of events), and they allow for the attribution of final outcome contributions further along in the sequence. Nonetheless, there exist several limitations to a simple markov model.
- First, markov models’ assume the “memoryless” property when in reality a soccer possession is not memoryless. The probability of scoring when you are in a current state can depend on previous passes and carries leading up to the current state.
- A further extension of our ball progression model, that would appease this limitation, is higher order markov models. In higher order markov models, instead of assuming the markov property of independence, you assume that transition probabilities are conditionally independent based on the value of the current state and the value of the previous, 2nd previous, nth previous state, where the number of previous states you consider is the nth order of the markov model.
- Another limitation is that this simple markov model does not consider the action required to transition between states. For instance, the probability of a possession resulting in a goal may be different given that you passed into a zone vs. dribbled into a zone.
- Lastly, and perhaps the most obvious limitation of this markov model is the categorized structure of transient and absorption states. This causes the loss of information and limits applications especially in the free-flowing game of football.
- There exists some methods for continuous stochastic processes, but their use in the public sphere is limited and the concepts are far more difficult to understand.
This leads us to StatsBomb’s latest endeavor. Based on the limitations outlined above, we recognized the need for a model that accounts for the continuous nature of football, the retention of information from previous states, and the actions chosen by decision makers. Our next model will improve on the limitations noted above as well as layer on additional components essential to a football team’s success such as the timing of goals and the style of play under different game states. This will be the primary model we use for holistic ball progression in player and team stats, and a white paper detailing the model will be made available to current StatsBomb customers in March.
StatsBomb’s dataspec was designed with a view to capture more of what happens on the football pitch. To that regard, passing was an area in which it was felt that improvements could be made from the perspectives of simply recording how the game is played right through to the functional utility of applying analytical processes on top of that data.
Pass footedness is one of the primary upgraded features of StatsBomb data and a useful indicator for player evaluation, but today we are going to look primarily at graded pass heights. Passes within StatsBomb Data can be either "High" (above shoulder height), "Low" (below shoulder height) or "Ground" (self explanatory). For some added clarity we will omit headers from the following charts. As you will see, team and league styles can be quite pronounced.
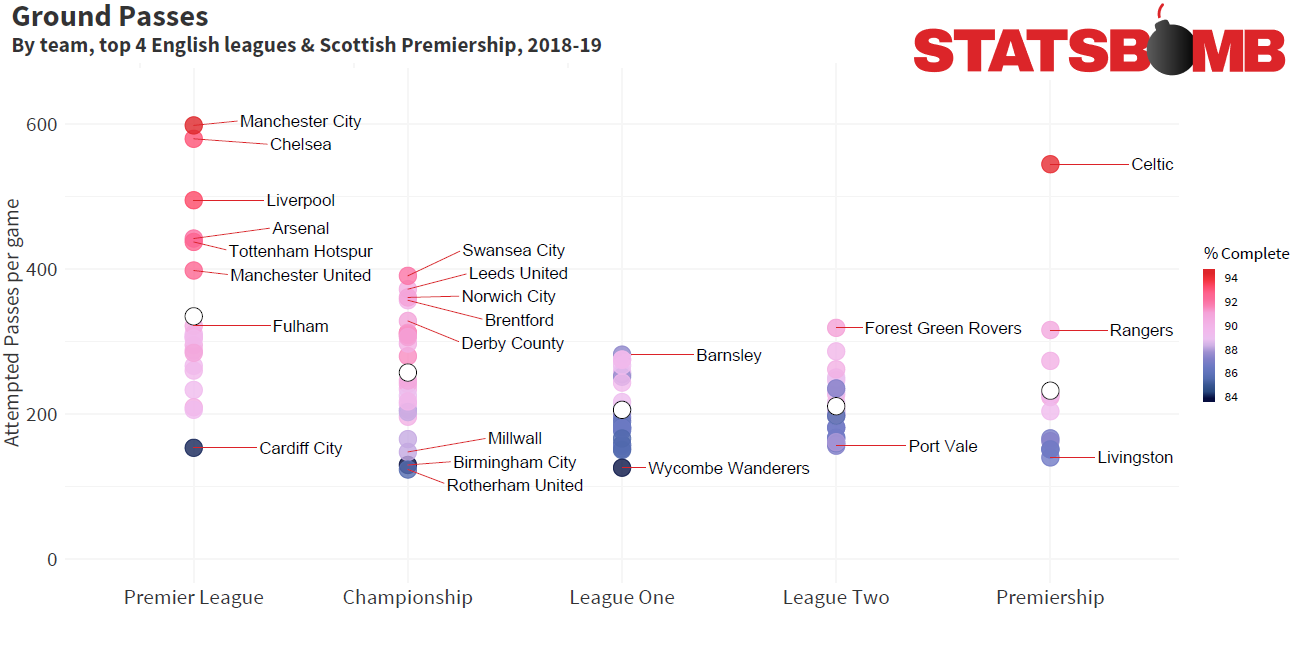
One of the benefits of collecting data across the entire 92 Premier League and Football League clubs, as well as the Scottish Premiership is to enable stylistic comparisons. We can see that at least in relation to the volume of ground passes. The big six Premier League clubs are in a league of their own--as are Celtic in Scotland. This is no surprise, but as we move elsewhere, there are further intriguing comparisons: Cardiff are complete stylistic outliers in the Premier League this season, and their completion rate here of 83.6% is third lowest of all 104 clubs in the sample.
That's a full six percent beneath the rates that Crystal Palace (89.7%) and Newcastle (89.9%) connect with their ground passes. Of course opportunity impacts volumes, but we see that the Championship possesses a clutch of teams that focus on a ground passing strategy: Graham Potter's Swansea, Marcelo Bielsa's Leeds United, Daniel Farke's Norwich City to name just three. One stylistic feature not shown here that emerged strongly from Leeds' overall profile was the high volume of low passes attempted; with over 48 per game, they try a full six more than any other team listed. With Bielsa ever interesting as a manager to study, this statistical quirk could well be worth further investigation. Far more compressed are Leagues One and Two.
They appear similar in general scope, but surprisingly, League One sees a slightly lower average volume and completion rate for both low and ground passes. Individual teams that stand out are Barnsley and Forest Green Rovers, both organisations that have forward thinking inputs, despite their relative positions in the league ladder. Discussions around the quality of the Scottish Premiership often yield arguments, but at least here, stylistically, the pass volumes and completion rates look more like the lower two leagues than the Championship, with Celtic a considerable outlier.
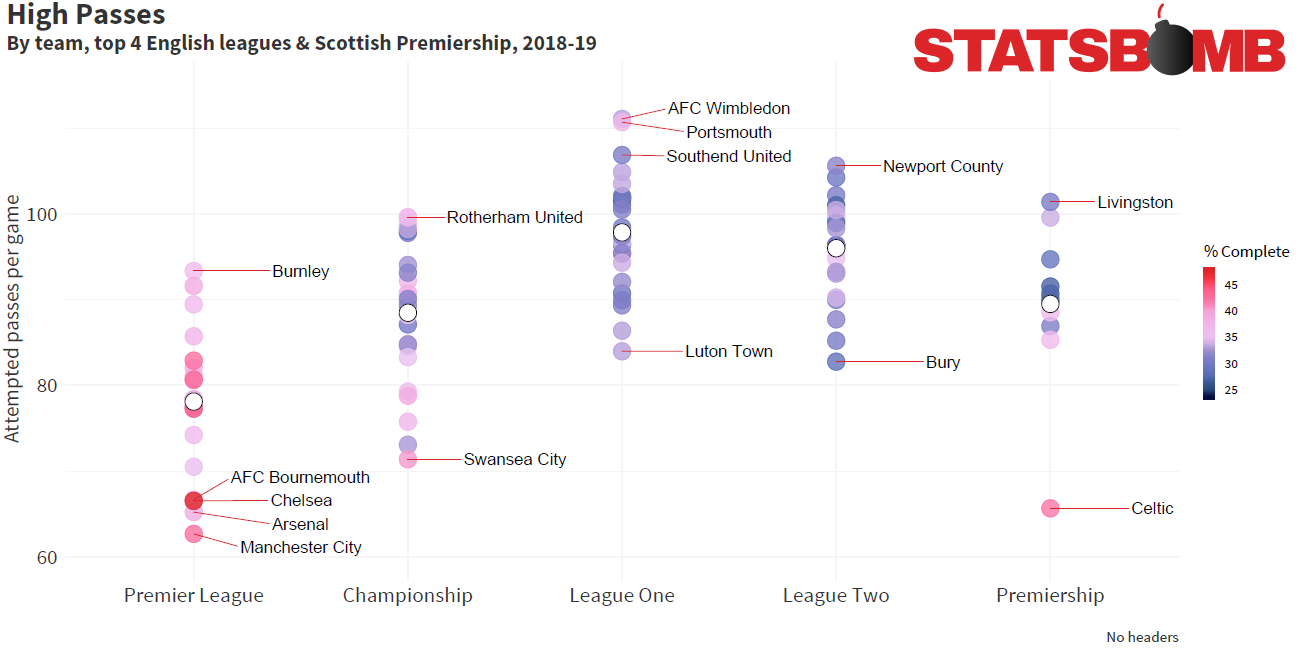
If we flip this to high passes, again clear distinctions between the leagues are apparent. Have Swansea refound the Swansea Way? The last two charts imply that they might have. Celtic once more look different to everyone else in Scotland and Leagues One and Two are again very similar in profile. One standout trend from this whole chart is the way that pass completion rates of high passes trend differently to ground passes.
In the last chart we saw a fairly simple and logical correlation between the volume of passes attempted and completion rate (r=0.84), here we see a weaker negative correlation (r=-0.50) but also what appears to be a skew towards completion rates for high passes at their highest in the Premier League. This offers ideas around player quality, both in passing ability and the ability to make space to attempt and receive such passes. Again logical, but nonetheless distinct.
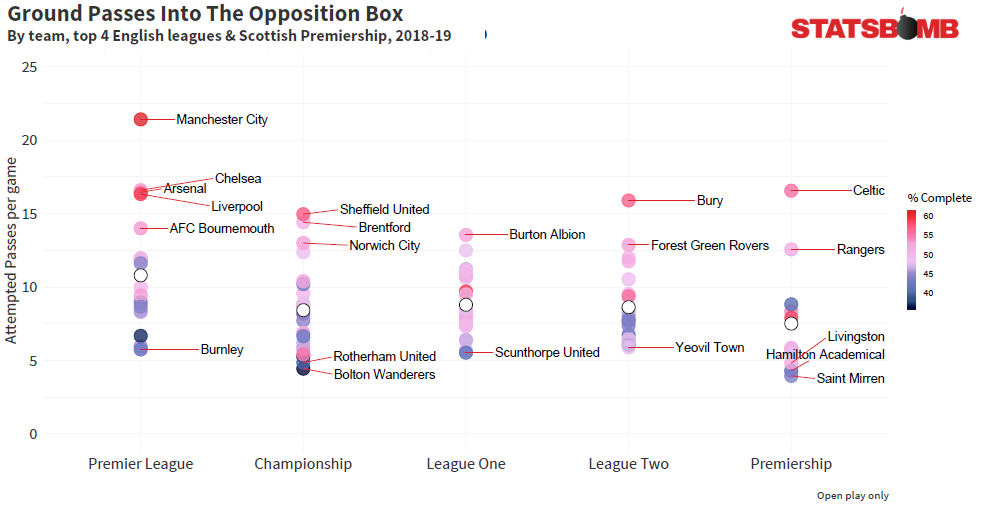
To get ideas around attacking intent we can extend our look into passes into the box from open play. General trends persist and once more most of the big Premier League clubs and Celtic stand out. But what of Bournemouth? Or Sheffield United, Burton or Bury? All clearly use a ground based philosophy when attacking their opponents' box and appear to have reasonable success.
At the other end, teams are attempting just a handful of such passes and completing barely any. These are teams that likely use the set-piece as a weapon or prioritise higher balls over low and ground passes. Overall trends we saw in general play appear weaker when filtered down to this level.
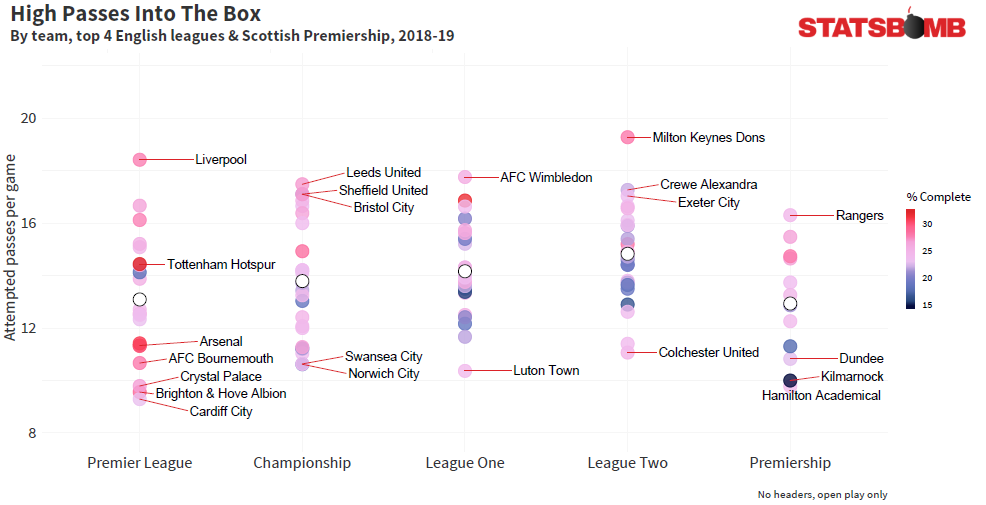
Now we see genuine stylistic curiosity--recall these are open play box entries via high passes. Would anyone expect that Liverpool would lead the Premier League numbers here? It's clear that they are well capable of attacking the box either on the deck or aerially and they show high volumes for both. Tottenham and Arsenal both show up less so for volume but for the rate in which they complete these type of passes.
Swansea are disinterested in this method as are Norwich, but Leeds--purveyors of high "ground pass" and "low pass" volume-- frequently put the ball in the air in the final third. Sheffield United, like Liverpool, show a varied and successful method of box entry. AFC Wimbledon and MK Dons top their respective divisions showing that regardless of which direction the club went, the old Wimbledon way looks to have persisted...
Hopefully this look at pass heights has offered some insight into how considering trends within the whole league pyramid can be informative. We've just scratched the surface, but when recruitment is so often local, it makes sense to understand the dynamics of teams across a whole market, and detailed data such as that collected by StatsBomb can help identify teams that play preferred styles for loan opportunities too. Look out for more of these charts on the twitter feed soon.
The work of demystifying the keeper position never ends.
Earlier this year StatsBomb released it’s post-shot expected goal model.
The idea was to use our keeper and defensive positioning to help build a model that accurately reflected the shots keepers were facing. Next we’ve one lots of work codifying distribution, trying to measure how and where keepers pass the ball. And finally, we’ve begun work on the third major area of a keeper’s game, command of his box. What we aim to do is bring the same level of context to keeper claims as we’ve done to shots and passing.
Let’s dig in.
Our basic conceptual approach was to look at balls that keepers have the opportunity to claim, similarly to how we might look at shots. Figure out how likely any given ball is to be claimed by the keeper and then, in light of that, evaluate how often keepers are coming to claim the balls they face against an average keeper. The idea here is to go beyond just looking at how often a keeper claims balls into his area and take into account how difficult those balls are to claim in the first place. That way we can avoid looking at a keeper who faces only easy crosses and thinking their dominant, while overlooking a keeper who manages to come for, and claim, a lot of more difficult balls. Look at the claimable balls a keeper faces, figure out how many of those balls a keeper would come for on average, and then evaluate an individual keeper against that average.
As always, with new data, some important caveats exist.
We don’t know how this data will act over the long term. We don’t know how much variance there is, what’s signal and what’s noise.
What it can do right now is help us better understand what keepers have done over the games that have been recorded. Saying “a keeper has been very aggressive coming for the ball” is a very different statement than saying “he is an aggressive keeper.” The data can tell us the first thing, it can’t, on its own tell us the second (at least not yet). Ok, enough preamble, here are some actual numbers and pictures and things you need to know. Keepers simply don’t, or can’t, claim the vast majority of balls. In our numbers, there have been over 10,200 claimable balls in the Premier League this season.
We’d expect, on average, keeper to attempt to claim only 788. They’ve actually attempted to claim 752. They’ve had an 88% success rate. Keeping is an inherently conservative business, one in which mistakes get punished by goals.
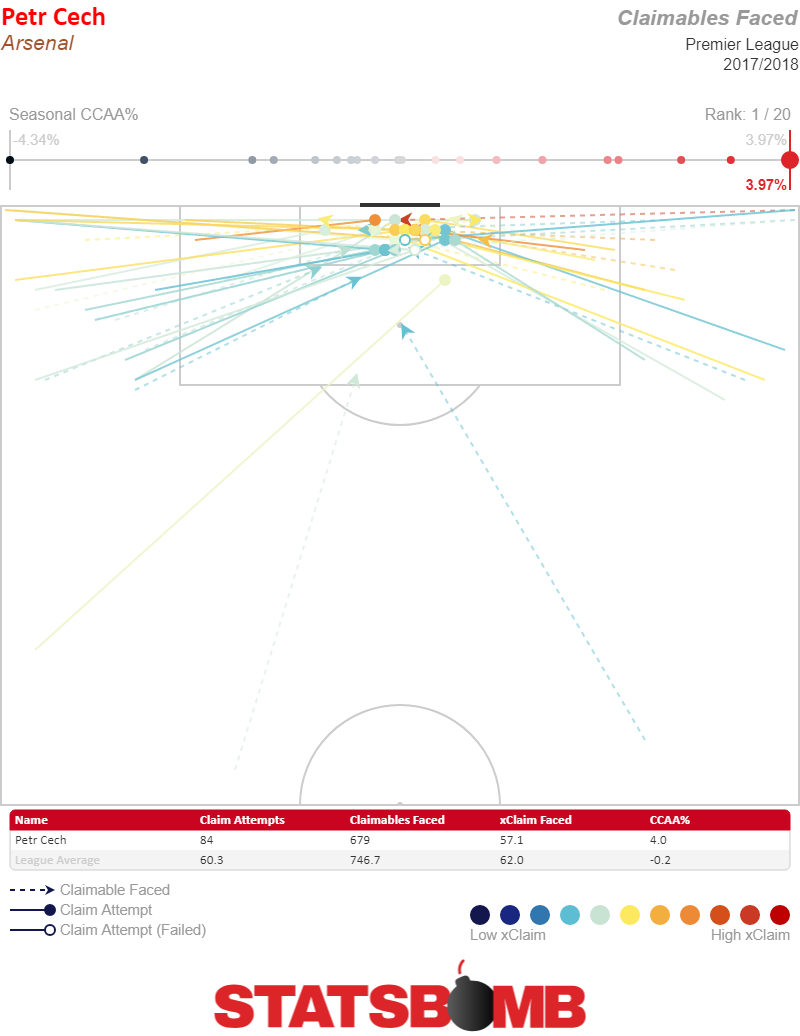
There is a general belief that you shouldn’t come unless you know you can get there. The data reflects that, by and large, that’s how keepers approach the game. This makes for a challenge when it comes to making fun pictures and charts, though. Putting all the balls that a keeper is very unlikely to go and get onto a visualization just makes things really ugly really fast. For example, here’s Petr Cech from last season, with every single claimable ball that came his way.
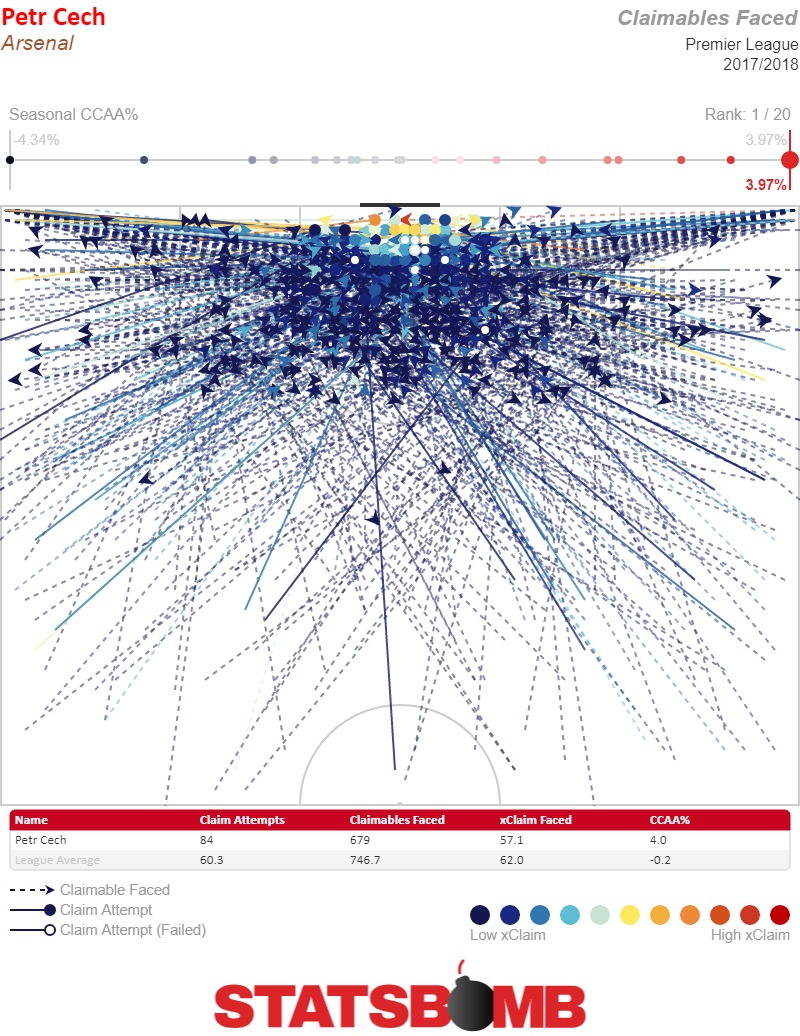
Yikes.
Filtering it down to only the higher likelihood balls makes everybody’s lives a little easier. Here’s how Cech faired that year on balls that had an expected claim value of 0.3 or higher (and look you can use the data however you want but I make sure to shout EUREKA!! In my head every single time I look at an xClaim value).
Voila!
Readability.
It’s a heck of a lot easier to look at the 47 possible balls there than it was to look at the initial map which had 679 claimable balls on it. Looking at that we can actually start to see some individual results from crosses, including a handful of the dreaded “claim attempt (failed)” variety. There’s no question though that there is a tradeoff here between granularity and completeness. On the flip side, if we’re not concerned with granularity we can just use heatmaps.
Hurray!
Want to know how aggressive Cech was at coming for balls as compared to the rest of the league. We now have a heatmap for that.
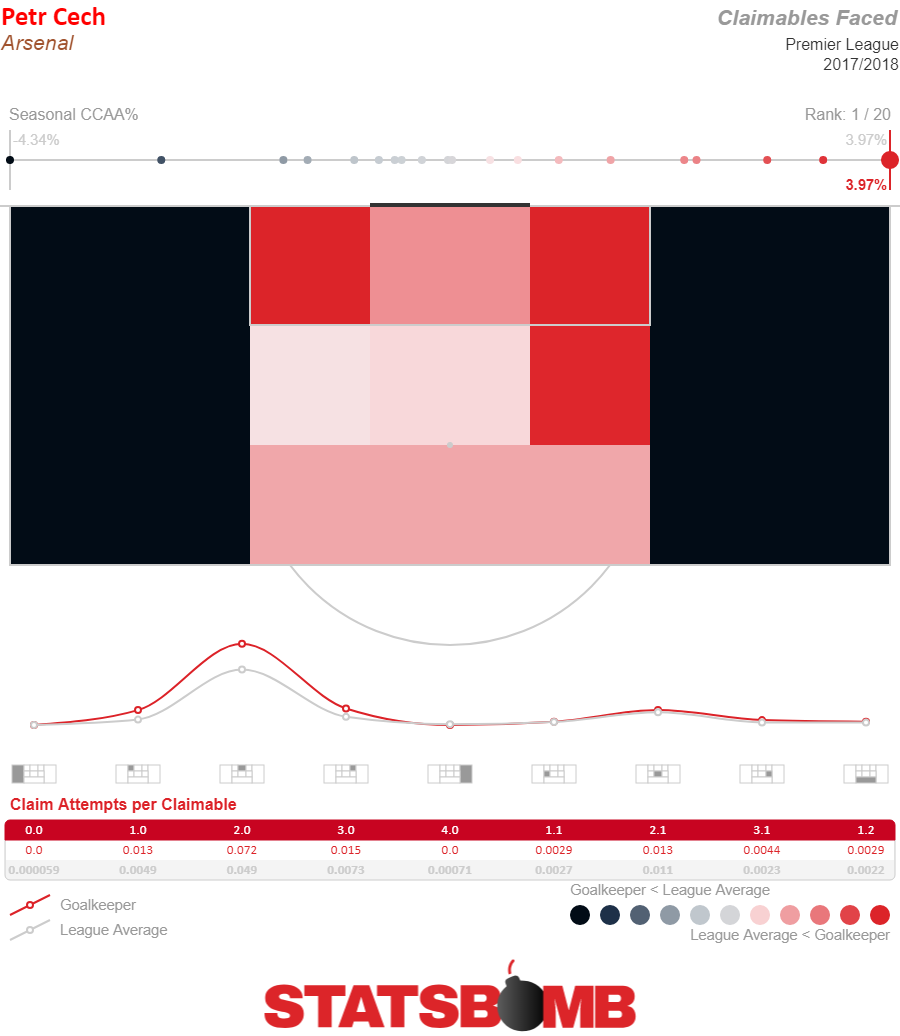
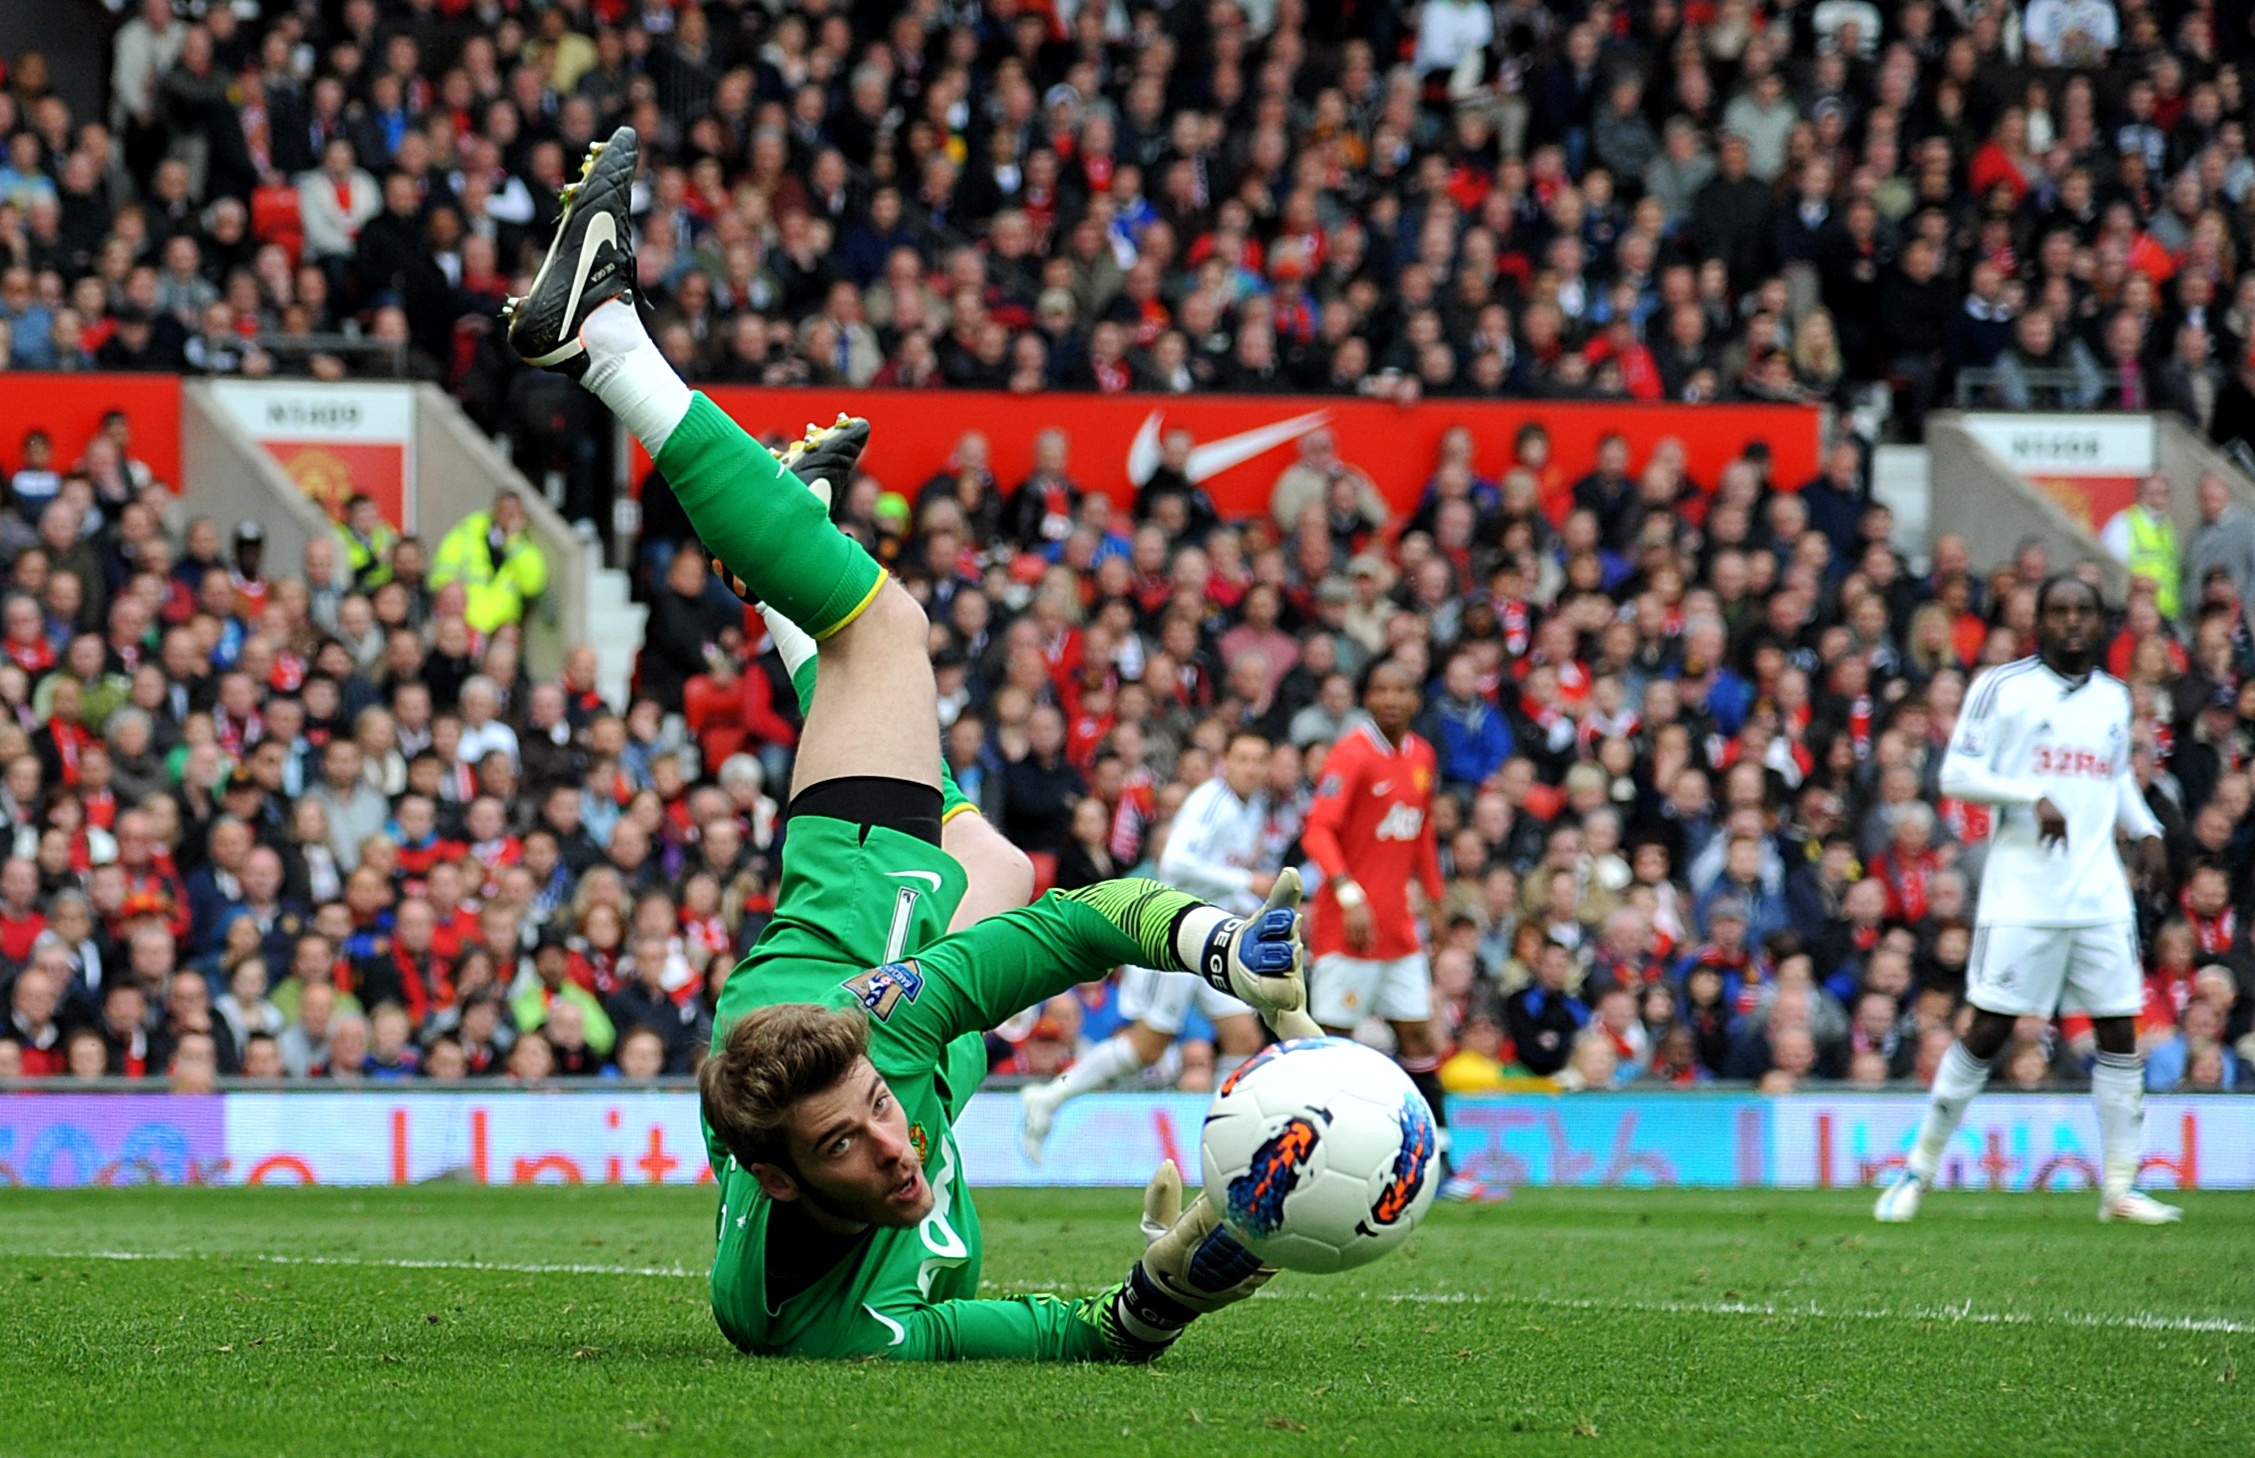
Cech, in keeping with his reputation, comes for a lot of balls. Now, here’s David De Gea from 2017-18 for comparison’s sake.
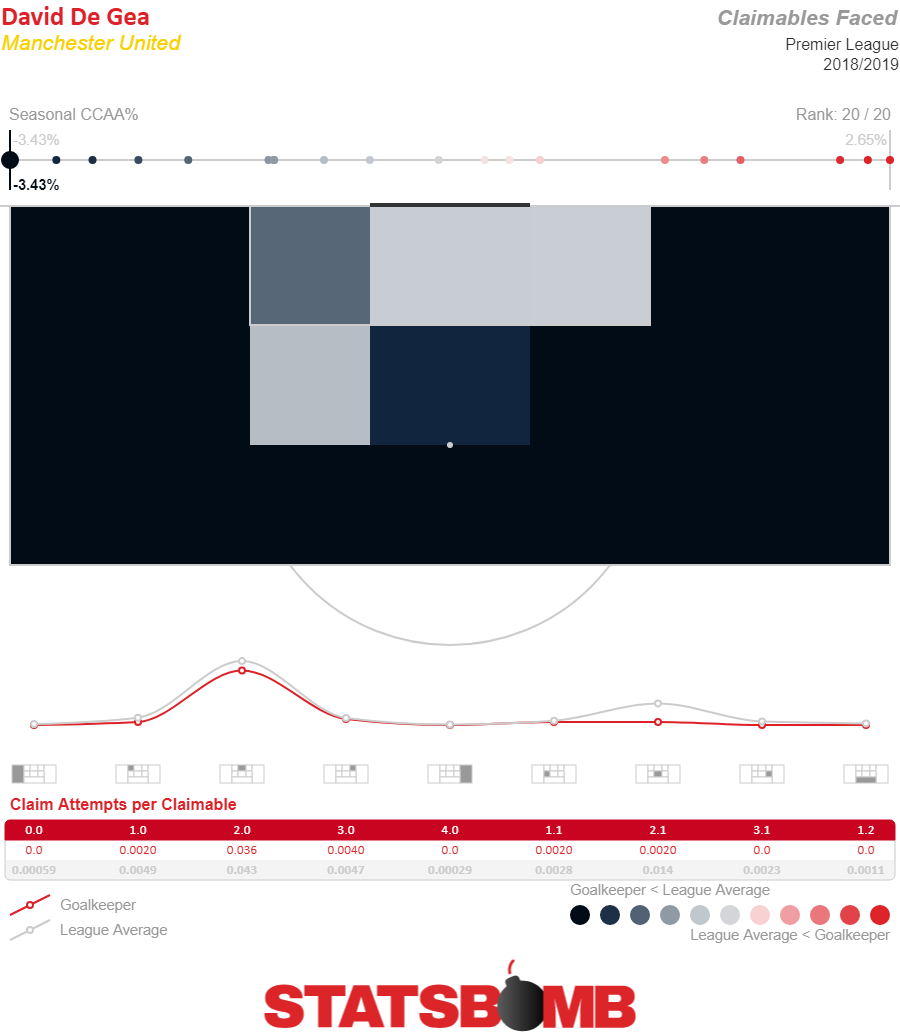
Well that certainly tracks. De Gea has a reputation for not coming off his line a lot and it turns out the data shows…he doesn’t come off his line a lot. Well done data. Ok, with the basics out of the way, how can we start using this data. One way is to help better nail down what players are doing well and poorly. A few weeks ago I wrote about how Hugo Lloris was having a great season. This is broadly true. Spurs defense has been pretty meh, they give up a bunch of shots, but they don’t concede a lot of goals.
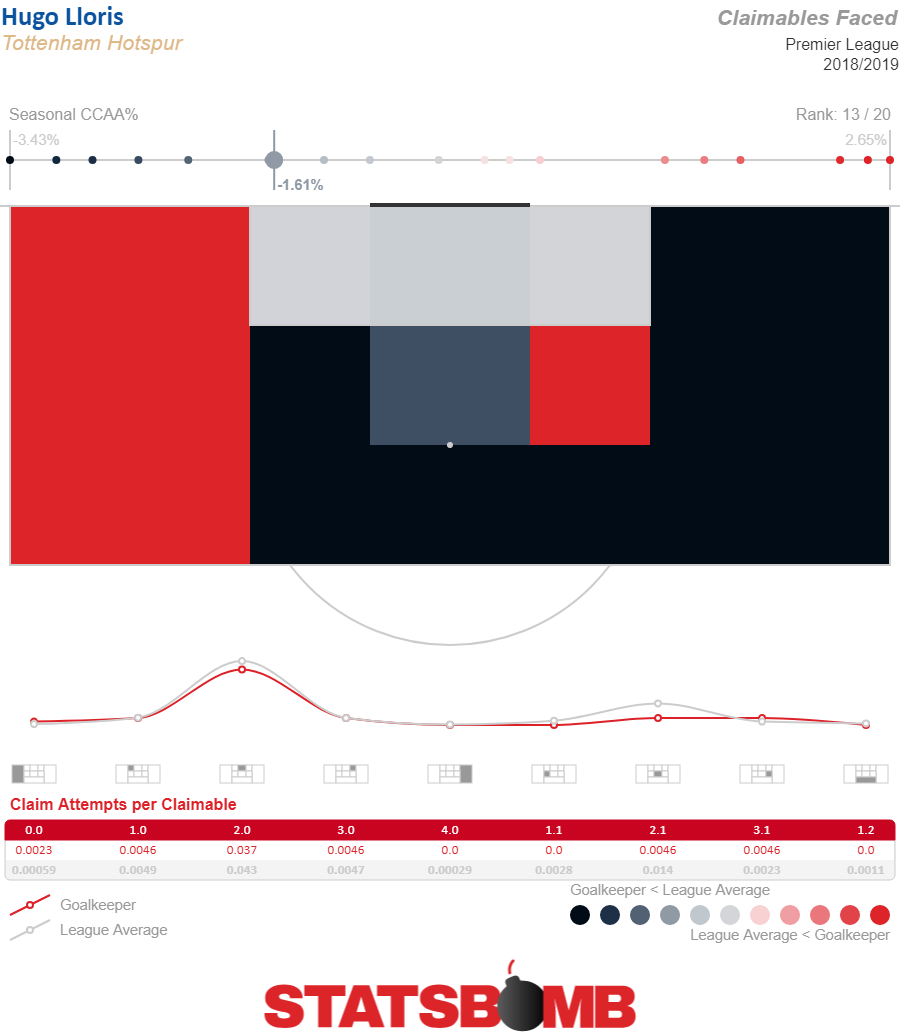
It’s all there in the piece, and it all still applies. But a lot of people reacted with incredulity. It sure felt to watchers that Lloris was very error prone. Well, turns out claimables can shed some light on that. Here’s the Lloris heatmap. He’s not particularly aggressive. He comes for 1.61% fewer balls than xClaims would predict. That’s 13th most aggressive in the league.
But now, let’s look at them more granularly. Here are the claimable balls with an over 0.3 xClaim value.
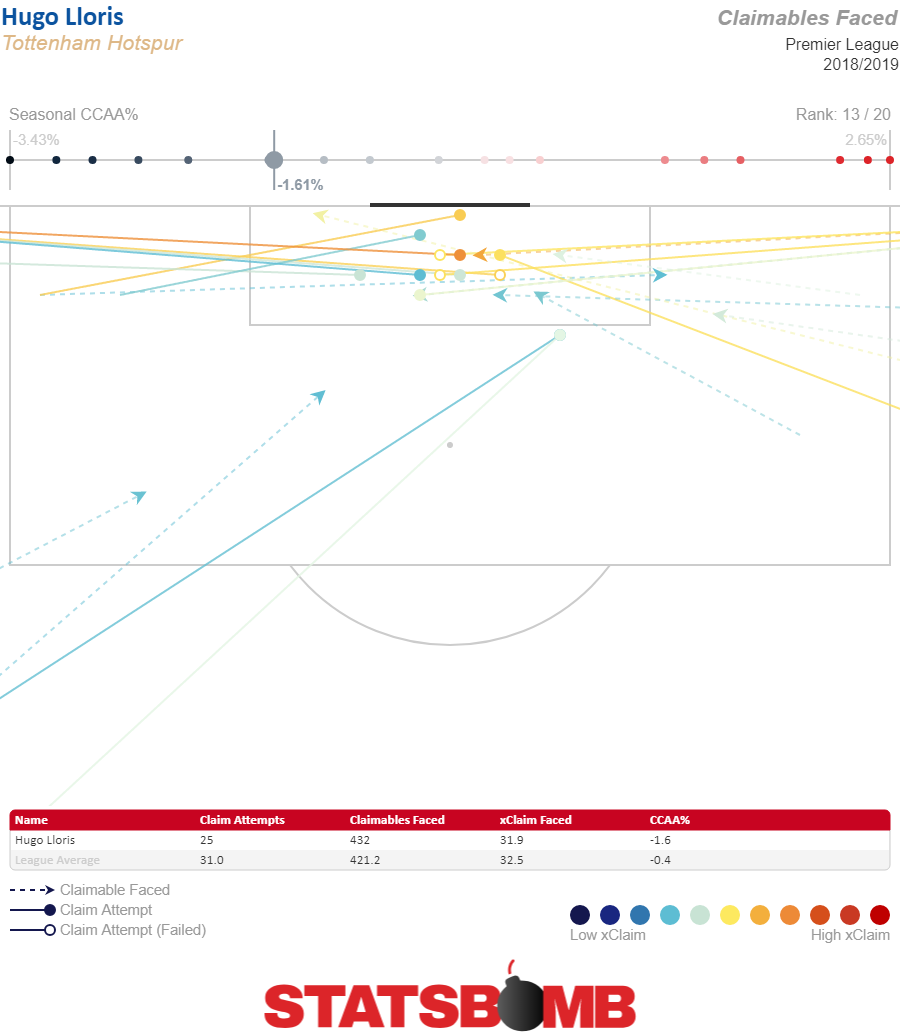
Of the 432 balls he’s faced, only 23 have cleared that bar, and he’s come for 13 of them, while xClaims suggests an average keeper would come for only 10. But, as you can see, right smack dab there in the middle, he’s missed three fat chances.
In fact, he’s only claimed 77% of these higher probability balls. We’re slicing things extremely narrowly here, so maybe it’s not great for drawing conclusions about overall performance, but Lloris flapping at three balls which are very gettable, and keepers come for between 30% and 60% of the time is certainly going to stick in the brain as not great.
There are lots of unknowns about that assessment of course. Obviously unsuccessful claims are a bad thing. But, exactly how bad they are is a complicated question. Clearly those errors haven’t really hurt Spurs this season. Are they lucky that’s the case, or is that normal. Rigorously translating keeper’s failing to claim balls that they come for into an actual relationship with goals and therefore results is a problem that’s beyond the scope of what claimables does (at least right now).
It’s a relief, however, to discover in the data an explanation for why Lloris has seemed to be error prone, even as we say with high confidence that error-prone vibe hasn’t impacted how good he is at keeping the ball out of the net. So, that’s your new keeper news. StatsBomb has a fun new tool to examine how aggressive keepers are. Keep it in your thoughts the next time the data request line is open.
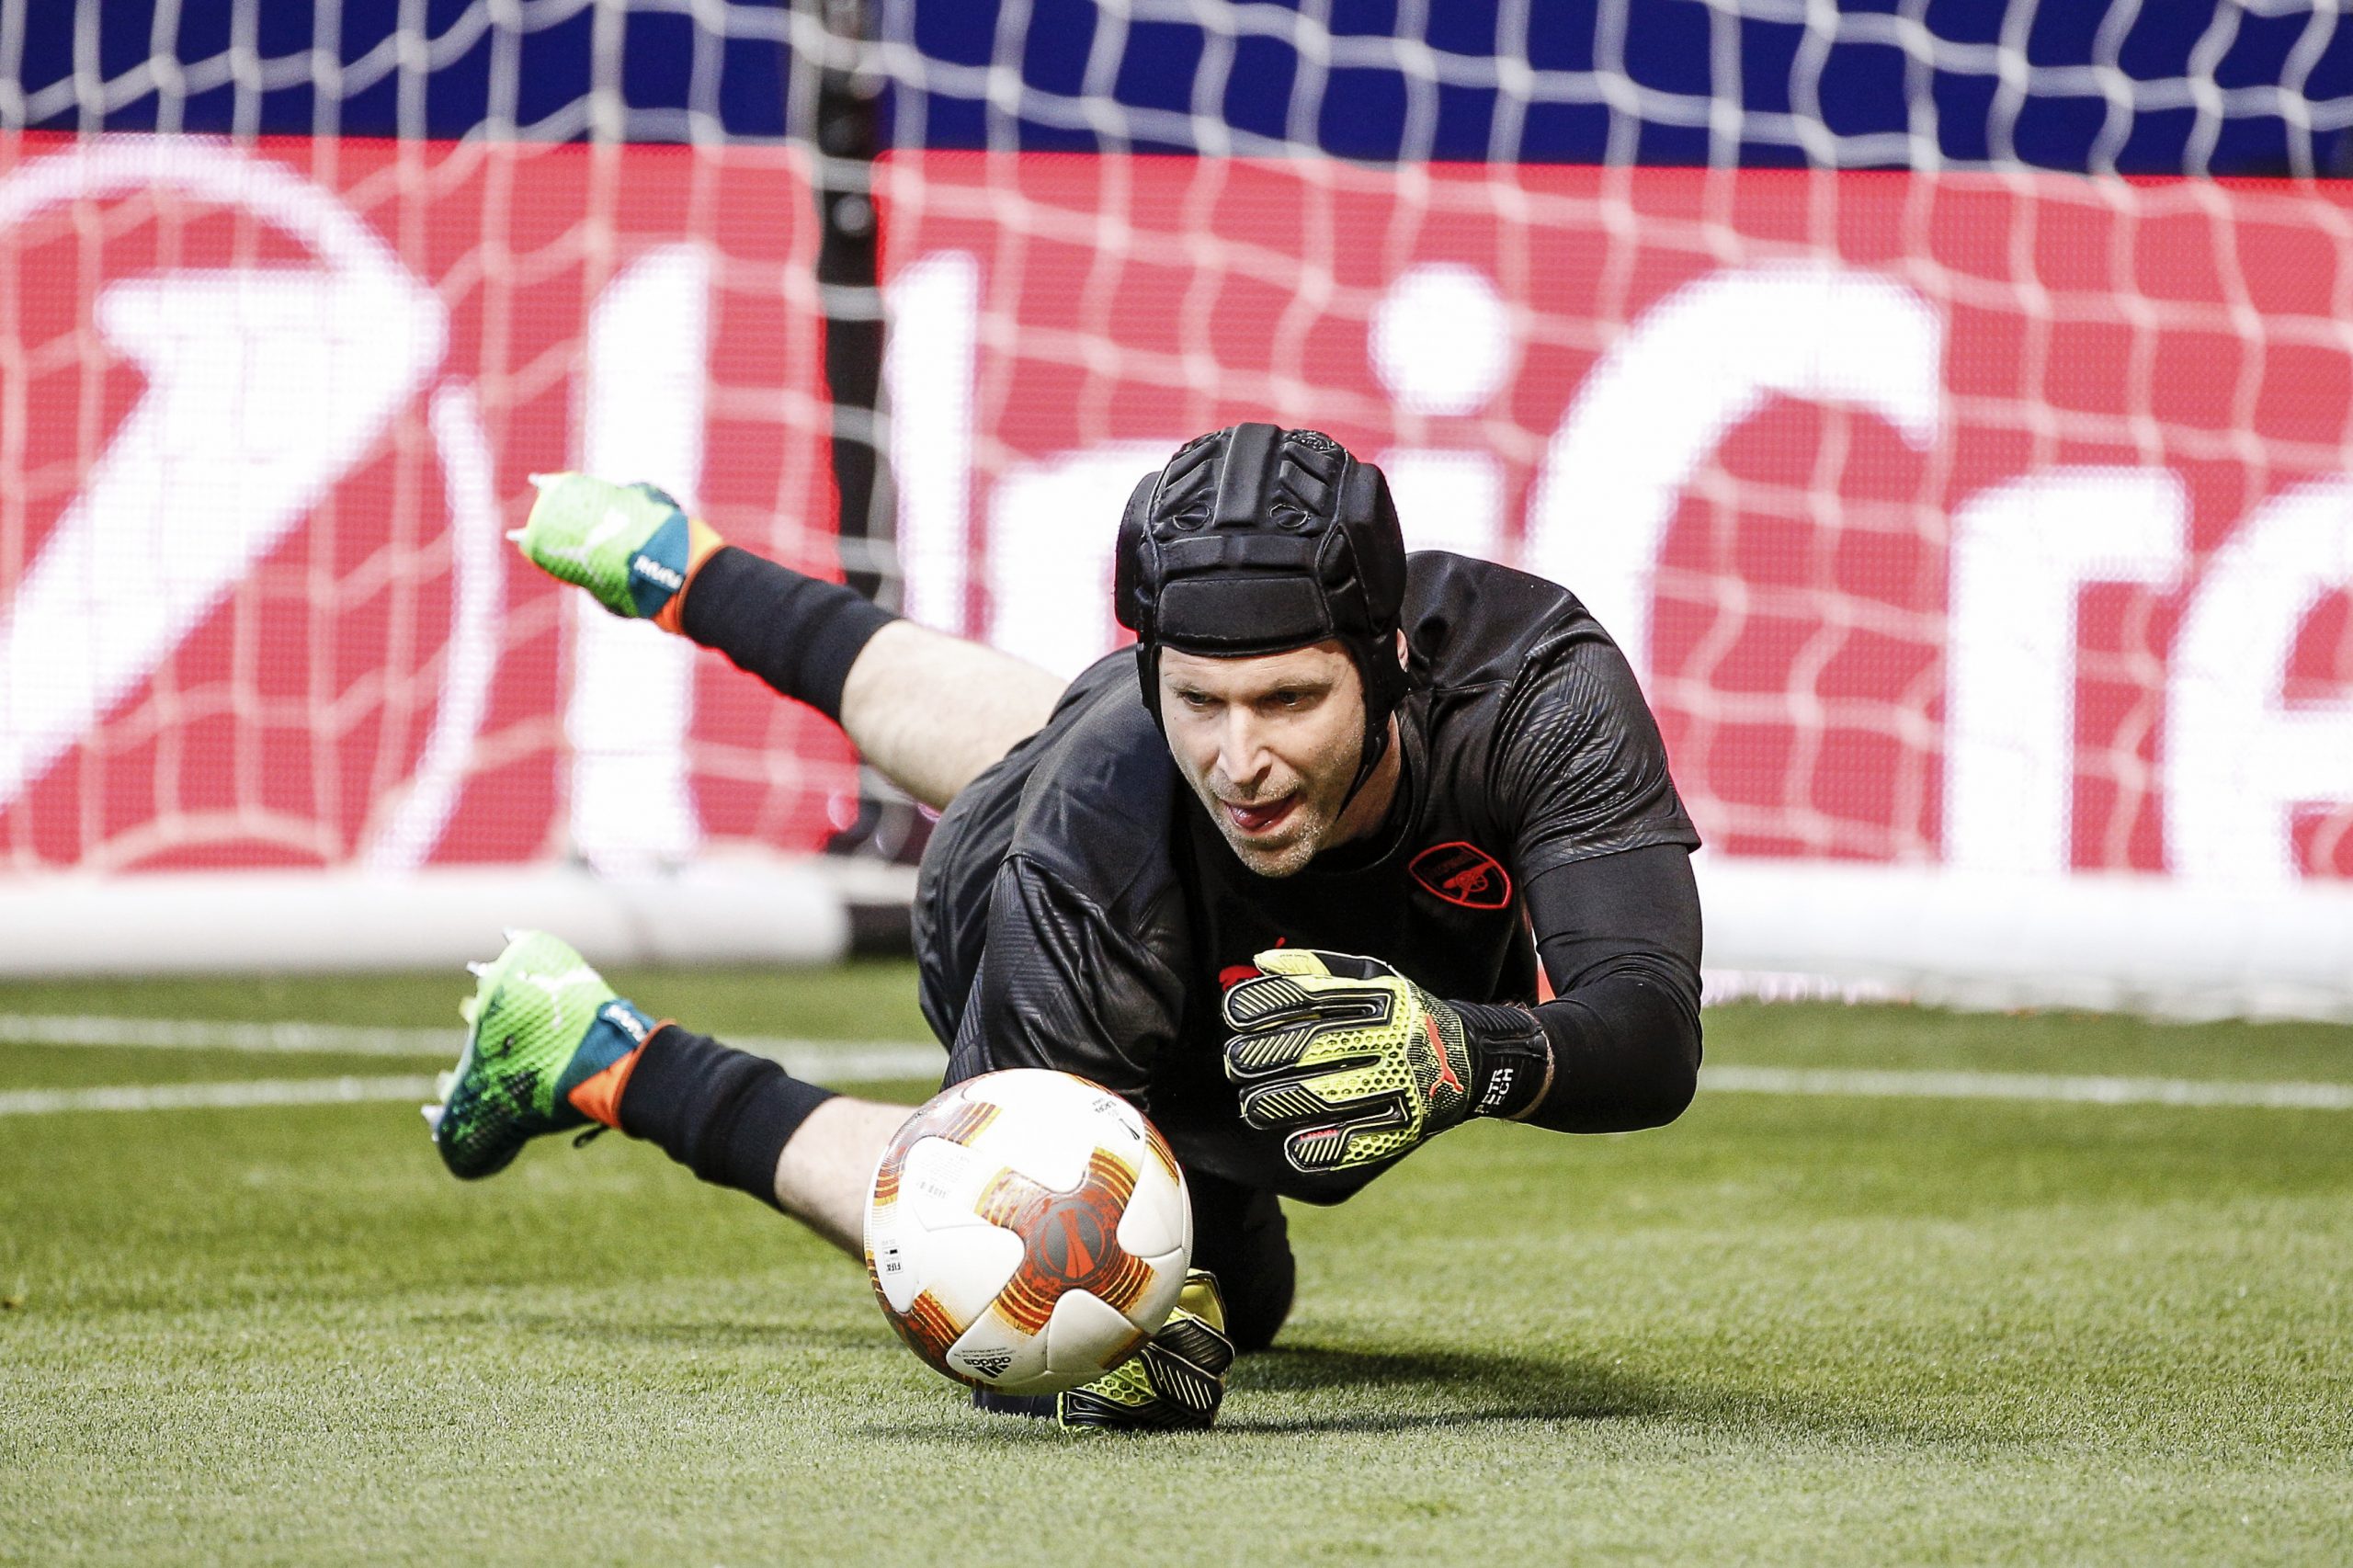
Header image courtesy of the Press Association

Kevin-Prince Boateng? That Kevin-Prince Boateng? Are you sure? For real? Why?
It’s been a long and winding road for Boateng. While his younger brother settled down in Bayern Munich’s defense, Kevin-Prince has spent the better part of his career bouncing around Europe. The former Hertha, Tottenham Hotspur, Borussia Dortmund, Portsmouth, Milan, Schalke, Milan again, Las Palmas, Eintracht Frankfurt, and now Sassuolo player has finally made it though. At almost 32 years old he’s been loaned to the big time. He’s going (somehow) to Barcelona.
This isn’t Boateng’s first time playing for an elite team. He was, if not integral, at least involved with Milan the last time they were a true world power. He started 18 matches during the team’s 2010-11 Serie A title winning season, and then 15 matches over each of the next two years as they finished second and third. But that was a soccer playing lifetime ago. Since then he’s remade himself, shifting from an all action midfielder to an unconventional striker. He has played the bulk of his minutes for Sassuoulo in that role.
His baseline stats don’t really suggest there’s much to write home about though.
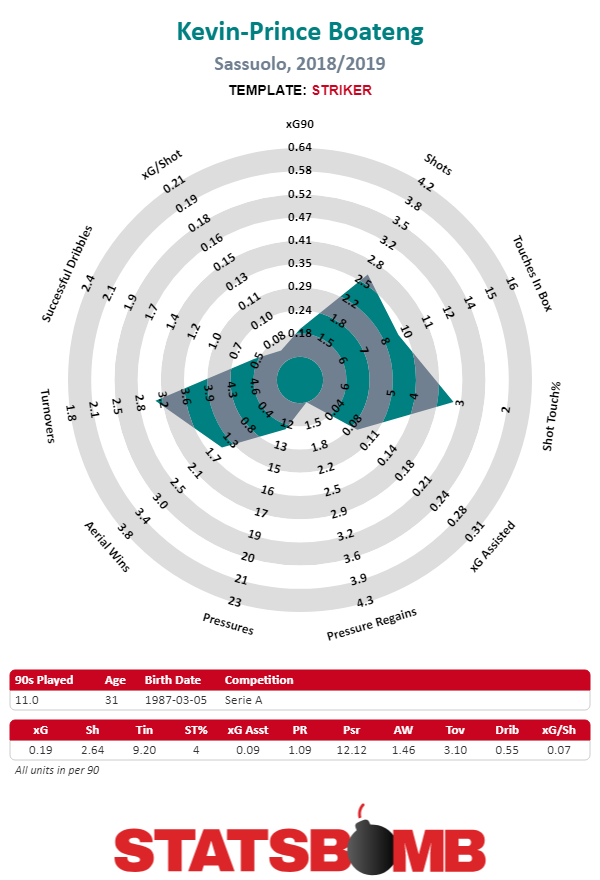
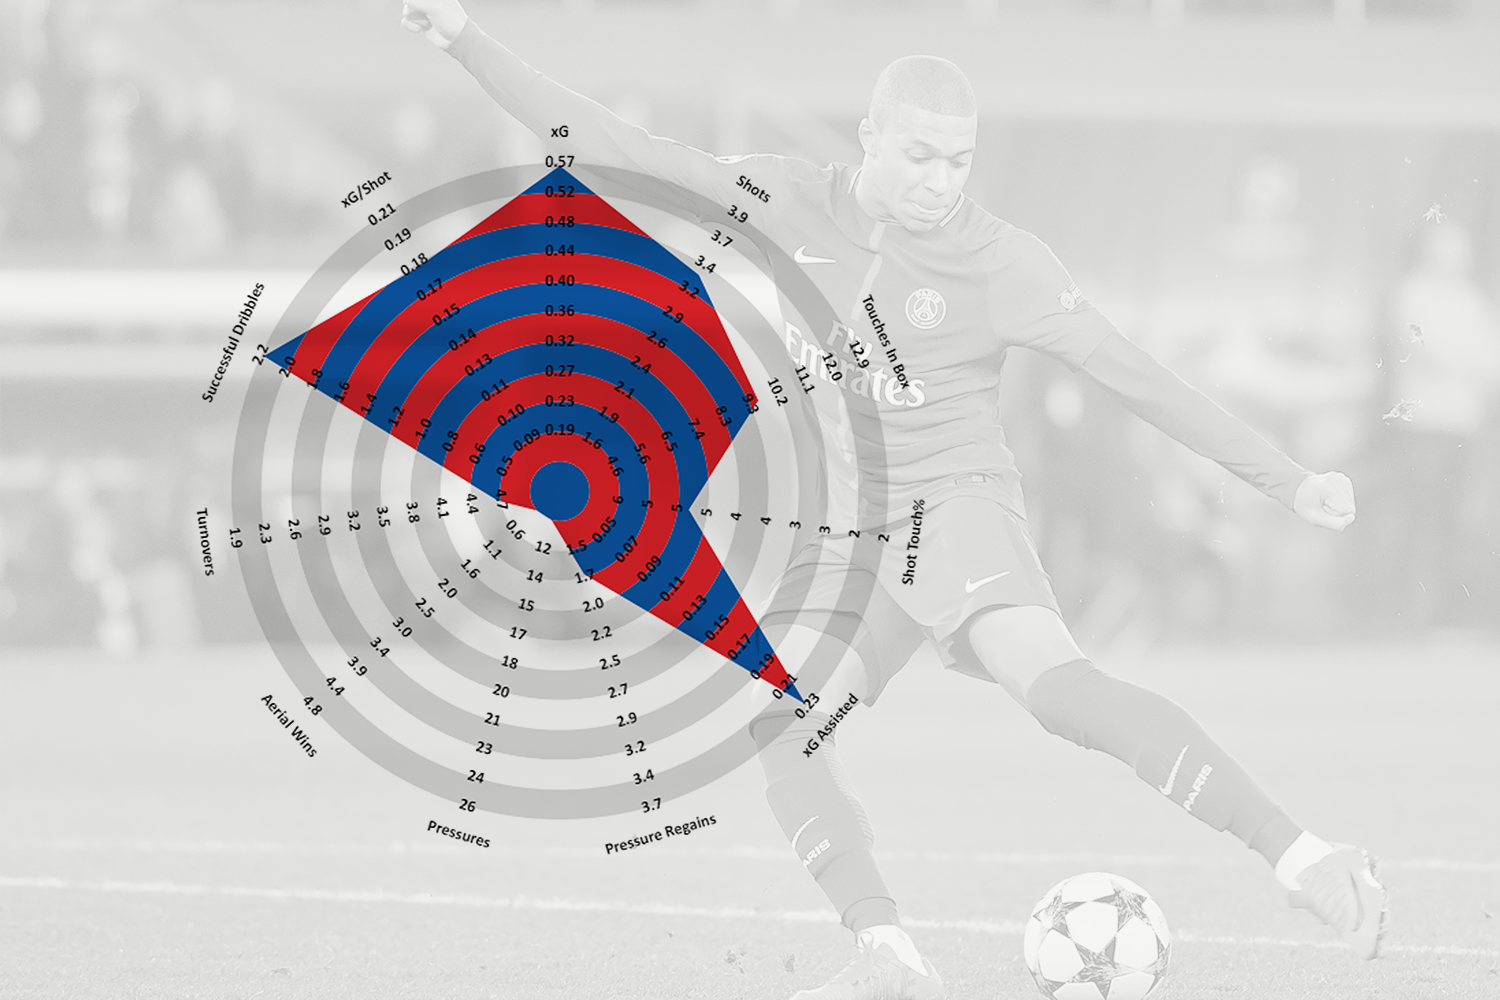
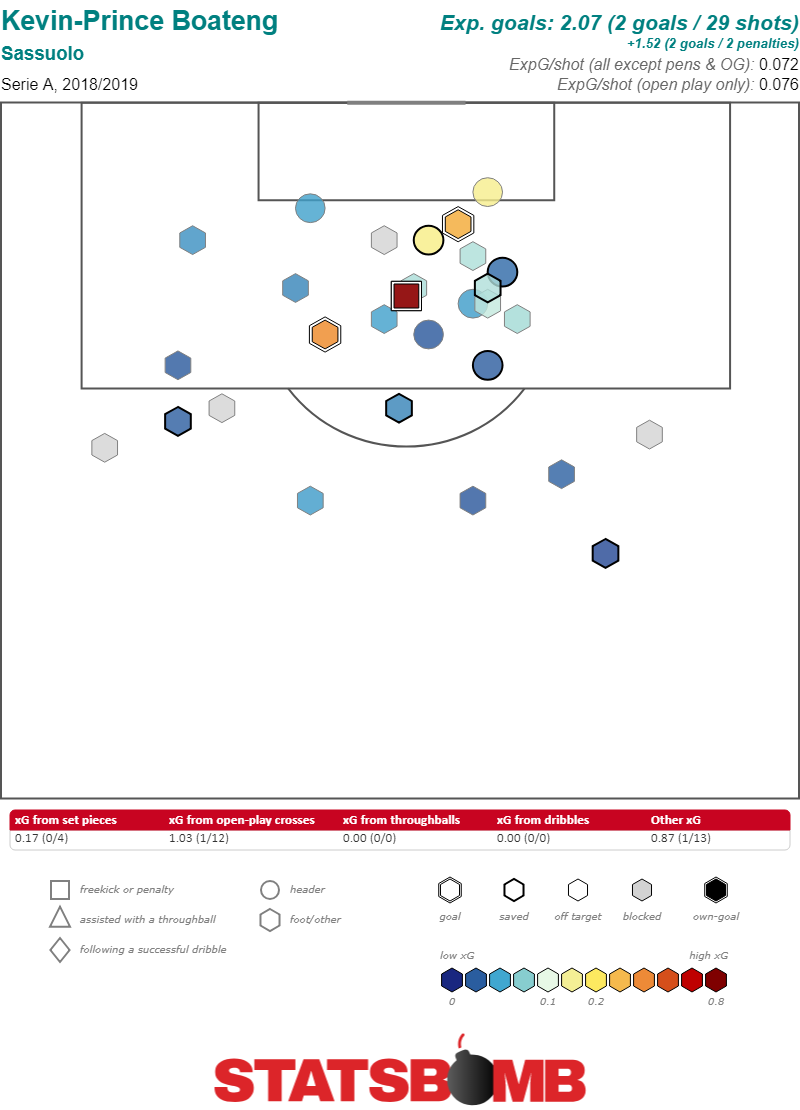
He doesn’t take very many shots, 2.64 per game is extremely mediocre for a forward. And the shots that he does take are terrible. His 0.07 xG per shot is literally off the charts bad for our radars. There’s no worse combination of outcomes for a striker than only being able to manage taking a small number of really unlikely shots.
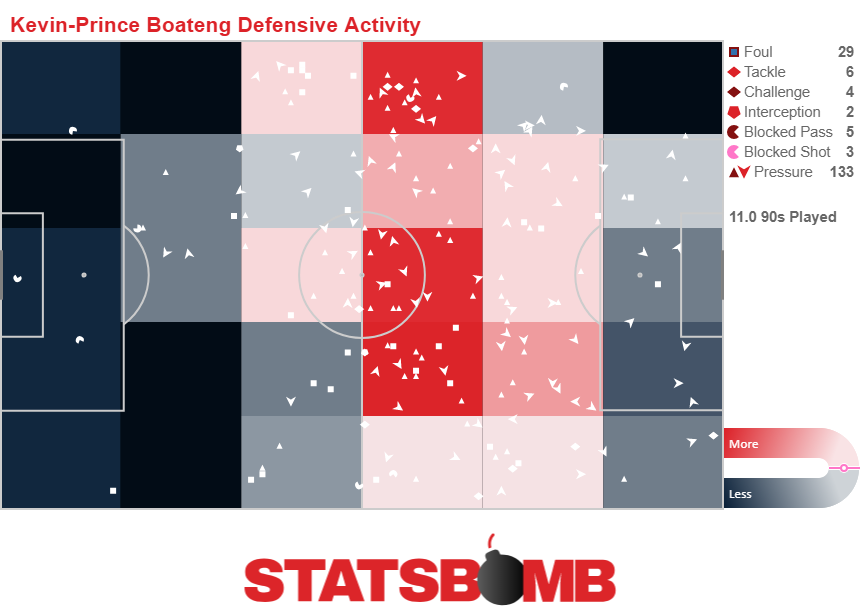
Perhaps there’s something else to his contributions though? Given that he is a former midfielder and an unconventional striker at best, maybe there are some distributional aspects to his play that the numbers fail to account for. Perhaps he’s dropping deeper and creating chances for runners in behind him, or he’s an integral part of an aggressive pressing team, where he defends from the front? If that’s the case it also doesn’t show up in the numbers. Here’s how he appears on the attacking midfield radar.
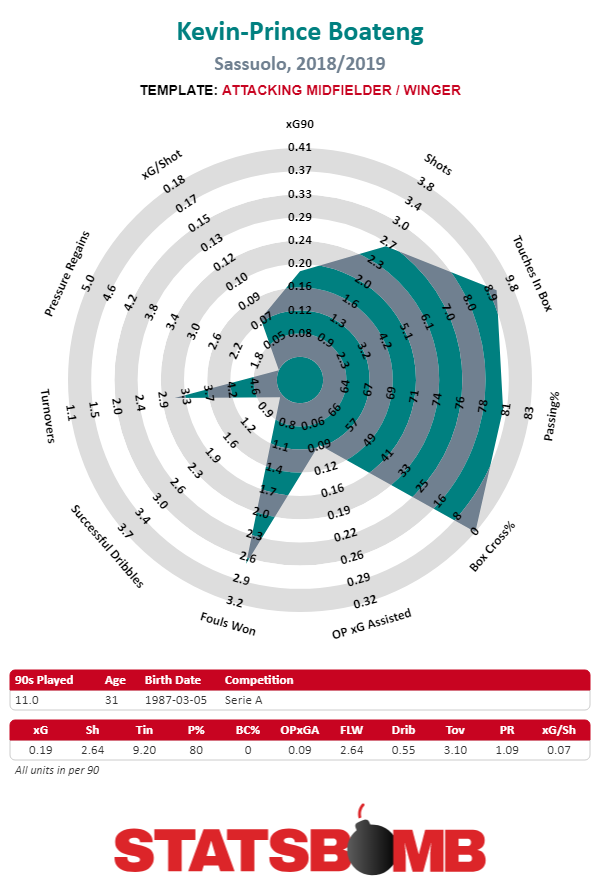
It’s a slightly larger blob, but it’s not actually more impressive. His average number of touches in the box for a striker shows up impressively on the attacking midfielder template, and his pass completion percentage is pretty high. But that’s about it. There’s nothing here that suggests he’s creating a lot of opportunity for others. His expected goals assisted from open play per 90 is an exceedingly low 0.09. If he’s doing something creative with the ball, it’s not showing up in the shots he’s creating for his teammates.
In Boateng’s defense, Sassuolo play the game at a very slow pace. They’re actually slightly more invested in possession that you might expect from Serie A’s 12th place club. They play 533 passes a game, tied with Roma for the sixth most in the league and allow only 442, the sixth fewest. They’re happy to have the ball and not do a ton with it, as long as their opponent doesn’t have a chance to get the ball and attack them. It’s a necessary strategy because when they do give up the ball, they’re completely unable to stop opponents from attacking them.
Despite giving up only 13.30 shots per match, the ninth most in the league, a respectable total, the expected goals they’ve allowed from those shots is a mind blowing, 1.43, tied for the fourth worst in the league. A brief look at their defensive activity map might serve to explain why.
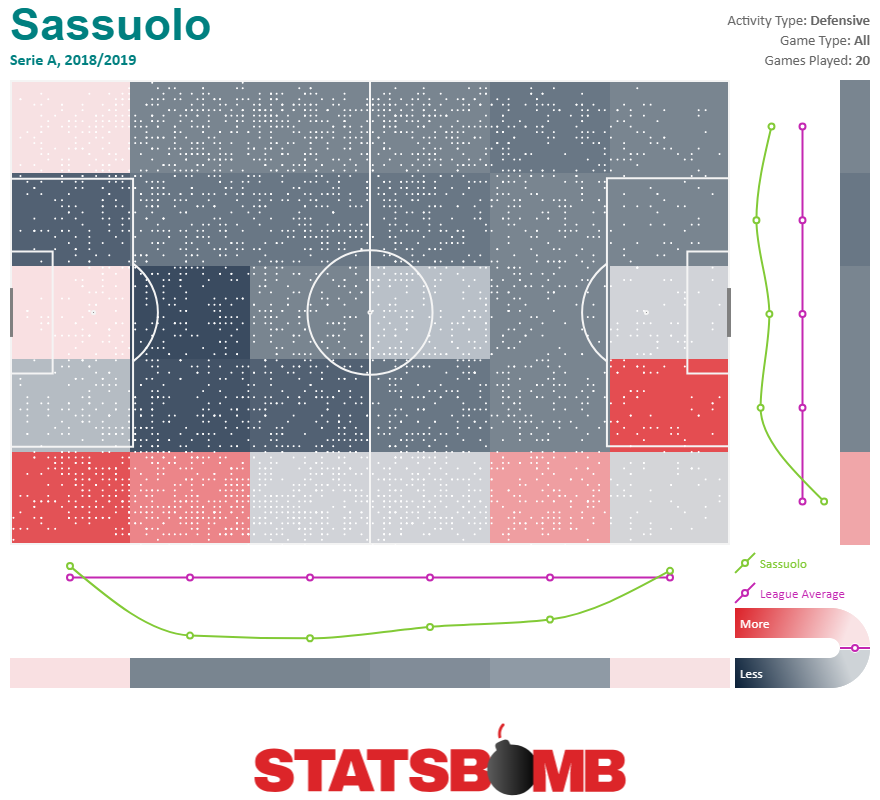
Against that backdrop, Boateng’s defensive contributions from the top look pretty decent. He’s committed to harrying the ball around the halfway line even if the team behind him consists entirely of, well, not much of anything.
Squint and you can almost see the stylistic appeal for Barcelona. Boateng plays up front for a midtable team that plays slowly and methodically. They insist on working the ball out of the back and are extremely patient in possession. That’s sort of Barcelona-ish. And while they turn all that possession into a mediocre number of terrible shots (a process which Boateng is an integral and negative part of) presumably when surrounded by superstar teammates that won’t be nearly as large a problem.
And defensively you can definitely see a role for Boateng as a closer. If Barcelona have a lead, bringing in Boateng for somebody like Ousmane Dembele or even Luis Suarez to shift that emphasis from attacking to defending makes some sense. Boateng can do that, the trade off will be that he’ll add much much (much much much) less on the attacking end, so much less that the trade off may not be worth it.
The question remains though. Why? It’s true that if you torture the numbers, and the scouting just right you can gin up a narrowly define role that Boateng makes sense in for Barcelona, but he’s not the only player that would make sense in that role. It’s not hard to find players that will willingly defend from the front in a substitute role. It’s especially not hard to find ones that are under 30. And while getting Boateng assures that you’re finding an unconventional attacker who is used to playing in a possession oriented system, it also assures that you’re getting an attacker who doesn’t give you much output in that system.
The benefit of being Barcelona is that there’s a lot of wiggle room to make mistakes at the margins. Going and getting Boateng on loan, whatever the reason, won’t hurt this squad overall. They’ve acquired better players for more money than Boateng who have flopped at providing frontline depth while not slowing the super team down (whither art thou Arda Turan). The main cost though is the opportunity cost. Bringing in Boateng to fill this role means not bringing in somebody younger and potentially better to fill that role.
Slice the numbers just right and it’s possible to make an argument that explains what role Boateng will fill at Barcelona. That’s fine, as far as it goes. But no matter how long you look you’ll never find a good reason for Barcelona going and getting a mediocre 32 year old to be the one to fill that role. That decision will remain a mystery
Header image courtesy of the Press Association
Football is a team game, but every team is made up of individuals. And if there’s one thing about fans, it’s that we love individual players to rally behind. And there are plenty to choose from up and down the Women’s Super League. From Arsenal, running away with the league; to recent champions Manchester City and Chelsea, as well as Birmingham City and Reading, in the chasing pack; down to struggling teams at the bottom like Brighton, Yeovil, and Everton. Here are some of the best picks from StatsBomb’s WSL data.
(Ed. note- as always please allow for some data lag in our analysis. Specifically the Manchester City v West Ham match is currently not in our data set, therefore crediting Georgia Stanway with two fewer goals than her actual seven)
Youngsters tearing up the league
WSL is blessed by some great young wingers. Two are on Merseyside, Liverpool’s Rinsola Babajide and Everton’s Chloe Kelly are first and third in the league for successful dribbles per 90 minutes. Babajide is averaging over four, literally off the charts on our radars, so woe betide any full-back coming up against her. 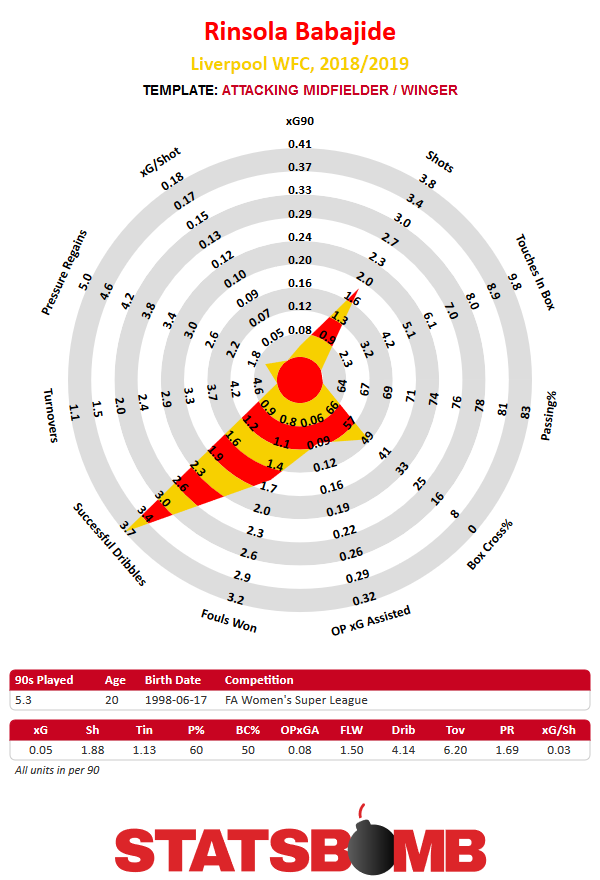
Between Babajide and Kelly is Manchester City’s Caroline Weir. Weir consistently terrorises the right-side of opponent defences, averaging 3.15 dribbles per 90 minutes. She has three goals to her name already, including a superb strike against West Ham United (a reward for some otherwise slightly errant shot selection that sees her shots average just a six per cent chance of going in).
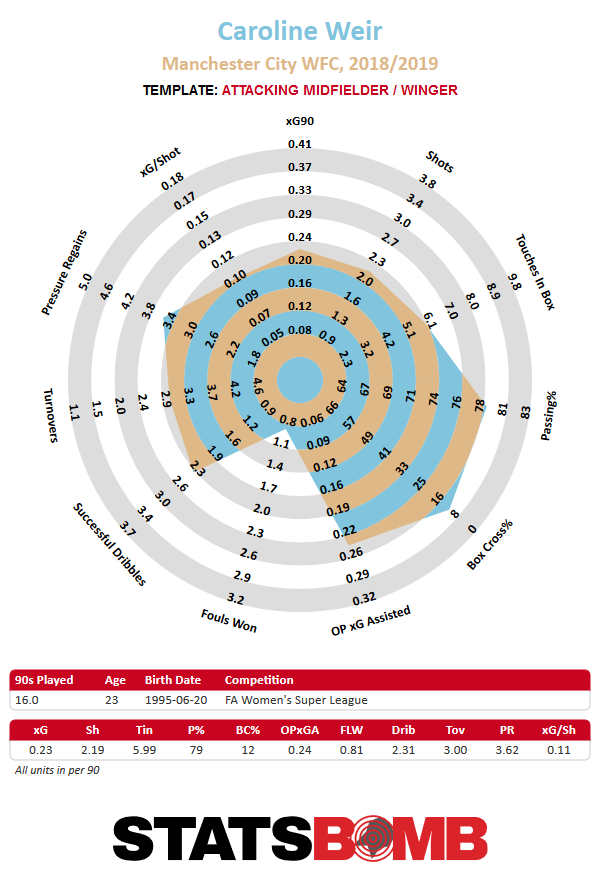
At the moment, she’s off the charts for the quality of chances that she sets up. They’re worth over 0.34 expected goals per 90 minutes that she plays - or one assist for every three full games. Only two other players in the league - Beth Mead at Arsenal and Gemma Davison at Reading - do better.
Working hard on the wing
It’ll usually be players at the top teams who dominate statistical categories - and we’re going to see some real heavyweight examples of that later on - but there’s a lot of incredibly hard work going on across the WSL. Ellie Brazil at Brighton leads the league for pressure events per 90 minutes, locking down the right flank (defending the goal to the left of the graphic).
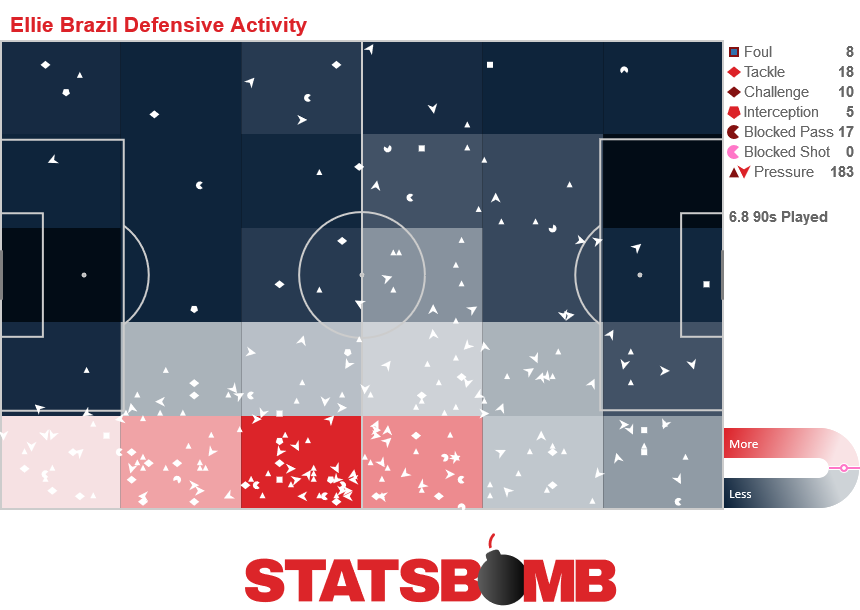
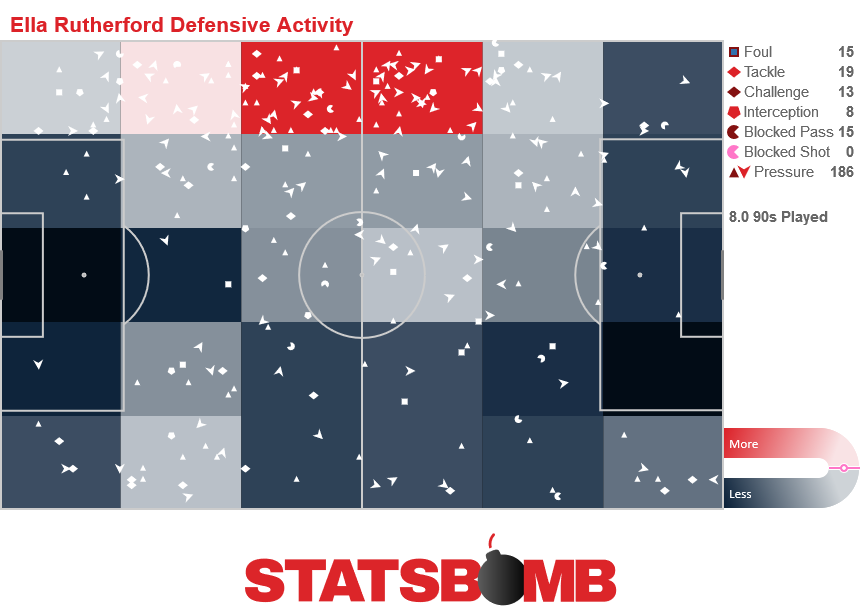
Just behind her, and on the opposite flank, is Ella Rutherford at Bristol City. At 19 and 18 respectively, Brazil and Rutherford are putting in hard yards for their team and getting experience that will serve them well in the future.
Dominating the middle
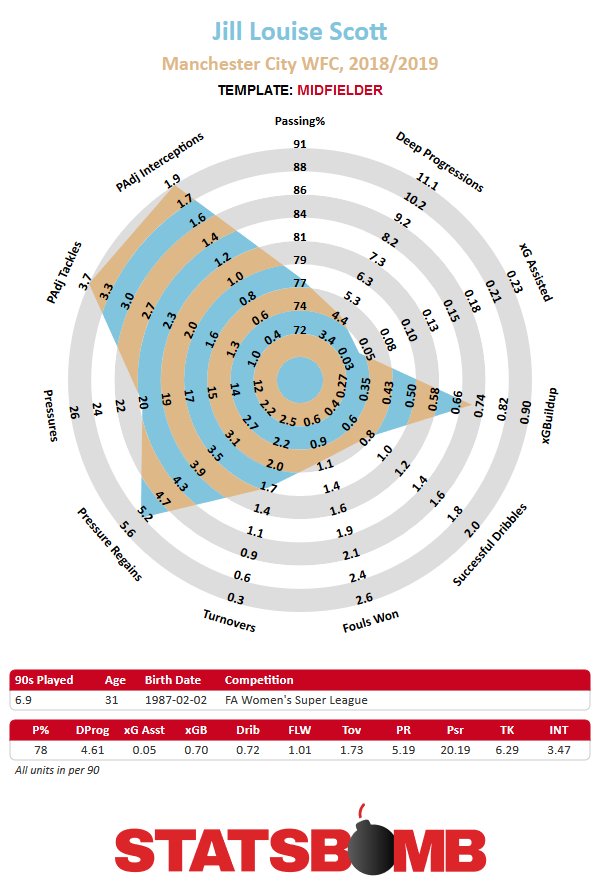
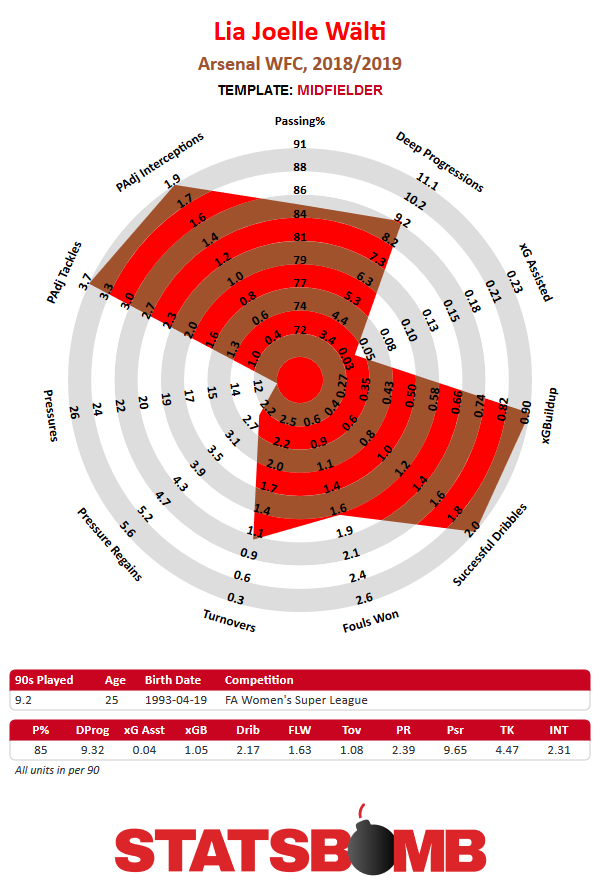
Chasing down opponents isn’t just for teenagers though. Behind the two whippersnappers, and leading the way for pressures that lead to her team getting the ball, is Manchester City’s Jill Scott. Scott’s been at the top of the game for over a decade, winning her first England cap back in 2006, and is still a hell of a midfielder. She’s arguably the best defensive midfielder in the WSL. Running her close, though, is Arsenal’s summer Swiss signing Lia Wälti. Wälti makes an impressive amount of tackles and interceptions considering how much of the ball the Gunners have, and, once she gets it, she moves it forward towards goal as well. The combination of defensive actions and successful dribbles make her a very important part of the team.
Safe hands
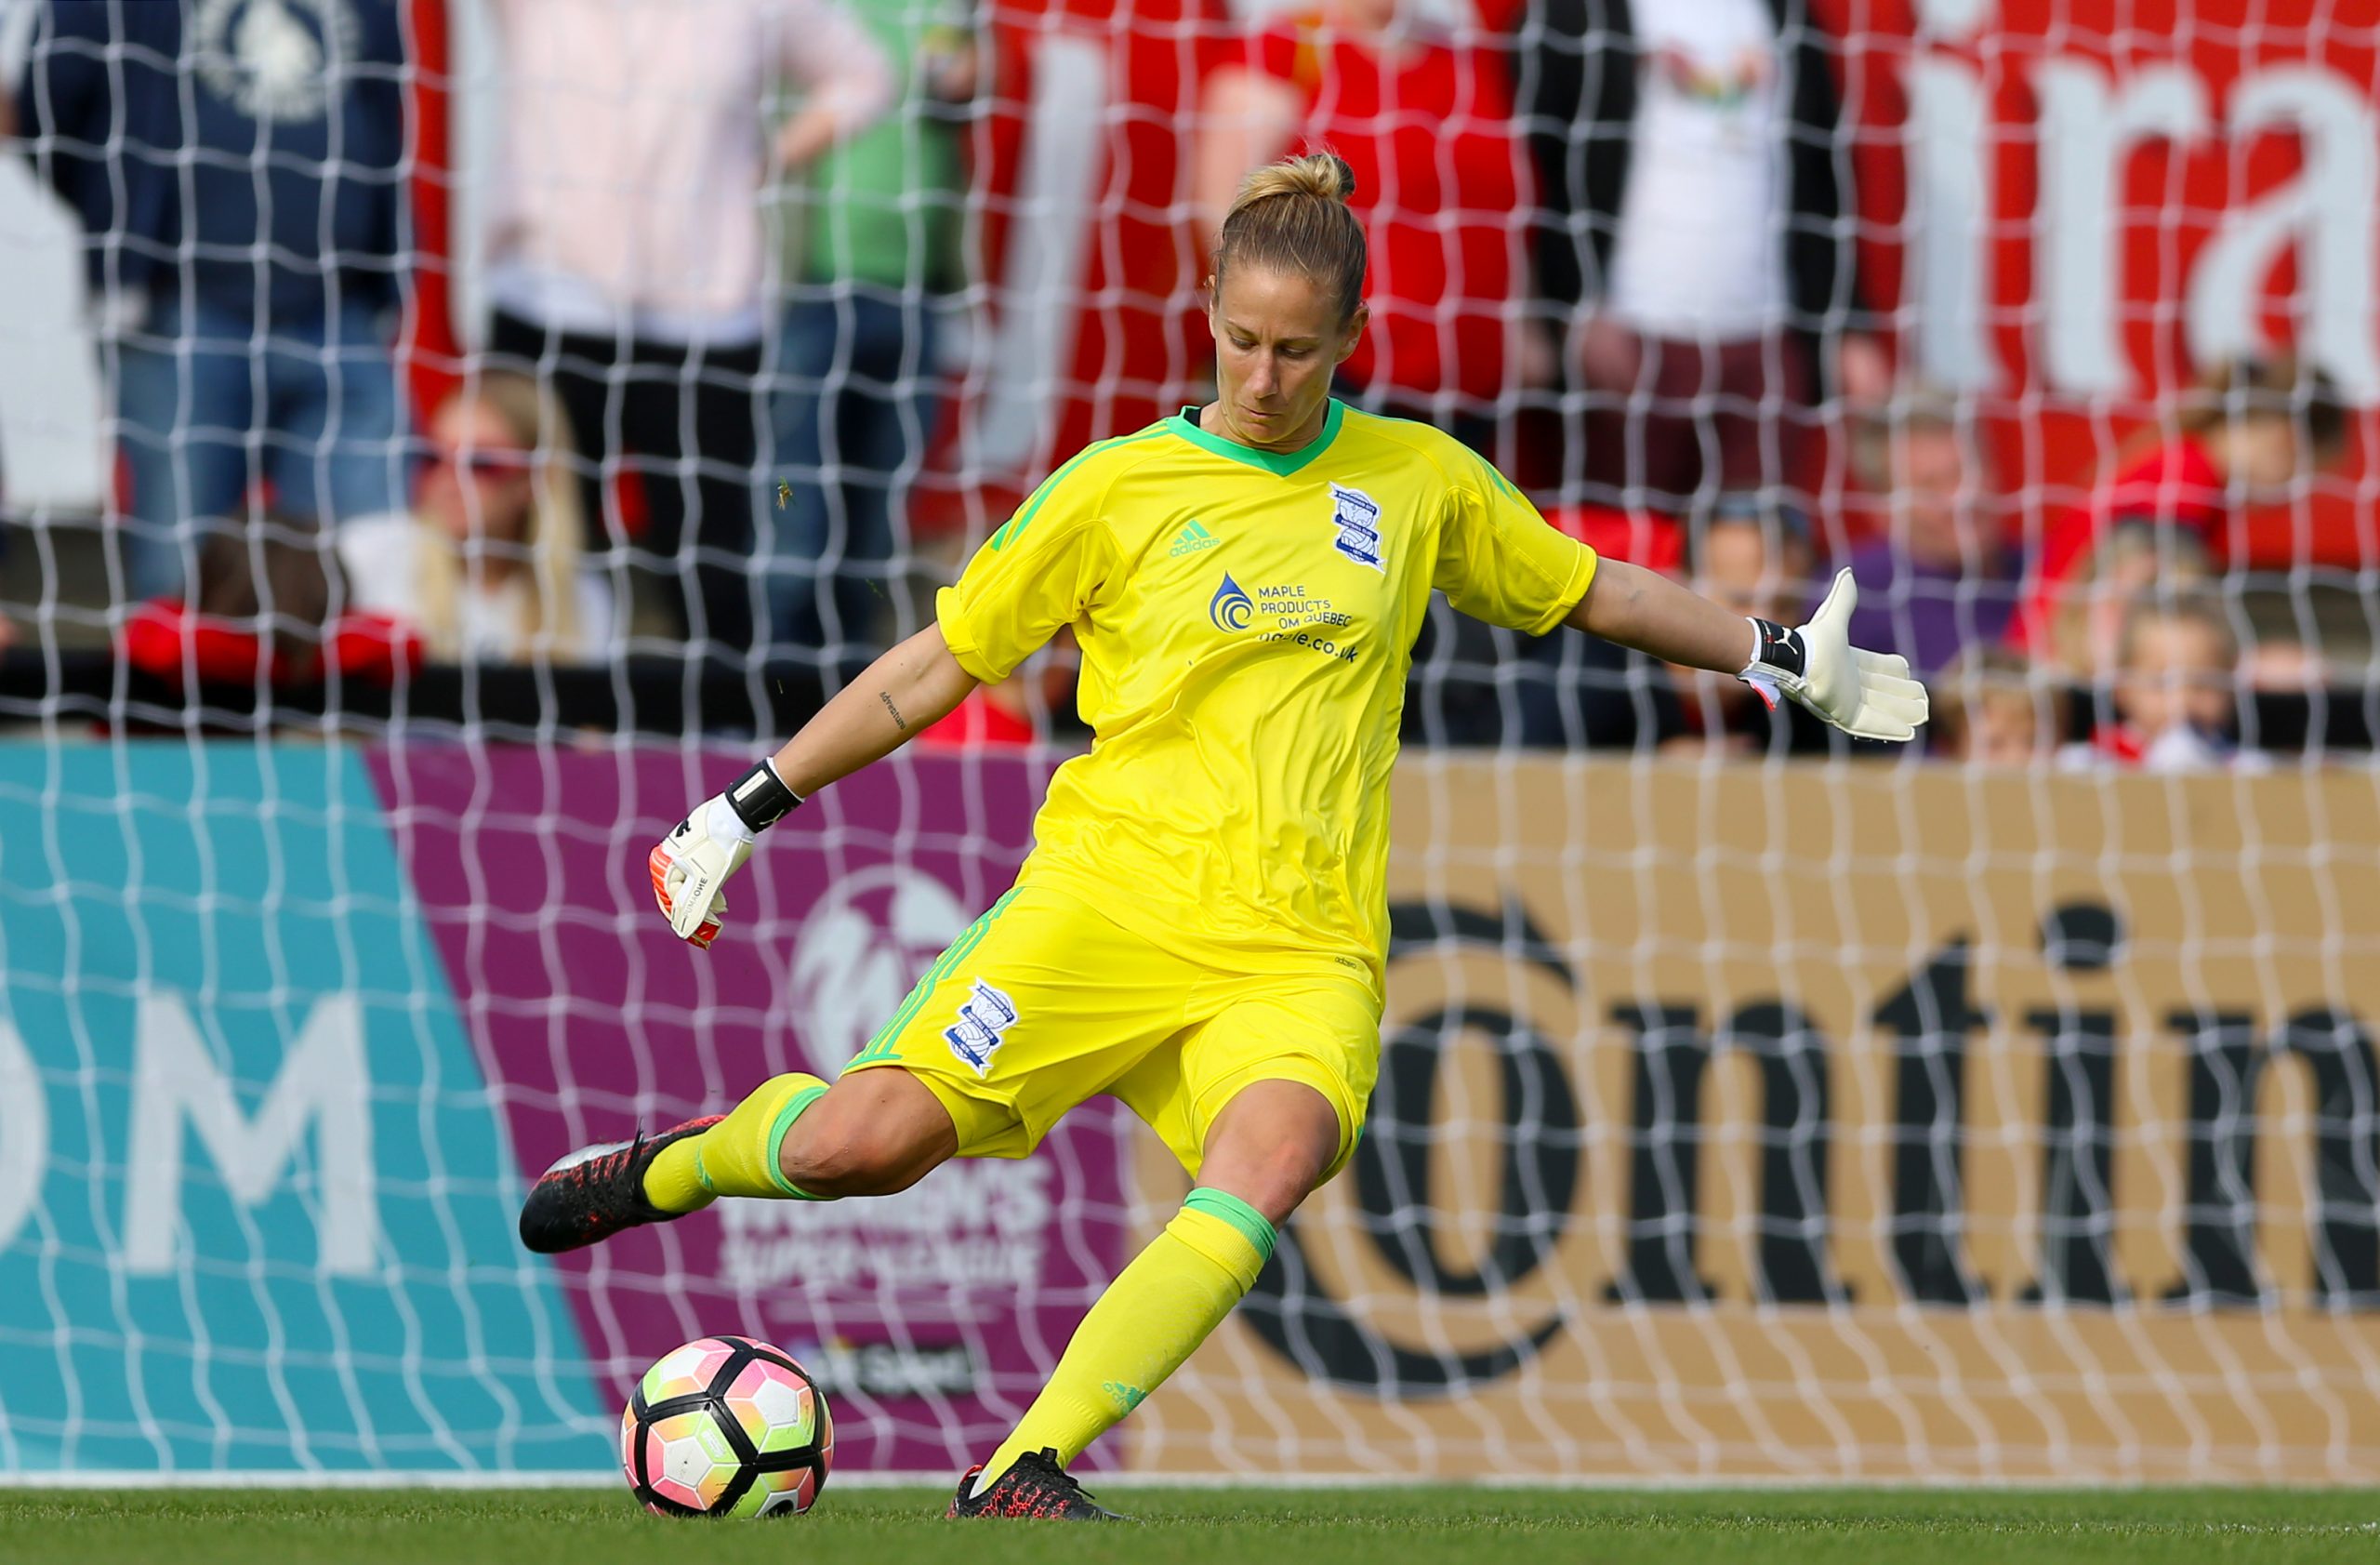
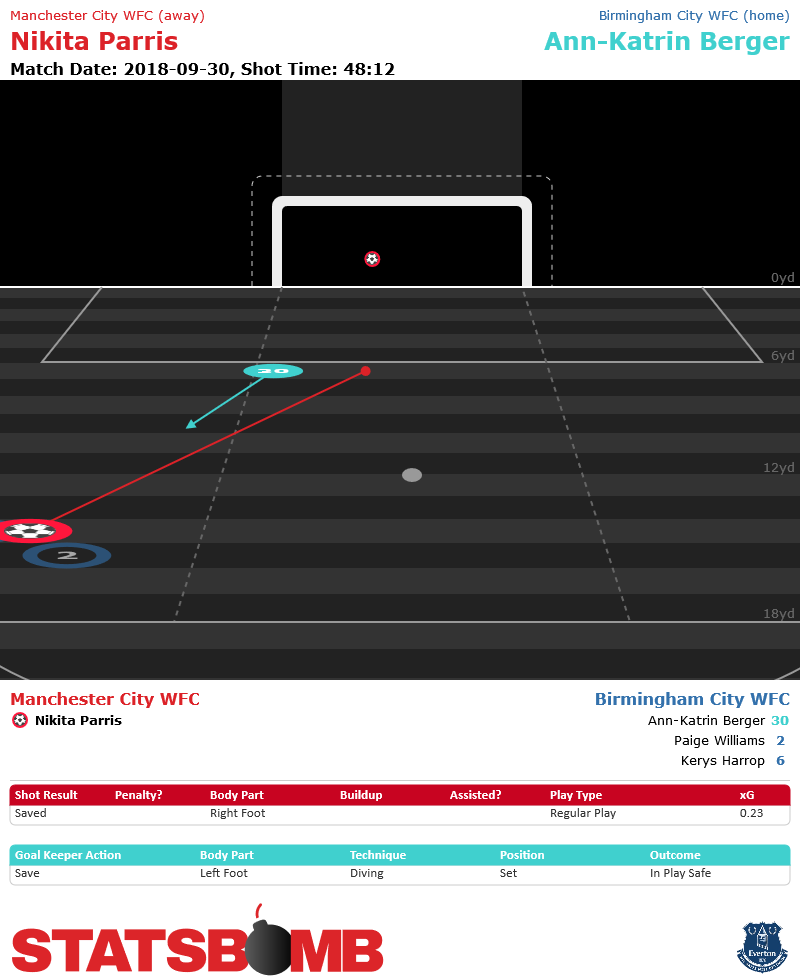
While we’re speaking about crucially important parts of the team, it makes sense to mention Ann-Katrin Berger, Birmingham City’s goalkeeper. As things currently stand, the Blues are third in the league, just two points behind Manchester City and three points ahead of WSL holders Chelsea. Berger’s part in that can’t be understated - out of WSL’s starting goalkeepers she leads the way for saves above expectation.
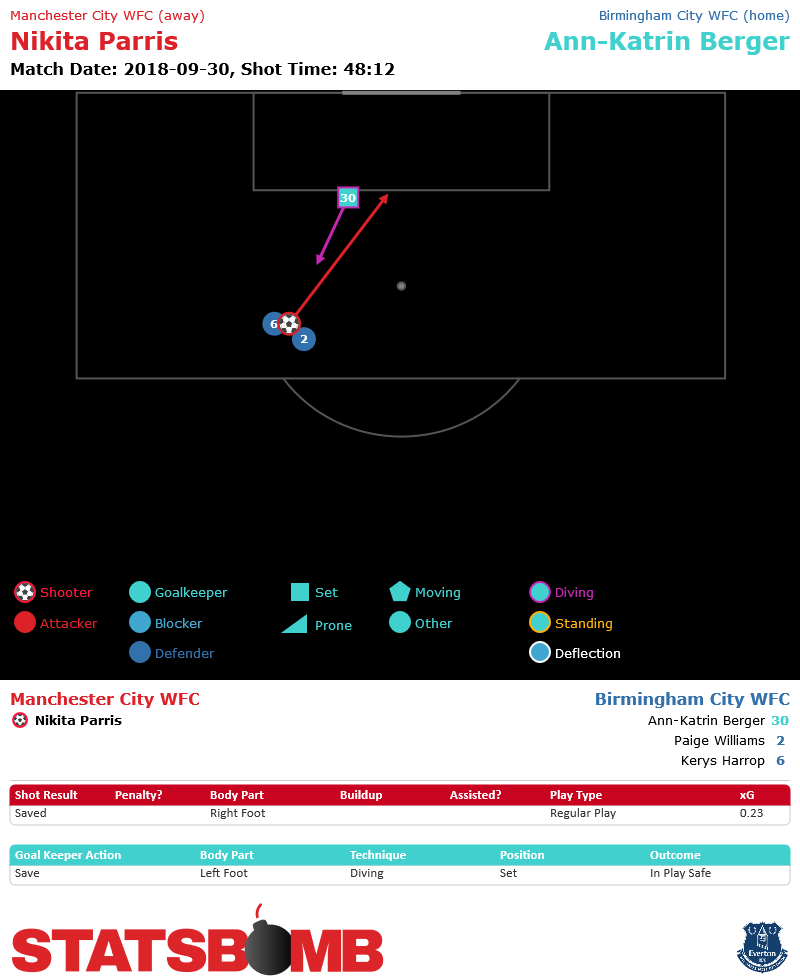
Taking into account the quality of shots she’s faced, she’d be expected to save 69.9 per cent of them; in actual fact, she’s saved 82.8 per cent. Is there anything opponents can do to improve their chances? StatsBomb’s data suggests there might be a couple of holes low to her right or high to her left...
 Racking up goals like no tomorrow
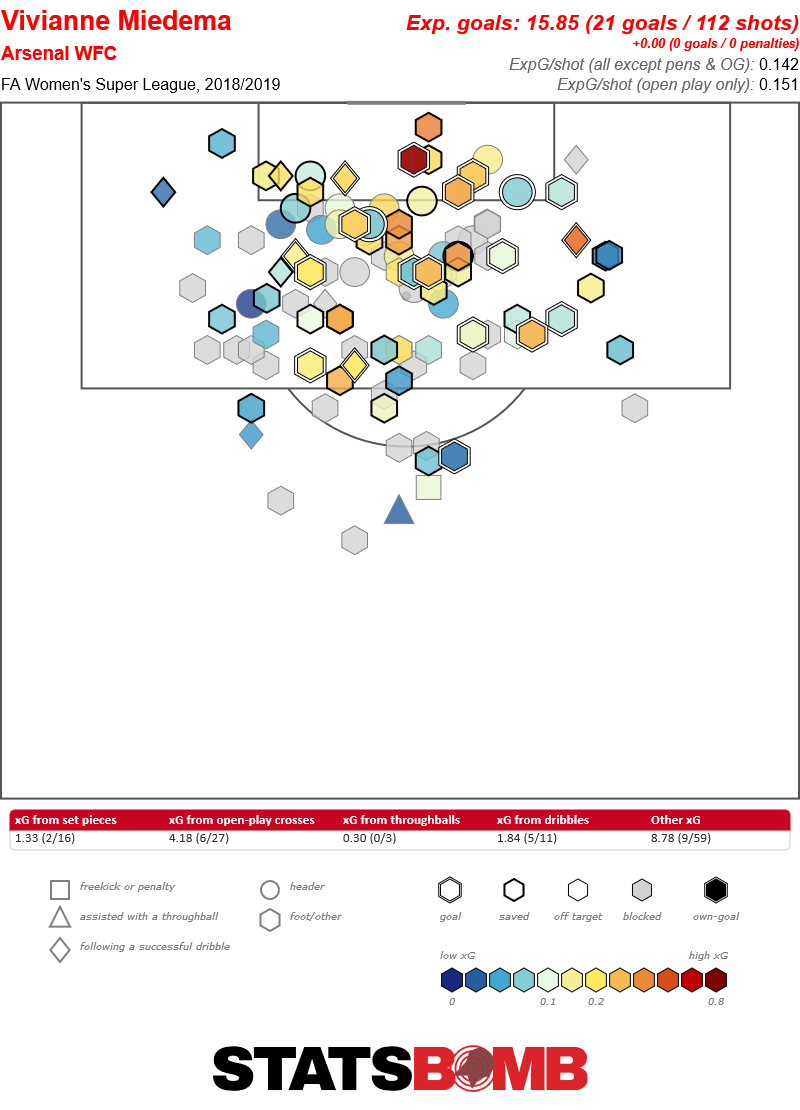
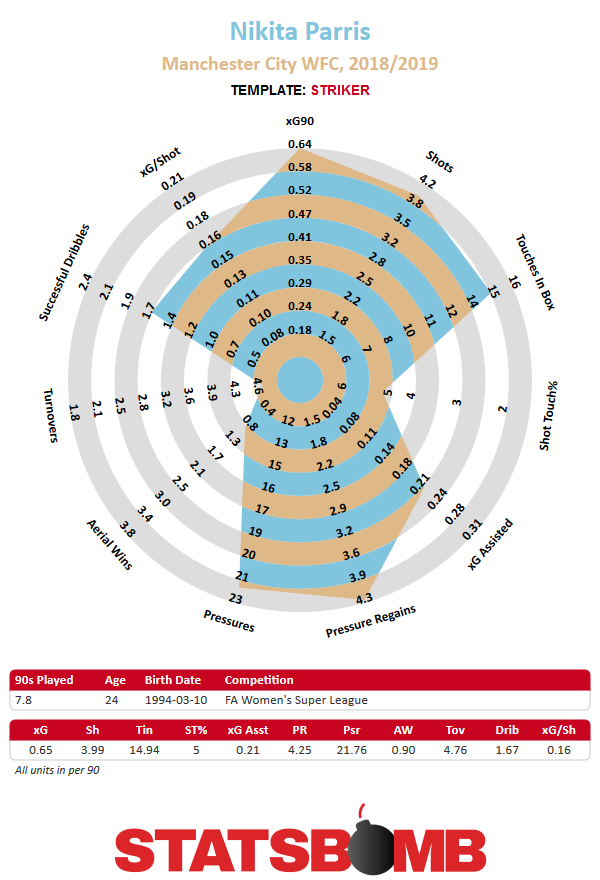
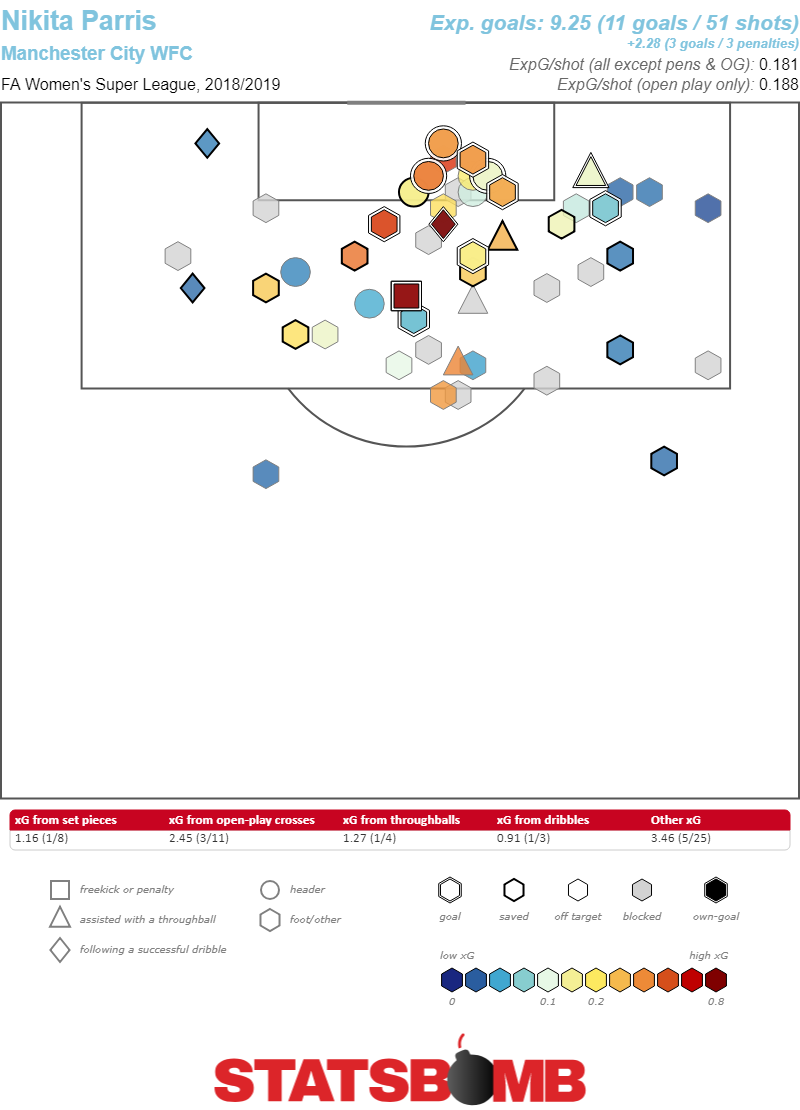
Not that Vivianne Miedema or Nikita Parris would need help scoring goals. The pair are extraordinarily good, both in terms of volume and quality of chances that they get on the end of (although being on teams as good as Arsenal and City certainly helps). The amount of pressure that Parris applies on opponents embodies defending from the front.
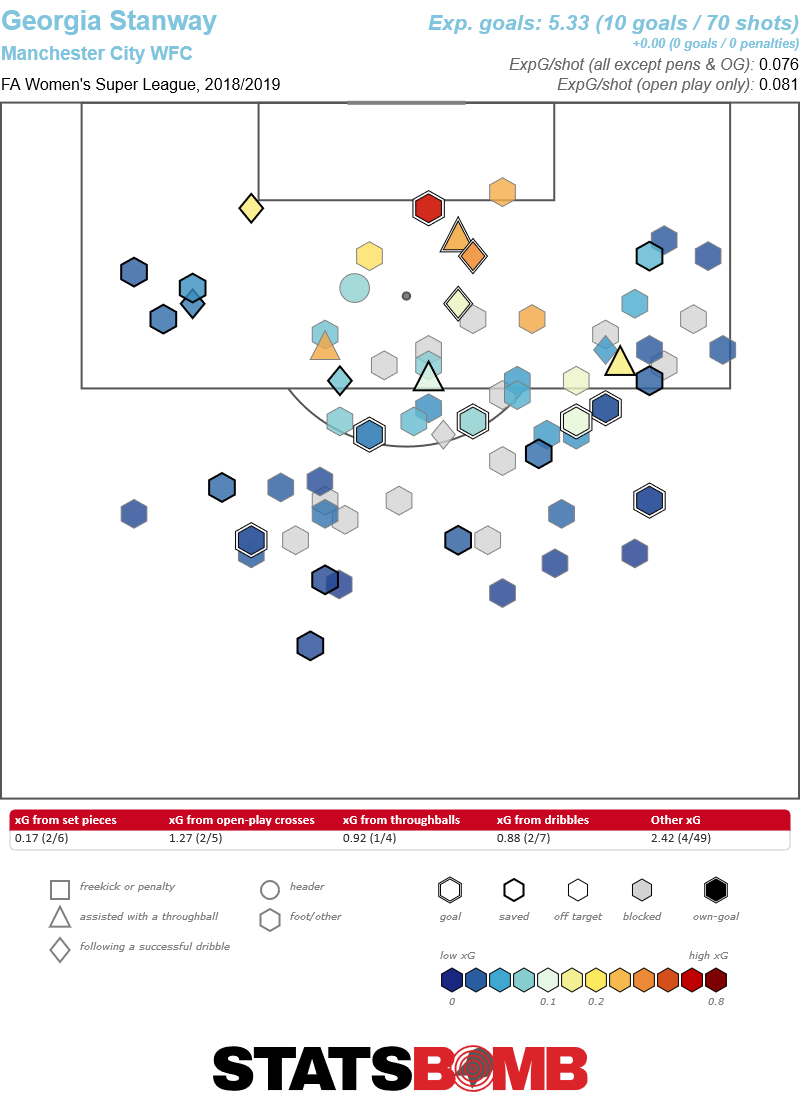
Parris’ team-mate Georgia Stanway has also been amongst the goals recently, although who knows whether it’ll last. She’s scored more than double what her expected goals would think, with a shot map that’s almost the exact opposite of Parris’.
Across the entire league there are some cracking players to be excited about, and there’s just over half of the WSL left to go. Get yourself down to a game.
The first professional women’s match I attended in person was the 2010/11 Champions League Final between Lyon and Turbine Potsdam.
A few rows in front sat Trevor Brooking and Michel Platini.
Yeah, I didn’t slum it for my first game.
It was a great match with the technical French side winning 2-0 against the more physical Germans. Three things stood out. Firstly, Potsdam No 10 Fatmire Bajramaj, still one of the best technical players I’ve ever seen in the flesh. Secondly, Lyon substitute Lara Dickenmann’s half-time warm up that would’ve given a Ronaldinho trick show a run for its money. And lastly, but not erm, leastly, Sarah Bouhaddi, Lyon’s goalkeeper.
Man, was she good.
She effortlessly plucked every cross out of the air and was comfortable with the ball at her feet. Bouhaddi made a Champions League Final look like a training session. The last professional women’s match I attended in person was last week’s FA Women’s Super League (FAWSL) game between West Ham and Chelsea. The Irons’ keeper Becky Spencer was given player of the match and certainly deserved it having made three great saves in the first half alone. Watch them here.
It’s all a little bit odd as every time I speak to any male friends (who barely watch women’s football) they immediately raise the state of the goalkeeping as being terrible…
The guys at Statsbomb have started collecting data on the FAWSL and the National Women’s Soccer League in the United States this year. Now, the data set is still waaaaay too small to conclude anything but imagine my delight on discovering that so far, when you lay a shooting model from the professional men’s’ game over the women’s data, the goalkeepers in women’s football are performing better than their male counterparts. They’re breaking the model.
As the data gets gathered I felt it was a nice time to get some views from within the game itself. Andy Elleray is goalkeeping coach at Birmingham City Women and is England Women’s Youth International goalkeeping coach too. Do his coaching sessions for women look different to ones he coaches for men? What differences must be accounted for?
“The sessions don’t look amazingly different to be honest,” says Elleray. “It’s all based around the keepers you’re working with and the way the club wants them to play. In terms of attributes, female keepers are not as powerful so lots of work is done on jumping mechanics, speed to cover the goal and defend the area. Distribution is a big area for us and the goalkeepers must be able to play with variation - especially in our half of the pitch. The length that females can strike a ball is more often than not shorter than males so we look for our goalkeepers to play what we call PACE (positively, accurately, consistently and effectively) rather than rely on hitting areas and turning the opposition defence."
The data collected so far backs these statements up. Only Sophie Baggaley at Bristol City and Megan Walsh at Yeovil relentlessly go long. Here’s what Birmingham keeper Ann-Katrin Berger’s distribution looks like:
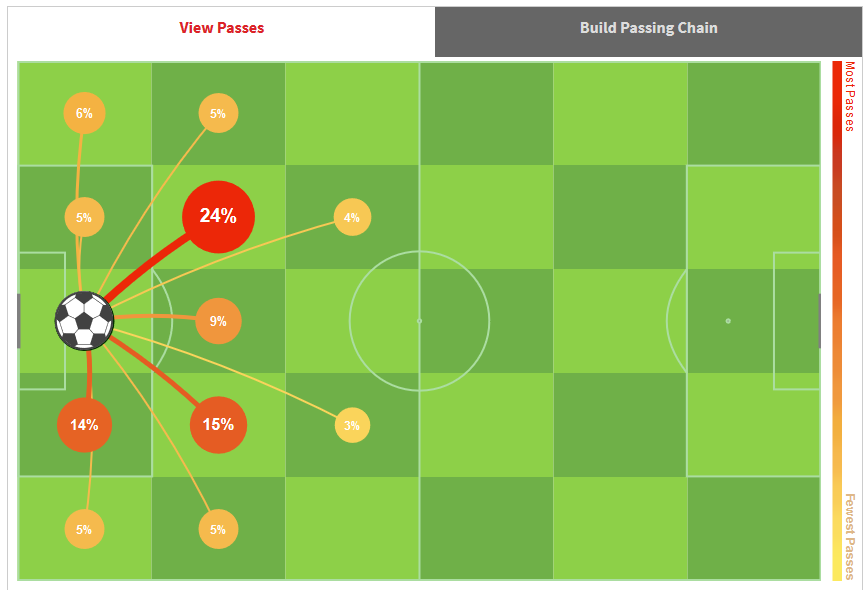
“With the role of the goalkeeper ever evolving I can see more statistics based around distribution,” says Elleray. “I have developed my own distribution analysis that I use at various points to assess how well we are retaining the ball or penetrating the opposition.”
Lloyd Yaxley, goalkeeping coach at NWSL club Orlando Pride is in agreement. “I think there will definitely be statistical differences between the men's and women's data. With distribution, the male goalkeepers’ range of passing is for the most part significantly longer than in the women's game. I think if you were to take something as simple as a long goal kick and compare the average length of a Major League Soccer goalkeeper to a NWSL goalkeeper there would probably be at least a 15-20 yard difference.”
Despite this, Yaxley states that like Elleray, his sessions for men and women don’t look that different. “I try and keep my philosophies towards the role of the goalkeeper as set as I can and how I want my goalkeepers to perform wouldn't change all that much. I would want them to be aggressive in certain situations and then in other areas less aggressive and maybe play deeper in their goal. With shot stopping I like my goalkeepers to be deeper so to allow for more reaction time - especially when there are a lot of bodies in front - this I would keep the same for males and females.”
Yaxley thinks having the ability to parry into safe areas is a significant attribute to have and is working to bring this to the women’s game as standards continually rise. “Men are used to the ball being struck at greater pace and therefore with greater movement too. We work on this with the Pride goalkeepers - especially if it’s a reaction exercise or I connect with a strike really well then we look at manipulating the body to best control the rebound. For example, when the ball is struck at pace and straight at you, rotating wrists and leaning with the shoulders late forces the ball into a wide area. If the lean of the shoulders comes too early, the control of where the ball ends up is often lost.”
How much does data influence training at present?
“I don’t really use data on a daily basis, but the higher you go at international level there is lots of work done on goalkeeper specific stats throughout the teams to analyse, review and compare keepers,” says Elleray. “I have written lots of research on goalkeepers from various view points and am a massive advocate of using video analysis throughout the coaching process. Recently there has been clubs using GPS data to measure goalkeeper training load and different types of movements and this is an area that I will be moving more towards. At any turn statistics should be used to aid the process not take it over."
Yaxley uses numbers in a different way.
“The main data I analyse is where the opposition is shooting from and scoring from and on the flip side, where we are conceding shots from and conceding goal from. We look at opposition trends and their style of play, danger players’ traits - do they like to cut in from the left and shoot with their right, are they getting to the line and cutting it back, for example. That will all help shape my focus for the weeks training.”
The level of detail StatsBomb collects at goalkeeping level now would aid such a process, and enable quicker analysis of your own players too. You’ve all seen the shot maps on site by now but there’s some cool new stuff deeper under the hood:
We’ve never been able to dive down and get dirty to this degree until now. As one keeping coach I follow on twitter is fond of saying…I’m #alloverit Header image courtesy of the Press Association
(Editor's Note: This was originally published on the StatsBomb Services blog, but the URL was lost in a server move. We have re-published it here so it can be referenced in future work.)
Some of the work we need to do on the StatsBomb Services side involves teaching people how to use what we create. If it’s not practically applicable and/or can’t be taught, then it’s just a piece of art, not analytics.Today I’m going to discuss passing networks, with a specific emphasis on the xGChain passing networks you’ll find on the StatsBomb IQ platform and also on our Twitter feed.
What is a Passing Network?
It’s the application of network theory and social network analysis to passing data in football. Each player is a node, and the passes between them are connections.
The first time I saw them used in football was either a presentation by Pedro Marques of Man City at the first OptaPro Forum, or Devin Pleuler’s work at Central Winger on the MLS site.
We also used them at Brentford to do opposition analysis, specifically to find which players we might want to aggressively press whenever they get the ball, or looking at valuable connections between players we wanted to break.
The application is simple.
- Look at a bunch of recent matches for a club and you will often start to see patterns of play and interesting details you care about.
- Investigate a little further in the data to find usage information
- Go to the video and see what shakes out.
In many cases, analysts only have time to watch and analyse the last 3 matches of opposition on video. Using the passing networks gives them quick info in an easily digestible format that doesn’t cost them an extra 10-20 hours of video time.
Before we go any further though, I think it’s important to speak about the limitations of passing networks. These are a tool and meant to be part of an analytics suite to help you analyse games, but like any tool, you need to understand their weaknesses.
First, each node consists of the average location of a player’s touches. If they switch sides of the pitch regularly, their average will look central, even if they never touch the ball in that area. This is a limitation of the vis and why we ALWAYS use video to back stuff up.
On the other hand, if you want to stay data-based, you could use things like heat maps, or even dot touch maps for every place a single player touched on the pitch to get more accuracy. This is a bit like using shot maps to supplement aggregate data in player radars to get a clearer picture.
The second limitation is that this info is an extrapolation of what actually happened. Did the fullback pass 15 times to the left wing, exactly along the path in the vis? No, of course not. That information is also easily visualized, but it’s just not contained here.
The third limitation is that these don’t actually explain that much by themselves. They take snapshots of actions through a match and combine them into a bigger picture. It’s like a movie where you only see 20 of 50 scenes without seeing the whole thing. Sometimes, you’ll end up with a clear idea of the plot. Other times, you are going to be really surprised when your friends start talking about the whole Verbal Kint/Kaiser Soze thing. They are still useful, but this is another reason why - in practice - we almost always pair this analysis with video work to complete the picture.
Design Stuff
Right, so we have passing networks. Some people do them vertically. We do them horizontally.
Why?
For starters, most humans are accustomed to looking at football matches left to right. High angle tactical cam footage from behind the goal is quite useful if you can get it, but the vast majority of the audience views football in a left to right perspective.
The next thing you notice is that we stack ours on top of each other. This happened as a bit of a happy accident where I noticed a pressing team had a map very high up the pitch. I then put the map from their opponent underneath, and voila! we had a fairly clear view of territoriality in the touch maps.
If you take a step back, it seems fairly obvious, right? There are two teams on the pitch, and each of their actions impacts the other one, so visualize both together. However, actions between two teams aren’t always linked. The shot locations of one team don’t have any impact on the locations of the opponent. Passes do though, so at least in my opinion, pairing them as part of this vis makes sense.
We also have them both going the same direction, which seems to strike some people as odd. All I can tell you is I think the territory element is much clearer if they go in the same direction, but people are welcome to test their own implementations and judge for themselves.
What else do we have… ah yes, the big difference: colour.
With passing networks, there is a real danger of adding so much information that your vis basically becomes unusable. It’s an incredibly info-dense visualization to begin with, so adding more elements is likely to make understanding what you are trying to display harder instead of easier. I think Thom walked this tightrope perfectly, adding the extra xGChain layer of data while still leaving it interpretable, and to be honest, totally gorgeous.
That said, it may take looking at these a number of times before you become comfortable with what they are trying to display. The same caveat was true of radars and shot maps, and is another reason why analysis blends elements of art with data science.
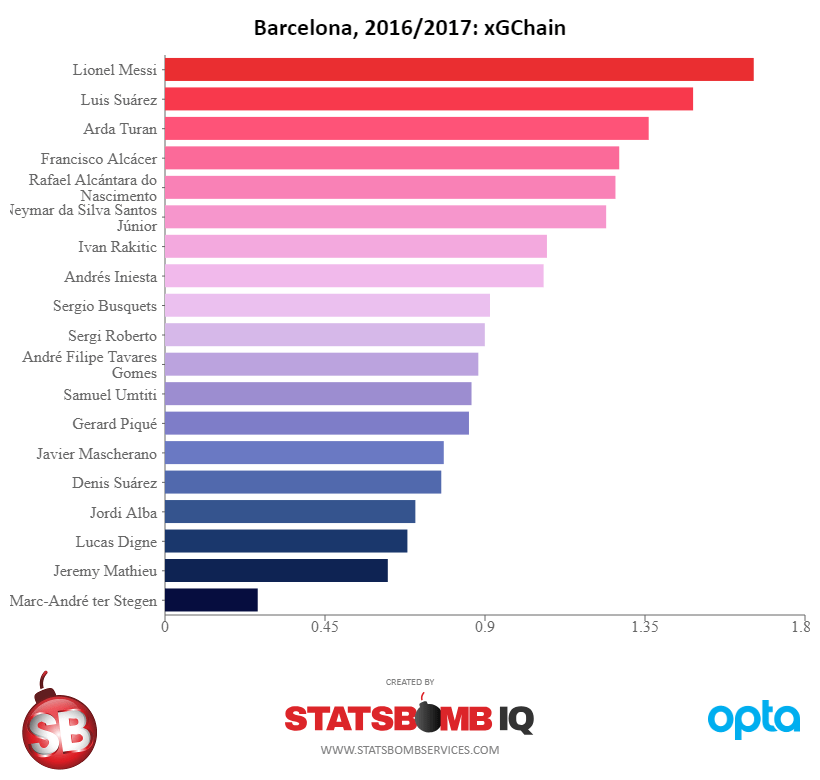
The xGChain Layer
First you need to understand what the xGChain metric is. So, any time a player is involved in a pass in the possession, they get xGC credit, and then we sum up their involvement over the course of a match and colour their node based on that.
Why?
Because this allows us to take the network vis beyond basic counting stats and starts to examine the value of a player’s contribution to the match. Because the colour scales are tied to the 5%/95% cutoffs I started back with the radars, you also get an easy reference for whether a player’s attacking contribution was pretty great (RED), pretty poor (GREEN), or somewhere in between.
We also start to get a sense of how non-attacking players are contributing to valuable build-up play in a way that just makes sense (at least to me).
Quick Reference
- Size of node = number of touches
- Thickness of line = number of passes between two nodes
- Colour of node = linear scale from green to red (.6-1.4 xGCh based on 5%/95% cutoffs)
- Colour of line = the total xGChain of possessions featuring a pass from A->B (0-.5 values based on 5%/95% cutoffs)
We Still Use Numbers
On Twitter, you will generally see just the visualization. This is mostly due to the limited, bite-size nature of the format. However, on the StatsBomb IQ app, Passing Networks also include all the individual and combination numbers you see below.
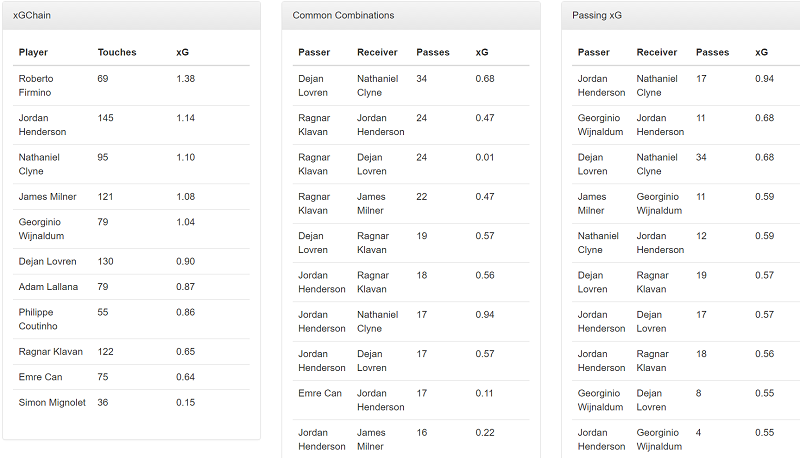
The combination of the vis and the numbers represents the whole of the analysis. The vis gives you basics, the numbers specifics, but both are still constrained by the limitations of this visualization format.
Examples
![]()
In this one you see Liverpool pushed quite far forward and had massive amounts of possession and created reasonable chances. Pretty much everyone is involved, but Coutinho and Lallana only put up good, not great xGChain numbers for the match. On the Swansea side, Llorente is the only guy up high most of the time, while he and Wayne Routledge both put up big numbers for the game, and Swansea came away with a vital win.
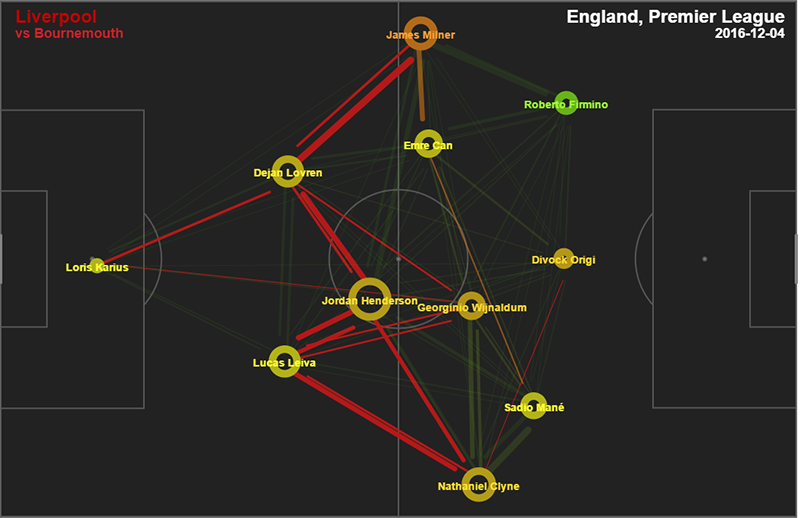
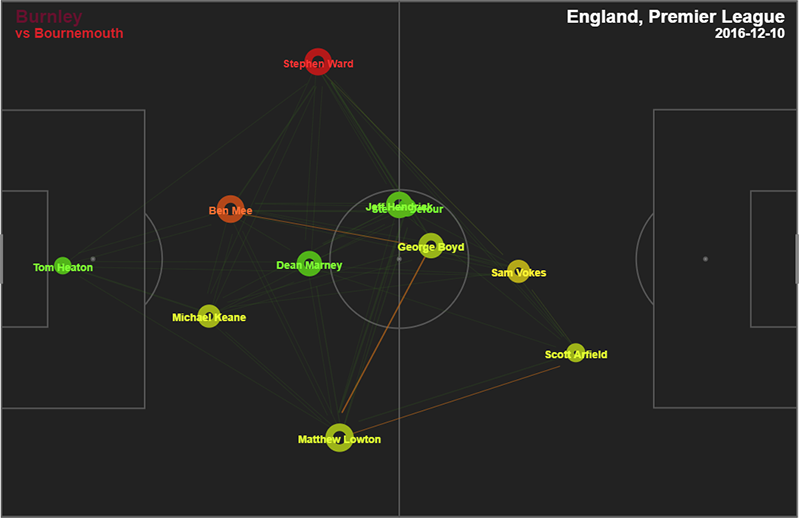
Just a single plot this time from Liverpool’s trip to Bournemouth earlier in the season, mostly to compare same team performance. Here Firmino is posted out wide instead of central, and had comparatively little impact in creating big scoring chances for LFC that match. Normally he’s a fiery red circle, but for this match he’s ineffective green. That’s another cool element these plots allow. Instead of focusing on the full match, you can isolate one player across a number of positions and games and see what it does to their performance.
![]()
I posted this one because both team’s maps are pretty incredible. City’s front three have average touches nearly on the 18, and nearly everyone except Claudio Bravo is red or orange. Meanwhile Boro had almost none of the ball and created almost nothing as well. The match ended 1-1, with Boro scoring a very late equalizer. 90% of the time our simulations think City win that match.
![]()
It’s always fascinating to see what happens to these maps when two elite teams square off. This is from the 1-0 Dortmund home win earlier this season. Bayern dominated the touches, but Dortmund just edged then in xG, 1.40 to 1.24. Aubameyang was rampant the entire game, and every time Dortmund touched the ball, they felt dangerous while doing a pretty good job of stymying Bayern’s great attackers.
How Do You Use This Inside a Professional Football Club?
Typically what I would do would be take passing networks for the last 10 matches from the next opposition and divide them into home and away games. Stick the numbers next to each of them for reference, and start to look for patterns.
Which players provide the engine for plan A when this team attacks?
Which players have the most valuable touches?
Does their fullback tend to get really high in possession and can we play behind them?
Which players should we look at for potential pressing triggers?
If we have a choice, which center back would we allow to play the ball forward?
Conclusion
This is already long, so I will wrap it up here. We view passing networks as an integral part of data-based football analysis. Provided you understand their limitations, they can provide a huge productivity boost to opposition and own team analysis. We also think the addition of our xGChain metric adds a layer of value to a visualization that previously only contained counting stats.
If you work in football and want to see what else the StatsBomb IQ platform has to offer, please get in touch.
--Ted Knutson
ted@statsbomb.com
@mixedknuts