Data has become an integral part of team and opposition analysis in the modern game. Creating a repeatable and automated process can quickly identify trends and insight, saving valuable time for the busy analyst. Teams and federations use StatsBomb IQ to support their team and opposition analysis, exploiting edges found in the platform to secure victory over their opponents every matchday.
Let’s demonstrate how this can be done by looking ahead to the Spain vs Switzerland quarter-final at Euro 2020.
SPAIN
Spain qualified from Group E in 2nd place – failing to beat Sweden or Poland in their opening games of the tournament before a 5-0 thumping of Slovakia in the deciding match secured their advance to the knockouts.
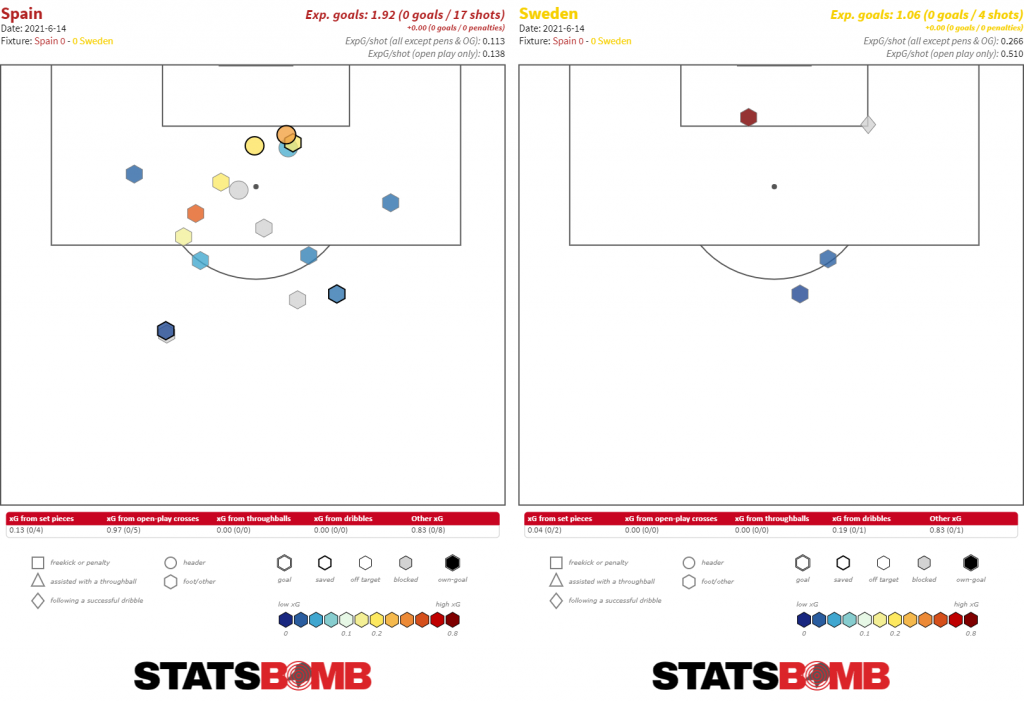
The 0-0 and 1-1 draws versus Sweden and Poland quickly reiterated the stylistic approach we’ve come to expect from La Roja; possession-based, territorially-dominant football. There were flaws in both performances, sure, but Spain did enough to suggest they’d win both games more often than not. They failed to score from chances worth 1.92 xG versus Sweden and netted a score draw against Poland despite ‘winning’ the shot count 12-5 and creating 2.25 xG to Poland’s 0.58.
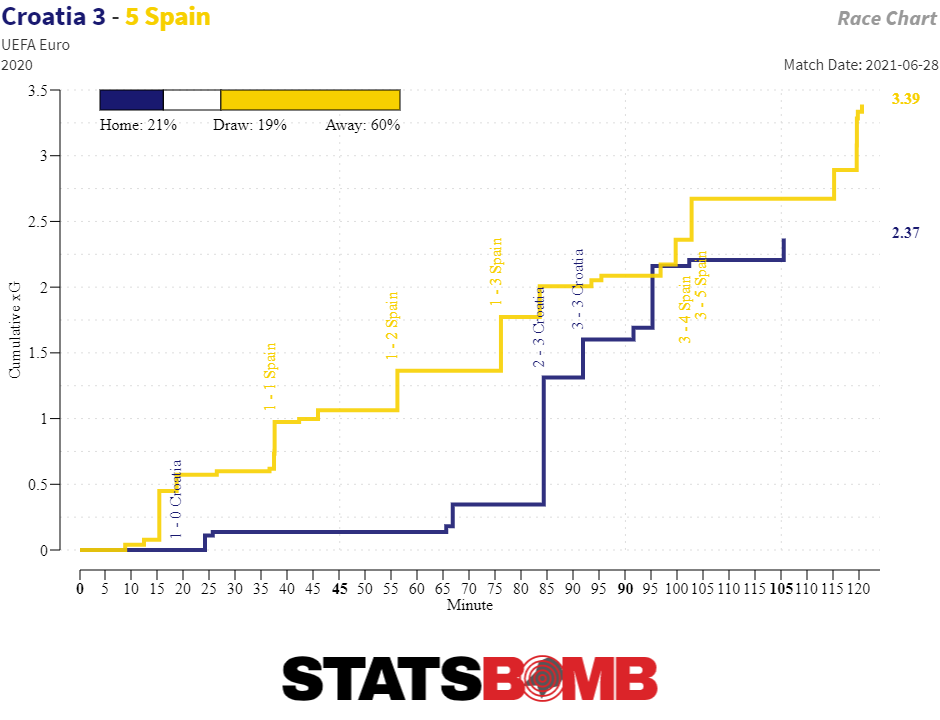
Slovakia were then on the receiving end of Spain’s frustrations in the 5-0 thrashing, before a chaotic first knockout round versus Croatia exposed defensive frailties identified by observers earlier on in the tournament. For all the control Spain had exerted over their opponents in the group stage, they struggled for it when it mattered most against Croatia. In the final ten minutes of the match, Croatia’s tenacity and determination saw them overturn the 3-1 lead Spain were holding onto, forcing two late goals to take the tie into extra time.
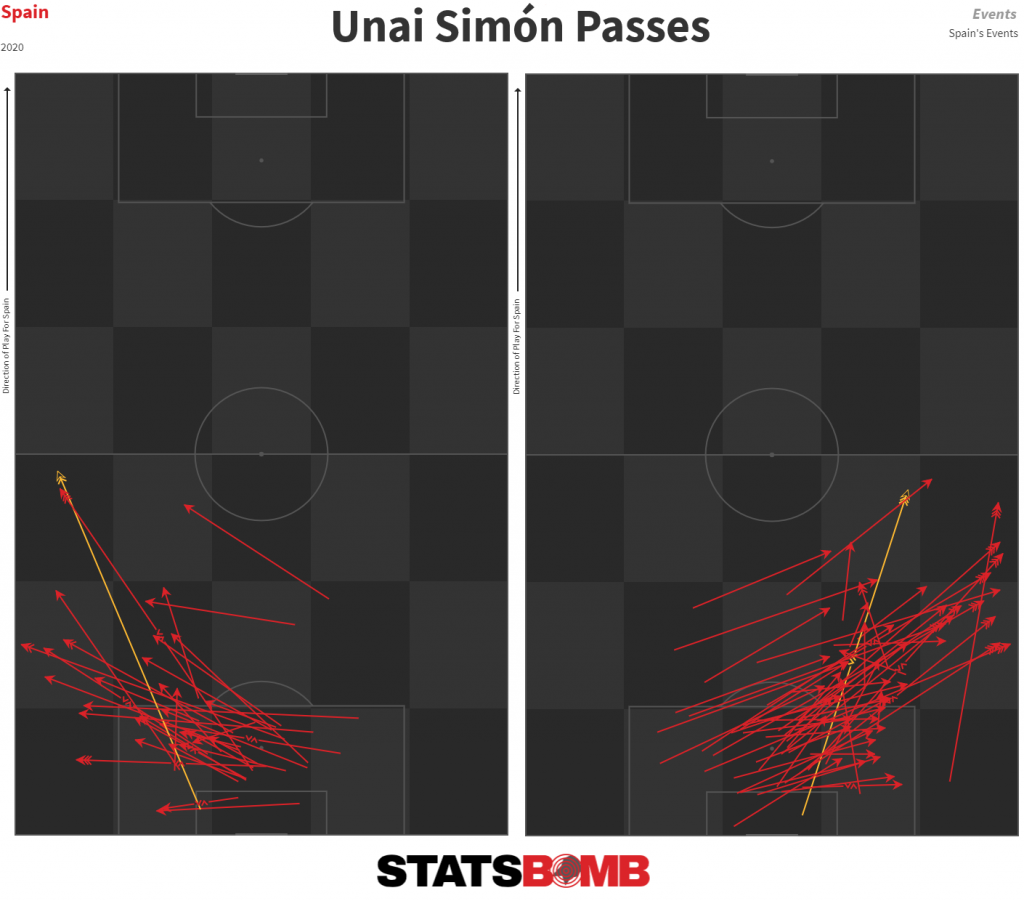
La Roja’s strengths and weaknesses were on display in their first four games of the tournament. Here’s what we might expect to see versus Switzerland. Build-Up & Attacking Phase Spain have so far had the shortest average goalkeeper pass length at the tournament at just 26.3m, with Unai Simón showing a preference for distributing the ball to the right-hand side of the defence.
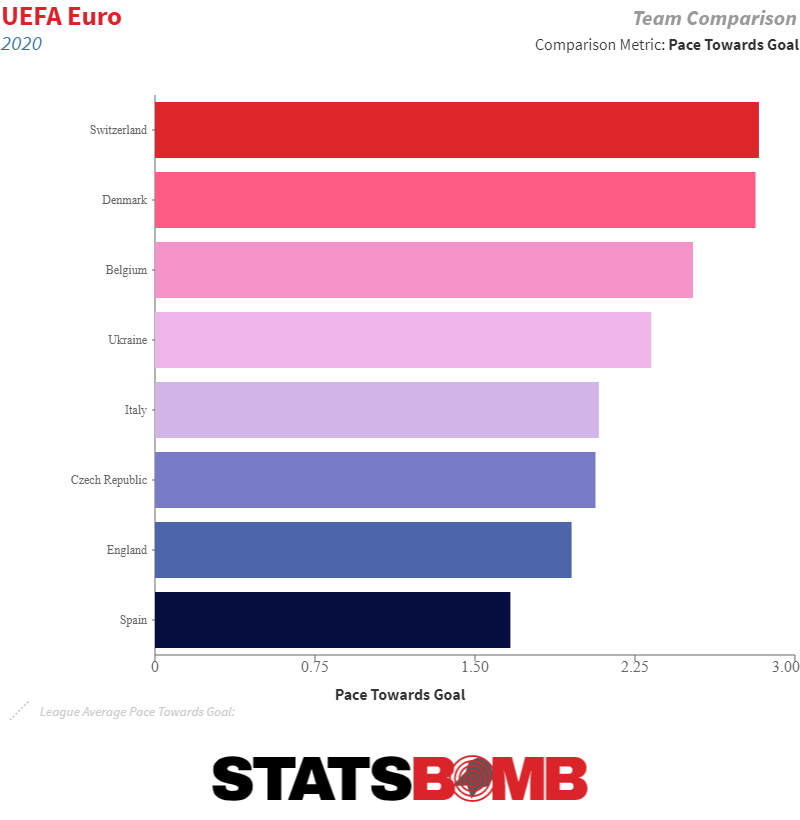
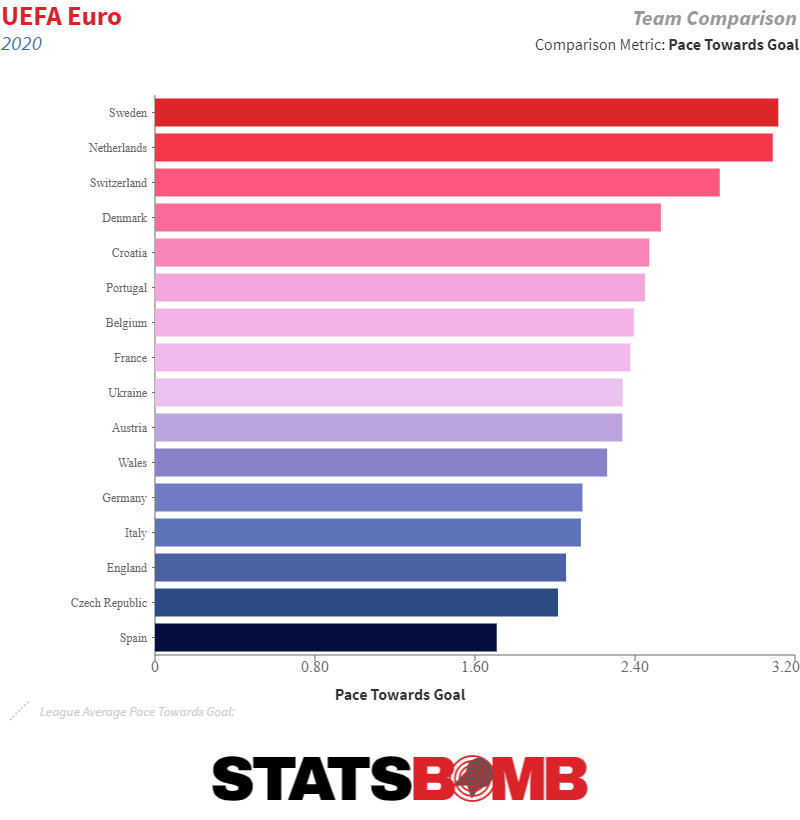
Unsurprisingly, they’ve averaged the highest possession in the tournament, with 73% of the ball in their four fixtures. Their attempts to pass their way into the goal has seen them come out with the slowest Pace To Goal – the average speed of build-up, in m/s, for possessions that end in shots – of all the teams that qualified for the knockout stage.
Their controlled build-up means they’ve entered the final third more often than any team at the tournament at 85.7 entries per 90. Seeing as they’re spending so much time there, let’s dig into what they’re doing with the ball in the attacking third.
In open play, they’ve played 670 passes originating in the final third (not including the penalty area). They played 127 (20%) back out of the final third, so 80% of the passes stayed within that area of the pitch. What’s surprising is that 105 passes (15%) attempted to enter the box. On average, Spain play six passes in the final third before they attempt a pass into the box.
Of these 105 attempts, only 41 succeeded. Of the tournament quarter-finalists, Denmark and Italy have more penalty box pass entries, and they manage it in fewer passes. Spain’s possession play results in a large amount of the territory, but it does mean they struggle to penetrate at times, with them almost always playing against a set defence.
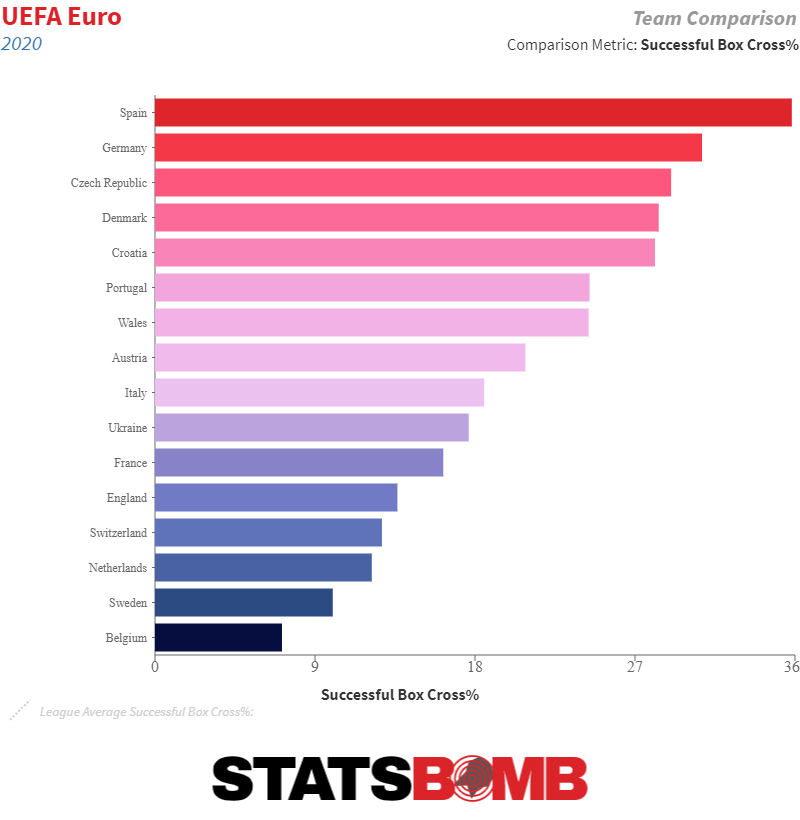
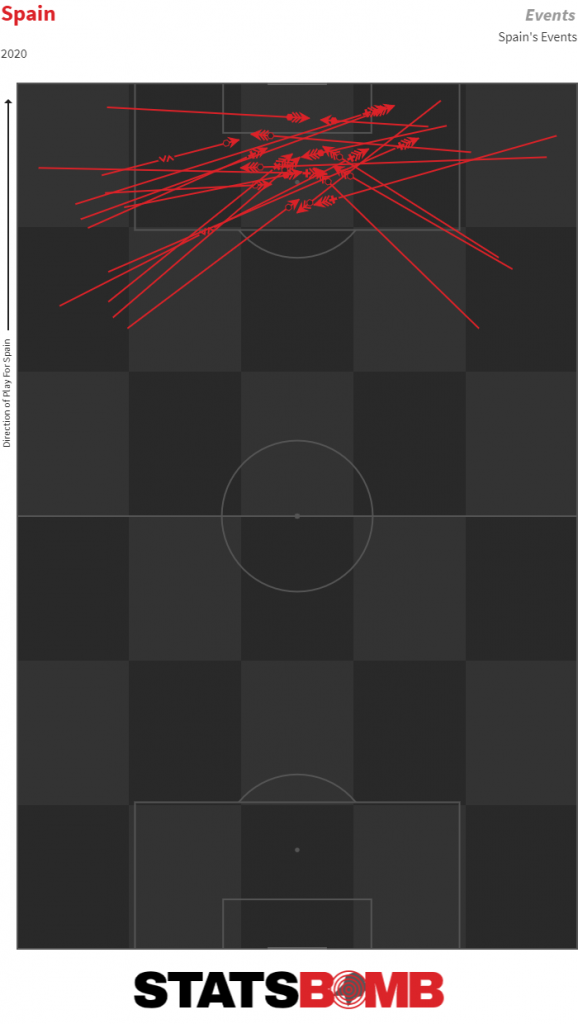
With the set defences in mind, it’s perhaps unsurprising to say that Spain’s most effective route into the box has been through crossing, but it’s certainly surprising given their overall approach. 36% of Spain’s successful penalty box entries have come from a cross, the highest percentage from teams that qualified from the group stage.
It’s important to know what Switzerland might be facing in this regard. Examining the start locations of Spain’s crosses indicates a couple of trends.
From the left, their crosses tend to originate from wider and deeper positions. From the right, they’ve been far more successful at penetrating the “cutback zone” – the byline inside the penalty area.
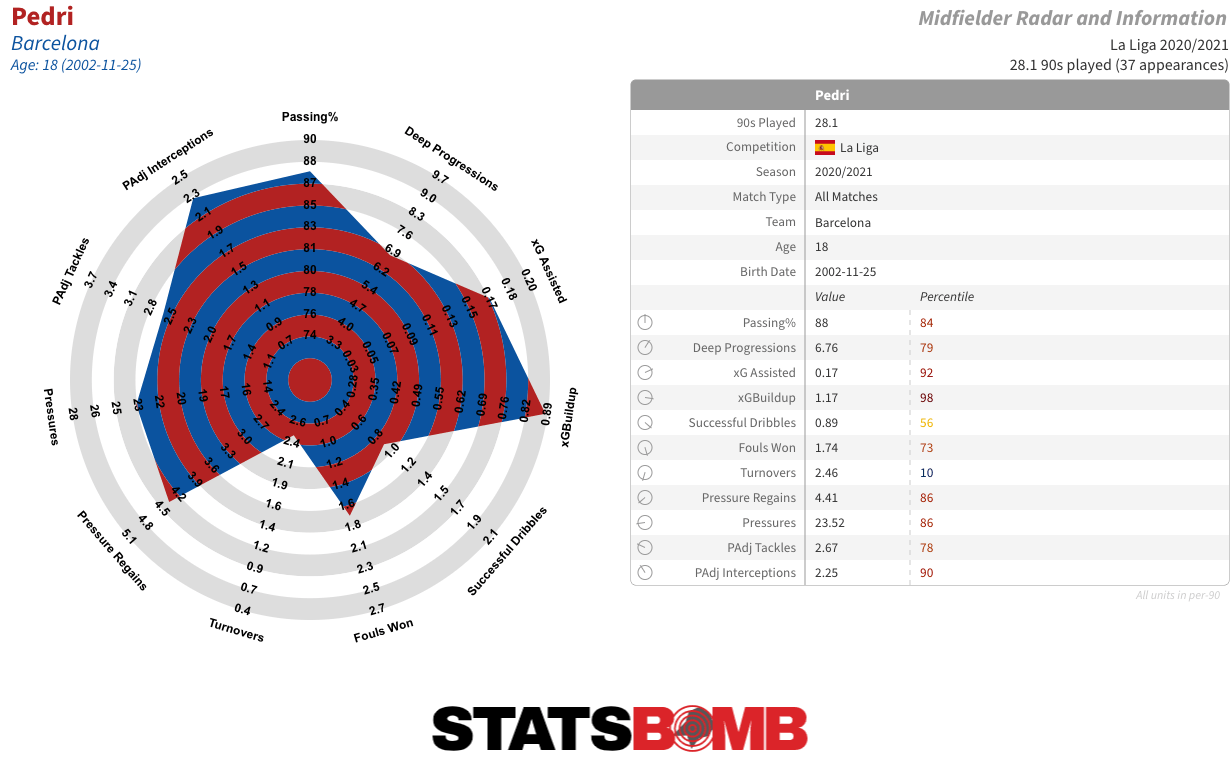
Looking at key players now, Pedri has arguably been Spain’s best player in Euro 2020, one of only three Spanish players to play every minute at the Euros so far despite this being his first tournament at the age of 18.
His positive approach to the game has seen him move the ball into the attacking third more than any of his teammates, second only to Toni Kroos across the entire tournament.
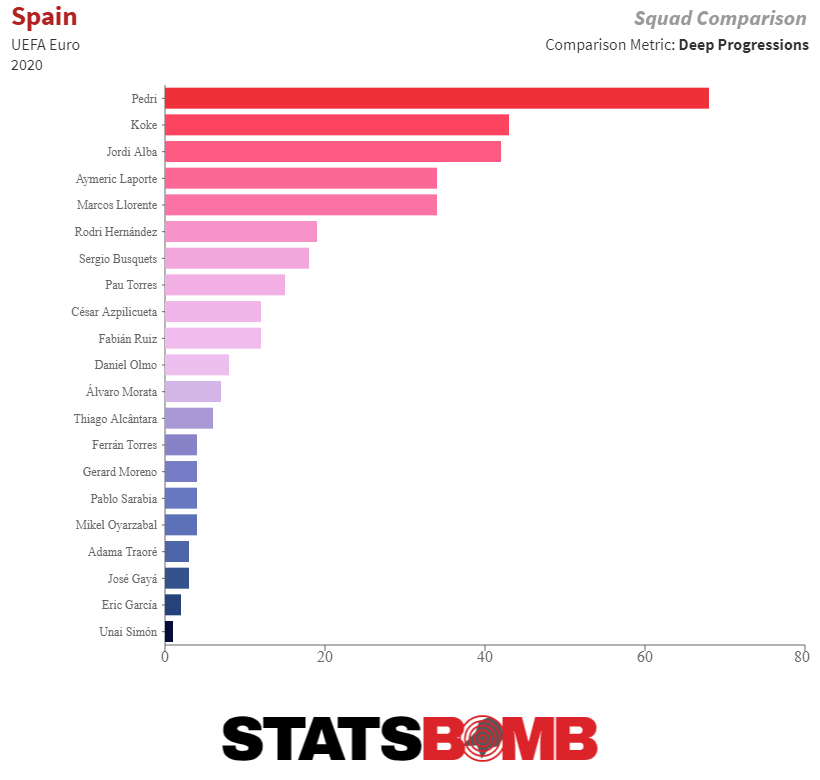
He’s also played the most passes within the final third, showing an ability to find space and show for the ball in attacking areas, whilst also looking for the forward pass when on the ball in there. 29% of his final third passes have been played forwards.
Of course, to focus on Pedri would be to ignore the many threats Spain have in possession, and it’s worth noting that it’s Jordi Alba who’s played the most passes into the penalty area of their squad. He could come back into the XI more fresh after starting on the bench versus Croatia.
Defensive Approach
Spain’s game is all about territory, which means as soon as they turn the ball over, they’re going to look to counterpress the new possession to force a turnover, prevent the counter, or keep the play away from their half.
As if opposition possession is the matador, Spain’s Aggression % (the proportion of opponent pass receipts that are pressured, tackled, or fouled within 2 seconds) is the highest of the 16 knockout teams at 25%. Their Defensive Distance – the average distance from a team’s own goal from which it makes a defensive action – of 51.6m is also the highest in the knockout stages. Expect Spain to pin Switzerland back should the Swiss not find a path out of the press. Speaking of which, one of Spain’s major weaknesses – as it is for many high-pressing teams – is what happens when the opposition breaks their press.
The best chances Spain have conceded in the tournament so far have come when their opponents have waited for their opportunity and then attacked at pace with the Spanish defence pulled out of position.
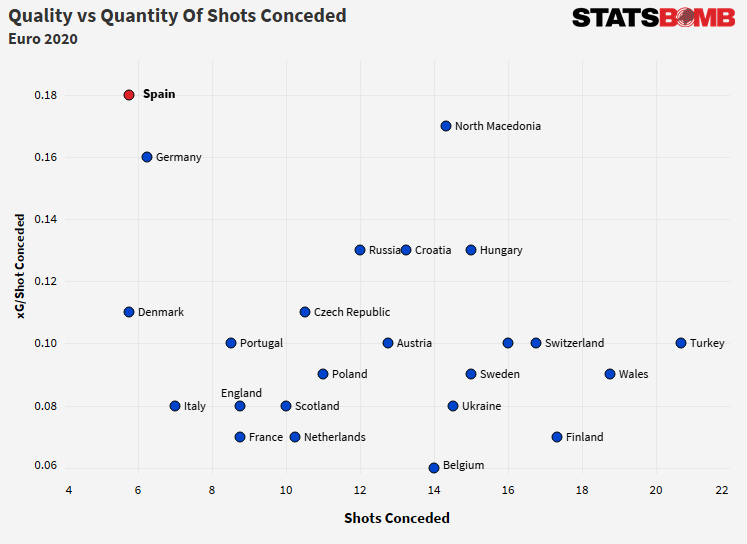
It’s definitely a positive that Spain have conceded the joint-fewest Shots in the tournament, but a tournament-high xG/per shot conceded of 0.18 demonstrates that it is possible to create clear-cut opportunities against them. The average distance from goal of the shots conceded is 14.4m - a tournament-low compared to their quarter-final rivals.
SWITZERLAND
Qualifying from their group as one of the best 3rd-place finishers meant Switzerland had to beat World Cup holders and pre-tournament favourites France on penalties in the first knockout round to reach this stage.
In truth, their group stage performances were better than the 3rd-place qualifier tag would suggest. They were comfortably beaten by a good-looking Italy, but comfortably beat an ugly Turkey and outclassed an organised Wales. The latter held them to a draw when Switzerland looked the likely winners.
 Both performances suggested there was enough about this Switzerland side to cause issues for whomever they drew in the first knockout round, which France certainly found out to their cost.
Build Up & Attacking Phase
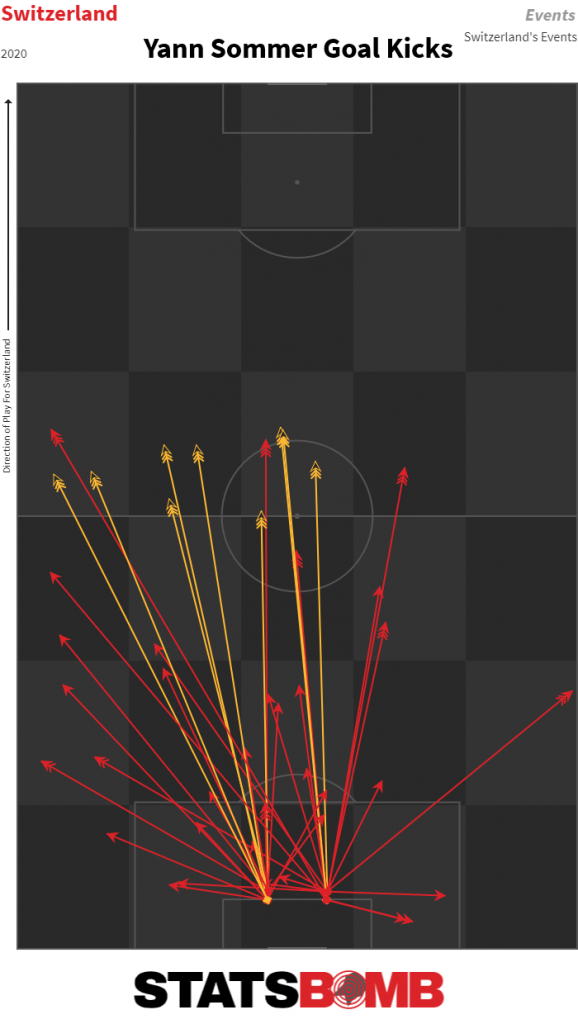
Switzerland tend to mix it up more than their opposition in this match when playing from the back. Their average goalkeeper pass length of 32m is lower than most of their quarter-final rivals, but Yann Sommer’s goal kicks map displays a flexible approach to their play out from the back. Twenty-five of his goal kicks have been Ground passes to a nearby teammate, whereas 18 have been played off the ground to achieve more distance, logged as a Low (above ankle but below shoulder height) or High Pass by StatsBomb’s pass height information.
It's likely Switzerland will play longer from the back versus Spain to play over the press and force the game up the pitch.
Switzerland look to move the ball through the thirds at a much higher tempo than their quarter-final opponents. Rossocrociati have the fastest Pace To Goal of the quarter-final teams, moving the ball towards goal at 2.8m/s on average in possessions that ended in a shot.
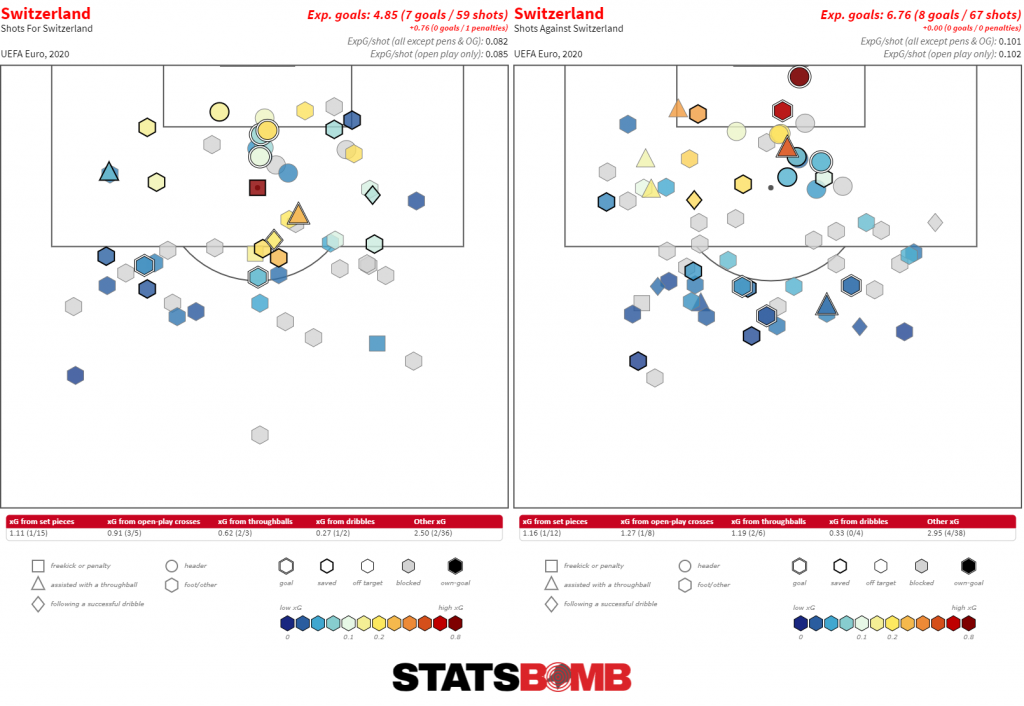
Their matches have also been high pace in a different sense. Games involving Switzerland have seen the largest shot volumes in the tournament, amassing 31.5 shots per game on average with their opponents. Switzerland are a volume team rather than one that values a high-quality chance – their average Shot Distance of 17.3m is the 2nd-furthest of the quarter-finalists, and their 0.08 xG/shot is the worst rate of that group.
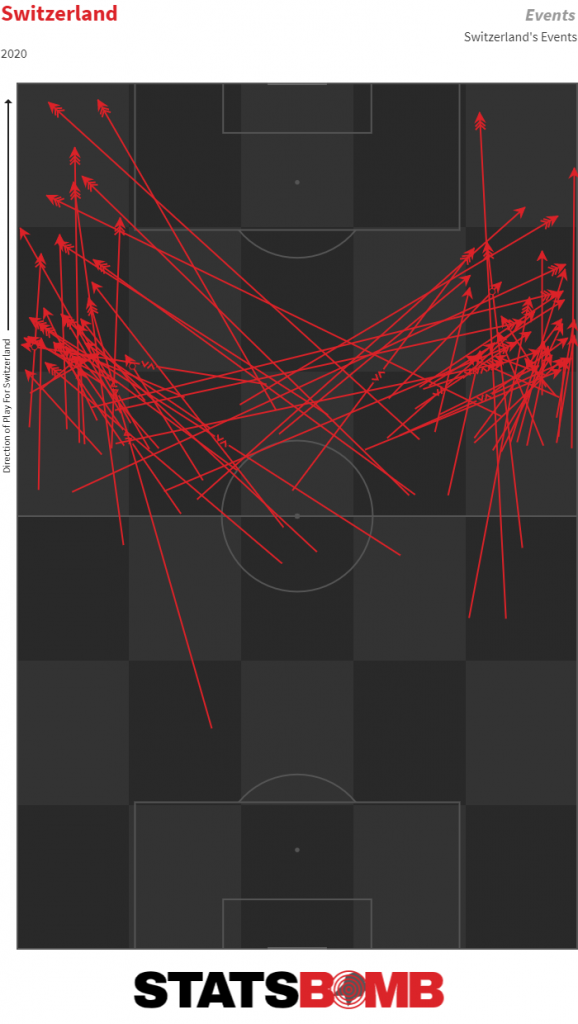
The wing-backs tend to be the best outlets for getting the ball into the final third: of Switzerland’s 116 passes into the attacking third in the tournament, 78 of them were received on the flanks.
That’s not to say their play is entirely funnelled out to the wings: Xherdan Shaqiri and Breel Embolo are both impressive technicians in central areas. But, Kevin Mbabu and particularly Steven Zuber have impressed as attacking outlets in the wing-back roles – Zuber has four assists from open play already, leading the tournament for goals created.
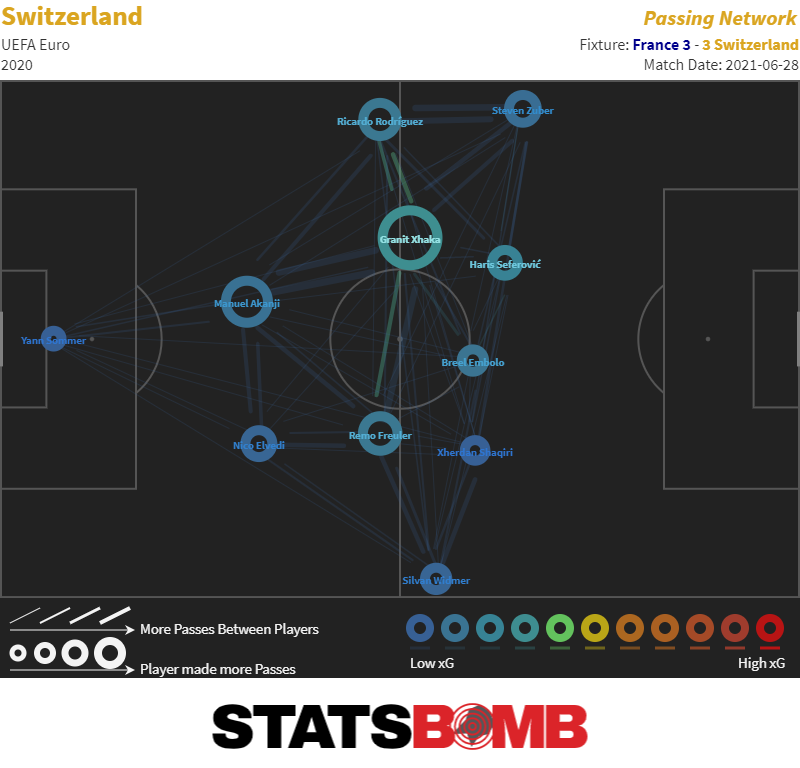
They'll have to do it without their most capable progressor of the ball. Granit Xhaka's suspension means Switzerland will be without the player who's been trusted to play the most passes in the squad, has completed the most long balls, and has played the ball into the final third more than anyone else in the Swiss team. The pass network versus France emphasises Xhaka as the most frequent and valuable passer in the team.
Defensive Approach
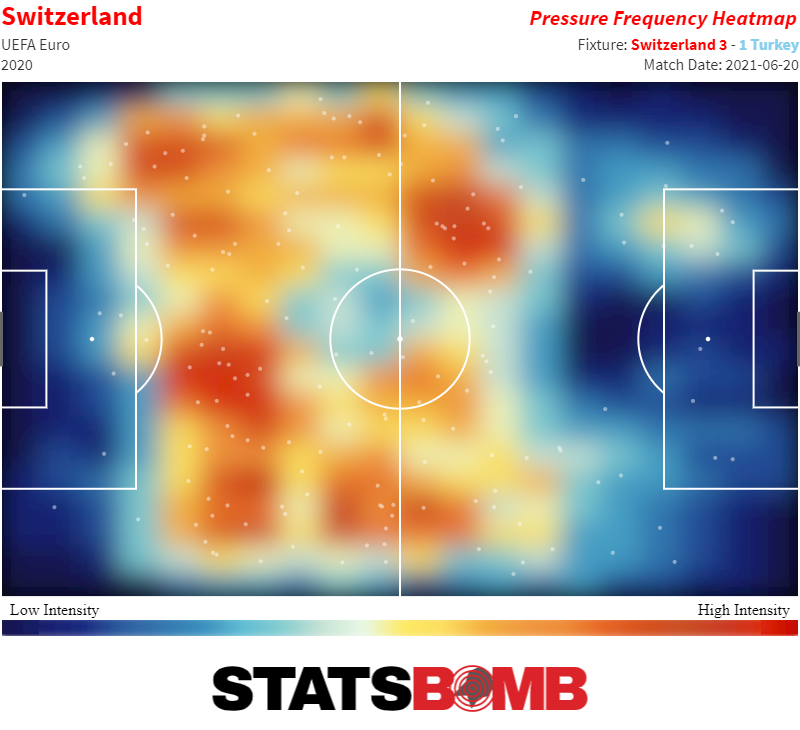
Switzerland have so far adapted their defensive approach for each opponent, though they do appear to show a preference for defending in the middle and defensive third.
They pressed from the front against Italy, but the plan backfired and that, alongside other factors, may have put Vladimir Petković off trying a similar approach versus Spain. Against Turkey and then France, they were much happier to sit off the opposition initially and then press more aggressively in the middle third.
What To Expect
We’ve identified several trends we expect to persist on Saturday’s quarter-final, as well as potential weaknesses on both sides. Will Spain keep Switzerland penned into their half? Will Switzerland be able to transition effectively and create dangerous chances as other teams have? Will Spain have to resort to crosses to gain entry to the box again?
That’s just an overview of the various insights that can be drawn out of StatsBomb IQ. Teams and federations continue to source match-winning insight out of our analytics platform and data to give them an edge on matchday. For a full demo of the platform, contact us today.
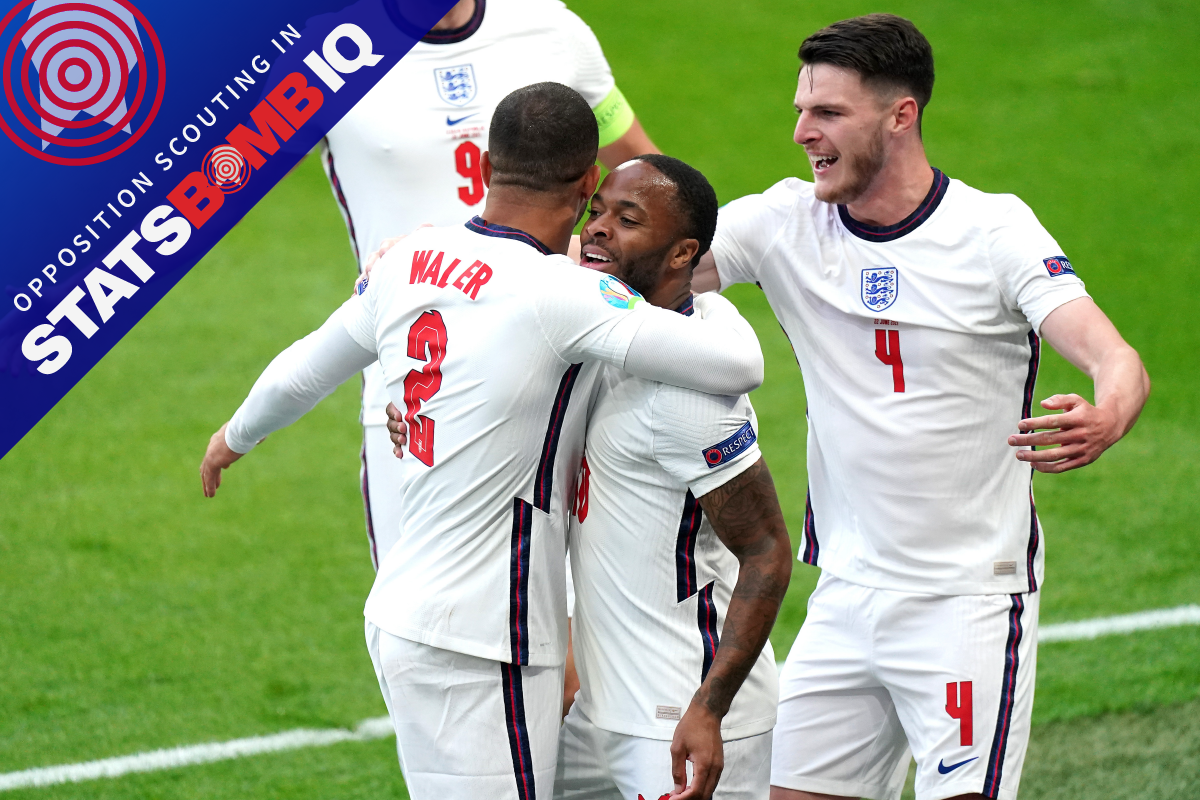
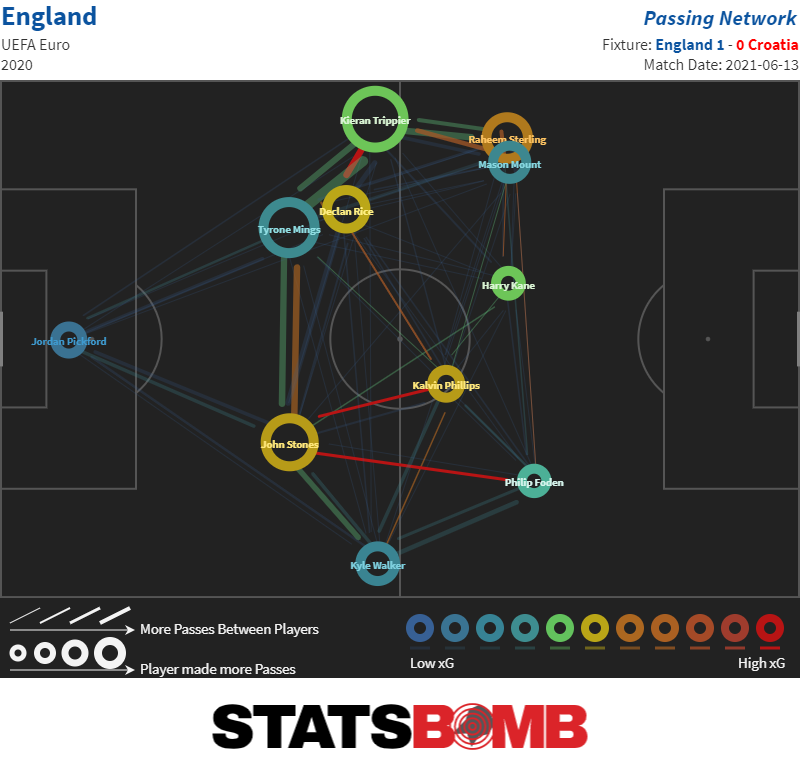
Data has become an integral part of team and opposition analysis in the modern game: a repeatable and automated part of the process that can quickly identify longer-term trends and save valuable time for the busy analyst. Teams and federations use StatsBomb IQ to support their team and opposition analysis, exploiting edges found in the platform to secure victory over their opponents every matchday. Looking ahead to England vs Germany in the Euro 2020 round of 16, let’s demonstrate how this can be done.
GERMANY
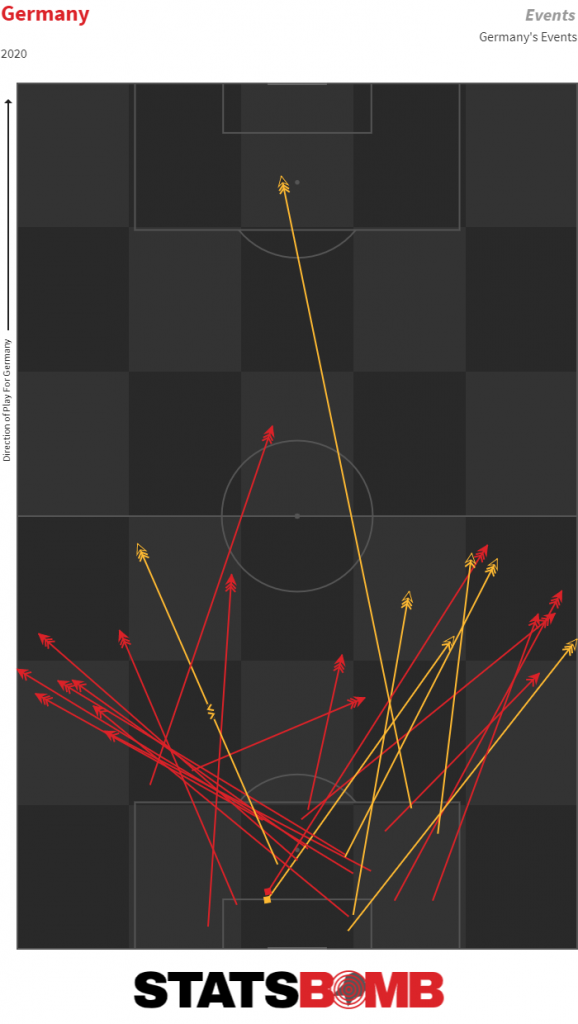
Germany come into this game having survived the Group of Death, qualifying after a late Leon Goretzka equaliser in the deciding group game versus Hungary saved them from an early exit. As a collective, there have been question marks over Germany's performances in the group stage, but matches against strong nations in France and Portugal should provide us some clues as to how they might setup against England. The first thing to note is that Germany conceded the first goal in all three of their group stage games - in fact, each of those goals was scored within the opening 20 minutes of the game. As a result, their data is skewed slightly favourably with Die Mannschaft playing a more attacking mentality to chase the games than they're likely to operate with from the start against England.
Sure enough, Germany controlled the shot counts in all three games (10-4, 13-7, and 18-9 respectively) as well as the territory, completing 272 final third entries to their opponents 80.
BUILD UP
Germany look to play short from the goalkeeper, with an average goalkeeper pass length of 29.9m the 4th-shortest of the teams qualified from the group stage.
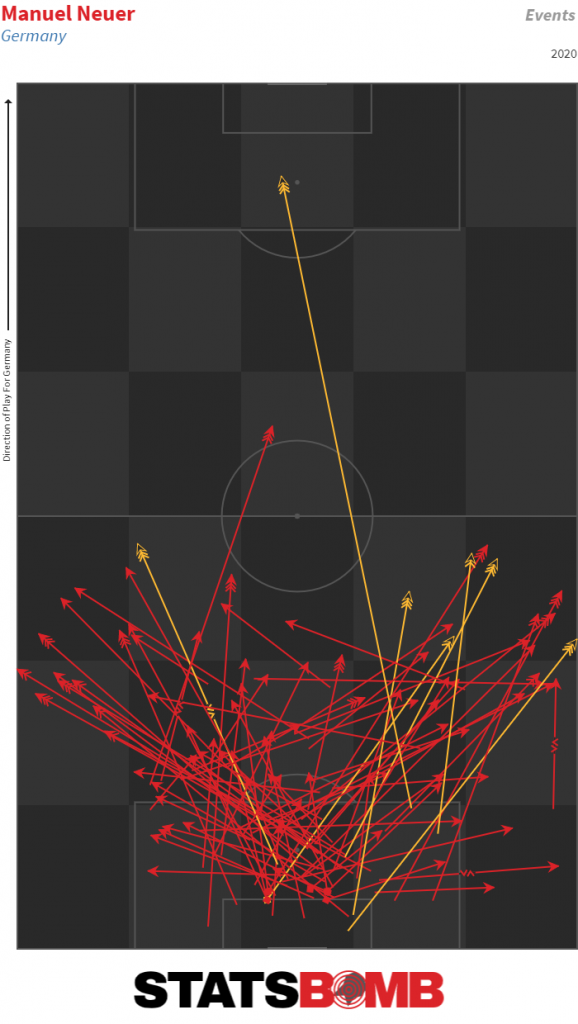
Neuer has distributed evenly between the two sides of defence, playing 19 defensive third passes to Antonio Rudiger and 17 to Matthias Ginter, with the two wide centre backs charged with carrying the ball up the pitch before distributing to Mats Hummels at the centre of the back three, or Toni Kroos. Should the centre backs be unavailable for a short, ground pass, Neuer has found joy playing Low (not to be confused with Löw) or High passes to Robin Gosens on the left flank, but Neuer has so far struggled making these same passes to the right flank.
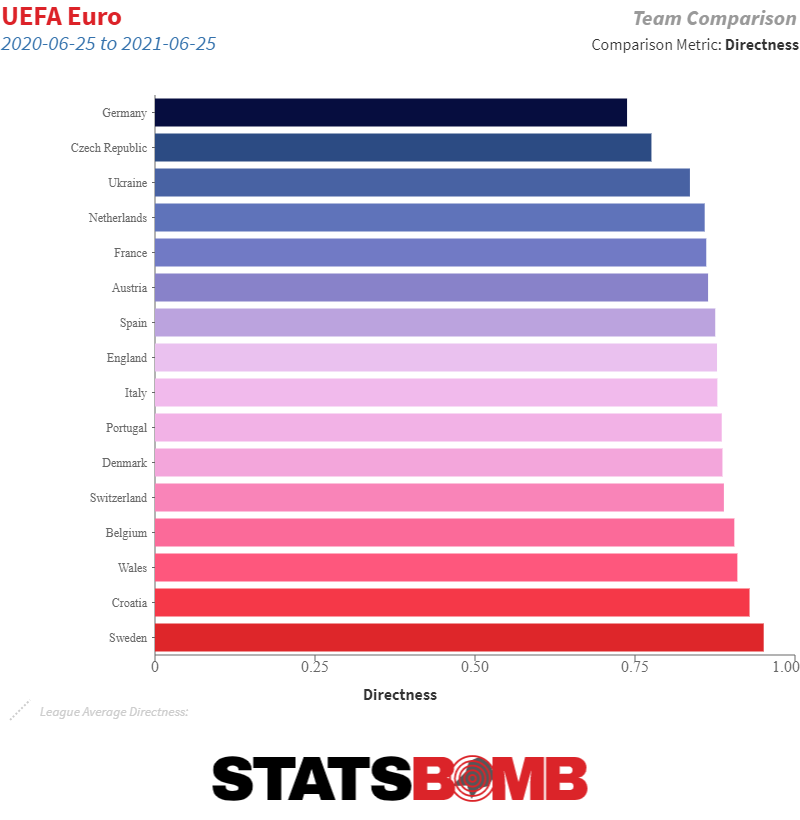
Though influenced by the game state, particularly against Hungary where they were attacking a low block for long periods of the second half, their proclivity for moving the ball side-to-side in the build up shows up in their Directness rating – the total distance from goal at the start of a shot-ending possession, divided by the total distance travelled during the move. Their Directness ratio of 0.74 is a tournament-low for teams remaining in the knockout stages. We can expect Germany to control possession and look to create chances through longer periods of build-up play.
Their 3-4-2-1 shape lends itself to attacking with width. Gosens and Joshua Kimmich from the wingback positions have so far been two of their more impressive performers at the tournament. Germany’s Successful Box Cross % - the percentage of successful passes into the box that are crosses – of 32% is the highest in the tournament, influenced by facing deeper blocks but also by the presence of quality wide players in Gosens and Kimmich, plus the likes of Gnabry and Sane pulling into the wider positions. Undoubtedly the key player in build up for Germany is midfielder Toni Kroos.
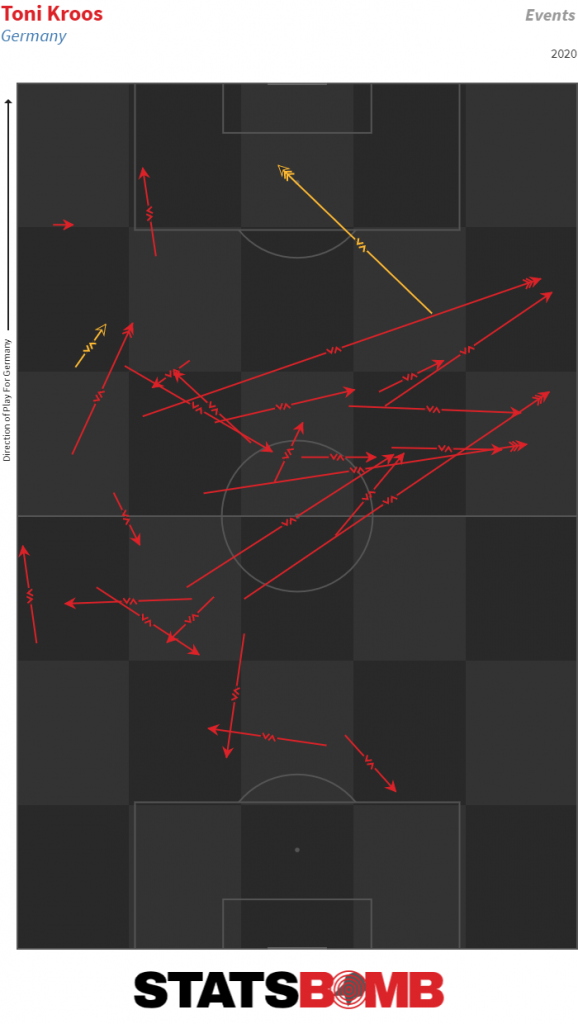
The Real Madrid midfielder had the most touches in the team versus France and Portugal, and the third-most against Hungary. Kroos is central to Germany’s build up play, getting on the ball early in the build-up phase and looking to move the ball into the front three or out wide to the wingbacks who’ve advanced ahead of the ball in the wide areas.
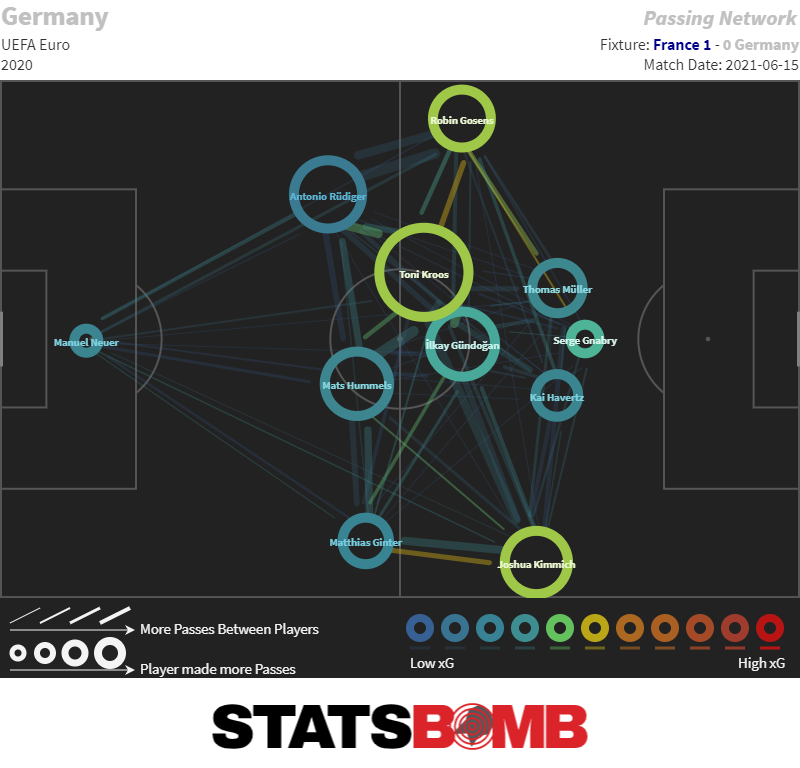
Kroos has not only completed the most passes in the German team, he’s also completed 57 long balls at the tournament (Neuer second with 27) and completed them at an 89% clip – his unerring accuracy a constant issue for the opposition block being shifted around by the range of Kroos' passing. The issue for England is that Kroos is also completely comfortable playing under pressure too. Just 9% of Kroos’ passes have been played under pressure so far, but he’s completed 93% of them. Not only is he able to retain the ball under pressure, he also rarely goes backwards, drawing the press and then bypassing it to keep Germany moving towards goal.
In the final third, it’s Gosens (5) and Kimmich (4) who’ve laid on the most shots from open play for Germany so far, again highlighting the need for England to defend the wide areas well if they are to succeed.
DEFENDING & OUT OF POSSESSION
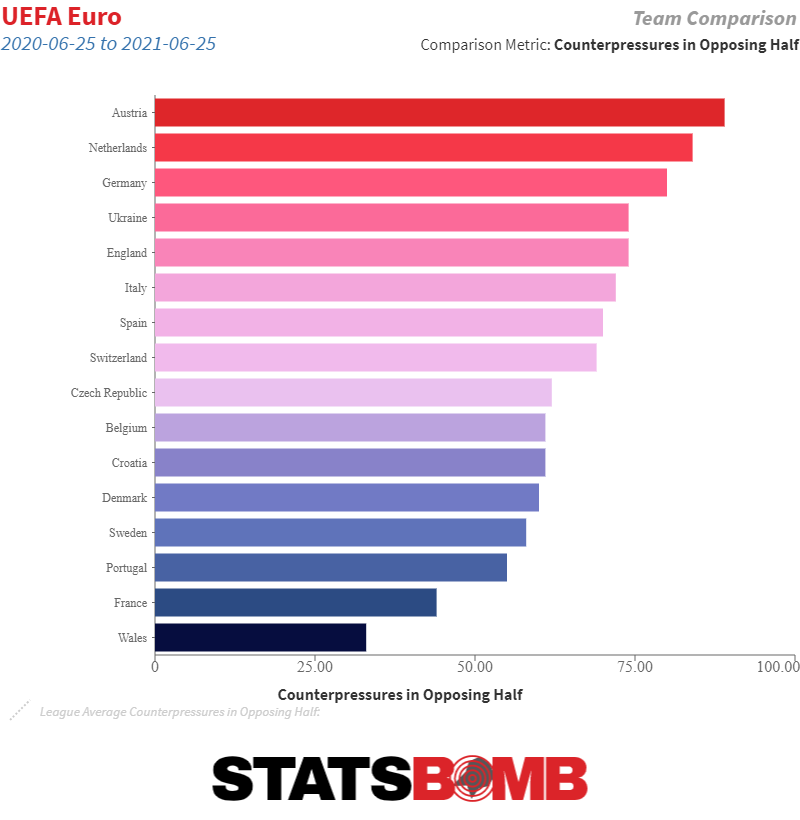
Germany have so far defended in a higher block. Their PPDA of 7.30 is the 2nd-lowest of the knockout teams, and their Defensive Distance (average distance from a teams own goal from which it makes defensive actions) of 48.12m is 4th highest of the same group. Their Aggression % (the proportion of opponent pass receipts that are pressured, tackled, or fouled within 2 seconds) of 23% is above the tournament average, and they made the 3rd-most Counterpressures in the opposing half in the group stage, suggesting that England may well have to play out of the press in the early stages of build-up on Tuesday night.
SET PLAYS
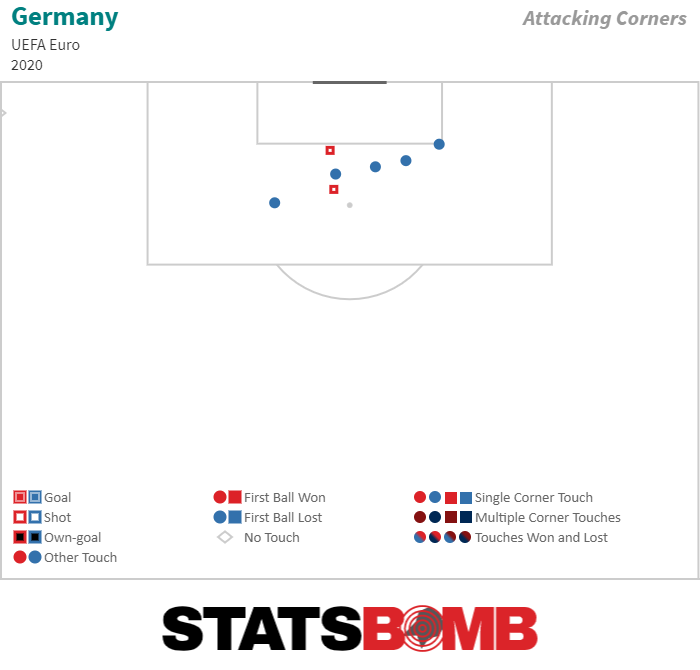
Germany have been effective from set plays in the tournament so far, creating 11 set plays shots (joint-2nd most). They’ve tended to go short when playing corners from the left, but from the right is where they’ve had the most danger, creating two shots (red squares) at the far post when the delivery has beaten the near post markers.
ENGLAND
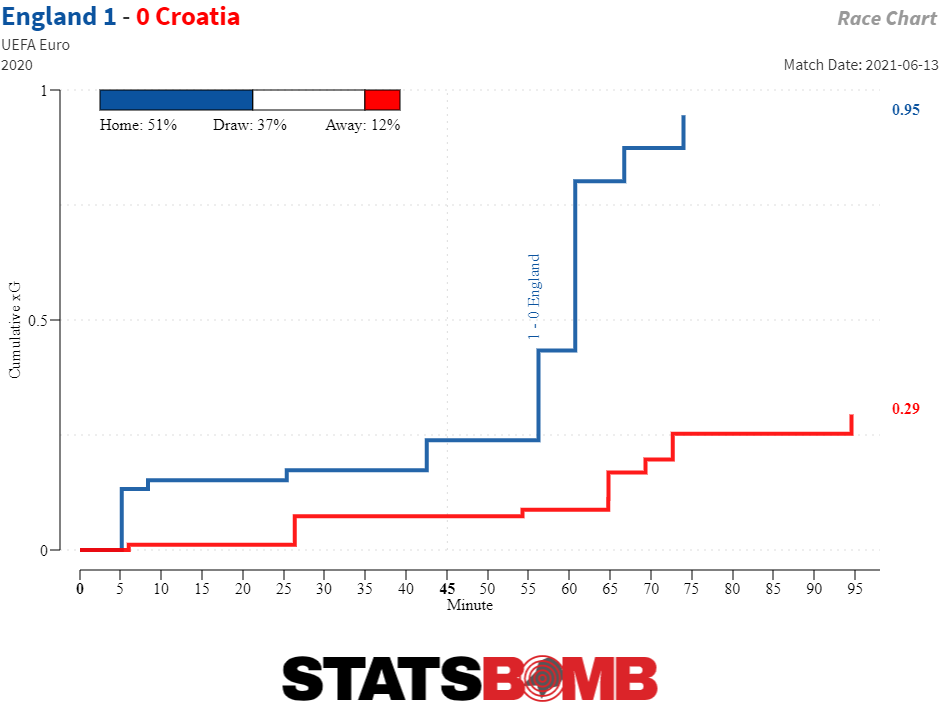
England made it out of Group D with some grinding performances, with their three matches containing a grand total of two goals for either team. Their strategy has been clear and so far effective: give absolutely nothing away and let that be the platform to carry them deeper into the tournament. The Three Lions’ enclosure has been placed firmly around their goal. The handbrake has been well and truly on, but it has returned three clean sheets in three games – so far, so good. It’s notable that in the two games they took the lead, versus Croatia and Czech Republic, England moreorless stopped attacking once they were ahead. Versus Croatia, they took the lead in the 57th minute, creating just three shots afterwards and the last of which in the 74th minute.
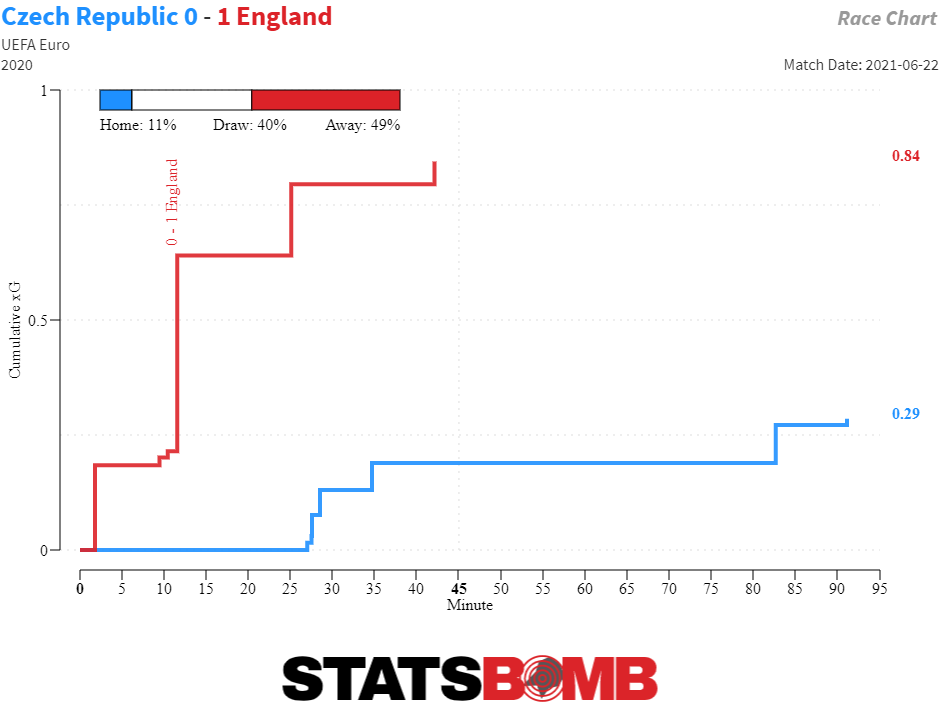
And it was even more extreme vs Czech Republic, taking the lead in the 12th minute and holding it for the remainder of the game – creating just two more shots in the 78 minutes afterwards and not a single one in the second half.
DEFENDING & OUT OF POSSESSION
Given their approach, it makes sense to examine their defensive approach first. Their defensive success is two-fold. The first is limiting the quality of shots against them. England conceded 26 shots in the group stage – a number bettered by six teams. But their xG per shot conceded of 6% was the lowest in the group stage, preventing the opposition from getting a clear sight of goal and resulting in just three shots on target total in the group stage fixtures.
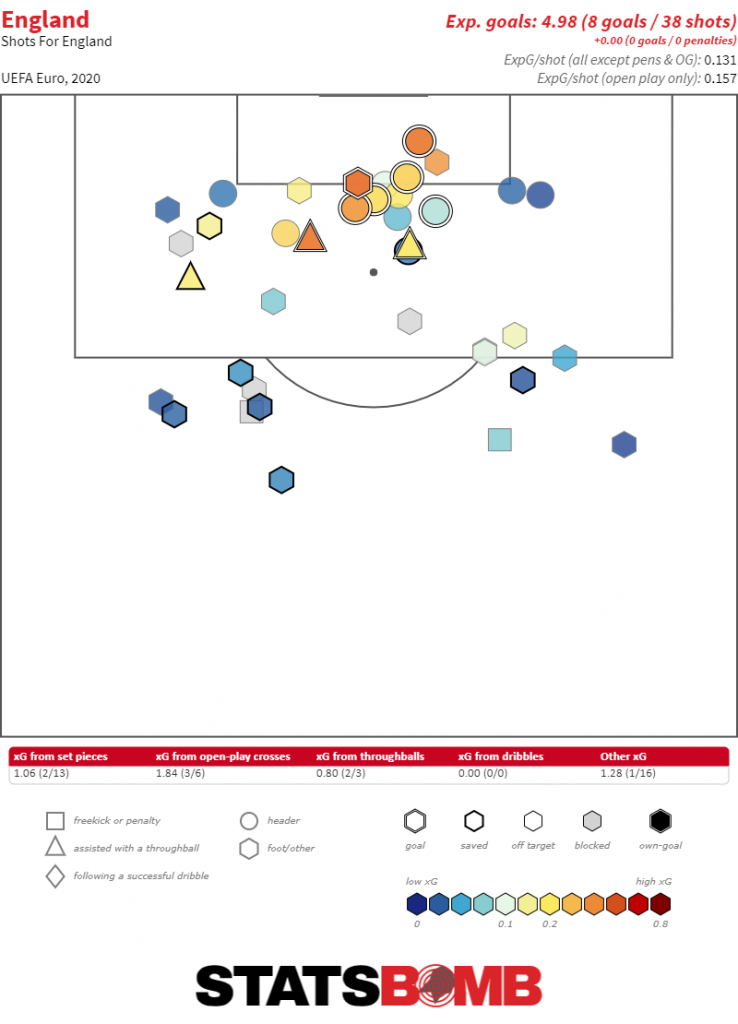
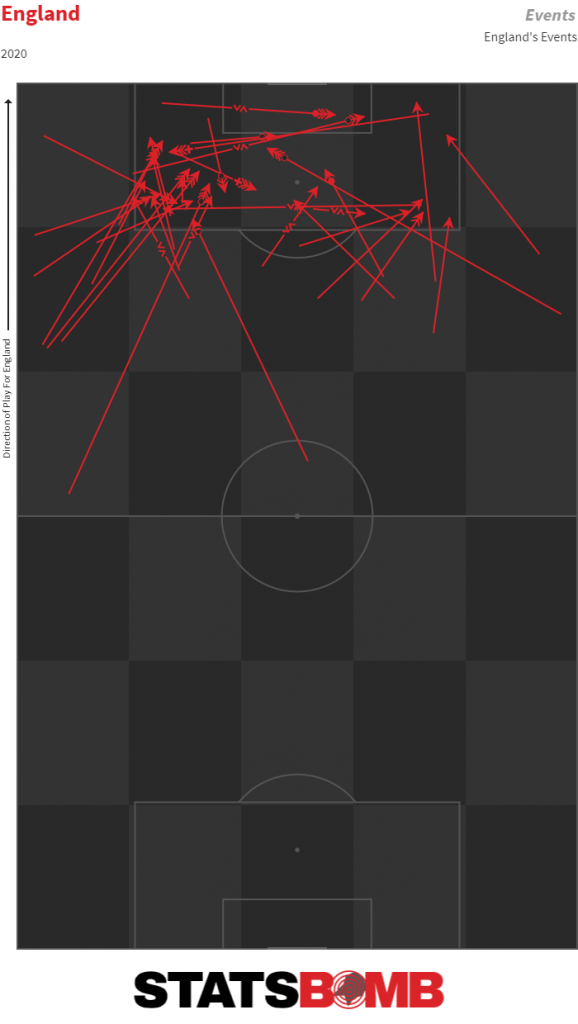
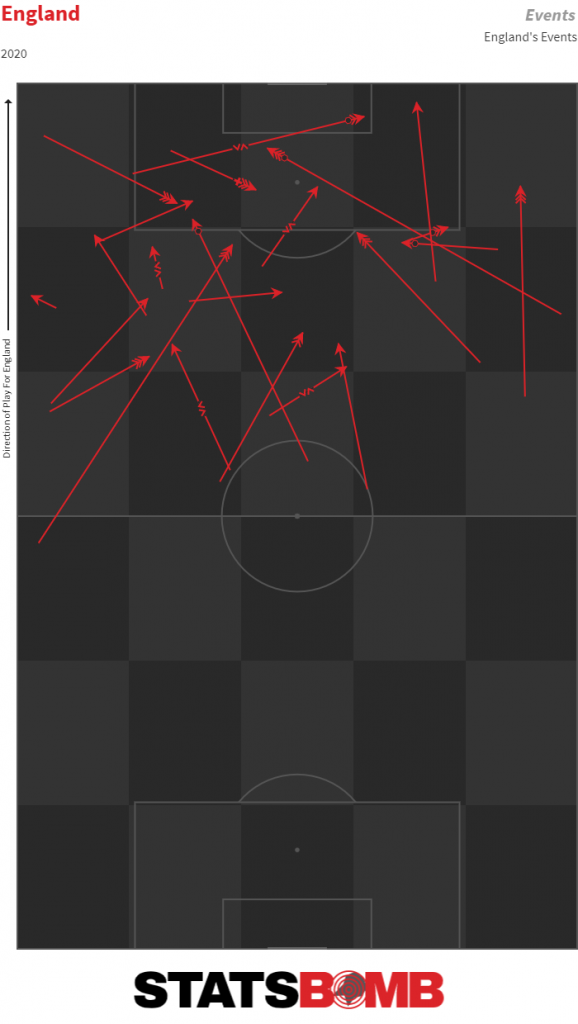
A big factor in this has been the positioning of the defensive unit. England had a defensive body in the way of every one of the 26 shots conceded in the group stage matches – not conceding a single chance where the shooter had a clear sight of just the goalkeeper between ball and goal.
![]()
The amount of bodies defending the goal has also paid off in the territory they’ve conceded. England’s group stage opponents reached the final third on 96 occasions, but found it extremely difficult to penetrate the penalty area – England didn’t allow a single pass to be completed inside their penalty area during the group stage. This signals two things: one that England defended the space around their goal well, intercepting the passes that were played at close range, but also that forcing the opposition to deliver the ball from a further distance allows for more reaction time by defenders and goalkeeper. Germany will be facing an organised defensive unit on Tuesday evening.
BUILD UP
That risk aversion – defending leads and refusing to over-commit – has also led to England leaving little footprint as to their build up and attacking play. Their 23 shots was the lowest total of the 16 qualified teams in the group stages. Three High Press Shots created shows that England are ready and capable of pressing high when the situation allows, but no shots created on the counter-attack is another reflection of England’s reluctance to leave their shape and commit bodies forward. Instead, their chance creation has come from open play and from set plays. A look at England’s most dangerous sequences created so far – based on the expected goal value of the chance at the end of it – shows up some clear trends.
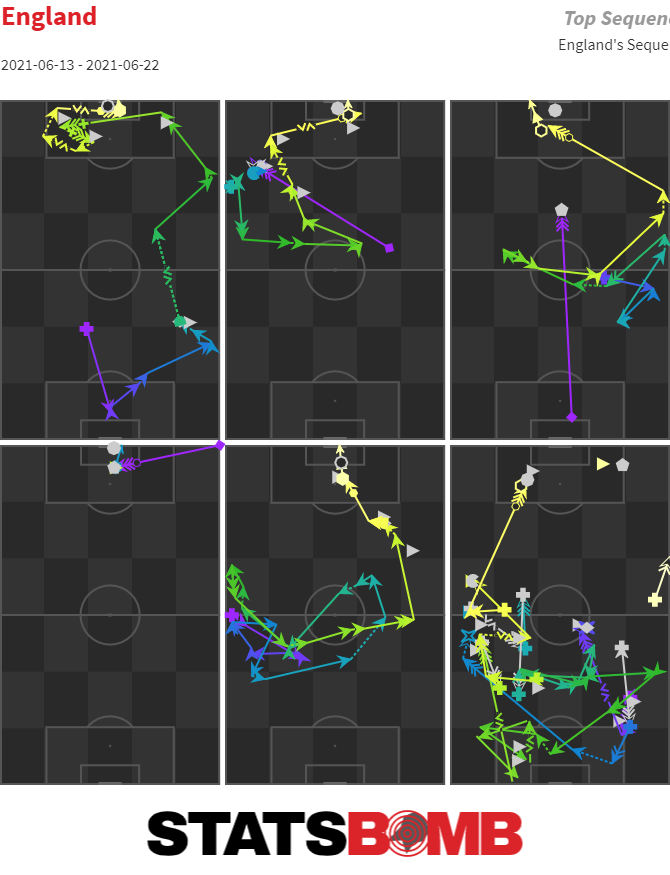
The first is that they’ve tended to come from longer periods of build up. Excluding the corner in slide 4 – John Stones’ post-hitting header versus Scotland – all of England’s biggest chances have been created by phases of play that’ve lasted longer than 30 seconds, with three of them lasting over 60 seconds in duration.
Much has been written about the pace of England’s build-up play, though the chances created versus Croatia (Sterling’s goal) and Czech Republic (Sterling’s shot against the post) hint at a capability to play quickly and incisively at the end of a sequence. Contrary to their opponents in this game, England have not opted to attempt many crosses so far, preferring to work the ball around the final third instead. England have attempted 12 crosses into the box (16th of 16 group stage qualifiers) compared to Germany’s 40 (1st). Despite this, England’s most common entry into the box has been down the left flank, with Raheem Sterling’s runs behind the defensive line proving a regular outlet for England’s attacking play.
Another key topic has been the use of Harry Kane and his struggles in the tournament. Six shots and 0.92 xG has returned zero goals so far, and his isolation in the build up is evidenced in the data.
Kane achieved just 27 Touches in the box in the group stage, a total that was 21st highest at that stage of the tournament. For context, Scotland’s Lyndon Dykes managed 35 in the same time span. Outside the box England have struggled to get the Premier League’s top goalscorer involved too, receiving just 23 passes in the final third in three games, few of them in areas you feel he could do the most damage.
Given the trends we’ve just identified, it promises to be a curious match up between the two sides. Will Germany’s proclivity for creating chances from wide persist against an England side well set up to defend their penalty box? Will England’s risk-averse approach in possession be able to withstand a Germany press, or will they be forced to look to create chances in transition to avoid being pinned into their own half under German pressure? Or is the match destined to go all the way to penalties as it did 25 years ago in Euro 96?
That’s just an overview of the various insights that can be drawn out of StatsBomb IQ. Teams and federations continue to draw match-winning insight out of our data and analytics platform to give them an edge on matchday. For a full demo of the platform and how it can help you, contact us today.
Right now, dozens of clubs around the world will be using StatsBomb IQ to aid their player recruitment planning and shortlisting ahead of the summer transfer window. IQ is designed by analysts, for analysts, with the goal of making data-driven insights easily accessible and digestible. Most importantly, it saves valuable time and resources for the time-poor analyst and is flexible and customisable to each user's specific needs.
StatsBomb Director of Football James Yorke provided the commentary for this walkthrough video of how IQ can be used for data scouting and shortlist creation. If you'd like to consume the walkthrough in written form and see further example profiles of players, read on.
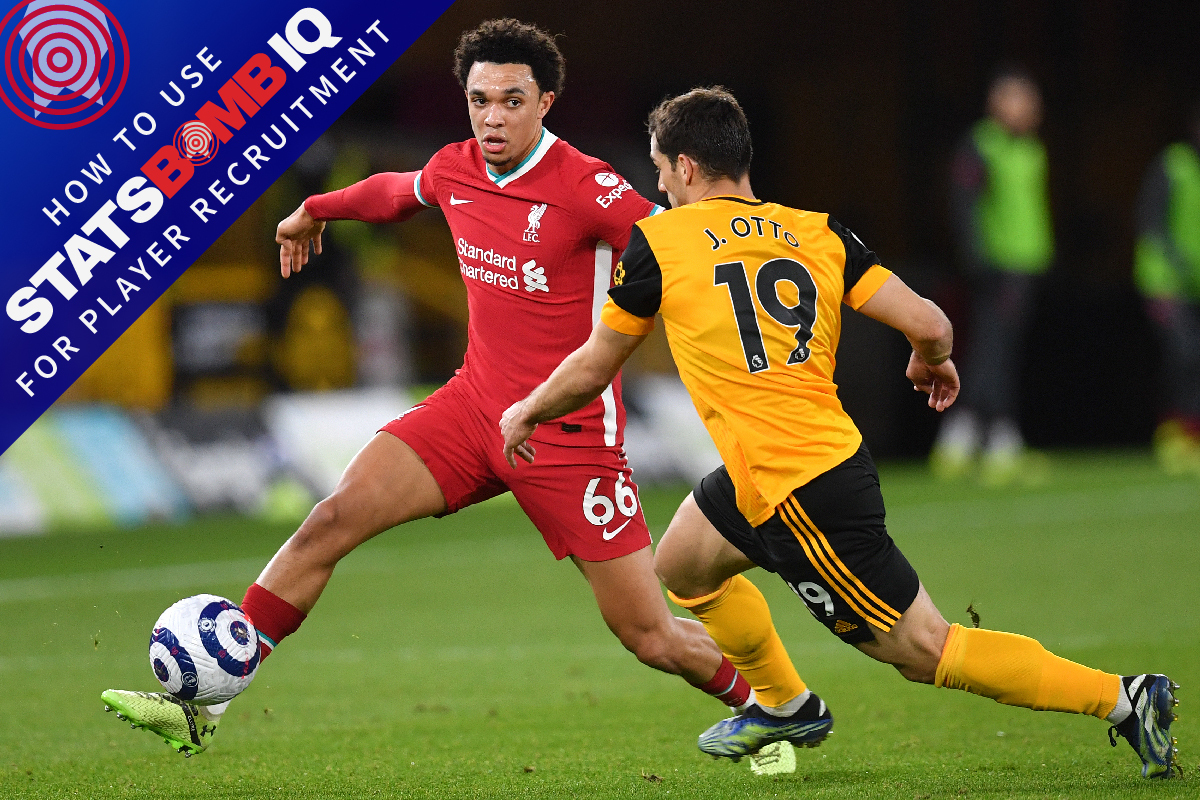
Data can be used at all stages of the recruitment process, from the initial shortlisting all the way down to the final granular player assessments. Last week, we looked at how data can be used to create shortlists of forwards and centre backs that might be good stylistic fits for clubs looking for a particular profile of player. In this article, it's the turn of one of the more role-diverse positions on the pitch: full backs. Let's focus on a player who's become synonymous with the position in recent seasons, Trent Alexander-Arnold.
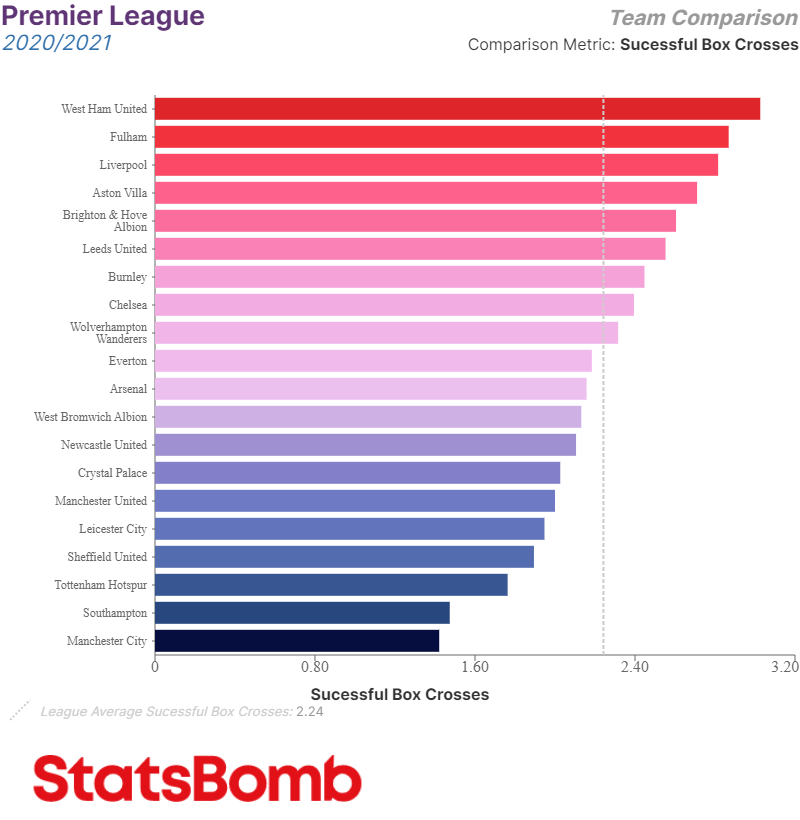
Alexander-Arnold's performances at full back for Liverpool have seen him become a key player in their recent domestic and European successes. We're all familiar with the ultra-attacking approach he takes to the position - asked to supply all the width on Liverpool's right flank and be a creative outlet both in build-up and in chance creation. Combined with Andy Robertson, Liverpool were one of the most frequent and dangerous crossing teams in the Premier League last season.
Having a player that can perform an attacking role to such a high standard is something clubs around the world will prioritise in today's modern game. So let's show you how StatsBomb IQ can be used to support this process in identifying and shortlisting players of this profile.
1) Create And Edit A Radar Template
The first thing to do when using IQ to identify players is to select the metrics that best reflect the role you're recruiting for. In this case, we're going to adjust the current full back radar to add key metrics that are closely associated with Alexander-Arnold's style of play.
We're looking to highlight the most synonymous parts of Alexander-Arnold's game - chance creation, competence in possession, width in attack, and ability to defend in a high line, so it makes sense to add:
- Average Defensive Action Distance: The average distance from the goal line that the player successfully makes a defensive action
- Carry Length: Average Carry Length
- Being Pressured Change in Pass%: How does passing % change when under pressure? This is calculated as Pressured Pass % minus Pass %
- Successful Crosses: Completed Crosses
- Open Play xG Assisted: xG Assisted from open play
- Open Play Key Passes: Passes that create shots for teammates, from open play only
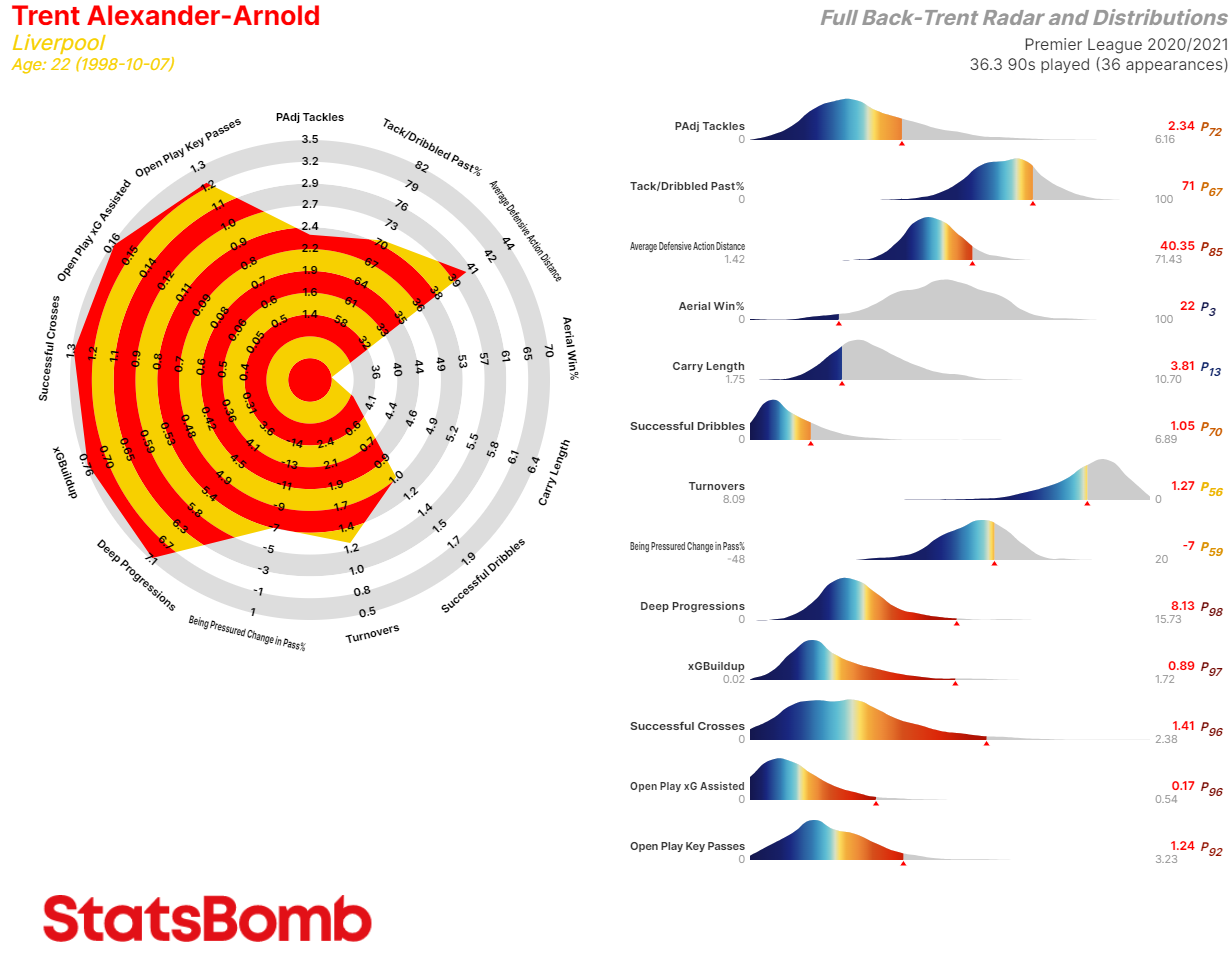
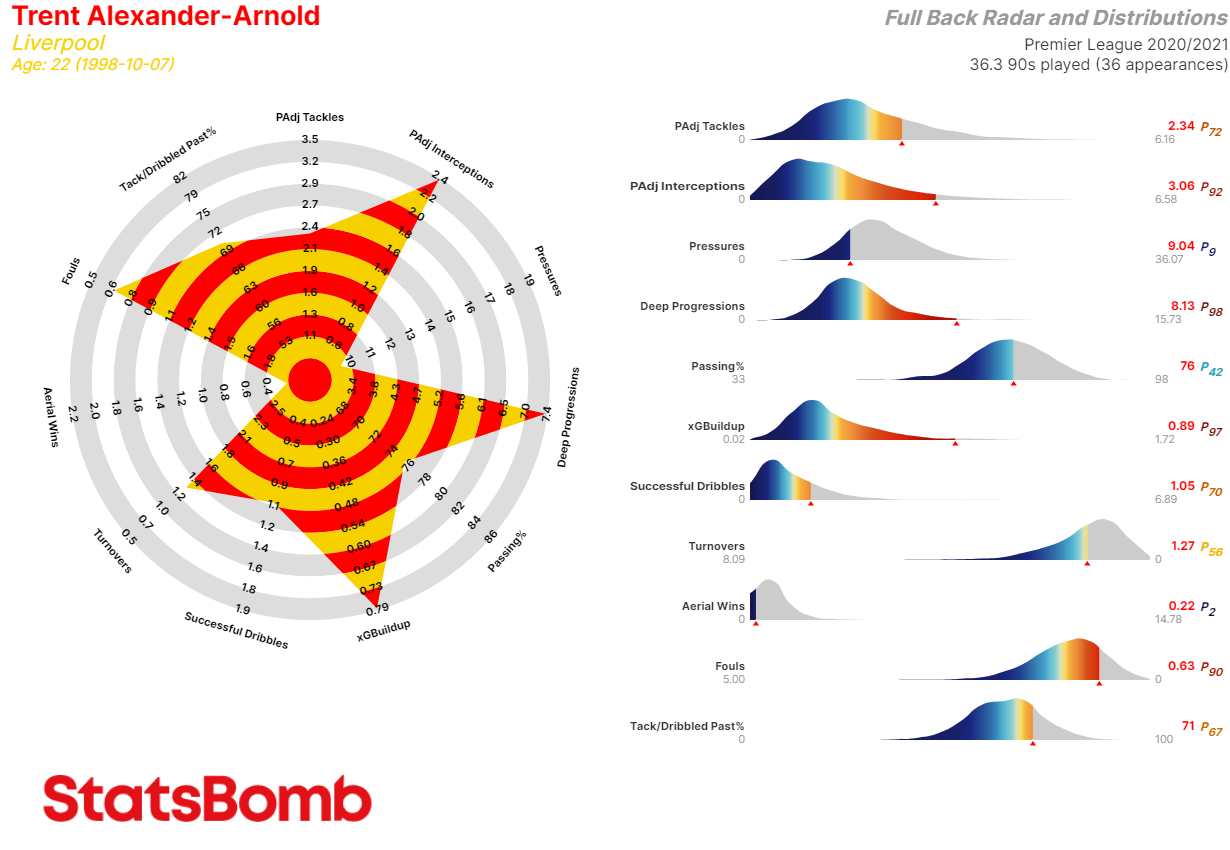
We can see a radar that more closely resembles what we'd associate with Alexander-Arnold's style of play. He's performed to a very high standard in the chance creation metrics we selected (96th percentile for Open Play xG Assisted, for example), with stylistic indicators such as Carry Length and Average Defensive Action Distance providing further illustration of his player profile. When we're happy that the radar we've created reflects and demonstrates the profile of player we're looking for, we can save the template for future and repeated use.
But how can we use this information to find potential competition or players of a similar profile?
2) Use StatsBomb's Similar Player Search Tool
The first thing to do in Similar Player Search is to set the filters for potential replacements. StatsBomb cover 80+ competitions worldwide, but Liverpool tend to focus on recruiting from the very top of the market. For the purposes of this exercise, we’re going to set the following filters to search within:
- Season: 2020/21
- Minutes Played: >=1200
- Competition: Big 5 European
- Age: U-25
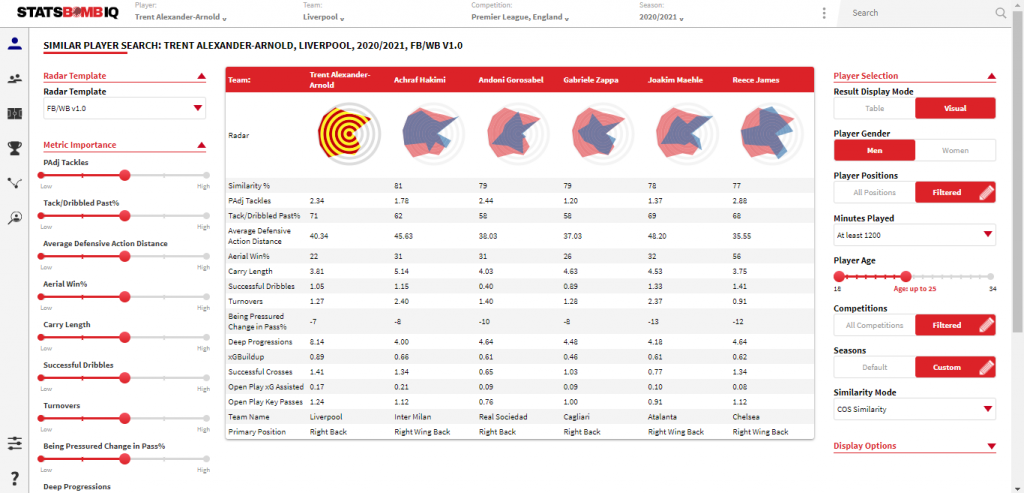
The returned list throws up some interesting names, some more realistic than others. It's no surprise to see Inter Milan's Achraf Hakimi flagged as a very similar profile of full back to Trent Alexander-Arnold - Hakimi put up 0.48 goals + assists per 90 from right wingback for I Nerazzurri in their Serie A title-winning season and in this campaign has boosted his reputation further as one of the world's best right-sided defenders. Priot to any qualitative scouting, the presence of Joakim Mæhle is a curious one as Atalanta profile as one of the most similar teams to Liverpool in StatsBomb's Similar Team Search tool, suggesting Mæhle might find the transition to Liverpool's playing style easier than most if Liverpool were hypothetically looking to add competition for the right back position and if Mæhle were hypothetically deemed to have the required quality to fulfil that role.
The list returned is 73 players long which can be exported for further filtering, analysis and scouting.
3) Use IQ Scout
The second thing we can do to find players and create scouting shortlists is to use IQ Scout. IQ Scout is the recently upgraded scouting and recruitment tool within the StatsBomb IQ platform. We can use IQ Scout to find more players that may not have been flagged in our Similar Player Search, using filters to bring the list of players down to a manageable and relevant number. The first thing to do in IQ Scout is to select the radar template we’ve just created so we can filter our shortlist based on those metrics. Setting a benchmark of:
- >= 3.75 Deep Progressions per 90 minutes
- >= 0.50 Open Play Key Passes per 90 minutes
- >= 0.50 Successful Crosses per 90 minutes
- >= 62% Tackled / Dribbled Past %
… returns a shortlist of 11 players (after excluding Alexander-Arnold) that we can be confident are worthy of further investigation and filtering.
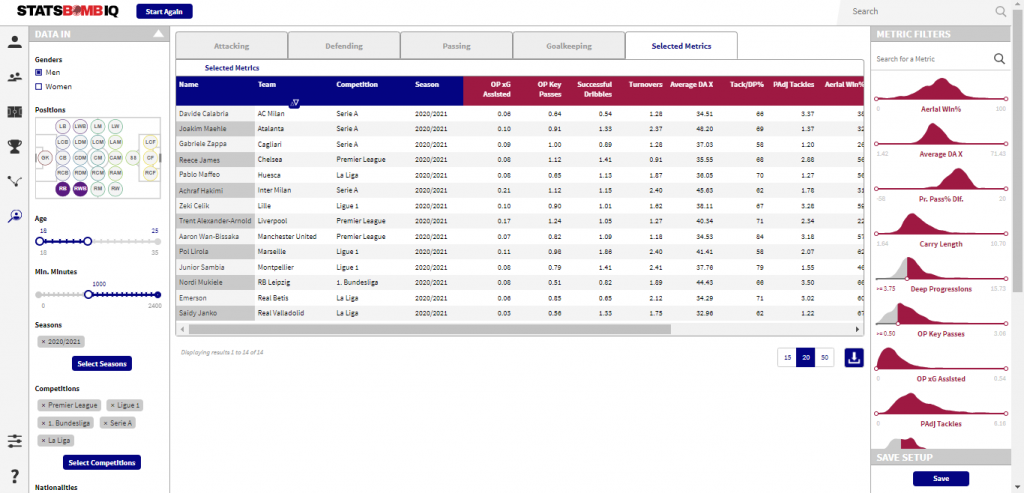
Loosening or altering the filters brings up a different set of names, as does adding more leagues to the search, allowing you to widen or reduce the pool of players before you export the shortlist which includes their performance data across every metric in the StatsBomb IQ Scout database.
Of course, IQ is flexible to each user's demands and scouting criteria, so let's take a quick look at an alternative profile of full back to demonstrate this.
Benjamin Pavard has just come off the back of another title-winning season at Bayern Munich and heads into the Euros with France looking to double up on their 2018 World Cup win. Pavard has provided a stable solidity to Bayern's back four, counterbalancing the rampaging and aggressive Alphonso Davies on the opposite flank. Pavard's key duties in the Bayern backline have been to protect the Bavarian's from becoming exposed on the counter, allowing their more attacking talents to flourish, and provide a safe outlet in possession to recycle the ball to more adventurous teammates.
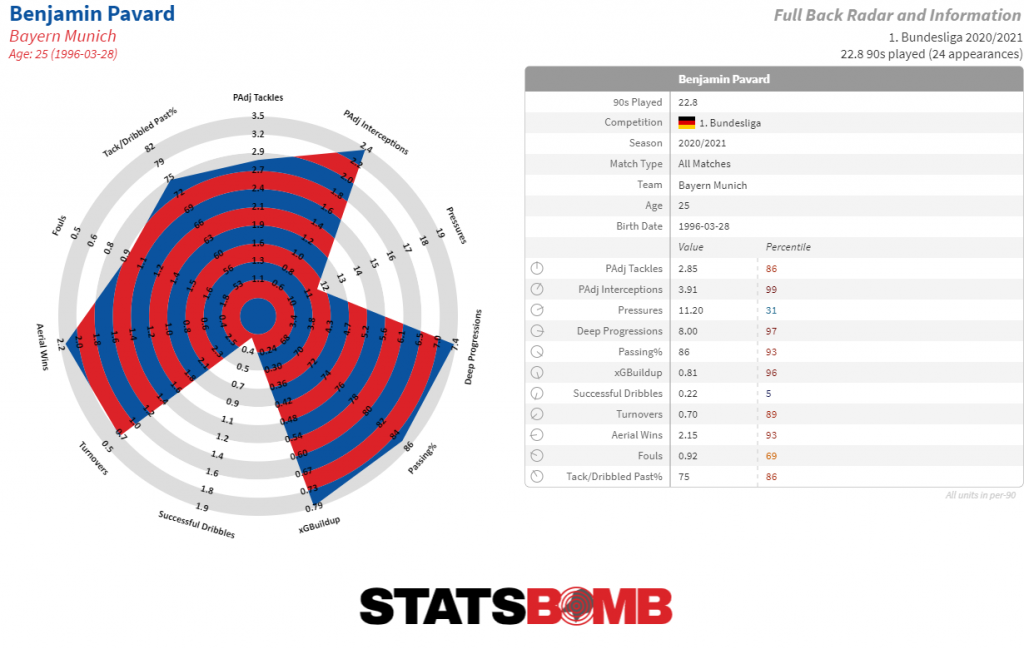
Assuming safety - both defensively and in-possession - is the most important attribute we want to search for in this exercise, we can create a new player template that is designed to highlight and emphasise this. We'll remove Pressures, Deep Progressions, xGBuildup, and Successful Dribbles from the original full back template. In their place we'll add:
- pAdj Pressures: Possession adjusted pressures
- Pressured Pass %: Proportion of pressured passes that were completed
- Dribbled Past: How often a player fails a challenge and is dribbled past
- Blocks/Shot: Blocks made per shot faced
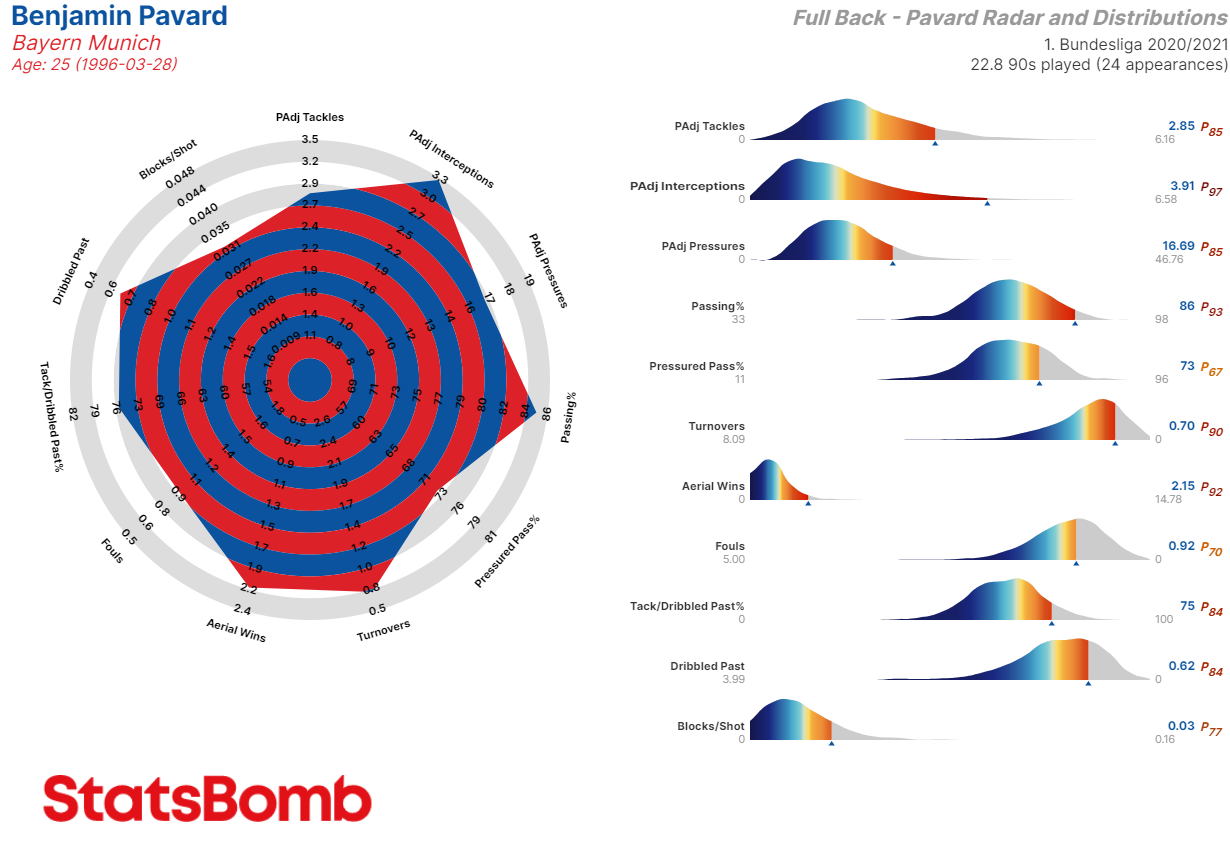
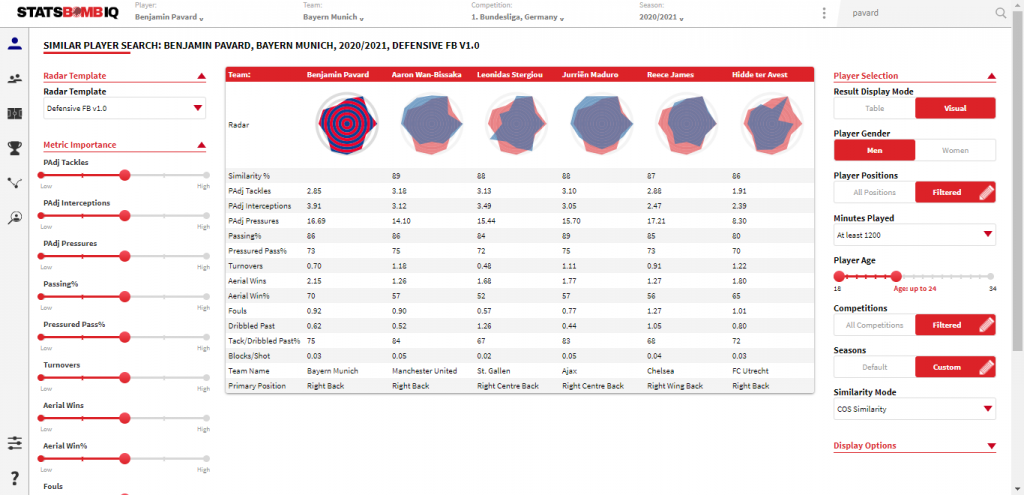
The new radar clearly highlights Pavard's defensively excellent performances for Bayern, regularly winning the ball back and protecting the Bayern goal and rarely giving the ball away. This provides a template and benchmark we can use to find players that perform defensive or "safe" actions to a similarly high level. Using this template in the Similar Play Search with the following filters:
- Age: U-24
- Minutes Played: min. 1200
- Season: 2020/21
- Competition: Big 5 European Leagues + Austrian Bundesliga, Belgian Pro League A, German Bundesliga 2., Netherlands Eredivisie, Portuguese Liga NOS, and Swiss Super League.
... returns a list of 100 players, with the five most similar players seen below:
Heading into IQ Scout and applying the same preliminary filters as before with the addition of:
- >= 50% Aerial Win %
- <= 1.20 Dribbled Past per 90 minutes
- >= 1.0 pAdj Interceptions per 90 minutes
- >= 1.5 pAdj Tackles per 90 minutes
- >= 65% Pressured Pass %
- >= 67% Tackle / Dribbled Past %
... returns a list of 12 players, ones we can be confident will be a reasonably close fit to the safety-first full back profile we're looking for and worthy of further analysis and scouting. We can also create a wider or more specific shortlist of players by adjusting or changing the filters.
That’s just a glimpse of how StatsBomb IQ can be used for player recruitment and shortlist creation, prior to the deeper analysis we can perform within IQ once we’ve identified our targets. If you’re a football club or organisation and would like a full demo of how StatsBomb IQ and Data can help you achieve your objectives, get in touch with us today.
Right now, dozens of clubs around the world will be using StatsBomb IQ to aid their player recruitment planning and shortlisting ahead of the summer transfer window. IQ is designed by analysts, for analysts, with the goal of making data-driven insights easily accessible and digestible. Most importantly, it saves valuable time and resources for the time-poor analyst and is flexible and customisable to each user's specific needs.
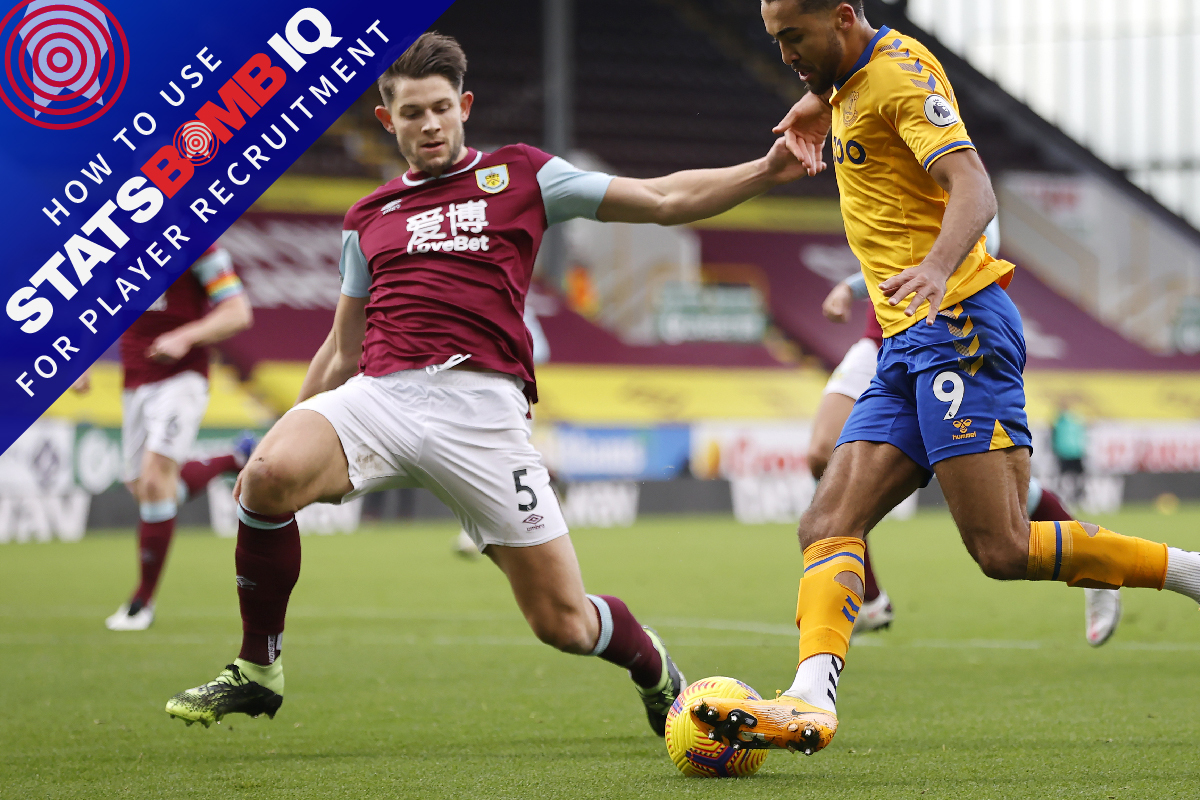
Data can be used at all stages of the recruitment process, from the initial shortlisting, down to more granular player assessments, to support qualitative live and video scouting and background personality checks. Yesterday, we showed how data can be used in the early stages of the recruitment process to create a shortlist of forwards that might be worth further scouting. Today we're going to do the same with centre backs, starting with Burnley's James Tarkowski.
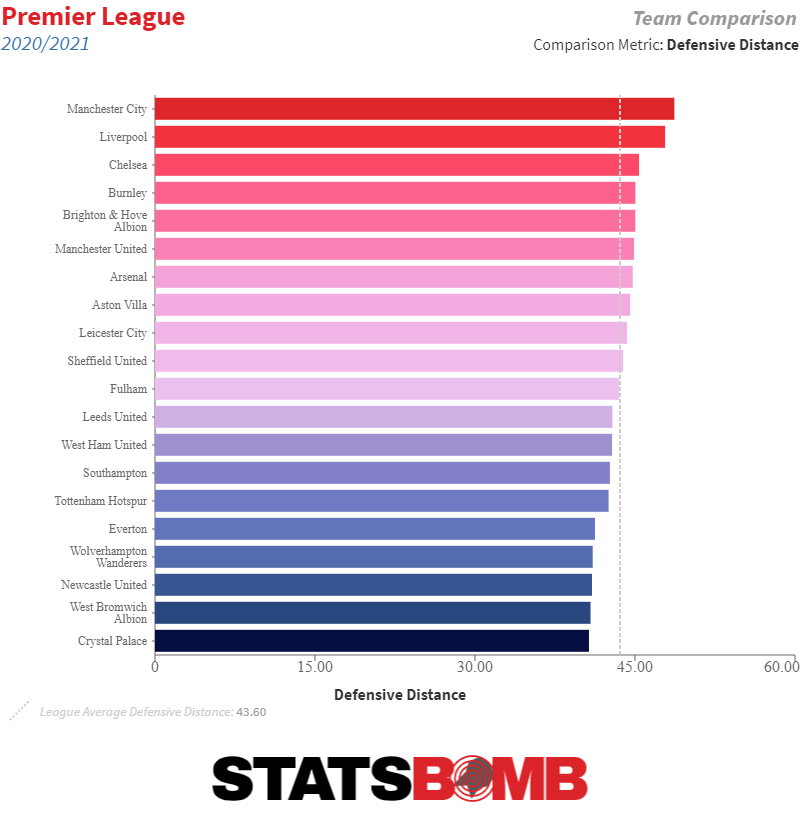
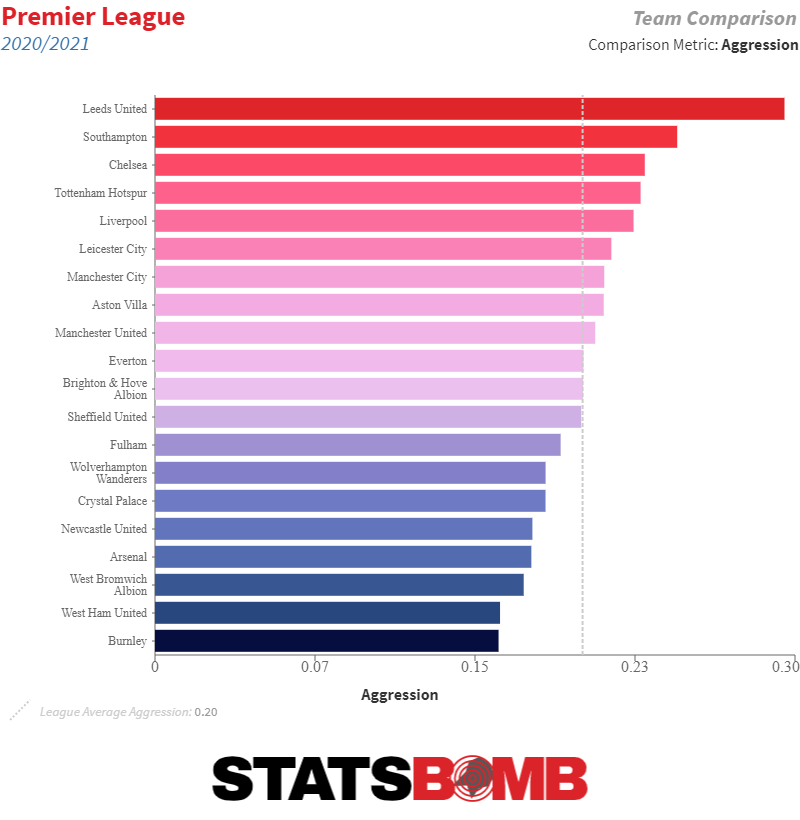
It's well known that Burnley have a particular - and effective - approach to defending when out of possession. If their opposition has possession deep in their own half, particularly from goal kicks, Burnley will play a high line and look to force their opponents to play the ball long, where they know their centre backs will more often than not win their duels near the halfway line. This is shown in their Defensive Distance: the average distance from their own goal that a team makes a defensive action.
However, should the opposition break the initial press and start to progress into the middle third and beyond, Burnley look to drop in and decrease the space between the lines, keeping a compact shape and defending any balls that come into the box. Their prioritising of their shape over engaging the opposition is reflected in their Aggression % - the percentage of opposition pass receipts that are pressured, tackled, or fouled within two seconds - of 16%, the lowest in the league.
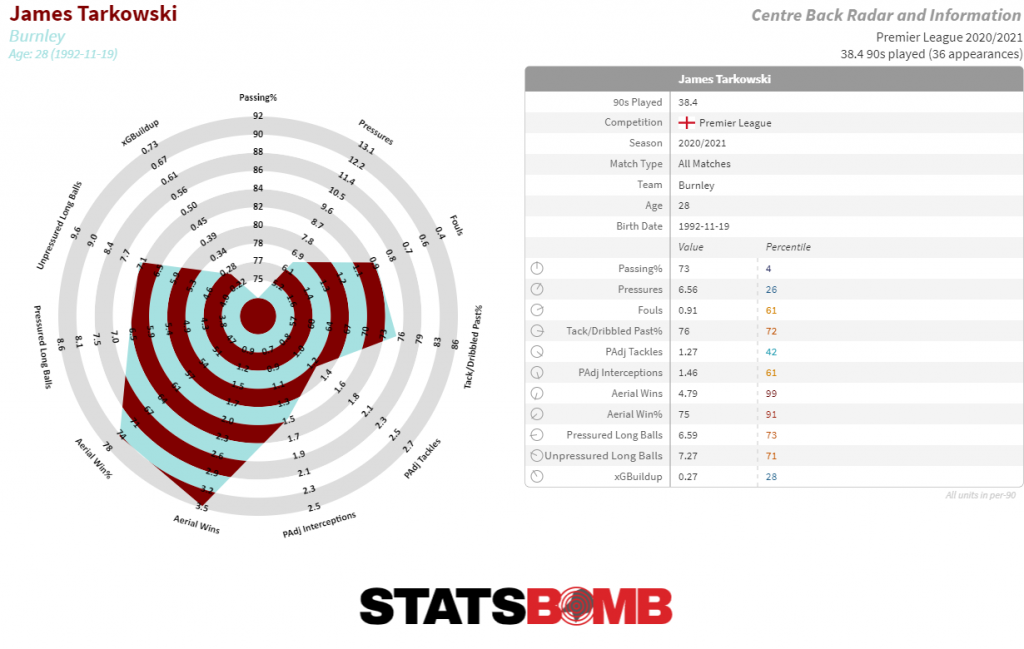
For Tarkowski, this means that his main responsibilities as a Burnley centre back can be condensed into: being strong in aerial duels, being strong in ground duels, and defending his penalty box well, with little-to-no expectation on him to be an effective player in possession. Given Tarkowski's importance to Burnley, and the fact he's been linked with moves away in previous windows, it'd be sensible for Burnley to be planning and searching for potential successors already. Let's use StatsBomb IQ to help us do this.
1) Create And Edit A Radar Template
The first thing to do is adjust the standard Centre Back radar template to include metrics that best reflect Tarkowski's player profile and give us the best chance of finding a player that could replace him.
As mentioned, we're not expecting Tarkowski or his replacement to be highly effective in possession, so we'll remove Passing %, Pressured Long Balls, Unpressured Long Balls and xGBuildup from the standard radar template. In their place, we'll add:
- Average Defensive Action Distance: The average distance from the goal line that the player successfully makes a defensive action
- Clearances: Number of clearances made by a player
- Blocks/Shot: Blocks made per shot faced
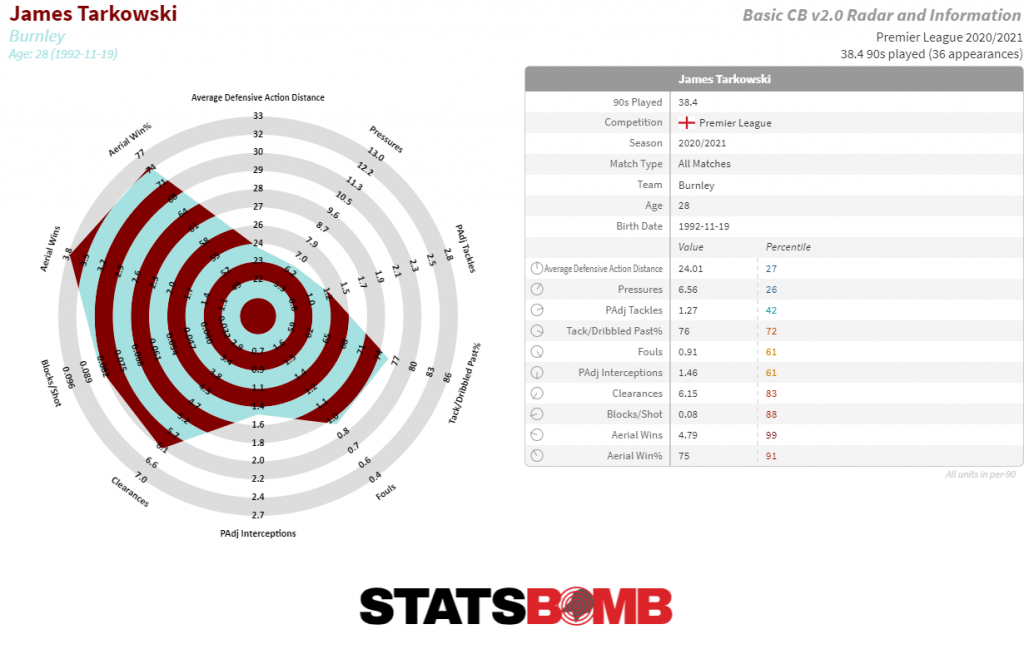
We can see that Tarkowski is an excellent performer in aerial duels (in the 99th percentile for Aerial Wins and 91st percentile for Aerial Win %), ground duels (72nd percentile for Tackle / Dribbled Past %*), and defending his box (88th percentile for Blocks / Shot and 83rd percentile for Clearances). *Tackle / Dribbled Past %: Percentage of time a player makes a tackle when going into a duel vs getting dribbled past.
When we're happy that the radar reflects the profile of player we'll be searching for, we can save the template for repeated future use. But how can we use this information to find a potential replacement?
2) Use StatsBomb's Similar Player Search Tool
The first thing to do in Similar Player Search is to set the filters for potential replacements. StatsBomb cover 80+ competitions worldwide, but Burnley tend to focus on a specific and limited number of markets when recruiting new players, mostly domestically. For the purposes of this exercise, we’re going to look at players from:
- Season: 2020/21
- Minutes Played: >=1200
- Competition: Big 5 European + English Championship
- Age: U-29

The top five most similar players make for interesting reading. Stoke's Harry Souttar has been praised for his performances in his first full season at Championship level and, at 22 years old, represents a centre back that could be of longer-term interest to a team that defends like Burnley. If Burnley were happy to look abroad, then not far below the top five players returned is Felix Uduokhai of Augsburg in the Bundesliga. Uduokhai not only has a similar profile to Tarkowski, but Augsburg also show up as a team that defends in a somewhat similar style to Burnley when comparing Burnley's defensive style to Big 5 + Championship teams in StatsBomb's Similar Team Search. At 23 years old, he could be another worth further investigation.
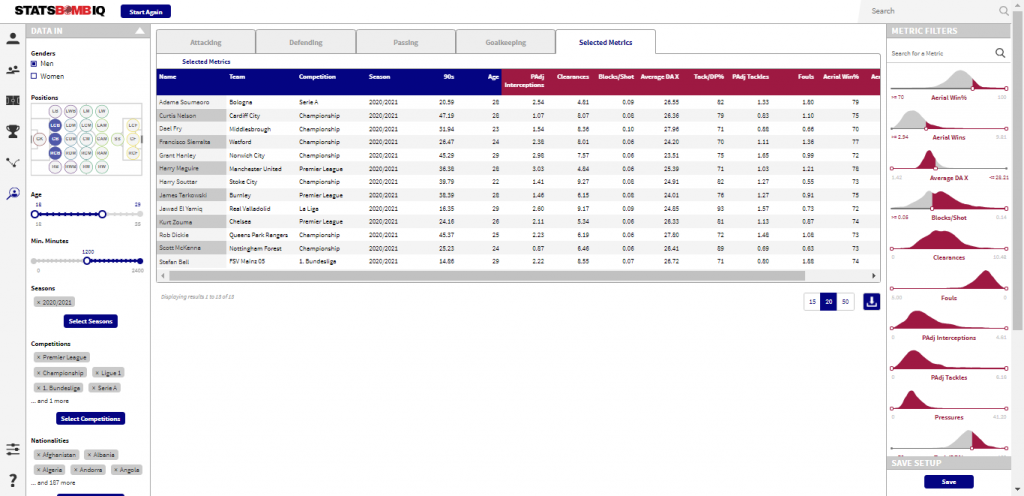
The list returned is 99 players long which can be exported for more detailed filtering, scouting and analysis.
3) Use IQ Scout
The second thing we can do to find players and create scouting shortlists is to use IQ Scout. IQ Scout is the recently upgraded scouting and recruitment tool within the StatsBomb IQ platform. We can use IQ Scout to find more players that may not have been flagged in our Similar Player Search, using filters to bring the list of players down to a manageable and relevant number. The first thing to do in IQ Scout is to select the radar template we’ve just created so we can filter our shortlist based on those metrics. Setting a benchmark of:
- >=70% Aerial Win %
- >= 3.0 Aerial Wins per 90 minutes
- <= 28.2 Average Defensive Distance (to find players used to defending in deeper areas)
- >= 0.05 Blocks/Shot
- >= 70% Tack/Dribbled Past %
… returns a shortlist of 12 players that we can be confident are worthy of further investigation and filtering.
Loosening or altering the filters brings up a different set of names, as does adding more leagues to the search, allowing you to widen or reduce the pool of players before you export the shortlist which includes their performance data across every metric in the StatsBomb IQ Scout database.
Of course, IQ is flexible to each user's demands and scouting criteria, so let's take a quick look at an alternative profile of centre back to demonstrate this.
Magdalena Ericsson has just come off the back of a title-winning and Champions League silver medal winning season with Chelsea. Ericsson's very capable on the ball, playing a crucial role in the early stages of build-up for Chelsea as well as possessing ability to progress the play herself through incisive passing or ball carrying.
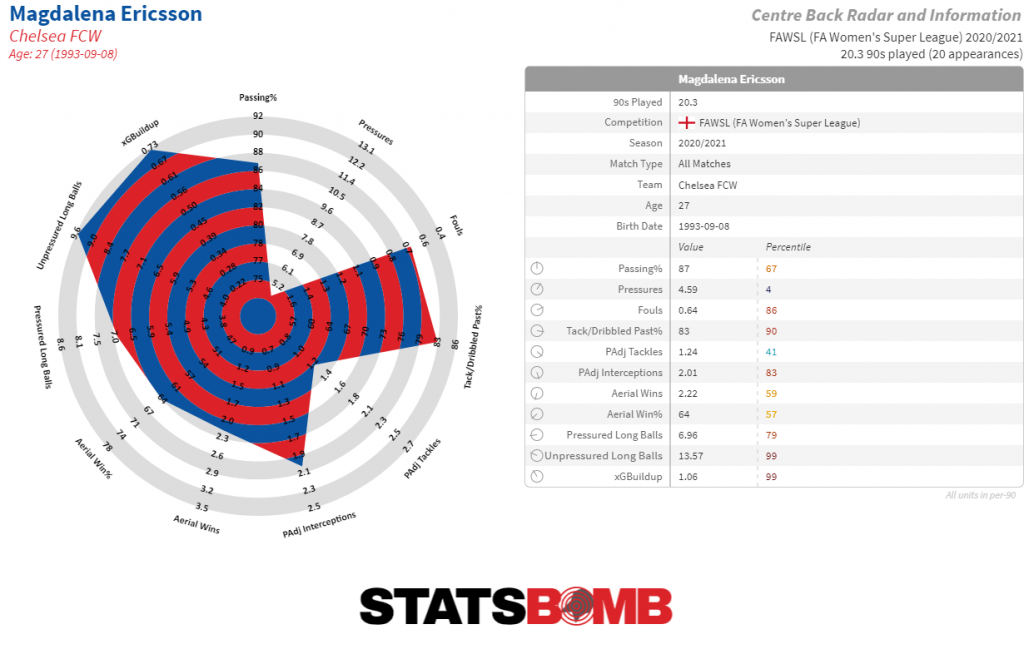
Assuming on-ball ability is the most important attribute we want to search for in this exercise, we can create a new player template that is designed to highlight and emphasise this. We'll remove Fouls, Pressures, Pressured Long Balls, Unpressured Long Balls, pAdj Tackles and pAdj Interceptions. In their place we'll add:
- pAdj Tackles & Interceptions: Number of tackles and interceptions adjusted proportionally to the possession volume of a team
- Open Play Passes: Number of attempted passes in open play
- Being Pressured Change in Pass%: How does passing % change when under pressure? This is calculated as Pressured Pass % minus Pass %
- Deep Progressions: Passes and dribbles/carries into the opposition final third
- Carries: A player controls the ball at their feet while moving or standing still
- Carry %: Percentage of a player's Carries that were successful
- Carry Length: Average Carry length.
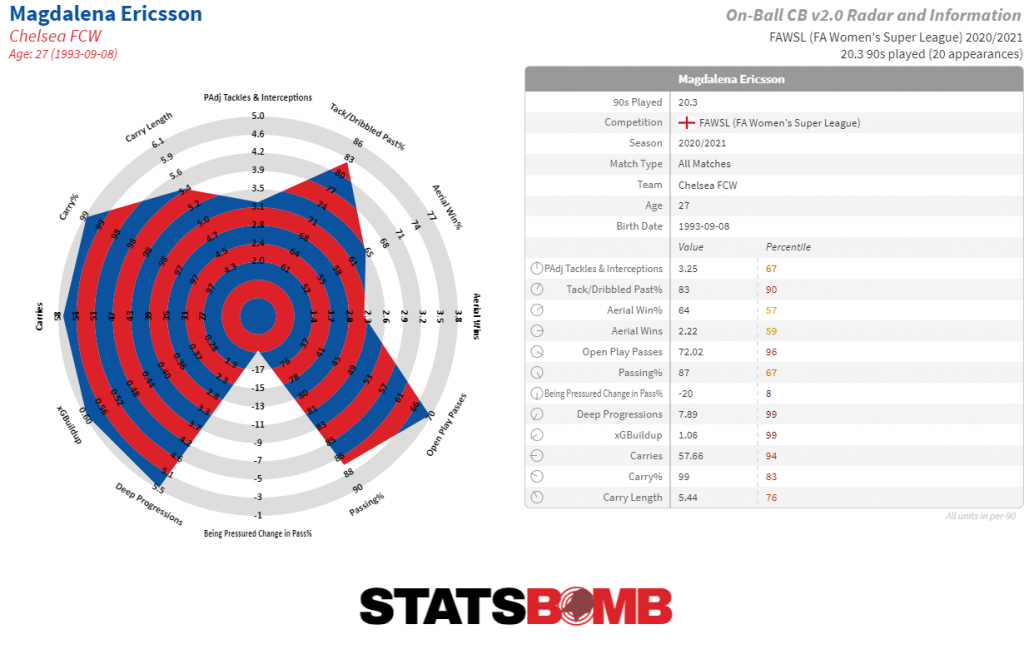
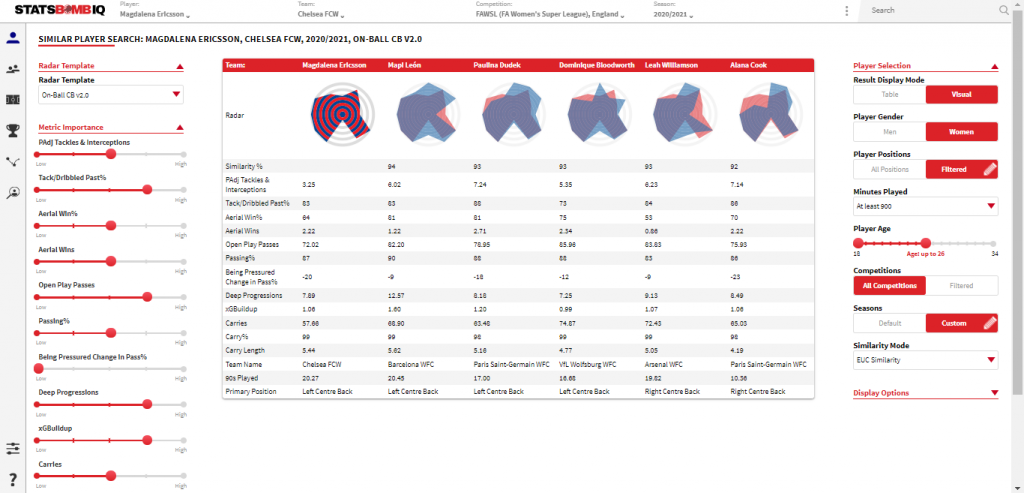
The new radar clearly highlights Ericsson's profile in possession: one that is heavily involved in the build-up (72 Passes In Open Play per 90) and moving the play forwards (7.9 Deep Progressions per 90). Using this template in the Similar Play Search with the following filters:
- Age: U-26
- Minutes Played: min. 900
- Season: 2020/21
- Competition: Big 5 European Leagues
... returns a list of 100 players, with the five most similar players seen below:
Heading into IQ Scout and applying the same preliminary filters as before with the addition of:
- >= 75% Tackled / Dribbled Past %
- >= 60% Aerial Win %
- >= 45 Open Play Passes per 90 minutes
- >= 2.8 Deep Progressions per 90 minutes
... returns a list of 10 players, ones we can be confident will be a reasonably close fit to the ball-playing centre back profile we're looking for and worthy of further analysis and scouting, with the opportunity to add, remove or adjust additional filters to create a wider or more specific shortlist of players. That’s just a glimpse of how StatsBomb IQ can be used for player recruitment and shortlist creation, prior to the deeper analysis we can perform within IQ once we’ve identified our targets alongside live and video qualitative scouting and background personality and availability checks. Next week we’ll look at another position on the pitch to further demonstrate how StatsBomb IQ can be customised to fit the precise profile of player you're looking for.
If you’re a football club or organisation and would like a full demo of how StatsBomb IQ and Data can help you achieve your objectives, get in touch with us today.
Right now, dozens of clubs around the world will be using StatsBomb IQ to aid their player recruitment planning and shortlisting ahead of the summer transfer window. IQ is designed by analysts, for analysts, with the goal of making data-driven insights easily accessible and digestible. Most importantly, it saves valuable time and resources for the time-poor analyst and is flexible and customisable to each user's specific needs.
Data can be used at all stages of the recruitment process, from the initial shortlisting down to more granular player assessments, to support qualitative live and video scouting and background personality checks. Today we're going to show you some examples of how IQ can be used to bring data into the recruitment process in the early stages when creating a scouting shortlist. Let’s look at a couple of Premier League forwards with different player profiles and role requirements. Given the rumours swirling around White Hart Lane at the minute, it seems likely that Tottenham might currently be in the process of drawing up contingency plans should Harry Kane depart for pastures new.
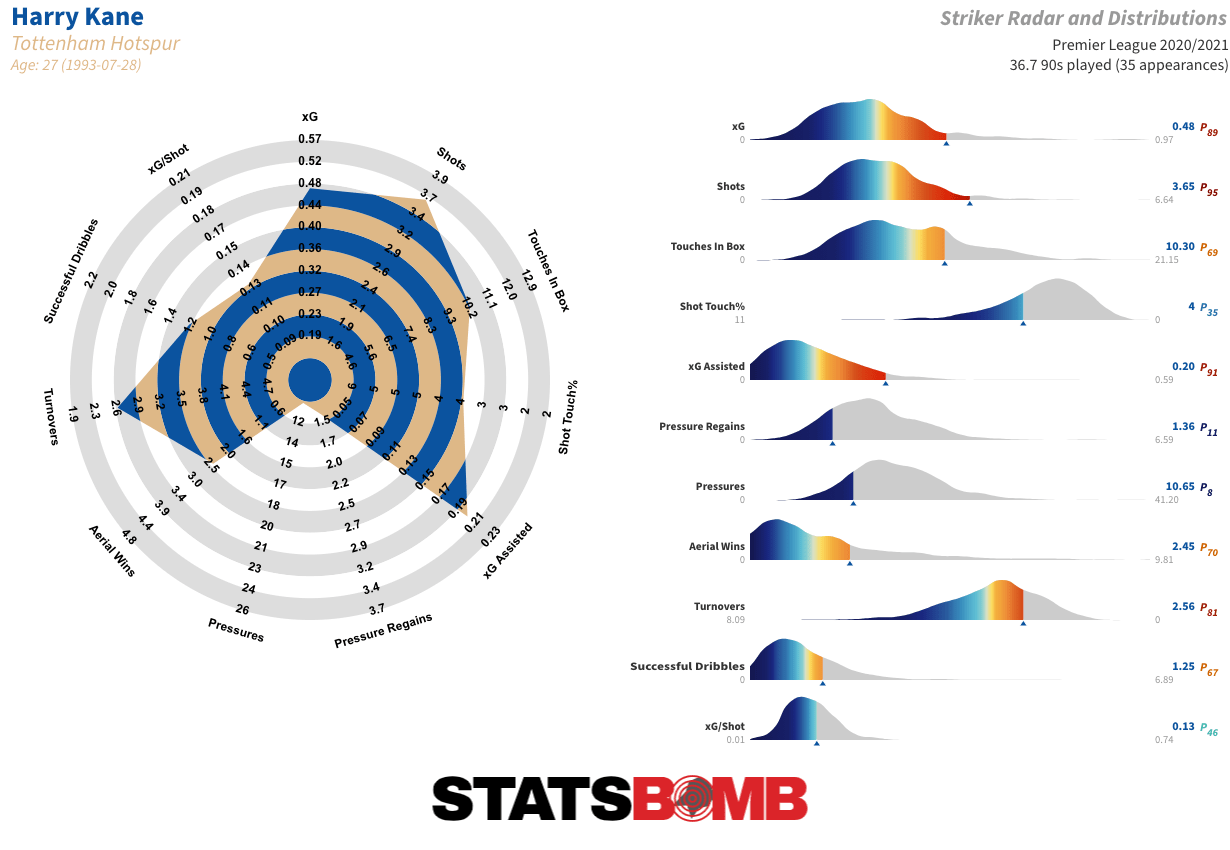
It goes without saying that Kane is vitally important to Spurs, being one of the best forwards in the world. Kane was the only player in the Premier League to hit both 0.20 xG per 90 *and* 0.20 xG assisted per 90 in the 2020/21 season. We want to create a shortlist of players that could be worth further investigation as potential replacements for the England striker. Spurs might be thinking about doing this in a number of different ways, replacing him with multiple players or adapting their style of play to bring the best out of other players, for example, but for the purposes of this exercise, let’s assume they’re looking for a direct replacement.
1) Create And Edit A Radar Template
The first thing we want to do in IQ is create a radar template that best reflects Kane’s output as a forward. We know that Kane takes on what you might call a “complete” role up front for Tottenham; dropping deep to be involved in build-up, providing creative link-play in the final third, whilst also being the team’s main goal threat. To do this, we select the “Edit Radar Template” function in IQ, choosing the relevant positions we want the data to filter for.
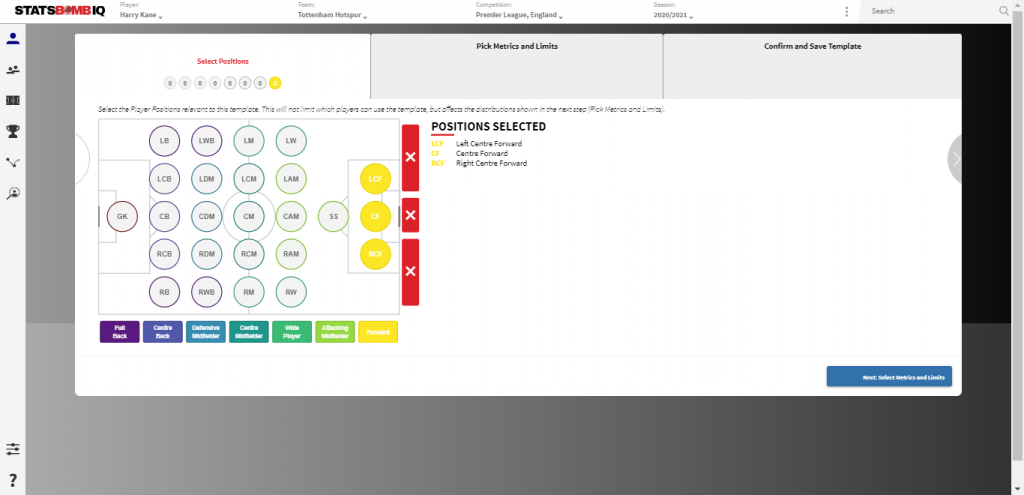
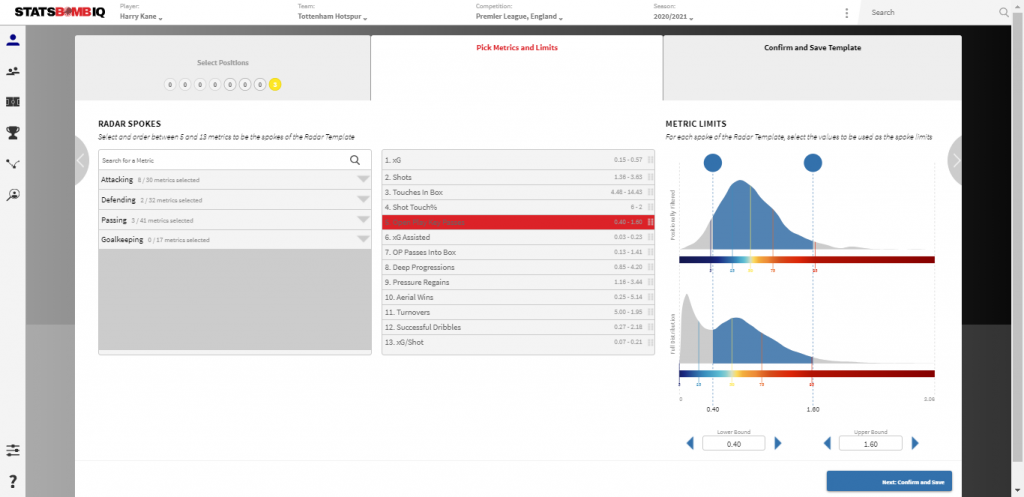
Next, we select the relevant metrics with which we want to judge Kane’s performances against and that will be used in the search for his potential replacement.
As an indicator of his ball progression and build-up play, we'll add Deep Progressions (the number of times the player moves the ball into the final third through a pass or dribble) to the original Striker radar template. As measures of his final third link play, we'll add Open Play Passes Into The Box as well as Open Play Key Passes. His goal threat will be measured by his Expected Goals and Shots totals.
Once our metrics are selected, we choose the radar percentile boundaries based on the distribution of data in each metric by the relevant positions we've chosen, in this case strikers.
When we’re happy with the metrics we’ve selected and layout of our radar, we can save the template for future use, and view the player on our newly created radar.
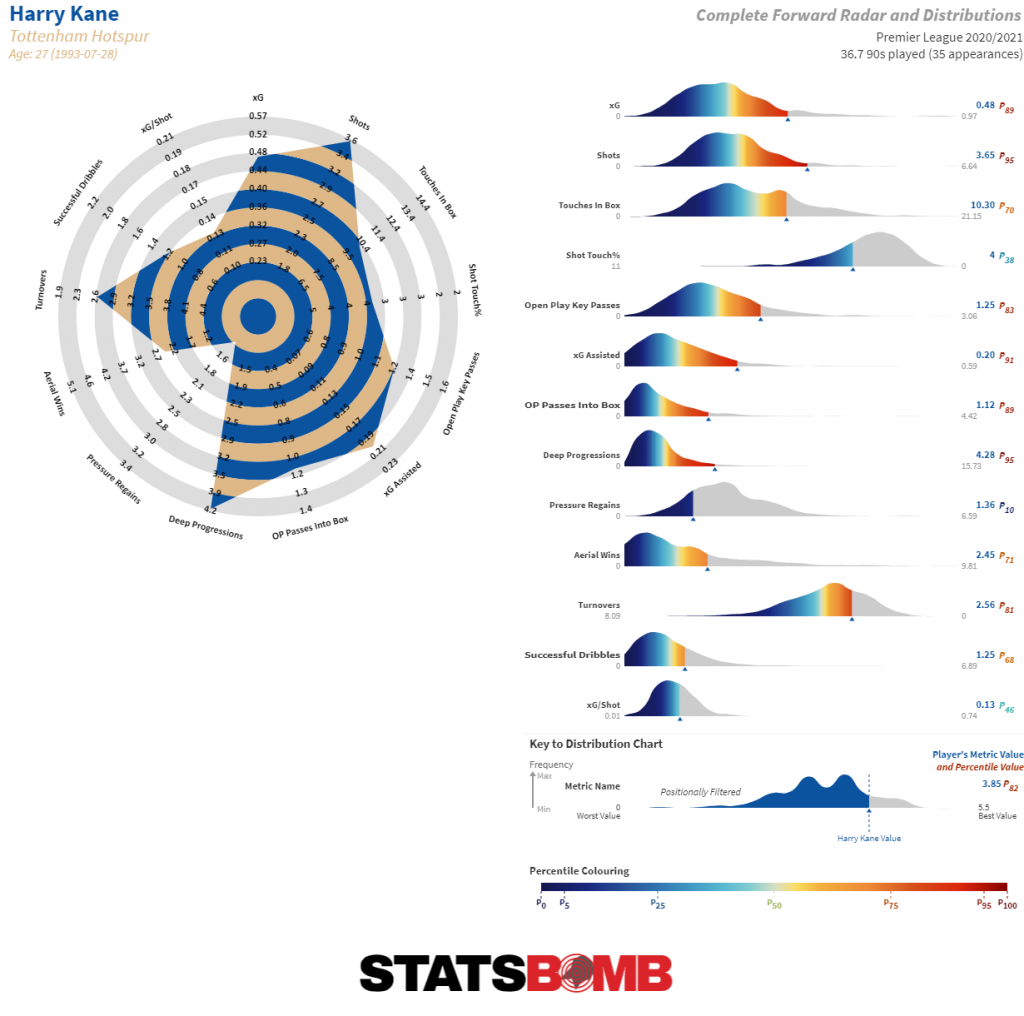
The new radar provides an accurate overview of Kane’s performances in the 2020/21 season against the criteria we' looking to judge:
- Goal Threat: 89th percentile for Expected Goals, 95th percentile for Shots
- Involvement In Build-Up: 95th percentile for Deep Progressions
- Final 3rd Link Play: 89th percentile for Open Play Passes Into The Box, 83rd percentile for Open Play Key Passes, 91st percentile for xG Assisted
We now have a radar that reflects Kane’s outputs. But how can we use this to aid our search for potential replacements?
2) Use StatsBomb IQ’s Similar Player Search Tool
The first thing to do in Similar Player Search is to set the filters for potential replacements. StatsBomb cover 80+ competitions worldwide, but Spurs will obviously be looking towards the top of the market for a possible new striker. For the purposes of this exercise, we’re going to look at players from:
- the 2020/21 season
- with a minimum of 1500 minutes played
- in a Big 5 league + Austrian Bundesliga, Portuguese Liga NOS, and English Championship
- and no older than 24 years old
The top 5 most similar players make for interesting reading, with perhaps Salzburg’s Patson Daka the most eye-catching given the rumours that he’s likely to follow Erling Haaland as the next forward off the Salzburg production line. Slightly different in style to Kane, Daka is more involved on the end of chances - as reflected by his Shot Touch % of 5% (the percentage of his touches that are shots) - and less involved in the build-up play, reflected by his 2.0 deep progressions per 90 minutes (compared to Kane's 4.3). However, the Zambian plays in a transition-heavy team (worth noting if Spurs are looking to stick with that style) and has shown consistent quality on the European stage. He might be worth consideration.
If we were to place more weight on the build-up and link-play metrics, names such as Amine Gouiri, Rafael Leão and João Félix appear closer to the top of the search. Some more realistic than others, but again perhaps worth further scouting and analysis from the Spurs recruitment team. On the criteria selected, 64 names were produced. We can export the shortlist with each of their similarity scores and outputs in the selected metrics attached to a .csv file for a more detailed look, whittling the names down based on their performances and potential availability.
There's still more we can do in IQ to increase our initial shortlist size.
3) Use IQ Scout
IQ Scout is the recently upgraded scouting and recruitment tool within the StatsBomb IQ platform. We can use IQ Scout to find more players that may not have been flagged in our Similar Player Search, using filters to bring the list of players down to a manageable and relevant number. The first thing to do in IQ Scout is to select the radar template we’ve just created so we can filter our shortlist based on those metrics. Setting a benchmark of:
- 2.0 Shots per 90
- 0.30 xG per 90
- 0.08 xG Assisted per 90
- 1.0 Open Play Key Passes per 90
… returns a shortlist of 12 players that we can be confident are worthy of further investigation.
Altering the filters slightly towards a more creative type of forward returns a list of 15 names, mostly new ones. We can change or loosen the filters as much as we want based on which we want to weight more heavily. Do we want a well-rounded forward who performs to at least an average level across a range of metrics? Or do we want one who is elite in a couple of highly important ones?
Once again, we can export the shortlists for further analysis and scouting, with the file containing the player's performances across every StatsBomb metric.
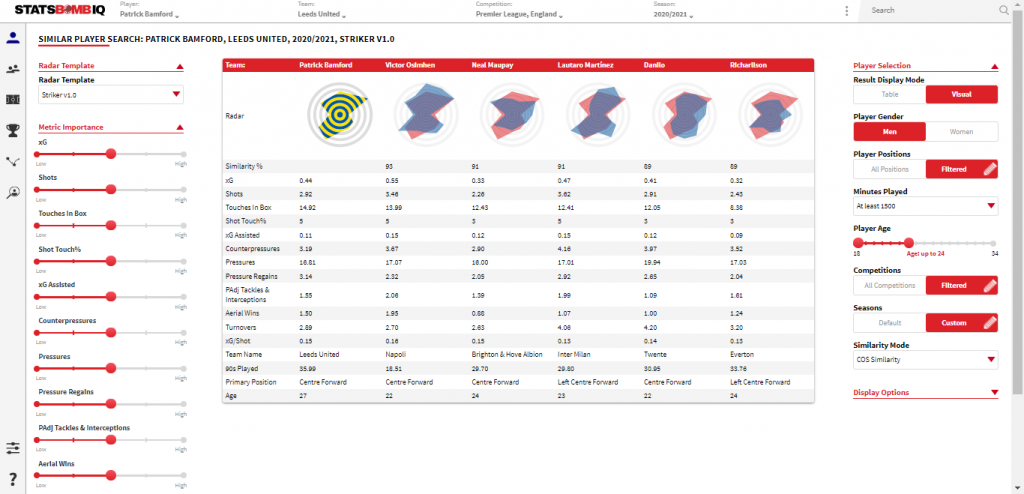
To demonstrate the flexibility of StatsBomb IQ to each user's needs, we can repeat the process for a forward with a slightly different profile to Harry Kane. Leeds’ Patrick Bamford is another prolific English goalscorer in the Premier League, but his role in the Leeds team is different to that of Kane’s. Bamford is relied upon to consistently find space in the box, be a finisher of the team’s chances rather than create them, and provide a high work rate out of possession in Marcelo Bielsa’s system.
We can create a radar template that best reflects Bamford’s outputs in the Leeds team and the type of player we’re searching for. The key metrics we'll be judging Bamford and his potential replacements against will be:
Find Space In The Box:
- Touches In Box
Finisher Of Chances:
- xG
- Shots
- Shot Touch %
Defensive Work Rate:
- Pressures
- Pressure Regains
- Counterpressures
- Possession-Adjusted Tackles & Interceptions
Again we can set the radar percentile boundaries based on the data filtered by each position, so we can see the 5th and 95th percentiles for counterpressures by strikers, for example, and then save our template for future use.
We can see that Bamford performs well in the metrics we’ve highlighted as being important to a player of his role and requirements: in the 96th percentile for Touches In The Box, the 88th percentile for Pressure Regains, and with a Shot Touch % of 5%. The Similar Player Search (using the same criteria as used for Kane but with the Eredivisie and Belgian Pro League added) returns some high-profile (and likely expensive) names. Danilo of FC Twente (on loan from Ajax) could be the most attainable of the top five, but not far further down the list you find Youssef En-Nesyri of Sevilla and Adam Armstrong of Blackburn, for example.
We can export the shortlist and then head into IQ Scout to widen our pool of players. Selecting the same competition, age, and minutes played filters and applying further filters on our metrics with a minimum of:
- 2.0 Pressure Regains per 90
- 13.5 Pressures per 90
- Shot Touch % of 3%
- 10 Touches In Box per 90
- 0.2 xG per 90
…returns a list of 16 names that we can be confident will be close to the style of player we’re searching for, again allowing the option to loosen or change the filters if we want to widen or reduce our shortlist, and also allowing us to export the list of players for further analysis and scouting, with the players' performance in each StatsBomb metric listed within the exported file.
That’s just a glimpse of how StatsBomb IQ can be used for player recruitment and shortlist creation, prior to the deeper analysis we can perform within IQ once we’ve identified our targets, alongside live and video qualitative scouting and background personality and availability checks. Later in the week we’ll look at different positions to further demonstrate how StatsBomb IQ can be customised to fit the precise profile of player you're looking for.
If you’re a football club or organisation and would like a full demo of how StatsBomb IQ and Data can help you achieve your objectives, get in touch with us today.
Over the past few weeks we’ve highlighted the 'Similar Player Search' function in StatsBomb IQ and presented some use cases for the tool. Today, we’re going to look at a related feature we’ve recently added to our industry leading analysis platform: 'Similar Team Search'.
The functionality is almost identical to that of the player search. A team and radar type (Attacking, Defending or Custom) is selected and the algorithm then produces a list of teams with similar statistical profiles, ranked on a scale of 0-100, with 100 being an exact match. A selection of filters can then be applied to tailor the results as necessary.
This is a powerful tool that takes in data from the wide range of global competitions we collect (80+ from 2021), and one that has a number of potential use cases for clubs, including:
- Head Coach Recruitment: which teams employ a similar style of play to ours? Who are their head coaches?
- Tactical Inspiration: team x press in a similar way to us but seem to be more effective at suppressing shots. What are they doing differently?
- Player Recruitment: team x has a comparable approach to ours. Do they have any players who could be of interest to us?
Let’s look at a few examples using custom radars that seek to primarily identify stylistic rather than performance-related similarities.
We will start off with an attacking radar that attempts to capture team ball progression and chance creation style. Which teams come out as being similar to Manchester City, by some distance the Premier League's top scorers last season?
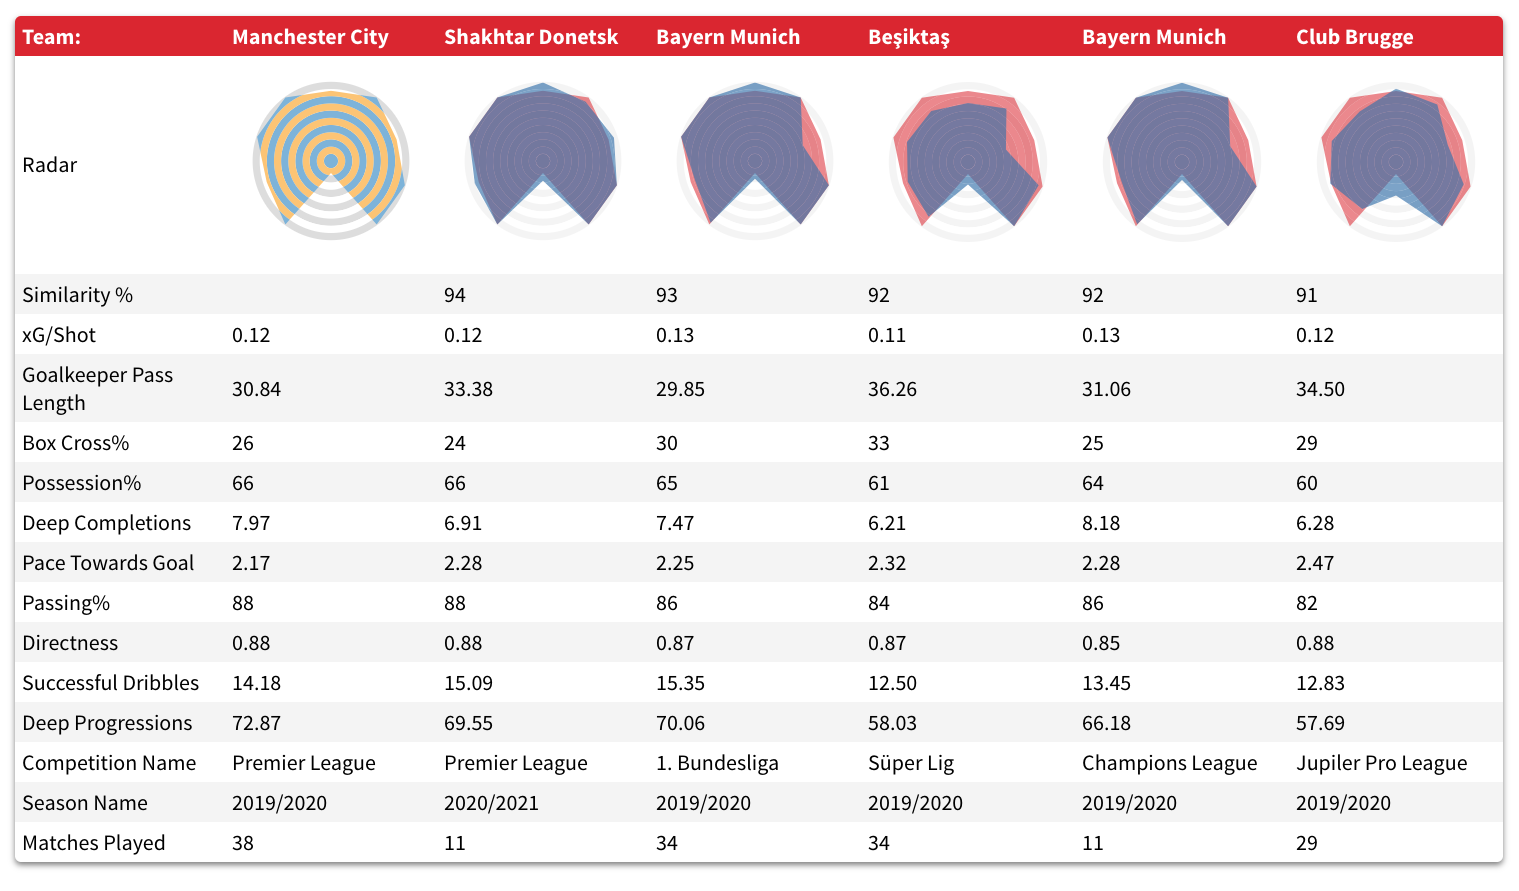
That looks like a promising list of high possession, territorially dominant teams. Slightly further down you’ll find sides like PSV Eindhoven, Crvena Zvezda and Flamengo -- the latter of whom were coached by Pep Guardiola’s former assistant Doménec Torrent prior to his dismissal last month.
Now let’s turn our attention to the defensive side of things, more concretely to the manner in which team press and counter-press. Our template in this case is Marcelo Bielsa’s Leeds side in their promotion campaign from the Championship. They were a team who pressed aggressively all over the pitch and made it difficult for opponents to advance into dangerous areas.
So which teams produce defensive outputs similar to those of that Leeds team?
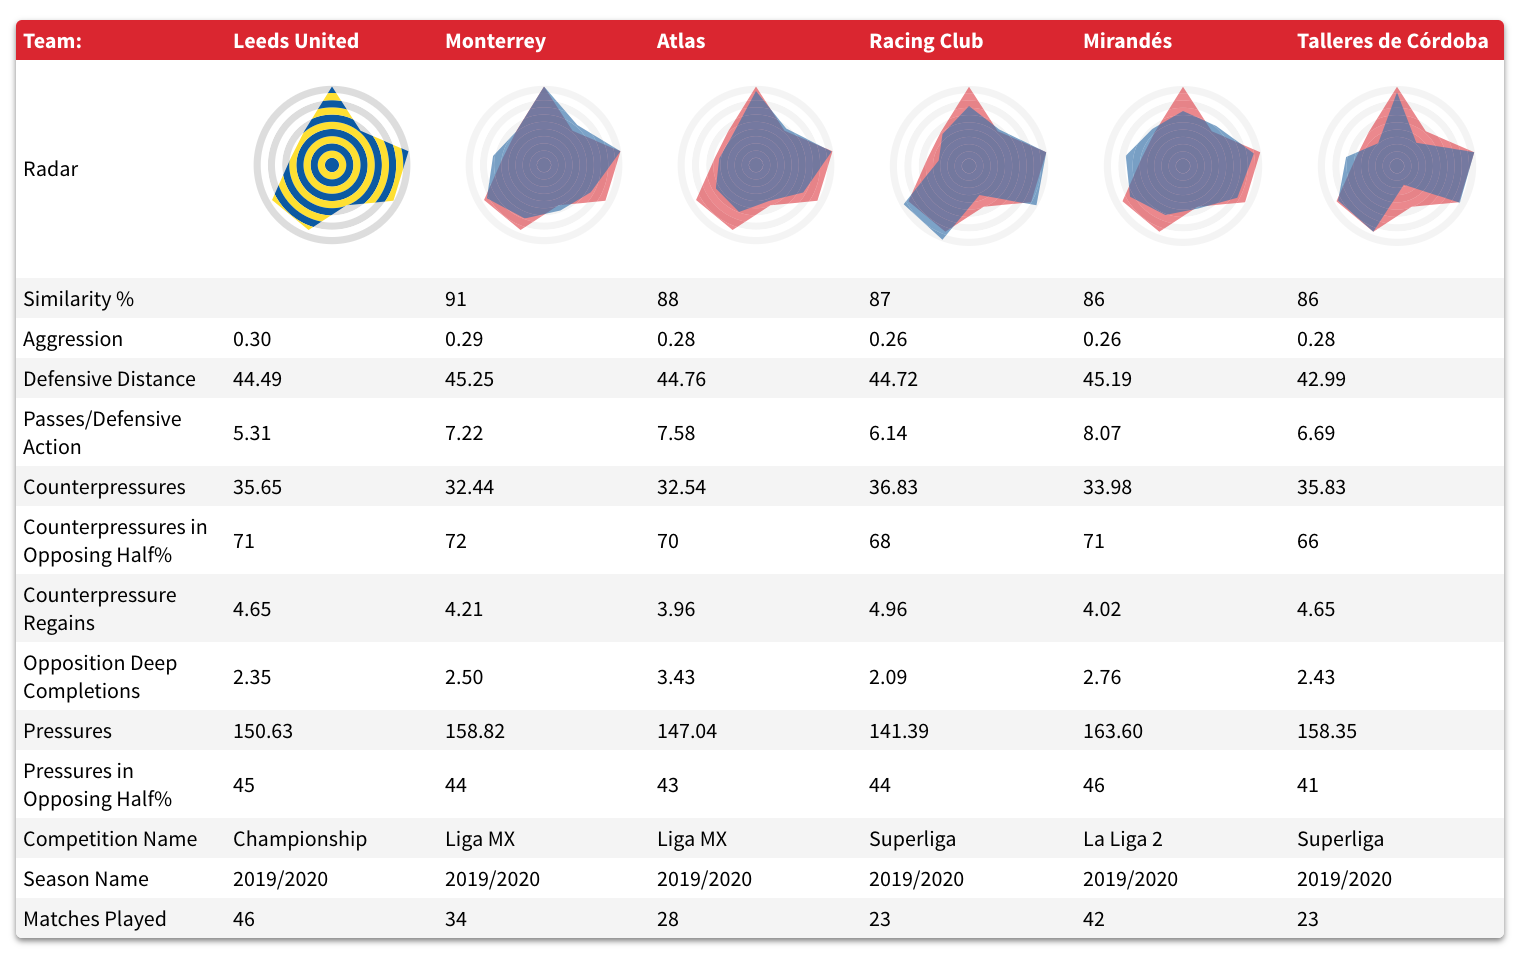
The two closest matches are Liga MX teams Monterrey and Atlas. Two sides from Argentina and Mirandés of the Spanish second division fill out the top five. Could this be a good starting point for an eventual search for Bielsa's replacement?
Finally, let’s look at a global radar that seeks to capture where and how teams defend and how and at what pace they transition from there to attack.
Getafe seem like a good example here, given that they employ an aggressive high press but combine that not with a high percentage of possession, as is often the case with pressing teams, but with a low possession share and quick and direct attacks. If José Bordalás was to leave tomorrow, who would be capable of replicating the approach that has helped lead them to three consecutive top-eight finishes since returning to La Liga in 2017?
Well... Diego Dabove of Argentinos Juniors would seem to be a pretty good candidate. Not only are his side the closest statistical match to Getafe, but there would also be no language barrier to overcome.
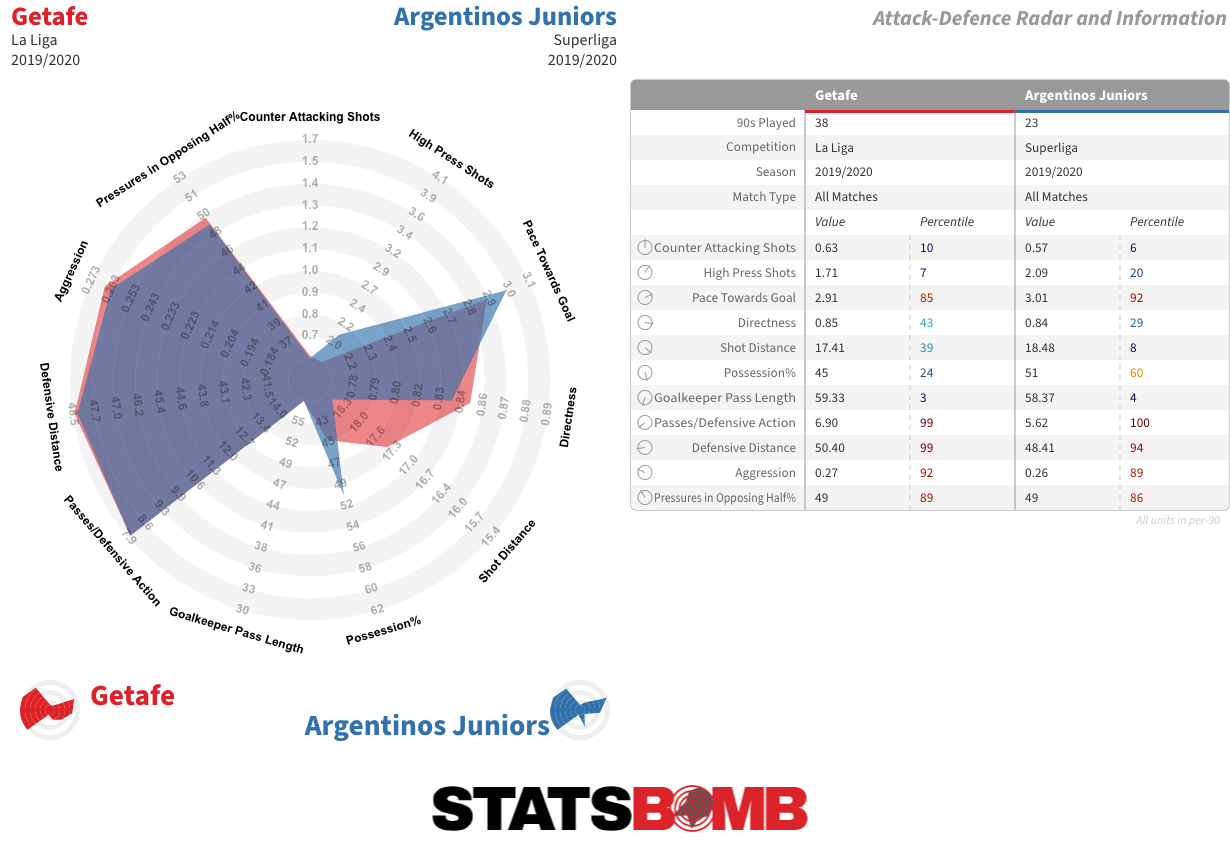
Other close matches include Slovácko of the Czech First League and Valérien Ismaël’s Barnsley.
That was a quick run through of the new 'Similar Team Search' function in StatsBomb IQ. With a wide variety of metrics to choose from, it is highly customisable tool, and we are certain our customers will utilise its functionality in ways we haven't yet conceived.
If you are a club, media or gambling entity and want to know more about what StatsBomb can do for you, please get in touch.
We are currently offering an extended 14 day free trial of our analysis platform StatsBomb IQ to potential clients.
The suspension of modern football has given us time to go back and collect data from some older matches. Amongst other things, it can be used to look at some the game’s greats from a different perspective. Diego Maradona certainly fits into that group. Some will no doubt consider it sacrilegious to wrestle a player who inspires such a viscerally emotional response into the realm of expected goals, deep progressions and pressure events, but here we are. What can we glean from the limited five-match sample we have in our system?
A Battle in the Bernabéu
The first Maradona match we have collected is the infamous 1984 Copa del Rey final between Athletic Club and his Barcelona side. This isn’t really early stage Maradona. He was eight years into a career that had begun at 15 at Argentinos Juniors, and that had already yielded a league title at Boca Juniors, a starting role at the 1982 World Cup and a world-record move to Spain. It is, though, before what is generally considered to be his true peak.
That may partly be for reasons of circumstance. There were some highs for Maradona in his two-year spell at Barcelona. He had provided the assist for the opening goal in a lively performance in their victory over Real Madrid in the previous year’s final, and earned applause for a cheeky pause before finishing against the same opponents away in the league. But illness and injury prevented him from ever building up much rhythm.
It is no wonder he struggled with injuries when you see the punishment he endured in this match. Eight months earlier he had been on the receiving end of a brutal sliding foul from Athletic’s Andoni Goikoetxea that had kept him out of action for three months. The challenges were similarly rough in this one. Even in the context of a generally ill-tempered encounter, with 32 fouls committed by Athletic and 21 by Barcelona (as a basis of comparison, there were just 30 fouls in total when the sides met in the quarter-final of the 2019/20 competition), Maradona seemed to be singled out. He was fouled nearly three times as often as any of his teammates. Eleven times in total.
The majority of those came as he received with his back to goal, most of them courtesy of the close and aggressive marking of Iñigo Liceranzu, whose litany of fouls were all at least booking worthy in their own right by modern standards. Not to mention his other unpunished hacks as play moved on. In a way, Maradona had the misfortune of being caught in a transitory period between the even rougher defending Pelé et al often had to contend with in the 1960s and the incredible fitness and preparation advances of the modern era.
In his time, players were becoming more athletic and spaces on the pitch were reducing, but refereeing wasn’t yet as stringent as it would later become. The decision of coach and compatriot César Luis Menotti to field him as a lone central striker does him no favours. It was an idea Menotti also used at the 1982 World Cup, and which there too left Maradona at the mercy of opposing defenders when he received with his back to goal. He spends much of this match either being fouled or trying to engineer first-time layoffs to teammates as he hops up to avoid swiping legs.
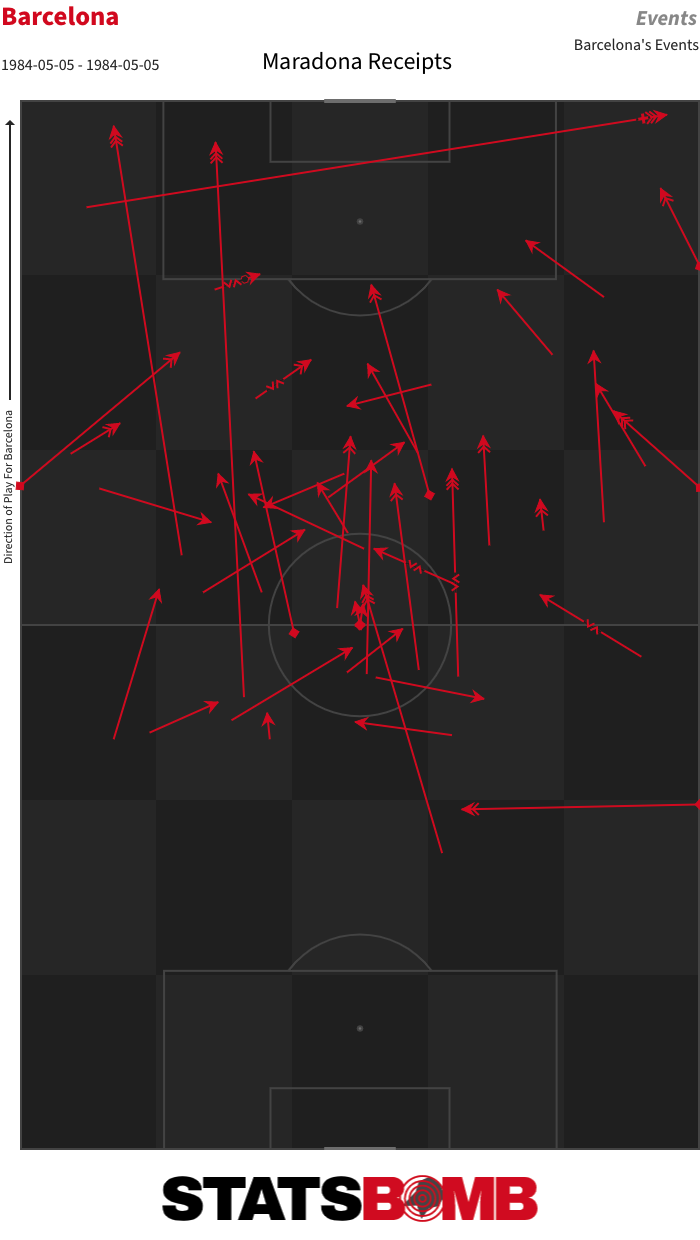
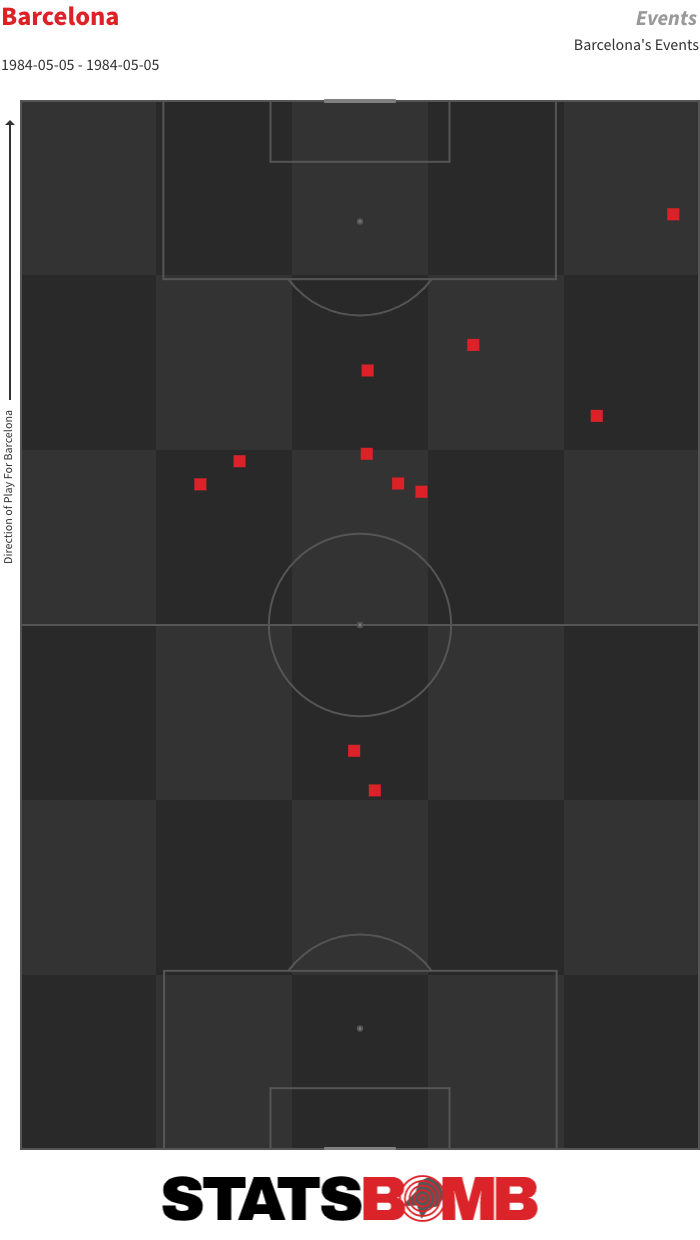
Barcelona struggle to make much attacking progress. Despite Bernd Schuster’s constant probing, including nine attempts to link directly with Maradona, they are just unable to pierce the defence of an Athletic side who won the league and cup double this season. Maradona musters just one shot and one key pass.
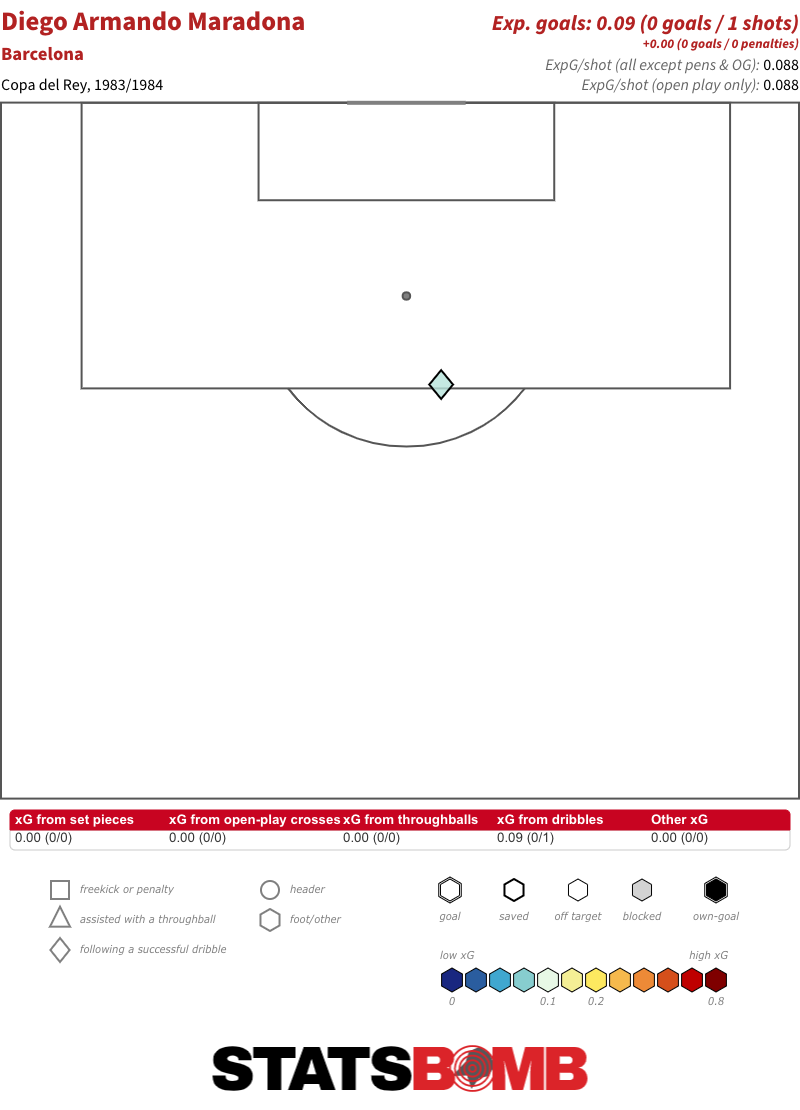
Bogged down by the system and circumstances, frustrated at his inability to influence the outcome, Maradona snaps at the final whistle, kicking off an ugly brawl that contributed heavily to the early termination of his relationship with Barcelona.
Peak Maradona
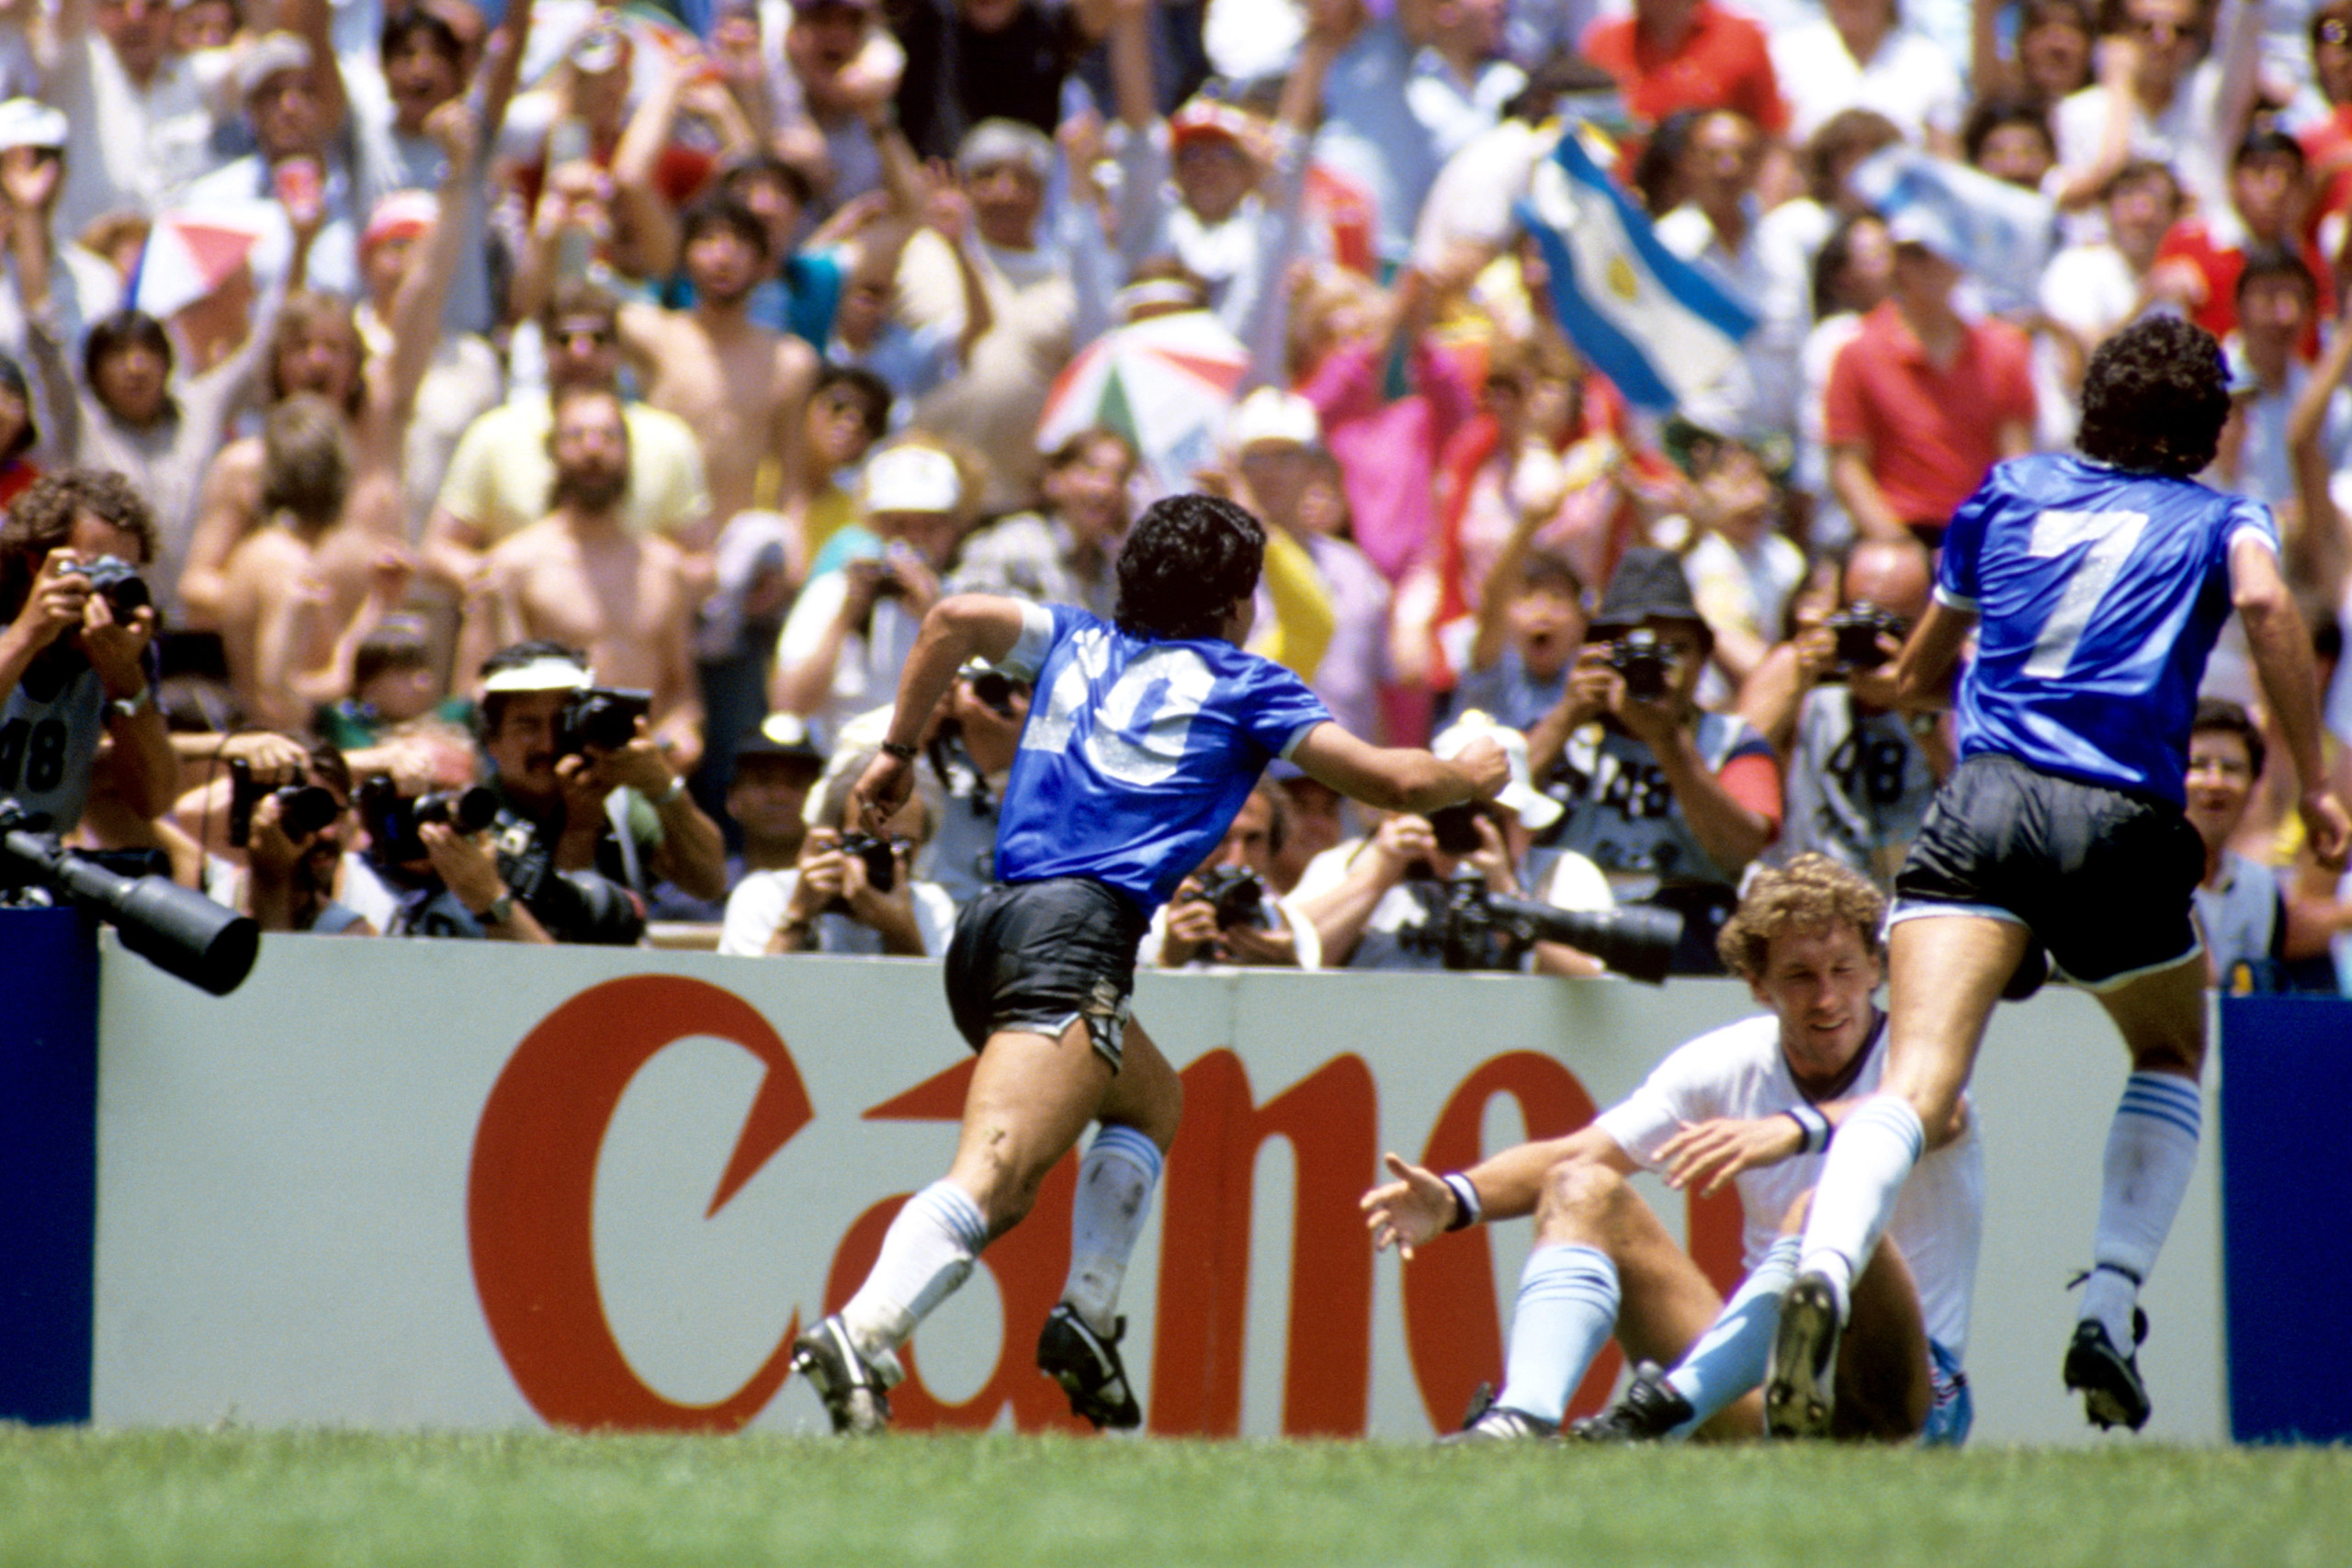
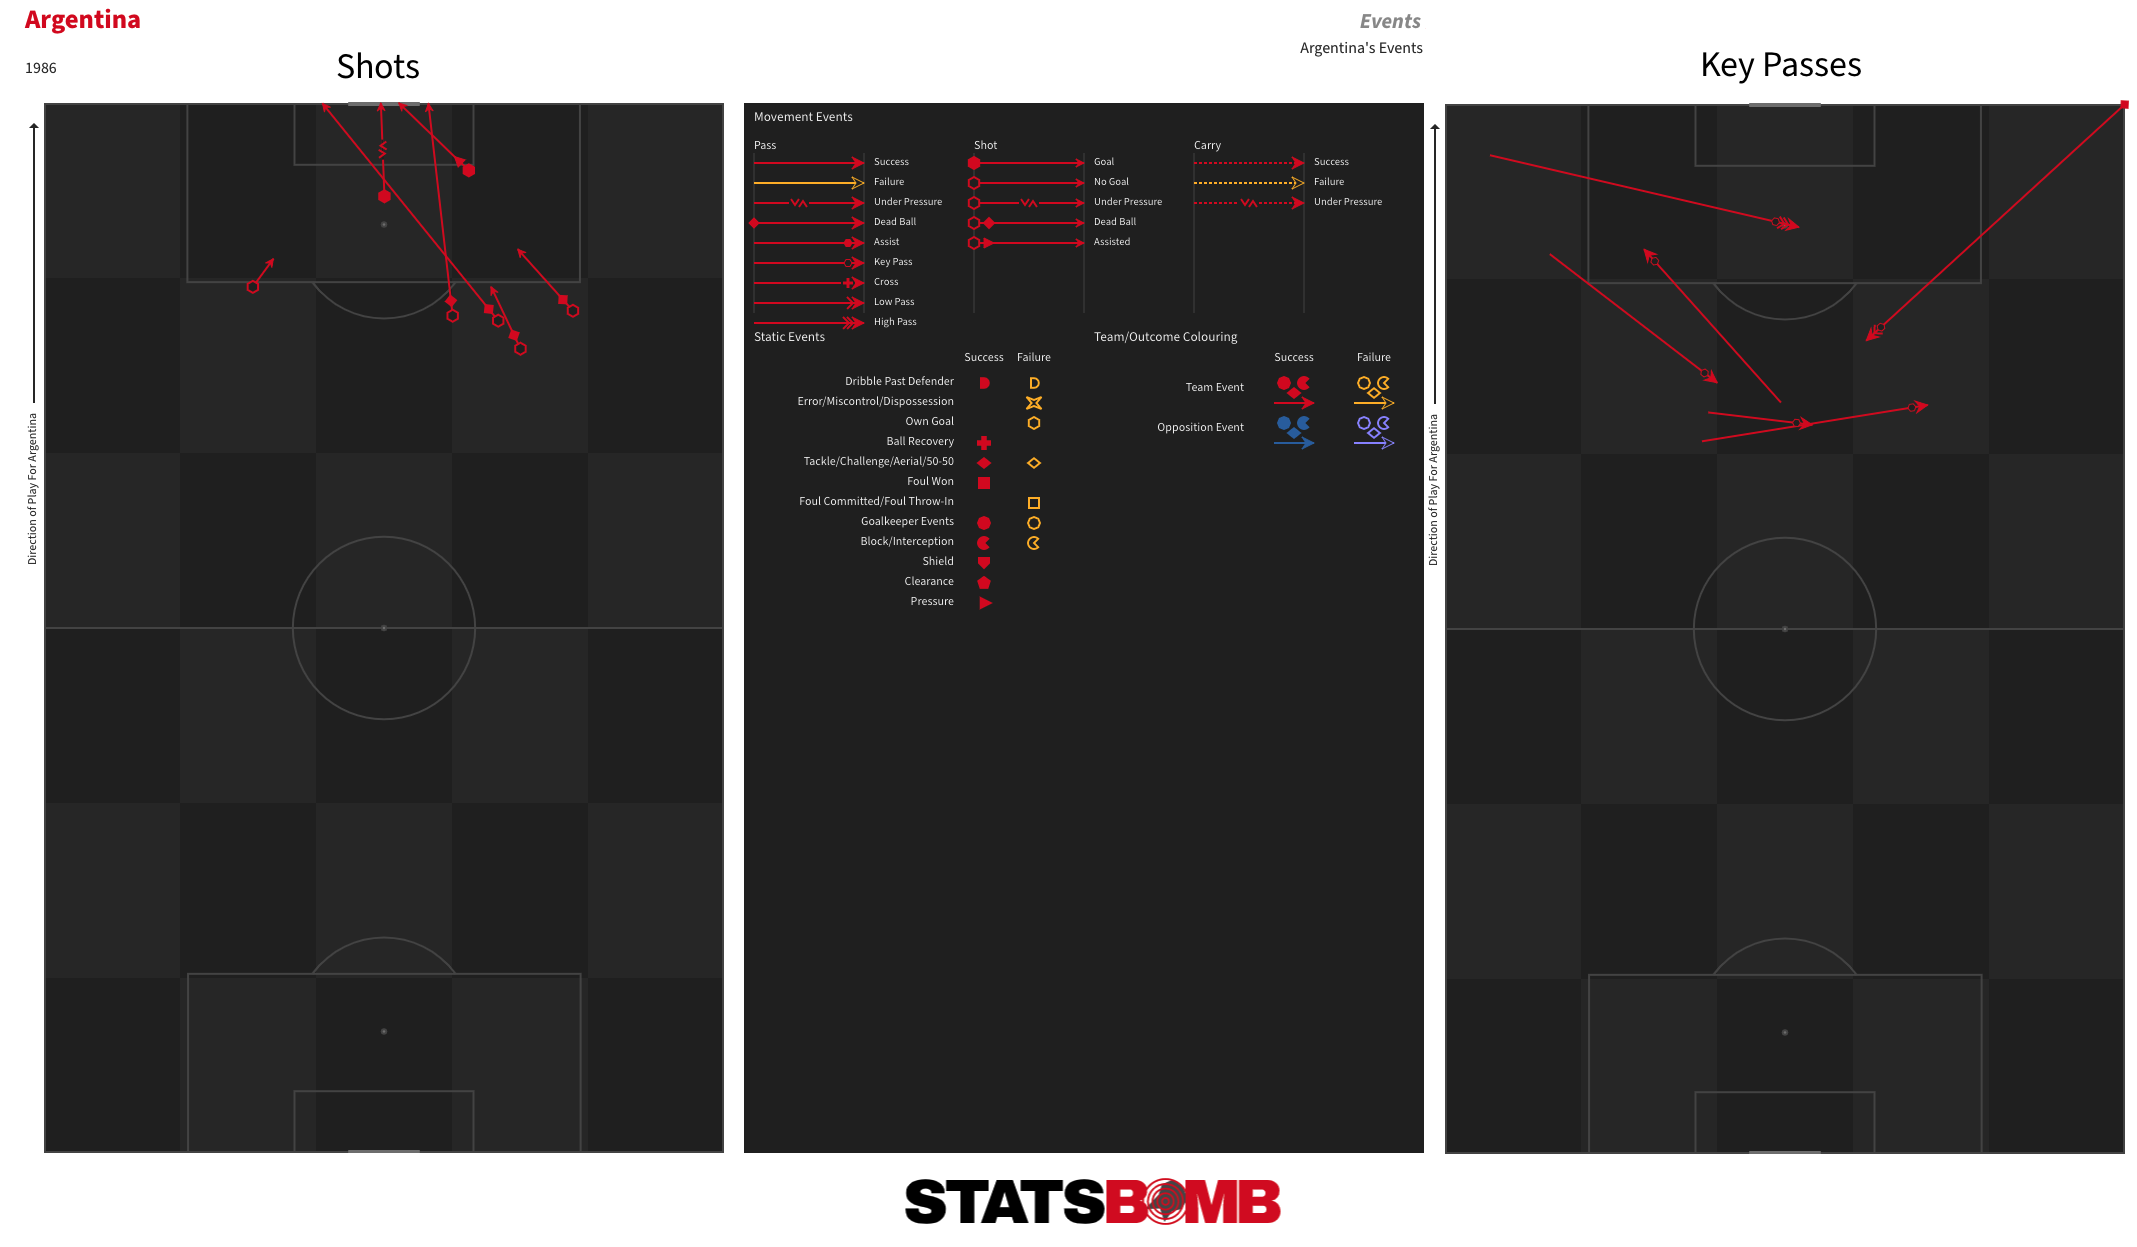
Perhaps no match epitomises peak-era Maradona more than Argentina’s 2-1 win over England in the quarter-final of the 1986 World Cup. Everything is there: the deceit, the trickery and above all, the outright brilliance. The narrative around Argentina’s triumph in this tournament has often been that Maradona dragged an otherwise ordinary team to victory. In the attacking sphere, at least, he certainly had an outsize influence. He scored or assisted nearly three-quarters of Argentina’s goals, and his dominance of their offensive output is clear in this match. Argentina had 15 shots, 13 of which were taken or assisted by Maradona.
Of course, he also scored the two goals that led them to victory. The first... well, you probably know how that went down. Notice the body part: Other.
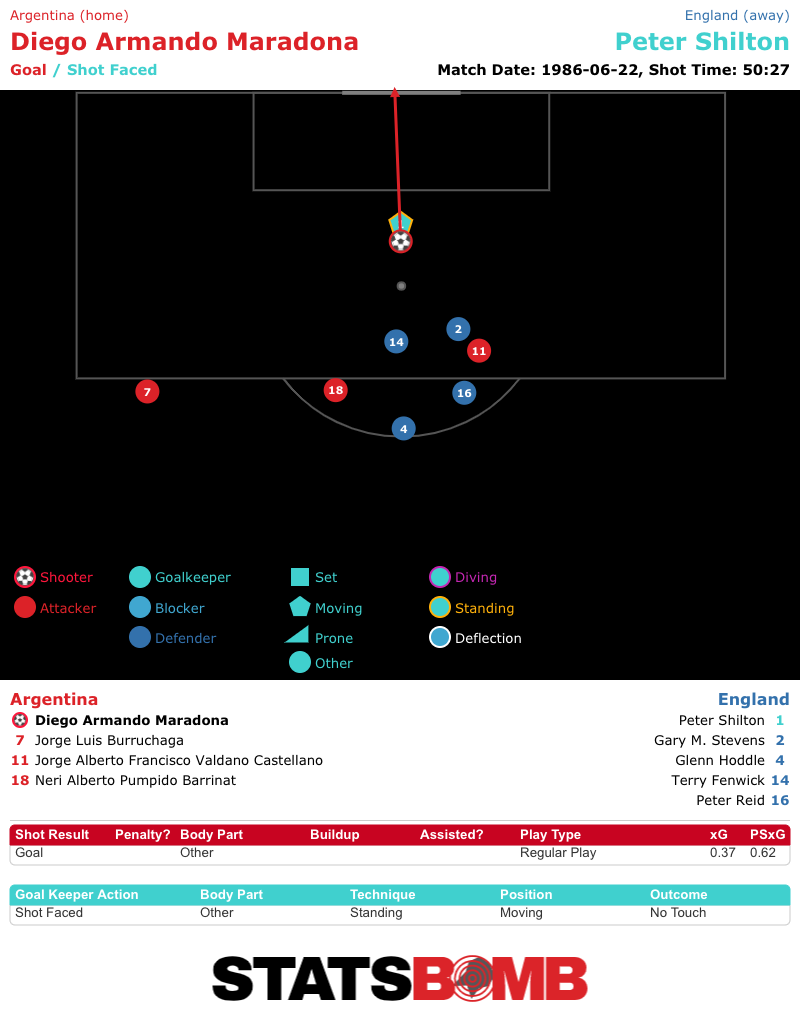
His second was one of the finest goals in the history of the sport.
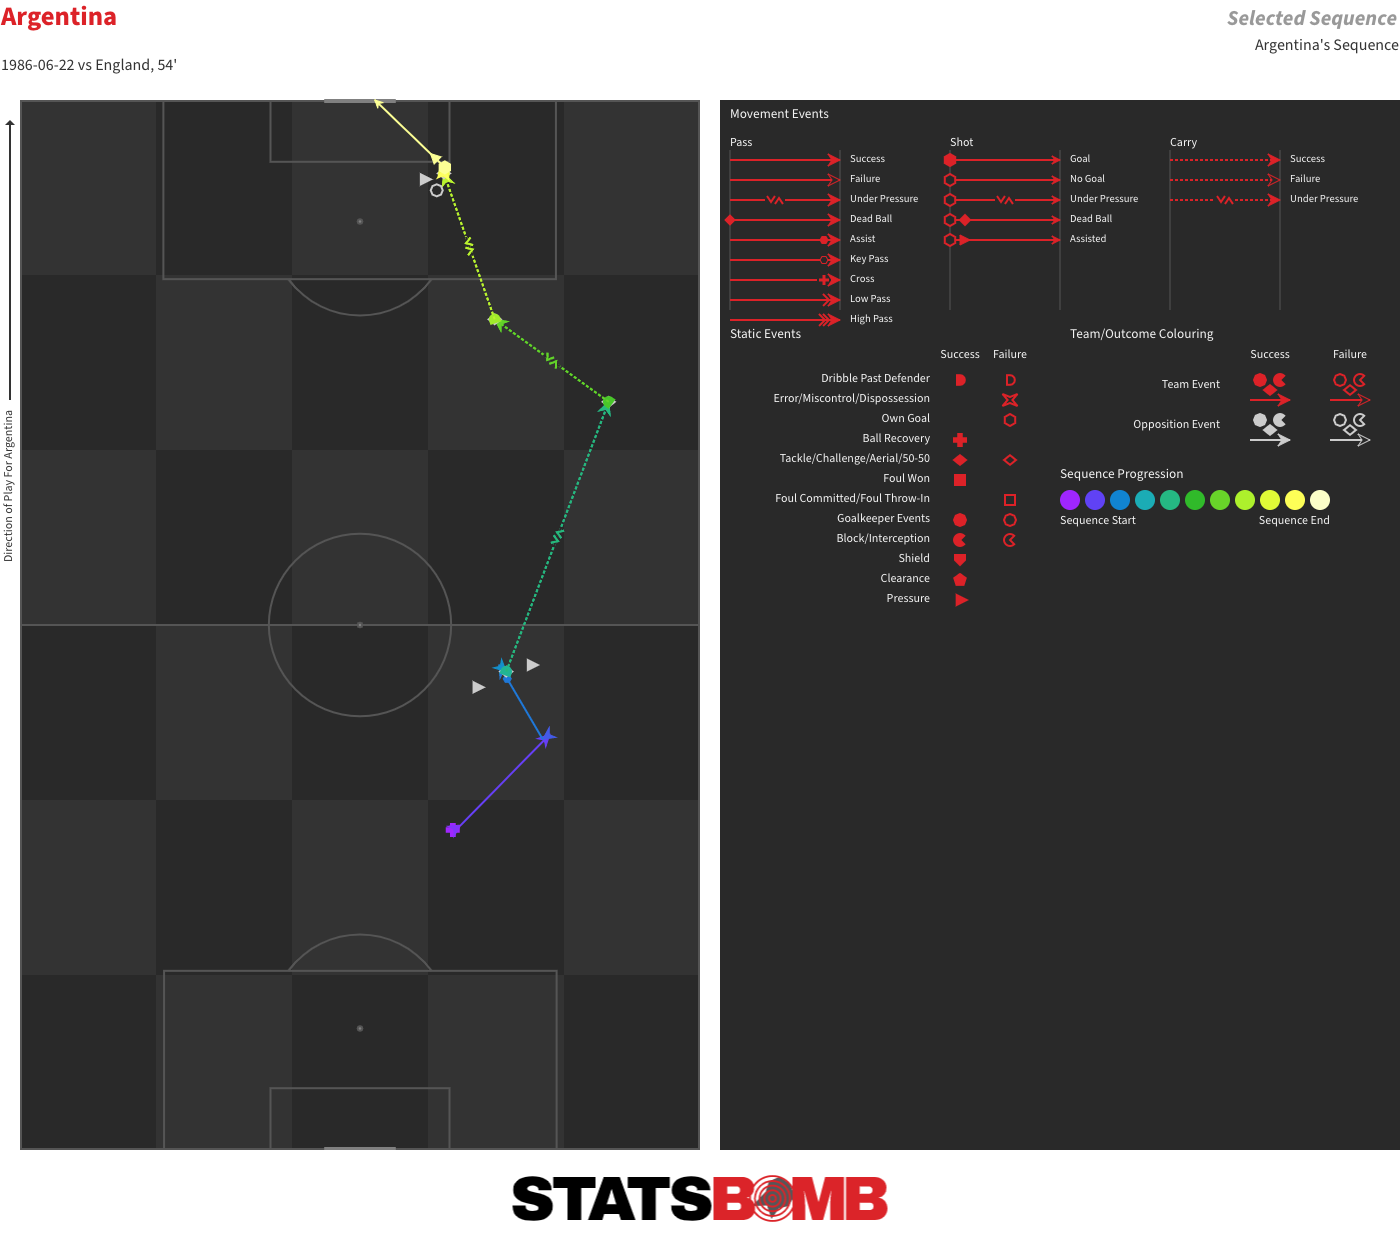
Maradona completed more successful dribbles (four) on the run leading to that goal than over 95% of current-day, big-five-league attacking midfielders and wingers do over the course of a full 90 minutes. On the day, he completed 12 of his 14 attempted dribbles. Whenever he picked up the ball and ran with it, England were unable to stop him.
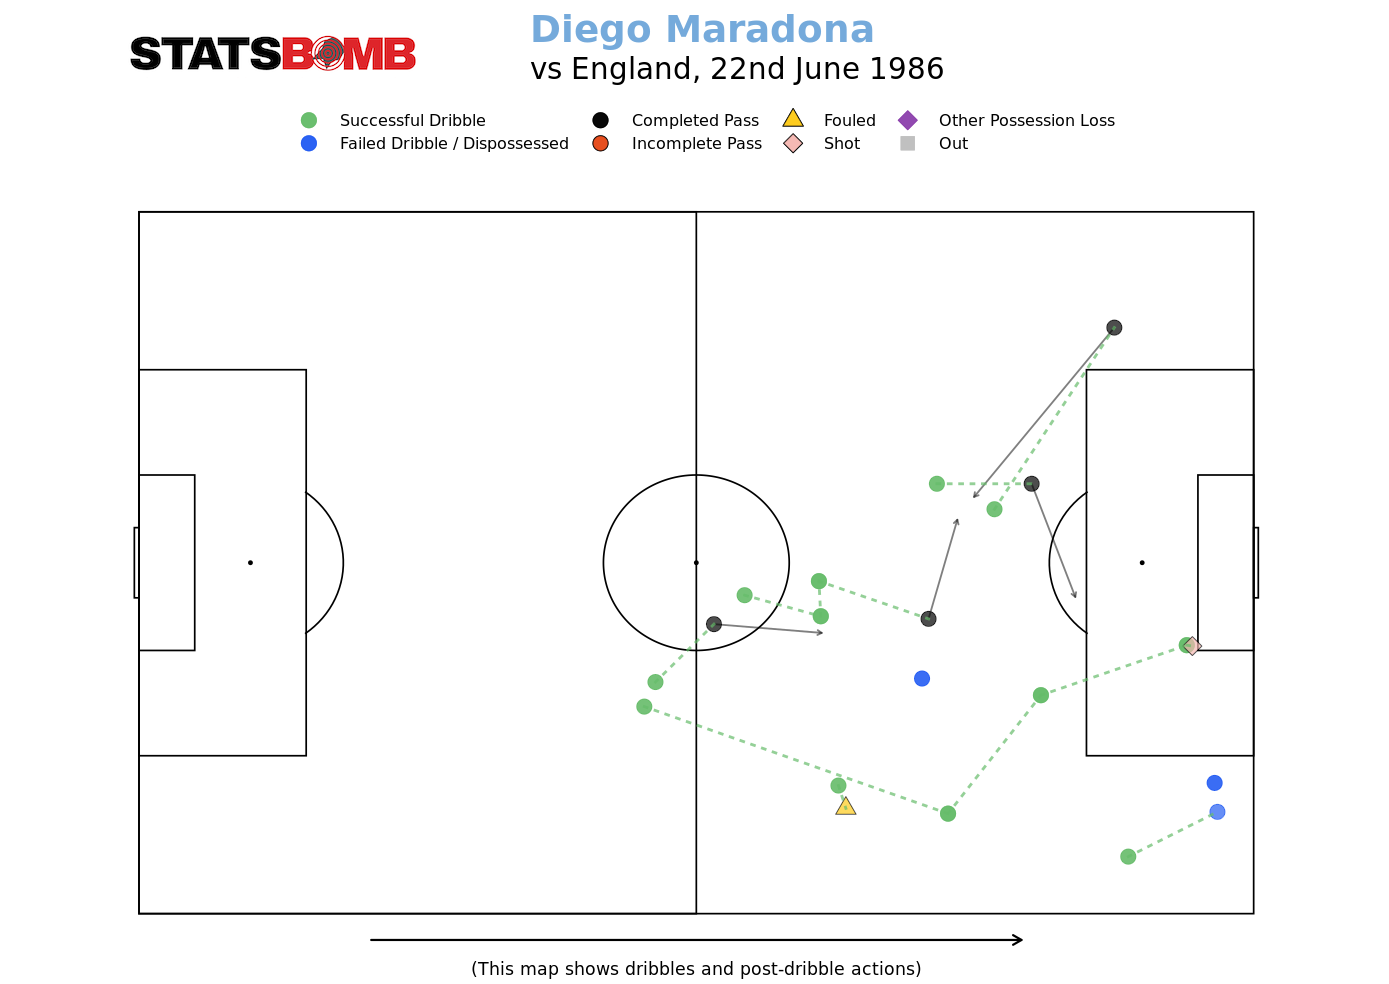
Maradona was relentlessly positive throughout, consistently seeking to move forward off the pass, dribble or carry. Not only did he provide pretty much all of Argentina’s attacking output, he was also the player who most often moved the ball into the final third.
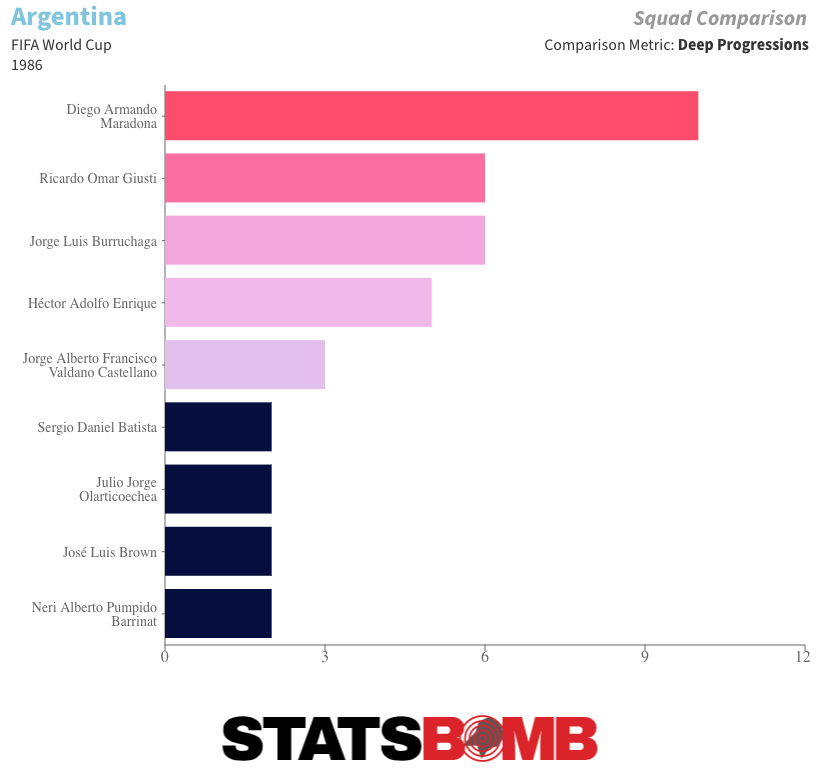
There were some good players on this Argentina team, many of whom were successful at a continental level in South America or had already or would soon earn moves to Europe. Coach Carlos Bilardo also introduced a neat formational quirk, switching to a 3-5-1-1 shape he had previously experimented with for the final three matches of the tournament.
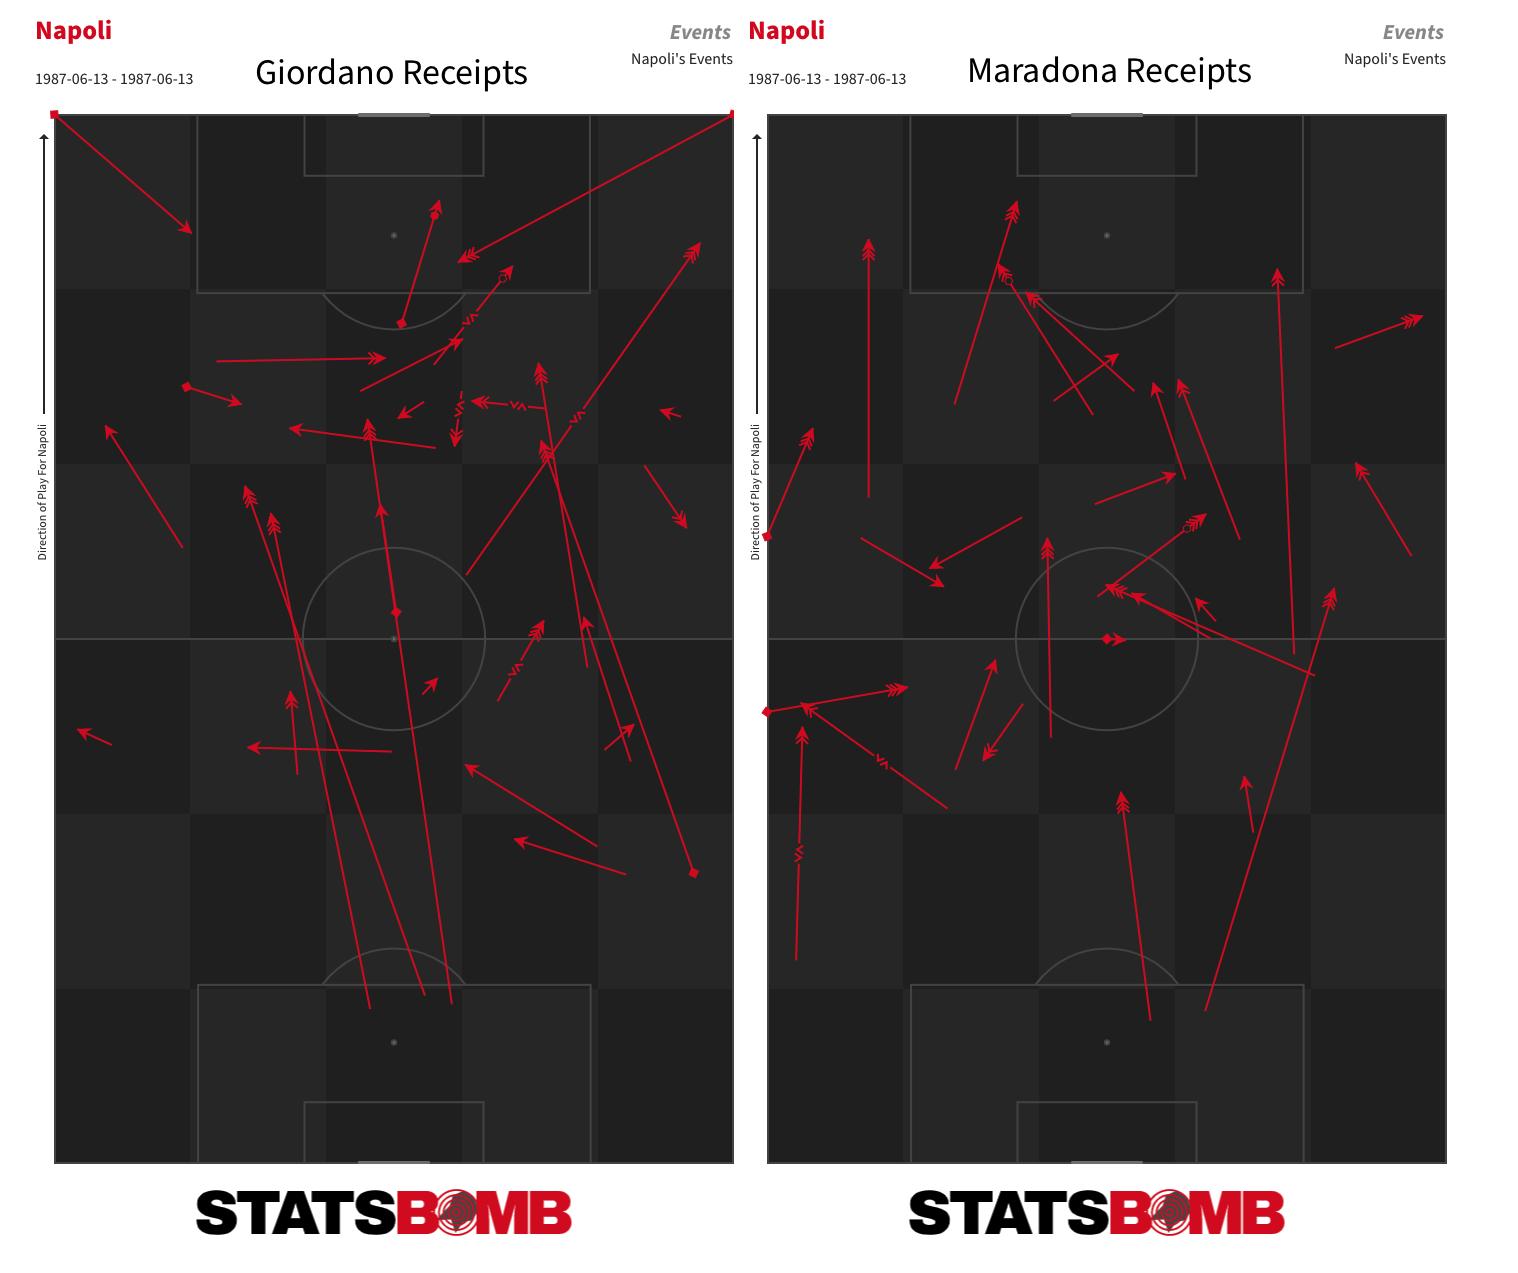
This will, though, always be remembered as Maradona’s World Cup. From the data we have available from this match, it is difficult to argue against the idea that he took on a greater than normal level of responsibility in this team -- a level of responsibility that is almost impossible to replicate in the hyper-active modern game. The second match in our system that falls within Maradona’s peak is the second leg of Napoli’s triumph over Atalanta in the final of the 1986/87 Coppa Italia -- one that confirmed their domestic double that season.
This is probably less representative than the England match. Napoli were already 3-0 up from the first leg, so there was little need for him to so aggressively carry the team on his back. Again, though, as with Jorge Valdano and Argentina, he benefits from having another forward alongside and ahead of him to act as both a primary reference point and an upfield runner. The large majority of the long central passes are aimed up to Bruno Giordano. The longer balls Maradona receives are into the channels, and he otherwise involves himself where he fancies, instead of being limited to a fixed starting point.
Mature Maradona
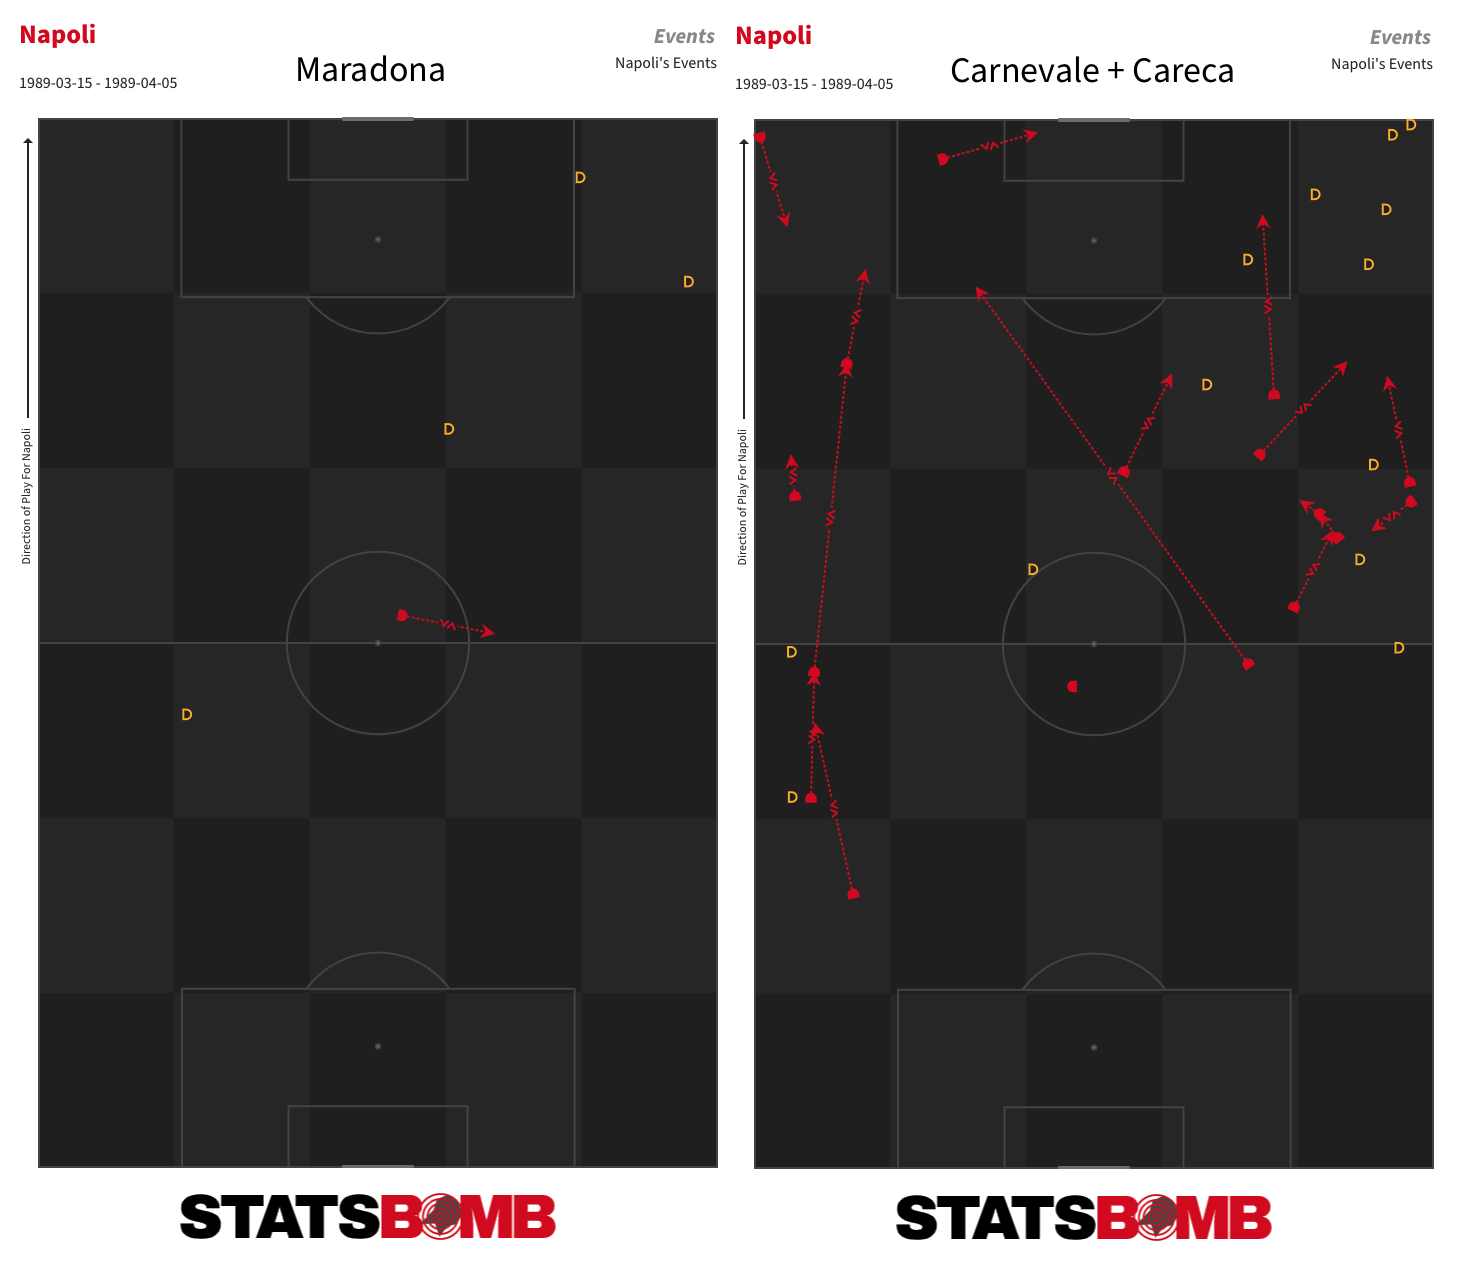
The final two matches we have recorded are both from Napoli’s successful campaign in the 1989 UEFA Cup: the 3-0 win over Juventus in the second leg of their quarter-final and the 2-0 victory over Bayern Munich in the first of their semi-final. Maradona is only 28 at this point but arguably just 18 or so months away from the end of his serious top-level career.
They display a Maradona who is still decisive but in a different way. He is much less reliant on his dribbling. After 12 attempted dribbles and seven successful ones for Barcelona against Athletic in 1984 and his bumper load against England two years later, he attempts only five dribbles and completes just one in these two matches in 1989. Andrea Carnevale and Careca do the majority of the dribbling on this Napoli side.
That isn’t to say that Maradona wasn’t still capable of game-changing dribbles, as his solo run to set up Claudio Cannigia for Argentina’s late winner against Brazil in the last 16 of the following year’s World Cup would attest, but he had certainly begun to ration them.
This later stage Maradona is much more likely to combine with teammates to advance upfield. Across 1984 and 1986 his ratio of passes to dribbles and carries fell in a range between 32 and 34%; across these two 1989 matches, it has increased significantly to 51.03%. He receives the ball more frequently in deeper areas.
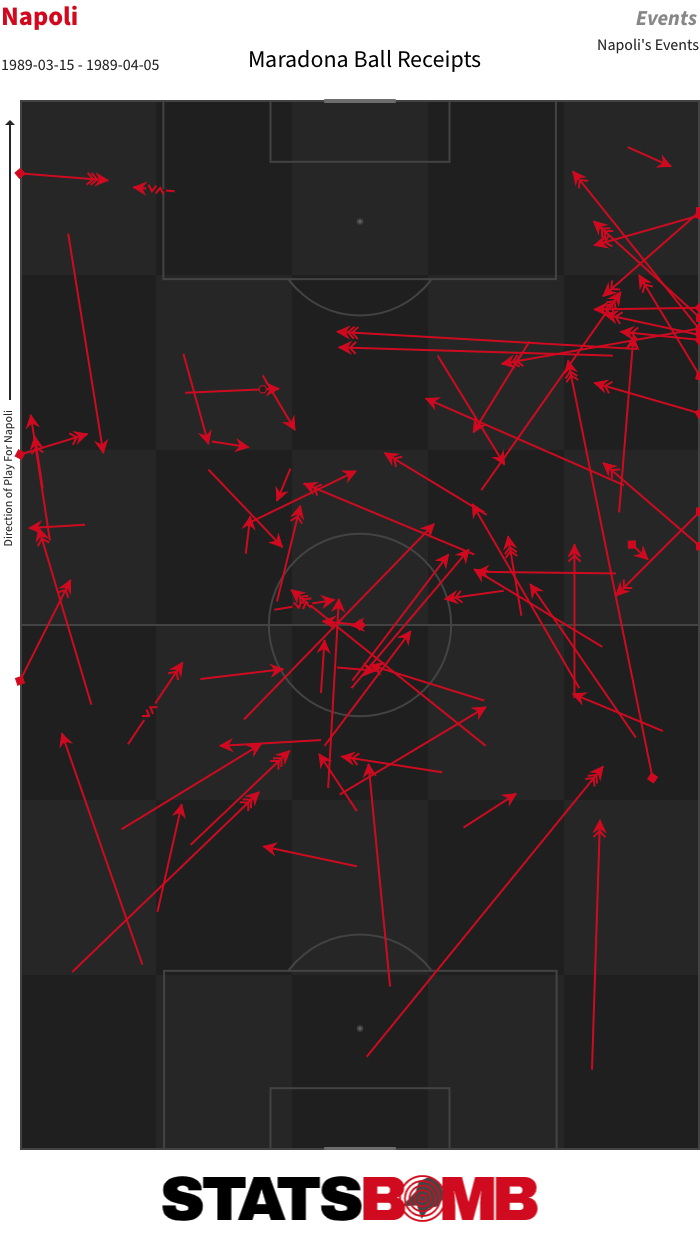
We see a Maradona whose output has tilted towards ball progression and chance creation. No one moves the ball into the final third more often or creates more chances for teammates than he does over these two matches. While he does take five non-penalty shots, joint second on the team, they are all from speculative positions, and he only twice touches the ball inside the penalty area over the course of the two matches.
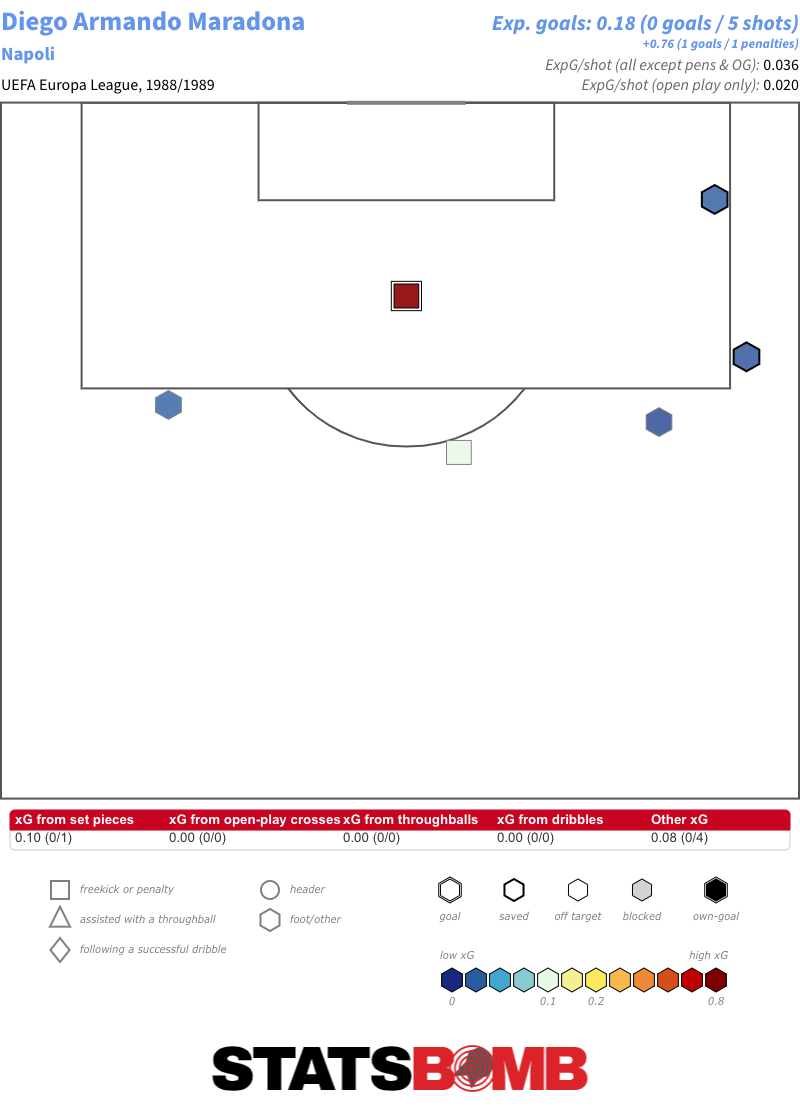
Careca and Carnevale both accumulate far higher expected goals (xG) totals.
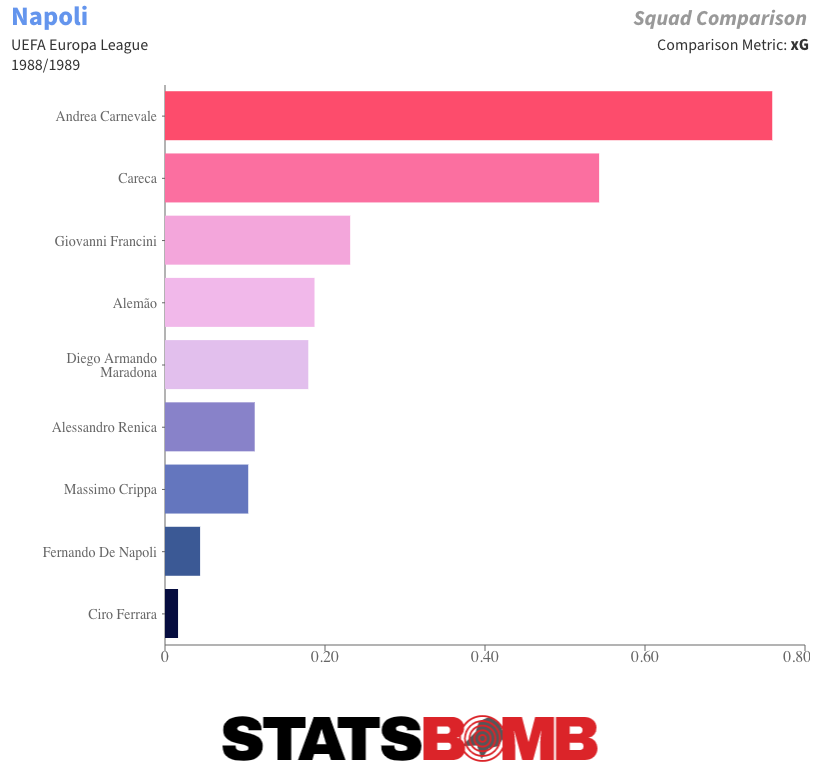
Maradona had been the club’s top scorer in each of his first four seasons at Napoli. In this campaign, Careca took that honour, with more than double Maradona’s total, while Carnevale also scored four more than Maradona’s sum of nine. It is, though, worth mentioning that the following season, in which Napoli claimed their second and last league title with Maradona, he returned to the top of the scoring charts.
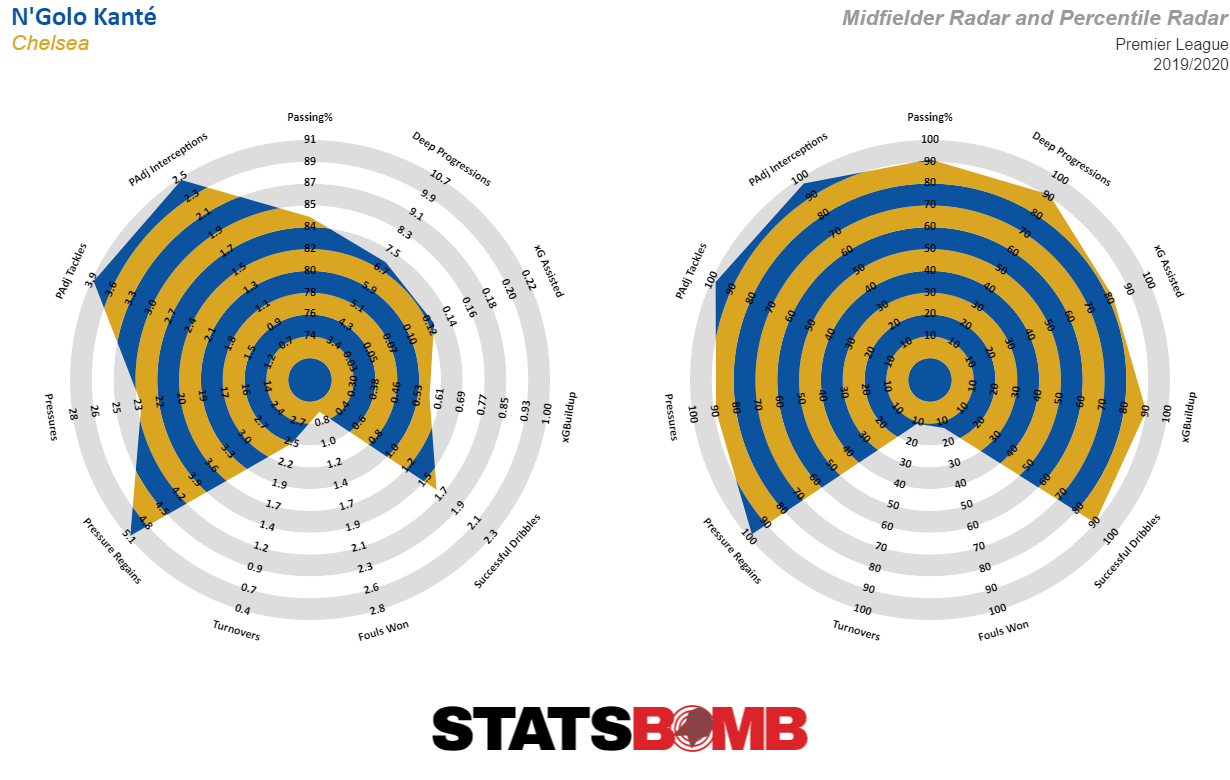
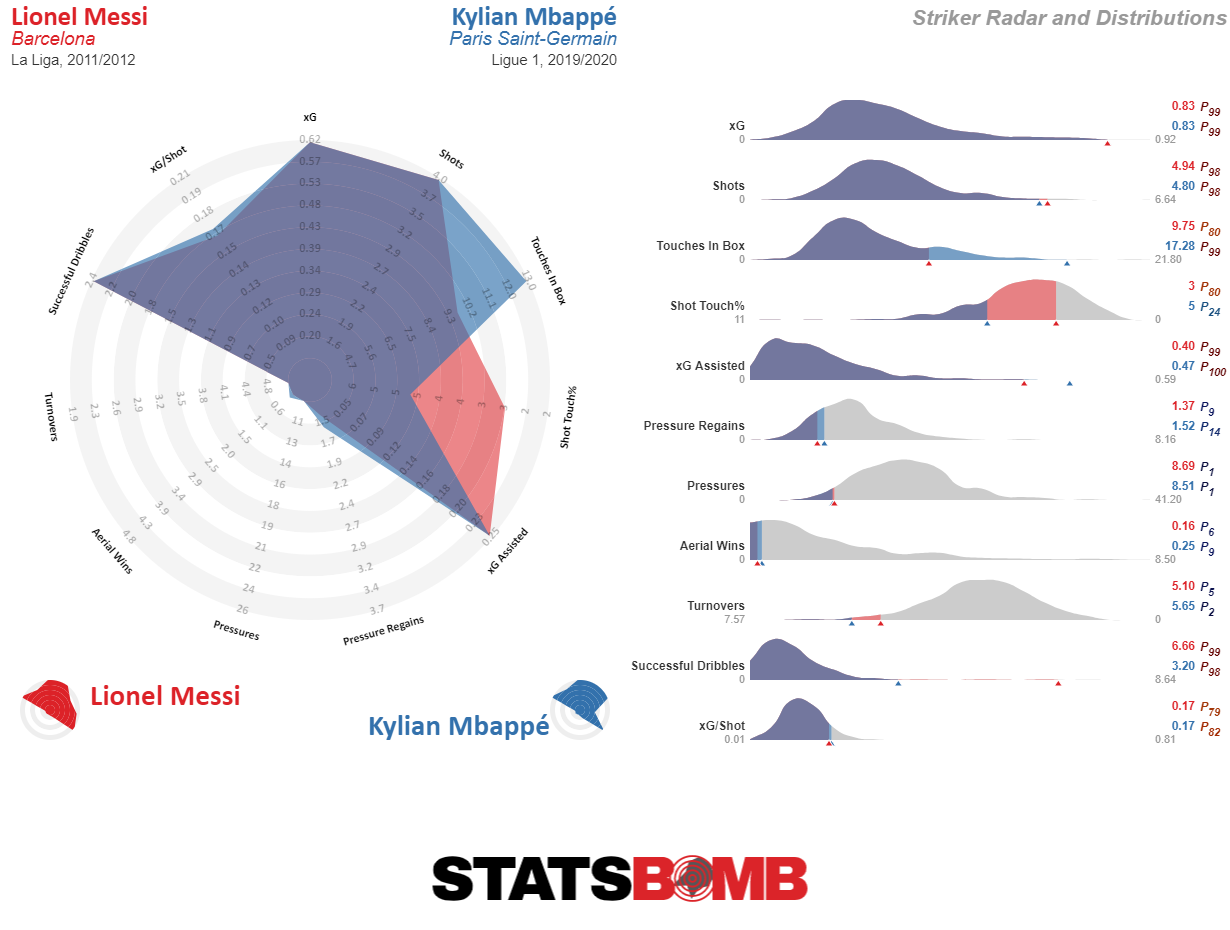
At StatsBomb, radars are our iconic way of visualising player and team stats. There has been a ton of development and research put into them since 2014, and if you are interested, you can read about various updates here and here.These days they are seemingly ubiquitous in the football landscape.
However, we know that radars are not the only way to visualise data. Radars are actually quite good at serving their purpose, but StatsBomb IQ is mature enough to deliver other options. Today’s StatsBomb IQ updates did the following:
1. Update radar position specific stat boundaries with new data from the past year.
2. Add percentile radars as a visualisation option.
3. Update the information provided on radars into a new panel.
4. Add distributions as a visualisation with many different options for use cases. (Which I will explain in detail below.)
5. Comparisons happen in the radar screen now rather than saving to compare -> going somewhere else. We feel this offers a cleaner UI than what we had before.
6. Using distributions you can now explore team and player stats as percentiles in the league pages.
We wanted to release these updates to allow customers to become comfortable with the changes and new features before moving to the next step of the Customisation project. That step will allow customers to build their own templates for radars and distributions from scratch, which is probably the most requested new functionality we have had.
First things first though…
Template Boundaries Have Been Updated
We update these about once a year as more data comes into the system. They remain based on positional populations for each stat in the big 5 leagues across multiple seasons. However...
New Positional Population Distributions
One element we are working on is creating new population distributions to compare against. In our email to customers, we explained that they should read the detailed WARNING included on the website before making changes to the distribution settings.
And then, as if by magic, we proved exactly WHY you would want to be careful messing with the default settings ourselves by accidentally including all the historic La Liga data we collected for the Messi Data Biography in with the default population calculations.
The problem? Those league seasons only include games from Barcelona, where they are typically trouncing 19 other opponents, and nothing else. Barcelona and the 19 cream puffs then made their way into the team data set, where for some reason defensive stats went kind of crazy as 13 * 20 additional funhouse mirror La Liga seasons were included in the population. It was now weirdly normal for teams to concede 3 xG a match on the defensive side of the ball.
So uh… we’re fixing that bug ASAP.
And thanks Messi!
Percentile Radars
In addition to normal stat radars, you can now choose to show stats as percentiles for the position. This gets rid of the 5%/95% cutoffs from the normal templates and replaces calculated stats with percentiles for the entire population of output at that position. Depending on your use case, these may be strictly better ways to display player skill sets than the traditional value radars.
Information Display Updates
We have changed how we display information quite a bit with this update. The new table contains the basic statistical output per 90 as well as the percentile for that stat.
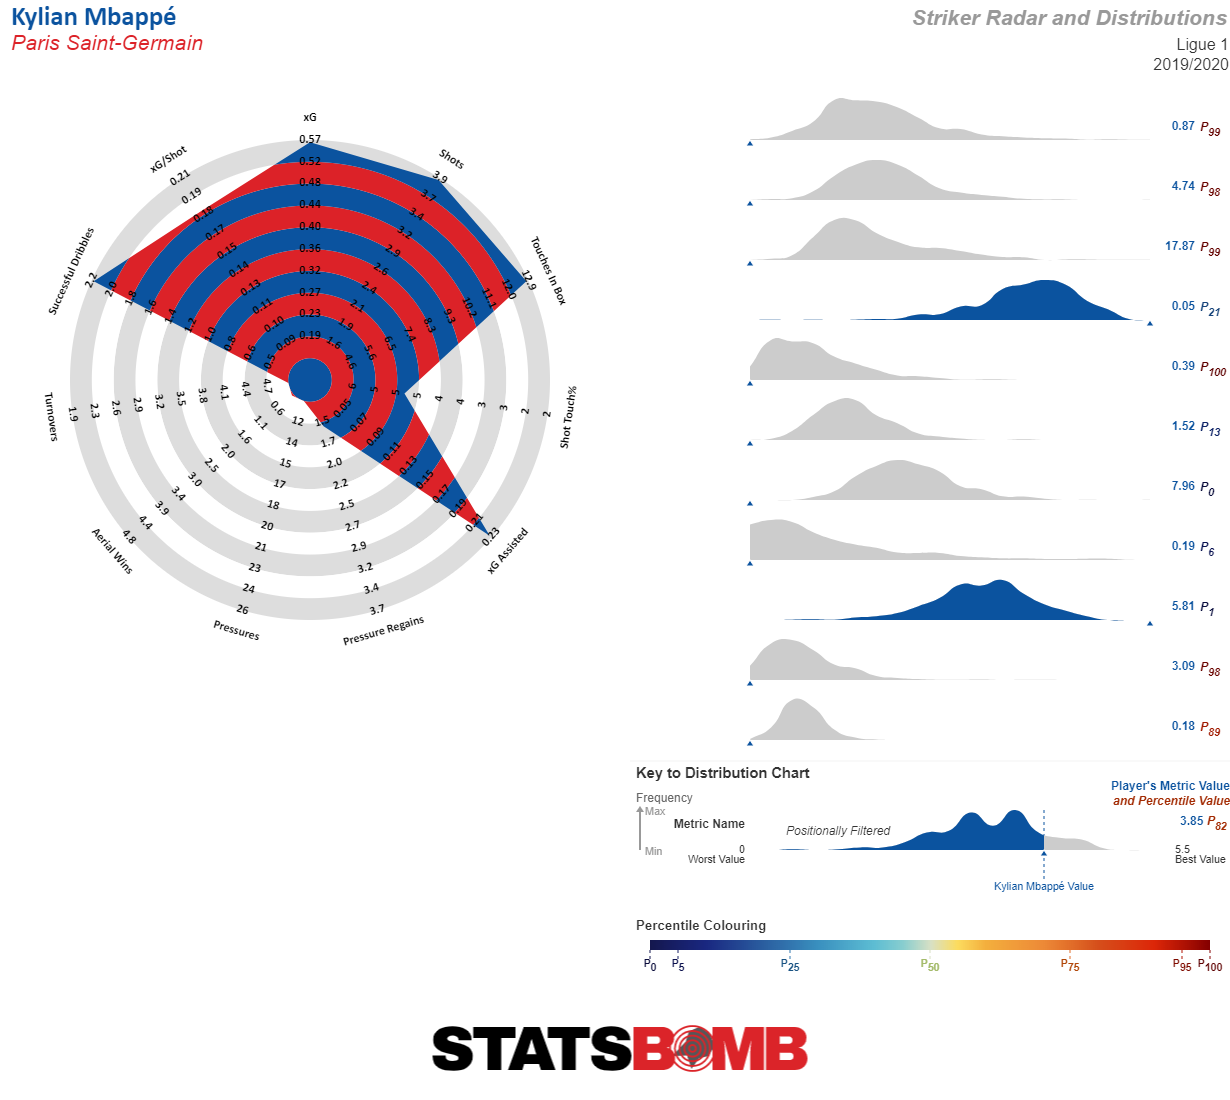
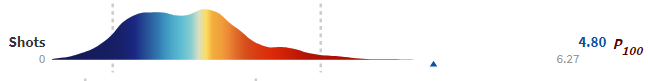
New Display Option: Distributions
I have wanted to add non-radar, sciency ways to display player and team data for a long time. We researched (actually, I say we, but Nat James did most of the work on this) and tested a variety of potential options and these were the ones we felt matched what we wanted to accomplish in terms of information display and statistical precision.
They also have a number of selectable display options under “Distribution” on the left hand menu. We’ll work through each option and the use case below.
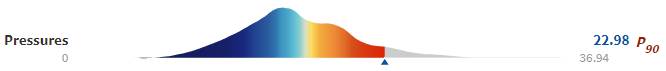
Plot Type: Area/Violin
Area is selected by default. Violin mirrors the area plot.
Distribution Displayed: Positionally Filtered/Any Position/Both
In the distro plots, we allow you to choose your options. Positionally filtered cuts the distribution of that stat to only players who have played significant minutes at that position. Any Position shows the distribution of that stat for all players.
Both… this is where things get a bit more complicated. If you have Area chosen for Plot Type, then choosing Both here displays the full population distribution as a dotted line.

However, if you have Violins for plot type, the top distribution will show the position filtered distro and the bottom one will show the full population.
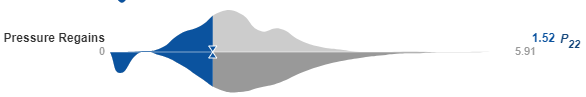
Distribution Colouring: Radar Colours/Percentile Gradient/Metric Distinction
These are just preferences for how to colour the distros. Percentile Gradient offers some colour clarity to what percentile a player comes in at, but those values are also contained at the end of the vis.
Template Limits: Not Displayed/Dotted/Notches
In case you want to keep some grounding to the old radar style, you can choose to add either Dotted marks at the 5%/95% boundary of the population or you can add notches for each part of that distribution.
Comparison UI
Comparisons now happen on the front page. There is a drop down that loads your favourites for comparisons, or you can type to search for new ones. On any radar, clicking the star in the top left will add a new favourite. These can then be managed under the favourites menu that loads when you click the person icon in the top right of the IQ screen.
Both radars and distributions now offer overlays for comparing players and teams.
It's a big update to our platform and one where explaining the design choices and showing the new vis doesn't really encompass how much new stuff there is for customers to explore. And, as noted earlier, this is the first phase in a multi-phase release that will allow customers massive customisation options in how they choose to visualise and analyses information in StatsBomb IQ.
Thanks for listening!
--Ted Knutson CEO, StatsBomb