I've been monitoring Southampton's underlying numbers this year and I was disappointed that they failed to annihilate Villa as any boost from that game would have sugar-coated their already historically impressive totals. As it is, it's possible to show that they have had a start to the season that ranks very high in the pantheon of 'Great Starts to the Season' as recorded in the 'Enlightened Stat Era' (2009-now). This era is defined as such because it covers the public availability of shooting numbers that can be built into metrics that are highly insightful & which can also be toyed with to create weird mini-stats that show that what Southampton have done is indeed extraordinary.
Factor in the pre-season predictions of demise (guilty!), the wholesale personnel changes & the size of the club when compared against other teams that have made outstanding & blistering starts and their achievement gathers even more credence.
But what achievement? Good point. Starting a season well has little meaning unless it can translate into a tangible return at the end of a season so what chance they retain their position in the upper echelon of the league & usurp a more established visitor to the top 4?
Of course the key point against what they have achieved so far is their schedule which has meant they have avoided all but Liverpool & Tottenham of last season's top 7. They lost to both.
For this article the seasons referenced above have been used (09-14) and that denotes 120 team starts of 12 games.
Total Shot Ratio (TSR)
- Southampton rank 9th/120 with 63%
- 7 of the top 9 went on to finish in the top 4 that season
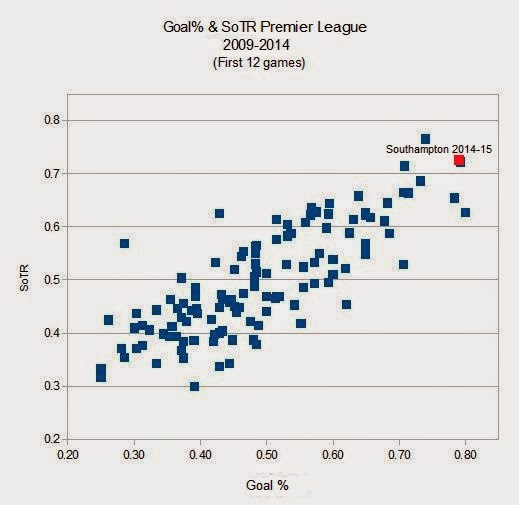
Shot on Target Ratio (SoTR), SoT+/- and Goal Ratio
- 2nd/120 SoTR with 72%
- Of all these extra metrics, this (and the related 'Shots on Target +/-') are most predictive towards final points & position. After 12 games it is comparative in predictive power to 'Goals For' and only behind 'Wins' & 'Goal Difference'
We can see how this impressive SoTR has translated into an equally impressive goal % & that historically, it stands very highly:
Similarly the shots on target +/- figure is historically high:
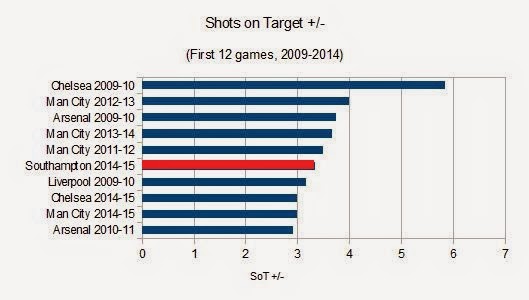
Of the teams on this chart, only Liverpool 09/10 did not finish top 4. We can also see here that despite varying media perceptions of Man City & Chelsea this year, they rate identically on this metric.
Shots, goals against & saves
Whilst Southampton's goals total is impressive, to some degree it has been enhanced the the 8-0 romp against Sunderland. There is some mileage here though; teams averaging 2.0 goals per game or better at this point have qualified for the top 4 on the last 15/18 occasions. Their shots for totals are no better than average; indeed they rate only 8th in the league here. Where they really impress is at the other end of the pitch. Defensively they are putting up extraordinary numbers, something that can be highlighted by this little nugget; they have conceded 4 shots on target in their last 5 games.
- Shots against: 1st/120 (Arsenal 2014/15 also score extremely well here)
- Shots on target against: 1st/120
And these figures are powering this:
- Goals against: 2nd/120
- Saves (low): 2nd/120
Save %
Not only are they effective at minimising opposition efforts, they've also been good at repelling those that do get through. Their save percentage is not historically significant, but nonetheless leads the league this year.
Shooting Accuracy
Or, the percentage of shots on target in relation to shots.
- For: 9th/120 (Swansea & Chelsea are also historically high)
- Against: 6th/120 (Stoke are 1st/120 here)
Both solid numbers, but the key component here is the relationship between the two and is arguably Southampton's most impressive/least sustainable stat. This cake can be cut a few ways, but I've just represented the difference between the raw percentages:
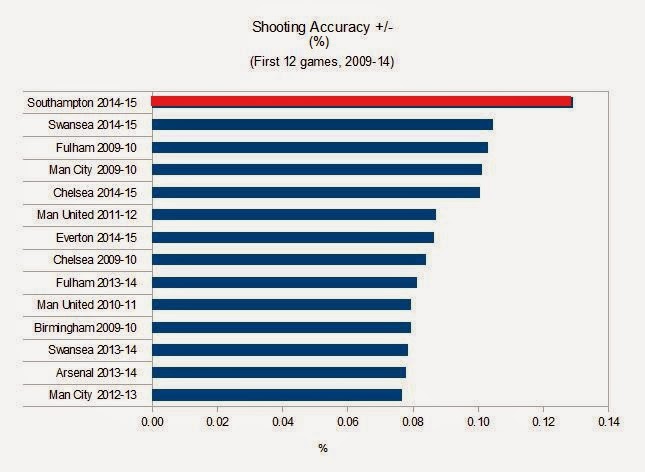
To score 13% where the previous high is about 10% is a noticable outlier & whilst the stat isn't particularly predictive, it can reasonably be assumed that the ability of Southampton to restrict their opposition's shooting accuracy in relation to their own will reduce as the season progresses. Indeed, a seasonal high for this figure is only 8%. Somewhere along the line 5 points will most likely disappear.
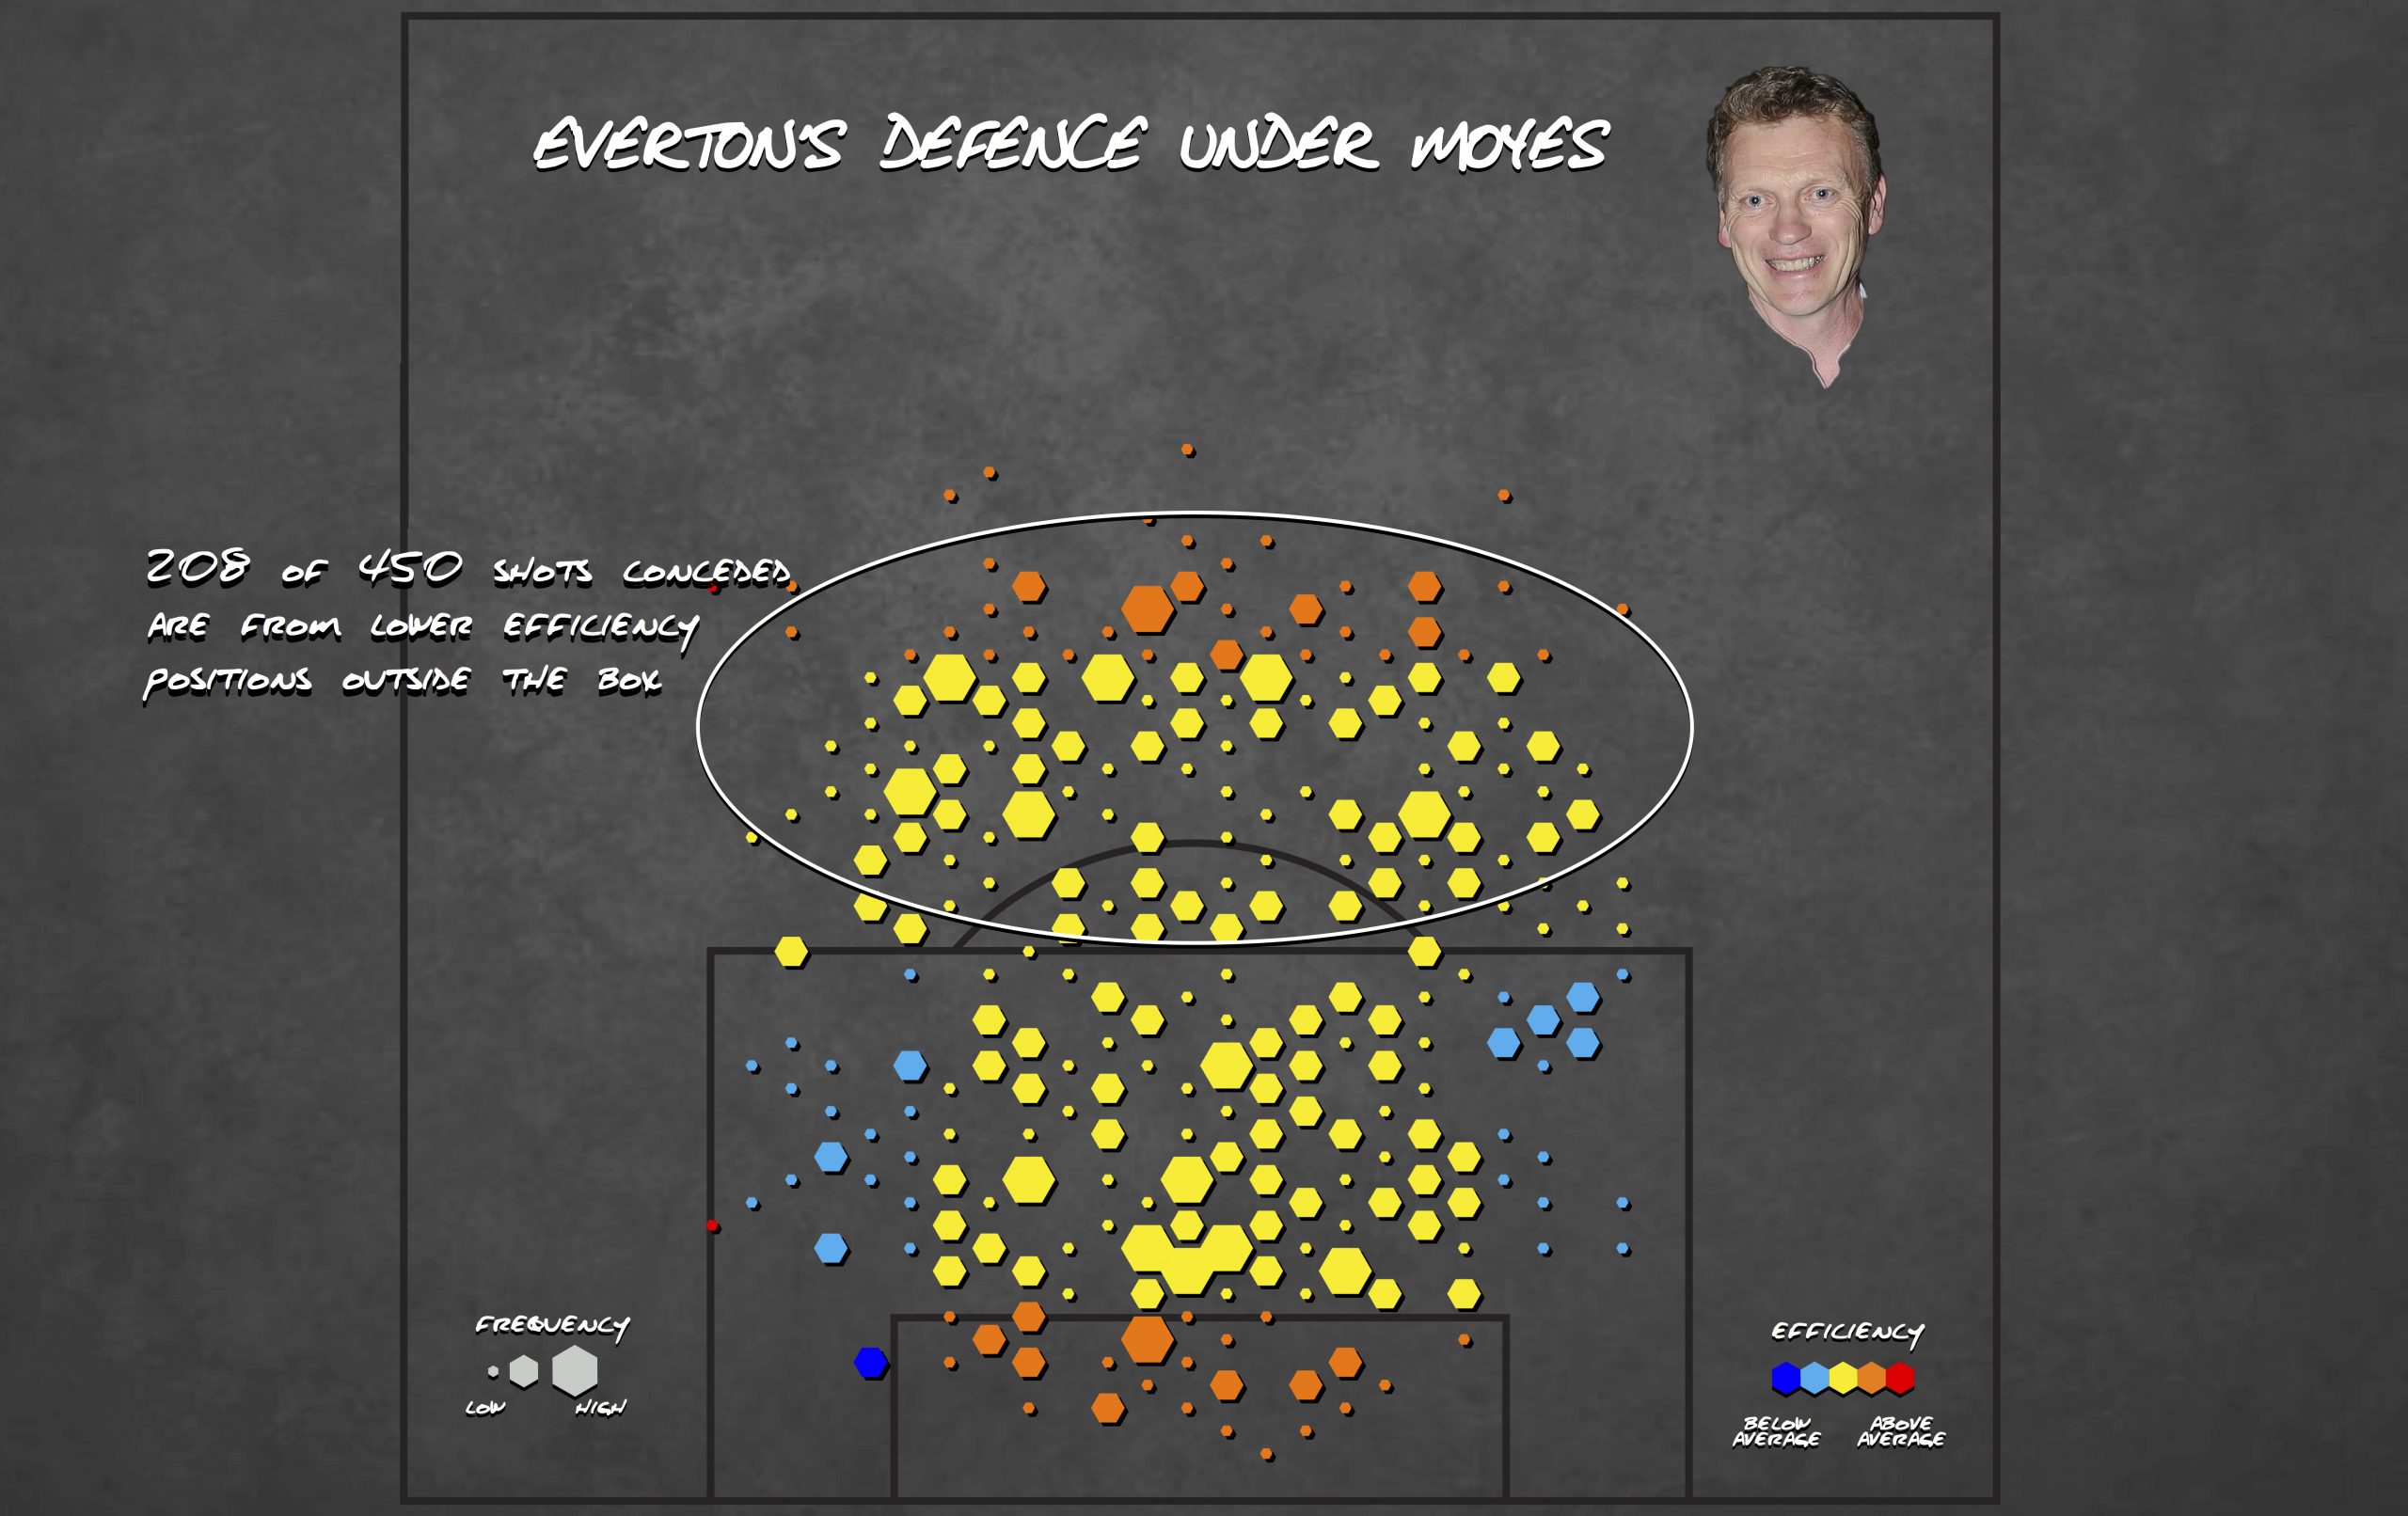
As we can also see, Swansea, Chelsea & Everton are all scoring above seasonal expected levels here.
Conversion rates
Simple shots to goals percentages:
- For: 8th/120 (Swansea, Palace (!) & Chelsea also riding high)
- Against: 2nd/120
- +/-: 2nd/120
There are 8 percentage points difference between the for and against totals (14% & 6%). In the course of the sample, the only teams to break 6 percentage points over an entire season are three Alex Ferguson teams & Man Utd & Man City occupy 8/9 slots above 5 percentage points. The other team is Brendan Rodgers' Suarez fuelled 2013-14 squad. Overall, these numbers appear to lack league-wide predictive quality but seem to represent the very good and the very bad at their extremities. Could this Southampton team join this list of good & great teams?
The near future
...is tricky, but there is some hope that Southampton can retain their high position in the short to medium term:
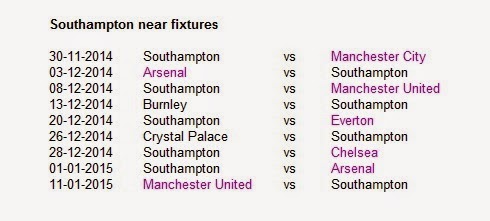
They have been particularly good at home, winning 5/6 and conceding only one goal & five of their 'tough' matches are at home. Throw in winnable matches at Burnley and Palace & there's can be a genuine expectation that whilst their impressive numbers will almost certainly regress somewhat, there is clear scope to continue to pick up a good points return. There are some precedents that suggest that what they have already done stands them in excellent stead towards the top 4:
- The last 25 teams with +10 goal difference after 12 games finished the season in the Top 4. Portsmouth failed in '07-08. Southampton are currently +18.
- The last time a team in Top 3 after 12 games finished out of the top 4 was 2007/8.
- The top 16/17 Goal Ratio teams after 12 games finished 4th or above. Southampton rank 2nd here & the only team not to finish top 4 was... Southampton 2013-14.
- 8 wins after 12 games? 9/9 top 4.
Problems & Top 4?
Southampton lack a deep squad and have been relatively fortunate with injuries thus far. A series of quick games against tough opposition may well test their player resources and with key contributors throughout the first team, any succession of injuries will noticeably weaken them.
A significant proportion of their current success has centred around their defensive abilities & the Villa match was the first in which they committed a defensive error that led to a goal; and a loss of two points. We can praise Koeman for instilling an effective defensive strategy & mindset thus far but having spent very little time in a losing position, their tenacity when under pressure has rarely been tested. This will surely change as we go through December.
They have twice scored as a result of instantly returning terrible goalkeeper clearances. This kind of goal is scarce & that they've benefited twice is a subtle indicator of how their season has progressed with a degree of charm. Similarly, the generosity shown by Sunderland's defence has provided a notable massage to their attacking figures, some of which are not historically impressive. Removed from analysis, their goals for is a much less impressive 1.3 per game and you lose 4 points from conversion. Suddenly: not so impressive.
Despite these issues, I personally feel that it's worth taking a positive view of what has been achieved. The betting markets give them around a 2/1 chance of qualifying for the top 4 and that, as I think I've shown, is not ungenerous. Indeed anyone who has availed themselves of higher odds can be well pleased with their current position.