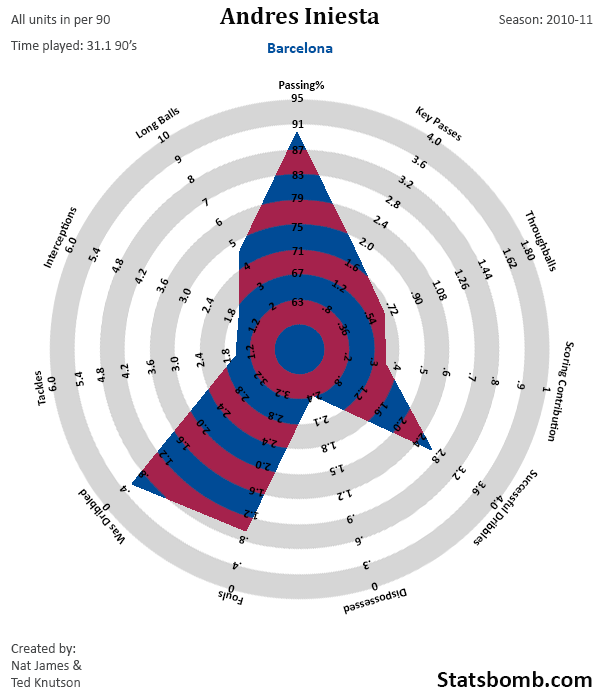
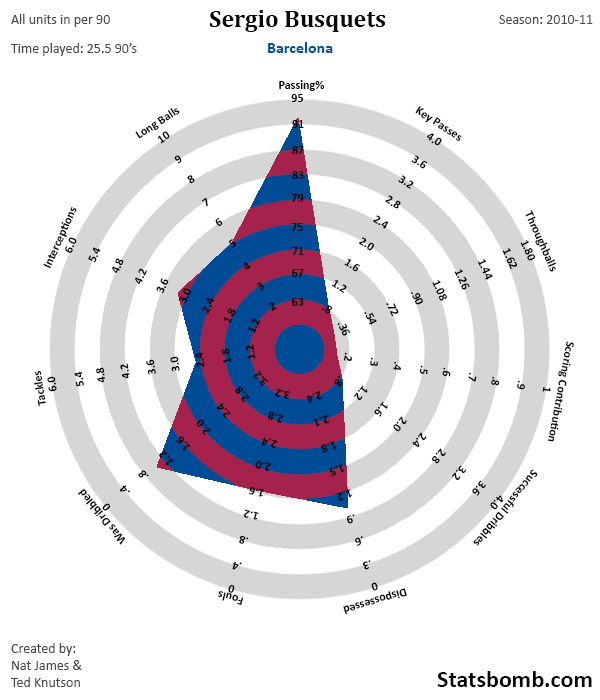
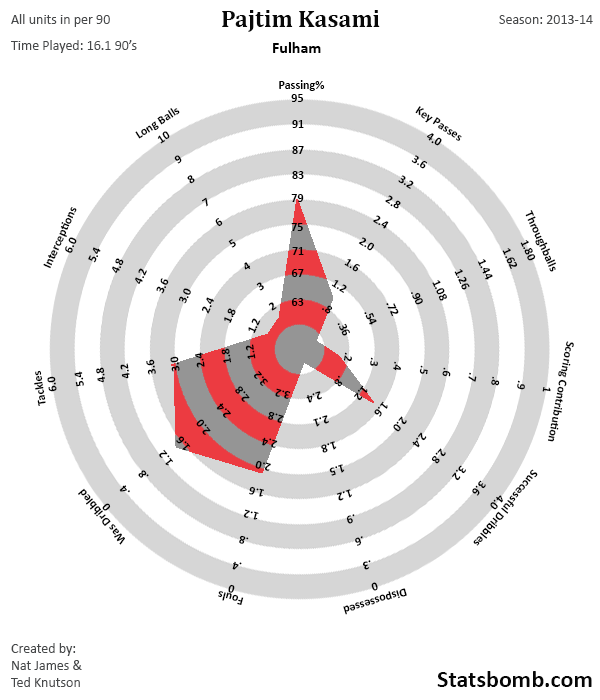
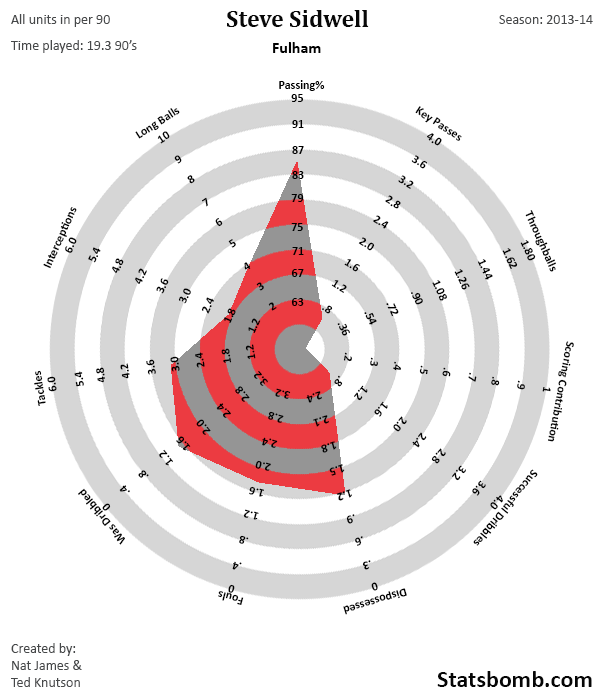
I should probably preface this with an apology. Dear Fulham Fans, I am so sorry. --Knutson Okay, now that that's out of the way, we can get down to business. One of the things I have been doing lately is creating all sorts of radar charts to examine and compare player stats. Many people seem to like these. Some analysts have complained about certain elements (and there are notable weaknesses), but in general, I still think they are highly useful and add a level of approachability that you just don’t get from posting numbers. Anyway, almost immediately after I released the first midfielder charts into the world, I wondered if we could use the overlays to compared coverage of entire midfields. I was not the only one, since a number of smart people also popped up that same day asking the same question. That’s what we’re going to test out today. Because I don’t know if this idea will work, we’re going to start out by testing some extremes. Like say, one of the greatest midfields of all time… versus this year’s Fulham. Whee! Barcelona 2010-11 I’m just posting the overlays here up top, but for those of you who want to see each player’s radar, I have added an appendix down at the bottom so that you can go nuts. 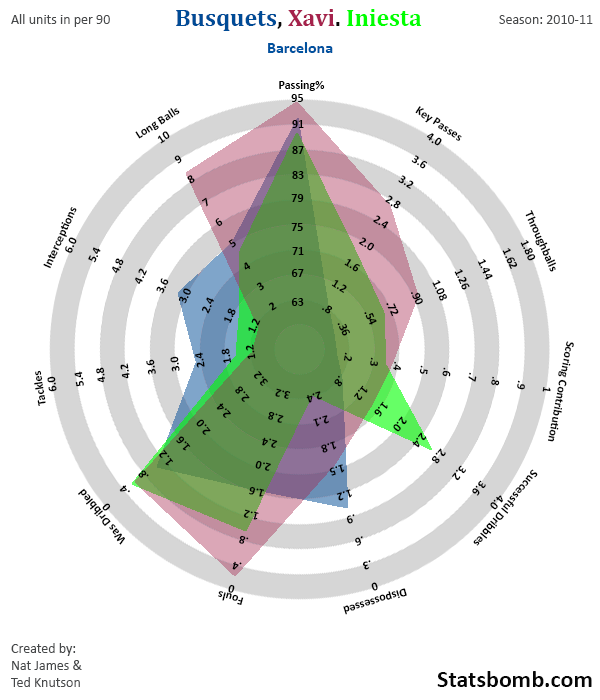 You can quibble a bit about the composition of any midfield, but like peanut butter and jelly, or Beyonce and Single Ladies, Busquets, Xavi, and Iniesta is one of the greatest combinations of all time. (Of all time.) Yes, there were plenty of times where Iniesta started as one of Barcelona’s wide forwards in a 4-3-3, but there are also plenty of times where this was the starting midfield combo that season. As you can see from the chart, each player has a fairly significant, and distinctive shape. Xavi is the masterful playmaker, with extreme scores in passing accuracy, key passes, long balls, and completed throughballs, who never commits fouls or gets dribbled past. His defensive contribution looks low, but it’s pretty solid for a guy whose job is not defense, and whose team controlled something like 70% of the possession that season. Iniesta is intriguing, as I don’t think I have seen a shape quite like his. Scoring contribution (Non-penalty goals and assists per 90) is lower than I would have expected, but he has an excellent dribbling rate, and scores well in the creative passing stats (that throughball number is also great, and only looks weak next to the likes of a Xavi, Totti, or Cesc Fabregas). Additionally, his defensive stats are outstanding for that type of player, and he rarely fouls and never got dribbled past. This is the first time I have encountered a shape like Iniesta’s. Busquets looks an awful lot like the charts of Mikel Arteta or Michael Carrick, with like a 10% bonus added everywhere. He is the prototype midfield destroyer and recycler, but he’s also a capable offensive passer as well. He’s also only like 22 years old in this season, which is pretty amazing. Fulham Okay, now because I wanted to compare extremes to test if total midfield shape overlays would be useful at that level, I have chosen the team who has one of the worst midfields in the Premier League this season. Formation is a bit different in that Fulham have varied between a 4-2-3-1, 4-3-3, and 4-4-2/1-1 this year, but it basically always involves Sidwell and Parker and usually Kasami in some capacity (the central attacking mid in the 4-2-3-1). I could put the occasional 4-3-3 partner of Karagounis in here, but that just makes it worse.
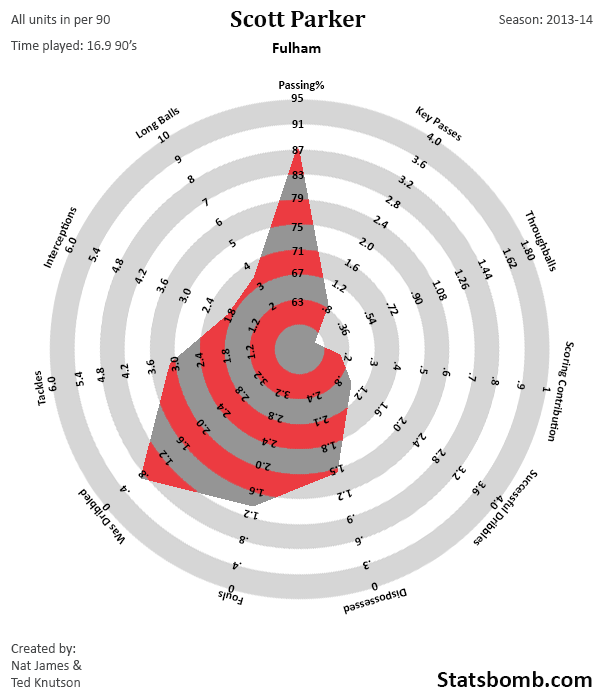
 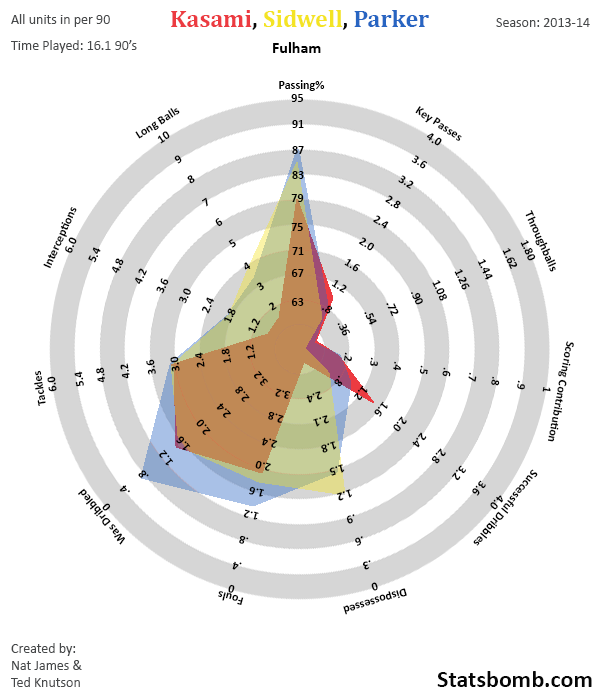 You know all those big spikey swathes of coverage Barcelona’s midfield has? Fulham has none of that. In fact, Fulham gets basically nothing offensively out of their midfield. The lack of performance there is shocking. Sidwell and Parker do post solid tackling and interception rates, but that’s probably a result of the fact that opposing defences are always running at them. It’s also interesting to note that all three of the Barcelona midfielders complete more long balls than any one of the Fulham players, something you don’t really expect if you buy in to the Barcelona equals short passing mythos, but then again, they complete so many passes a game, some of them are bound to be longer, right? Anyway, initial test complete. Barcelona’s midfield overlay covers a ton of area on the radar chart, with multiple players looking fairly amazing across a number of metrics. Fulham’s overlay covers very little area, with almost no offensive output, and little good stuff in general beyond some ability to tackle.
 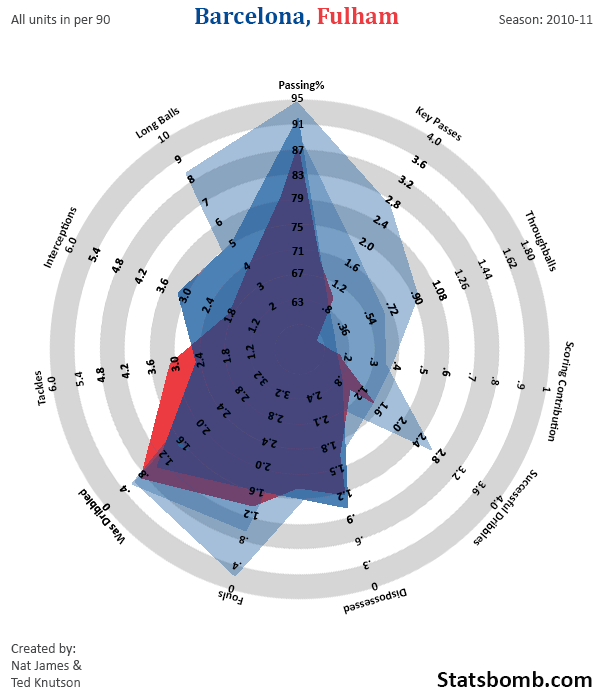 With that out of the way, expect occasional follow-ups doing midfield output comparisons, and potentially looking at attacking overlays as well. Every article won’t contain these going forward, but expect to see them regularly for a while, as I keep testing and refining the concepts. A Whole Heap of Bonus Radars
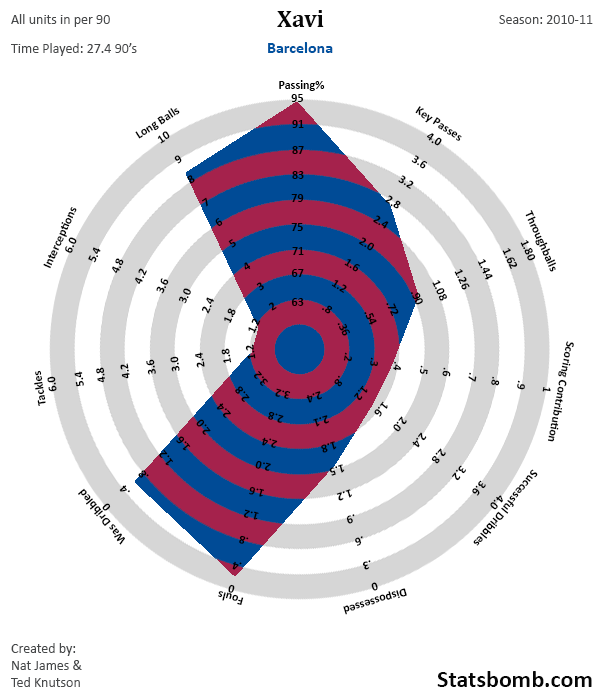
![]() Opta
Opta
Month: January 2014
Attacking Styles and Defensive Weaknesses

An Expected Goals Model works by categorizing chances and assigning a value to each category. In most cases we just add up all Expected Goals for a team or a player to measure performance, but it's also interesting to take a closer look at those categories themselves. I've looked at a few recognizable 'types' of chances (based on shot type, location and assist type) and asked myself the question if a team's attacking style can be identified by the types of chances they create, and similarly if teams have certain defensive weaknesses against specific types of chances. In other words: how much do chances of a certain type contribute to the total ExpG or total conceded ExpG? Here are the numbers for the Premier League as a whole over the last four full seasons: 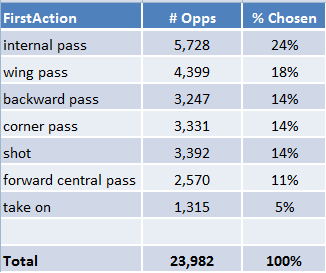 To see if these numbers are actually meaningful I've looked how much they differ per team (relative standard deviation), and to what extend they are repeatable (correlation between the first and second half of a season). Any stat that tells something about a teams style should be repeatable at least. The first thing you'll notice is that repeatability can hardly be found in types of chances conceded. Teams play to their own strengths much more than they play to their opponents weaknesses. This actually surprised me a bit. I would suspect that if it's known that a team has trouble defending crosses other teams will use that knowledge, but it might be easier said than done if you don't have the players for it. On the other hand, a manager can change a team's attacking style as we will see later. A couple of examples:
 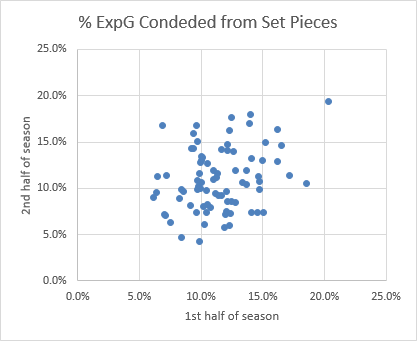 Teams that are consistently weak at defending set pieces? There's no such thing aside from one exception (the top right outlier): Arsenal during the 2010/2011 season. Penalties are all over the place and completely random:
 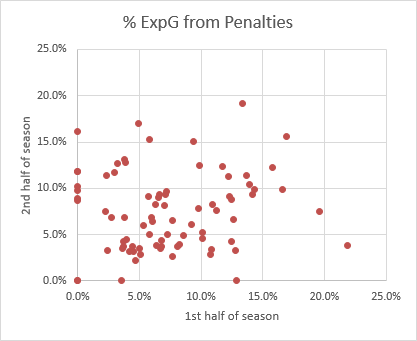 Here you'll see that the creation of a certain type of chance is more spread out and shows more correlation than the amount of chances conceded of the same type:
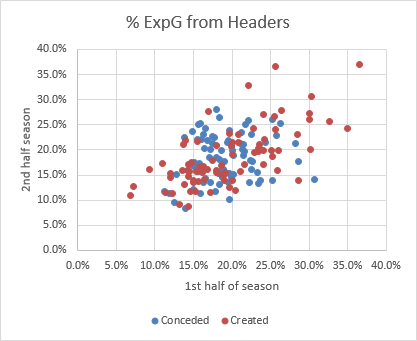
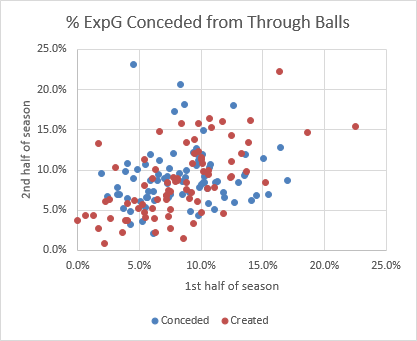 All in all I would say that there are only three numbers that are definitely meaningful: chances created from through balls, headers and shots from outside the box. Between through balls and headers there's also a negative correlation of 0.54. Without a doubt we're looking at different attacking styles. Here's a view of this season's data which I like to call arsenewenger.png:
 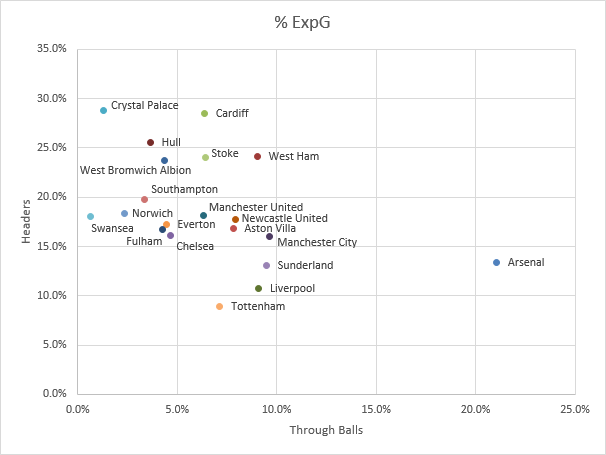 A closer look at Arsenal shows that although he fits right in, it's not just Özil either. Here are the top ten seasons (out of the last four) in terms of %ExpG from Through Balls:
 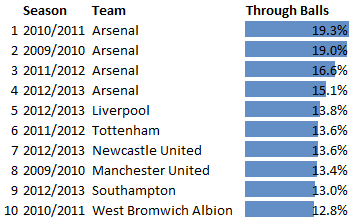 You want more manager fingerprints? Here's the full picture from this season:
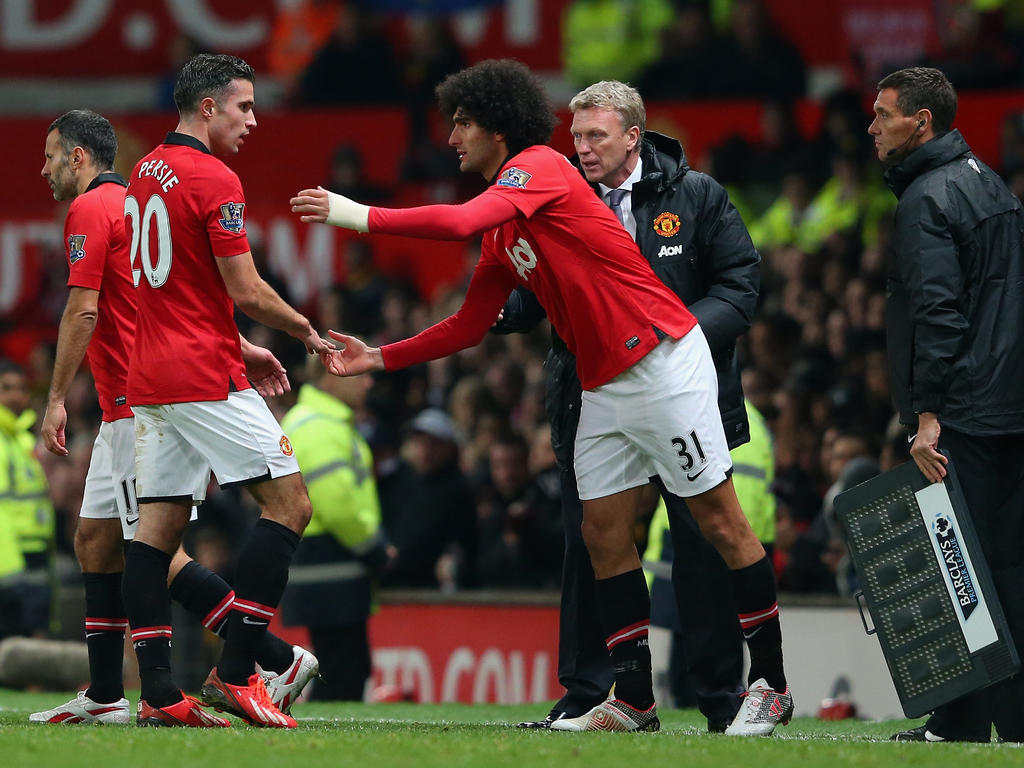
 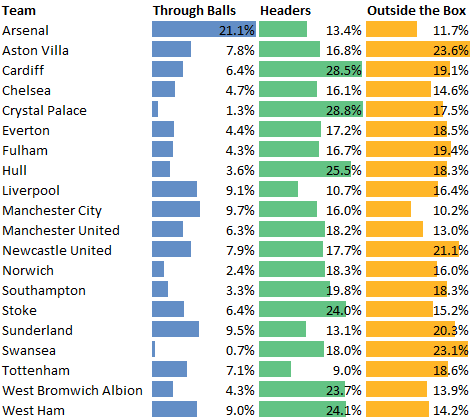 Notice Crystal Palace as the leading team when it comes to headers? It's no coincidence. Over the last four seasons under Tony Pulis, Stoke averaged more than 30%. Now Pulis gets the Palace job and immediately their percentage is up to 32.7% from 24.6% under Holloway. And then there's Swansea, currently the team with the lowest share of through balls. If they ever were a poor man's Arsenal they're not doing a very good job now. Under Brendan Rodgers in 2011/2012 they managed 11.1%, in the first half season under Laudrup it was even up to 11.8% but then it dropped to 4.6% and all the way down to 0.7% now (that is one shot from a through ball all season). This blows my mind as Michael Laudrup was an absolute master of the through ball himself. At the same time you can find Rodgers' first season at Liverpool in the top ten above, right there as the highest non-Arsenal team. That leaves us with one high profile managerial change which doesn't show such a clear picture. After David Moyes' move from Everton to Manchester United, Everton's headers are down slightly and shots from outside the box are up (Barkley, Mirallas), but it's not a huge difference. United's through balls are down a bit, and headers are up, but that trend was already going on under Ferguson:
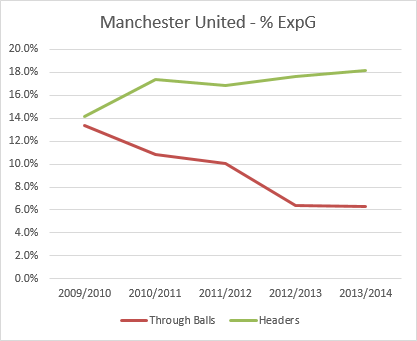
StatsBomb MythBusting: Five Years of Wayne... Rooney
Say the name Wayne Rooney to a typical football fan, and you will provoke all sorts of reactions.
“Shrek.”
“Great.”
“Dumb.”
“Talent of a generation.”
“Undisciplined.”
“England’s best.”
“Overrated.”
“Greedy.”
The last comes mostly as a result of his seemlingly frequent contract negotiations, a story that is again in the news this week because… well, he’s negotiating a new contract.
Does Rooney deserve a monster new contract, likely to be the richest ever in England? How good has Rooney been, really?
Our mythbusting series is designed to cut through the hype and focus on statistical production to try and answer exactly that.
Before we embark on our journey through five years of Wayne, here’s something to keep in mind: During which of the last 4.5 seasons has Wayne Rooney been the best player in England?
Alright, let’s get started.
2009-10 – Roonaldo
182 shots, spread across 30 full games made for Rooney’s highest Shots per 90 in his career. 22 non-penalty goals coupled with 3 assists made for a scoring contribution of .82 per 90, an excellent total.
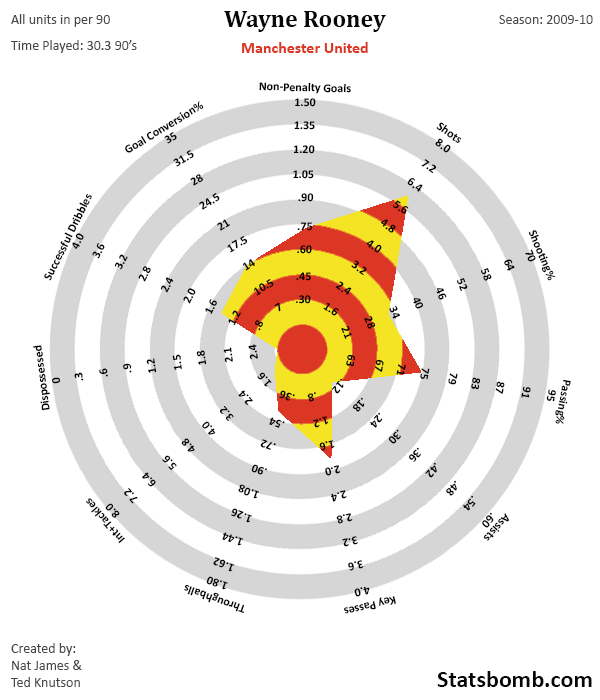
Scratch beneath the surface, however, and you see some imperfections. Six shots a game is a lot, and it doesn’t look as though Rooney was fully comfortable with that load, because only putting 32% of those shots on target is dreadful. It’s almost as if Rooney saw what his former Portguese teammate was doing at Real Madrid and decided to have a go at it himself.
Did you know that both of United’s best forwards were abysmal at shooting that season? It’s true - Dimitar Berbatov put just under 35% of his shots on target that same season. It’s weird for such elite players to be this bad at shooting across an entire season. It’s especially weird for it to be happening under a manager whose offense was the epitome of efficiency in the couple of seasons before he retired. Was Sir Alex Ferguson running the Villas-Boas system before it was cool? I suddenly want to go back and watch game film to find out. (Or look at shooting charts. Lovely, lovely shooting charts.)
Anyway, this is Rooney leading the line, acting as a mostly selfish goalscorer. Key Passes per 90 are still decent, and that throughball number is quite good, but aside from the goals, this season was really inefficient. You can vaguely picture an irritated Berbatov, making a run that never gets found as Rooney launches a shot from 23-yards out deep into the seats once or twice, before he stops doing that, lights up a Gauloises, and says, “Fuck it, Wayne. You can do it yourself.”
Didier Drogba was unequivocally the best scorer in the Premier League this season, and Chelsea won the title.
2010-11 – Turmoil
This was the season Rooney said he wanted to leave, not because of money, but because of “ambition.” (A line that’s become irritatingly familiar to Arsenal fans over the last eight years, but United are the richest club in the land.) Whether it was the ankle injury, or Sir Alex punishing Rooney by moving him out of position, or some other more esoteric reason, Rooney’s stats profile changed fairly dramatically.
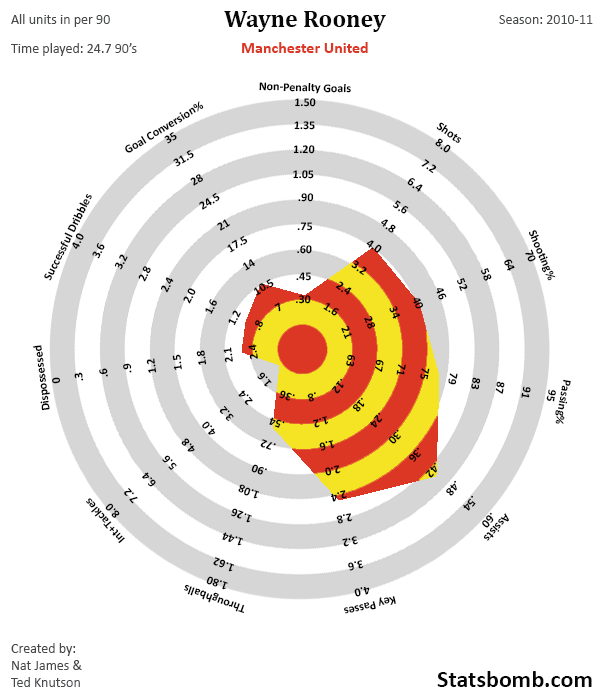
Goal conversion this year dropped all the way down to 11%, which is way below league average for a forward. It’s also the only time in the last five years where Rooney’s goalscoring looks pedestrian, all the way down at .32 non-penalty goals per 90.
In exchange, however, we now see creative Rooney at the fore. Assists per 90 went from 1 every 10 games in 09-10 to nearly 1 every 2. Key passes are up, throughballs are outstanding, while the rest of Rooney’s stats basically stayed the same. His overall scoring contribution went from .82 the year before to… .76 this season. Nearly identical, but a big shift in composition.
United won the league this year by 9 points. Tevez and Berbatov technically lead the league in goals, but Robin van Persie was the best scorer in the league by far, with 16 goals non-penalty goals and 7 assists in 19.6 90’s and a monster scoring contribution of 1.17.
2011-12 – AGUUUUUEROOOOOOOOOOOOOOOOOOOOOOOOOOOOO!!
Possibly Rooney’s best season as a pure center forward, the 26-year-old put together 5 shots a game, 45% shooting accuracy, and his best passing accuracy to date. The 27 goal number is inflated by 6 penalties, but 21 over a 31.5 game run is still a nice haul. Add in 4 assists and you get a scoring contribution of .8 per 90. (Rooney is eerily consistent on this front.)
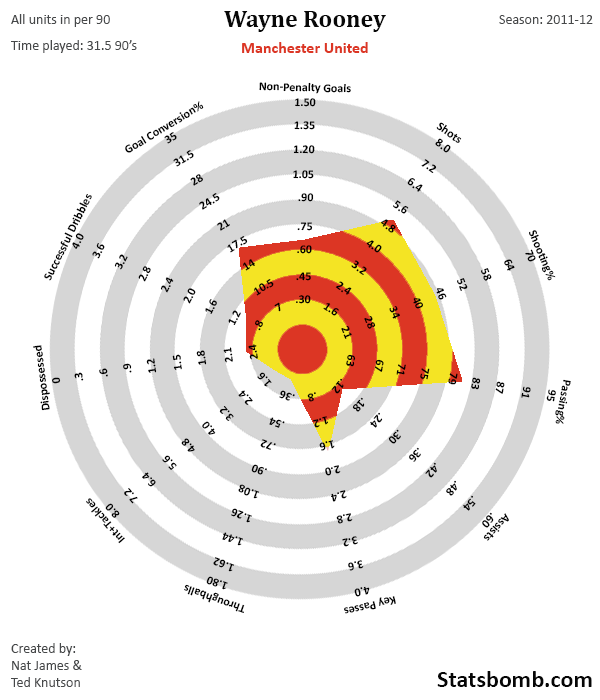
Note, however, that assists and key passes are way down compared to the season prior, and also to Rooney’s career as a whole. There’s an interesting Dr. Shrekyl and Mr. Hyde dichotomy to Rooney’s performance in his middle seasons at Manchester United.
Regardless of how good Rooney actually was that year, the only thing anybody remembers from the entire season is Aguero’s incredible league winner in the 93rd minute of the final game, and the looks on United fans’ faces as they went from celebrating yet another league title to being pipped by their “noisy neighbors” at the very very death.
Robin van Persie won the golden boot at Arsenal that year, with a ridiculous 30 goals plus 9 assist season, and a scoring contribution of .99.
2012-13 – Tag Team
What happens when you take the best scorer in the Premier League and add him to the team that finished second in the league by the finest of margins?
United score absolute bucketloads of goals, Fergie walks out the door holding yet another Premier League title, and no one in the analytics community can tell you exactly how they did it. That, however, is a confusing story for another time, as we’re still here to talk about Wayne Rooney.
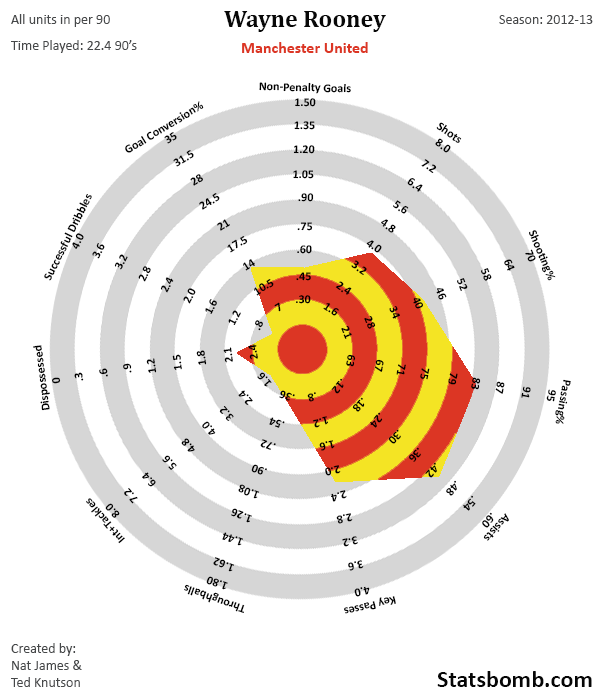
Rooney “only” produced 11 non-penalty goals and 10 assists this season, but he also only played 22.4 90’s, meaning a 2012-13 that was filled with some injuries and more clashes with Sir Alex actually saw Rooney produce the best scoring contribution so far. .49 NPG plus .45 assist works out to .94 goals per 90 minutes on the pitch.
Shooting accuracy was down a bit, but still near 41%, which is acceptable, especially since Rooney played deeper this season. Key passes were back up, as were throughballs, and Rooney contributed more on the defensive end as well.
As mentioned above, United destroyed the rest of the league this year. Robin van Persie won another golden boot, but when you strip out penalties… the best scoring rate in the league belonged to Wayne.
2013-14 – Roomander in Chief
Hot on the heels of possibly his best season, and a year in which Rooney secretly lead the league in scoring, Rooney faced his toughest challenge: Playing in a team managed by David Moyes.
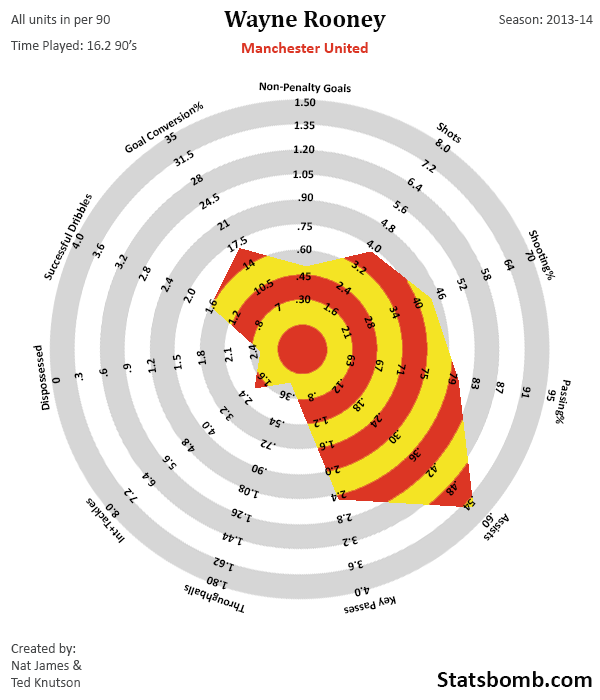
Conversion rate is hovering close to 17% again, an excellent number. Shooting accuracy is good, and though shots are at the lowest rate in the five-season sample, Rooney is firing in goals at an identical rate to last year. Additionally, this is the best season he has had at setting up teammates, and this is despite the fact that he and van Persie haven’t actually played together that often. An assist rate of .56 is tremendous, and key passes floating around 2.5 makes Rooney one of the top 5 most creative players in the league.
It’s not just the offensive numbers that are up though – Rooney’s defensive contribution is the highest we have seen, and he’s completing 1.6 successful dribbles a game too, again the highest in the sample.
So Rooney’s scoring contribution is now 1.05, and likely the highest in his career. If Luis Suarez, Sergio Aguero, and Daniel Sturridge also weren’t playing completely out of their minds (and they totally are), Rooney would be an easy favourite to again lead the league in scoring rate. Instead, he’s 4th in a year where all sorts of guys have gone completely bananas.
What Have We Learned?
A lot of things I personally did not expect when I started digging in to the data.
- I did not realize that Rooney lead the league in normalized scoring contribution last season.
- Rooney is actually experiencing his best season in recent times across a large number of metrics this year.
- Looking at the data, it’s fairly clear that Rooney’s best role is as a second striker or playmaker. His key pass numbers aren’t up there with Ozil or Silva, but they are high, and Rooney’s goalscoring still eclipses either of the playmaking maestros by some distance.
- Rooney has only been the best scorer in one of the last 4.5 seasons, but he’s been close every single time. That sort of consistency in what is one of the toughest leagues in the world to score in, is damned impressive.
Does Rooney Deserve £300K/week?
There’s a loaded question. Does anyone, let alone any athlete, deserve £15M a year? That’s too philosophical to answer either way.
However, make no bones about it, Wayne Rooney is probably the best overall scorer the Premier League has seen in the last half decade (for what it’s worth, I actually think Fabregas had a chance at this if he’d stayed at Arsenal, but alas…). Additionally, while I would normally be worried about falling production in a 28-year-old forward, Rooney has two very important things working for him.
1) His best role is as a more cerebral playmaker (I know, I know… the jokes write themselves), which means a marginal loss in pace or physical ability will not affect him as much as it would a speed striker.
2) Even though people might not know it, at 28, he is currently experiencing his best season in recent times. Is it sustainable? Nobody really knows. However, even if this is the peak, a new 3- or 4-year deal at this point probably won’t smart too much in the last season of the deal unless Rooney has serious injury problems, something to this point he has completely avoided.
Conclusion: Wayne Rooney? Probably even better than you think.
![]()
The Premier League 2003-2013: Points Per League Position

This will be a really short post today. The topic: historic Premier League points totals per table position.
It is most likely that this type of study has been undertaken before, so if it seems like I may have repeated previous work, please don't get mad. Assume I may not have seen said previous work, send me a link of said previous work and I will link it at the top of this page.
I have pulled the last ten years worth of PL tables (2003/4 to 2012/13) and the points total for each of the 20 positions in the table. It looks like this:
Ten Year Table
| Pos | Mean | Mode | Median | PPG |
|---|---|---|---|---|
| 1 | 88.6 | 89 | 89 | 2.33 |
| 2 | 81.9 | 83 | 83 | 2.15 |
| 3 | 75.8 | 75 | 75 | 2.00 |
| 4 | 68.8 | 68 | 68.5 | 1.81 |
| 5 | 64.0 | 65 | 64 | 1.68 |
| 6 | 60.8 | 58 | 61 | 1.60 |
| 7 | 57.1 | 53 | 56 | 1.50 |
| 8 | 53.1 | 49 | 52.5 | 1.40 |
| 9 | 51.0 | 52 | 52 | 1.34 |
| 10 | 48.7 | 47 | 49.5 | 1.28 |
| 11 | 46.8 | 47 | 47 | 1.23 |
| 12 | 45.4 | 46 | 46 | 1.19 |
| 13 | 43.7 | 42 | 44 | 1.15 |
| 14 | 42.7 | 45 | 43 | 1.12 |
| 15 | 41.5 | 41 | 41.5 | 1.09 |
| 16 | 39.3 | 36 | 39 | 1.03 |
| 17 | 37.3 | 35 | 37.5 | 0.98 |
| 18 | 35.0 | 36 | 35 | 0.92 |
| 19 | 32.1 | 30 | 32.5 | 0.85 |
| 20 | 25.3 | 25 | 26.5 | 0.67 |
Ten Year Table In Graph Form
Every season previous to 2013/14 is plotted on this graph (grey lines) and the red line is the ten year average.
Of Interest:
- The 10 year average says there is likely to be one terrible team cut off from the rest.
- Top 3 are separated somewhat.
- Points gap between each positions gets closer as we move down the table.
- The two low points for Fourth place were 60 and 61 points in 03/04 and 04/5.
- I'm not entirely sure which way to solve this problem, but should any work on "points required to win the title/4th place/avoid relegation?" use the average points won for 1st/4th/17th or should we use 2nd+1 point/5th+ 1 points/18th+1 point?
I've no idea what the answer is for point four, but I recall a recent conversation on twitter about this very subject between @theM_L_G and @JamesWGrayson. So, we have looked at the average number of points that each table position records, we have also seen that information in graph form. The question now is, how does the 13/14 season shape up in comparison to this ten year average?
Are the top 6 over performing, are the bottom three weaker that the ten year historical average?
Ten Year PPG Pace
Right now, positions 2-9 are are recording points per game at a significantly higher clip than the ten year average. This over performance comes at the expense of positions 10-18. Also, the gap between 8th place and 10th place is really something: Newcastle (8th) 36 points, Villa (10th) 24 points.
Has the top of the league become stronger? Have the bottom ten teams become weaker? Are the results in the chart above simply variance of just 22 games played? Possibly.
It is also possible that the 2013/14 season is an outlier, just as it is possible that 2013/14 may be the start (or middle) of a trend which sees the richer, more successful clubs record points total above historical averages.
I don't want to dig too far into that today, instead all the information needed to conduct your own investigations are at the bottom of the page. I'm lazy, see!
Working Out
Show yer working out!
Just copy and paste.
| Pos | S 12/13 | S 11/12 | S 10/11 | S 09/10 | S 08/09 | S 07/08 | S 06/07 | S 05/06 | S 04/05 | S 03/4 | Average |
|---|---|---|---|---|---|---|---|---|---|---|---|
| 1 | 89 | 89 | 80 | 86 | 90 | 87 | 89 | 91 | 95 | 90 | 88.6 |
| 2 | 78 | 89 | 71 | 85 | 86 | 85 | 83 | 83 | 83 | 79 | 82.2 |
| 3 | 75 | 70 | 71 | 75 | 83 | 83 | 68 | 82 | 77 | 75 | 75.9 |
| 4 | 73 | 69 | 68 | 70 | 72 | 76 | 68 | 67 | 61 | 60 | 68.4 |
| 5 | 72 | 65 | 62 | 67 | 63 | 65 | 60 | 65 | 58 | 56 | 63.3 |
| 6 | 63 | 64 | 58 | 64 | 62 | 60 | 58 | 63 | 58 | 56 | 60.6 |
| 7 | 61 | 56 | 54 | 63 | 53 | 58 | 56 | 58 | 55 | 53 | 56.7 |
| 8 | 49 | 52 | 49 | 61 | 51 | 57 | 55 | 56 | 52 | 53 | 53.5 |
| 9 | 46 | 52 | 48 | 50 | 51 | 55 | 54 | 55 | 52 | 52 | 51.5 |
| 10 | 46 | 47 | 47 | 50 | 50 | 49 | 52 | 51 | 47 | 50 | 48.9 |
| 11 | 44 | 47 | 47 | 47 | 45 | 46 | 50 | 50 | 46 | 48 | 47 |
| 12 | 43 | 47 | 46 | 46 | 45 | 43 | 46 | 48 | 45 | 47 | 45.6 |
| 13 | 42 | 45 | 46 | 44 | 41 | 42 | 43 | 47 | 44 | 45 | 43.9 |
| 14 | 41 | 45 | 46 | 39 | 41 | 40 | 42 | 45 | 44 | 45 | 42.8 |
| 15 | 41 | 43 | 43 | 38 | 41 | 39 | 41 | 43 | 42 | 44 | 41.5 |
| 16 | 41 | 38 | 42 | 36 | 36 | 37 | 39 | 42 | 39 | 41 | 39.1 |
| 17 | 39 | 37 | 40 | 35 | 35 | 36 | 38 | 38 | 34 | 39 | 37.1 |
| 18 | 36 | 36 | 39 | 30 | 34 | 36 | 38 | 34 | 33 | 33 | 34.9 |
| 19 | 28 | 31 | 39 | 30 | 32 | 35 | 34 | 30 | 33 | 33 | 32.5 |
| 20 | 25 | 25 | 33 | 19 | 32 | 11 | 28 | 15 | 32 | 33 | 25.3 |
| Total | 1032 | 1047 | 1029 | 1035 | 1043 | 1040 | 1042 | 1063 | 1030 | 1032 |
Sacked Managers, Luck & Underlying Numbers

Six top flight managers have been relieved of their duties so far in this 2013/14 Premier League season. Some of those dismissals, at the time, seemed fairer than others. What I am going to look at in this short piece is how those six teams who replaced their managers fared before, and after, the management change. To examine how those teams fared I am going to look at each teams Shots On Target Ratio and also their PDO. I will include each teams points per game number and their goal share%, but I want to get a feel for how these teams performed by the underlying numbers. I shall list the teams rolling numbers in each category and the new managers rolling numbers in each category for comparison. Shots on Target Ratio will be used as a proxy for team skill and control on games. PDO will be used as a proxy for for 'luck' or, as is another way of putting it, by how much did each team outperform its Shots On Target Ratio. If team X has a PDO 10 points above average but a Shots On Target Ratio ten points below average it may be fair to say that team X has outperformed its SoTR. That 'over performance' is, commonly, generally and perhaps not entirely fairly, referred to as 'luck'
Issues With Method
Strength of schedule, injury, home/away splits and especially score effects can, and will, skew the numbers I am going to look at here. There is no real way of factoring all these effects into this study. The study isn't perfect, I neither have the time or the skill to make it perfect. I have what I have and that is all. We shall start with the first manager to be dismissed.
Paolo Di Canio
Mad dog Paolo di Canio was dismissed after just 5 games of the 13/14 season. An abrasive temperament, an inability to coach his team in the basics of game control, an inability to outshoot the opposition and a failure to fix the gigantic fucking hole in Sunderland's midfield were just a few of the myriad reasons that Di Canio may have been dismissed for. But really this was about Ellis Short fixing his mistake in appointing Di Canio in the first place. And I'm fine with that. If you have made a mistake don't be stubborn or proud, but instead fix it. The fix here for Short was Di Canio's rapid dismissal.  WOWY: Di Canio
| With Di Canio | W/O Di Canio | |
| SoTR | 31.4 | 41.7 |
| PDO | 81.4 | 100.2 |
| PPG | 0.2 | 1 |
| Goal Share% | 21.40% | 41.80% |
Not entirely fair to judge Di Canio on a tiny sample of just 5 games, but the information Ellis Short had after just 5 games may well have been more than enough. Di Canio's team had no control (SoTR), no luck (PDO) and the points and goal share were abysmal. Things have improved slightly under Poyet but 1 ppg may not be enough. You'll notice how Poyet's Goal share matches his SoTR number which tells us that scoring% and save% haven't been too cruel or kind to his team. Sunderland are exactly where they should be under Poyet and that is a 1 ppg team. Di Canio was terrible, Poyet is a touch better but he likely doesn't have the horses to improve this team beyond the numbers posted.
Holloway/Pulis
Insufficient samples here. Holloway lasted 8 games. Pulis has been in charge for 9 games.  So, the first cut-off line indicates Holloway's time in charge. The second cut-off point indicates the start of Pulis's time in charge. Pulis has posted a better PDO and a better Shots on Target Ratio. WOWY: Holloway/Pulis
| Holloway | Pulis | |
| SoTR | 34.4 | 53.8 |
| PDO | 86.8 | 91.66 |
| PPG | 0.37 | 1.44 |
| Goal Share% | 26.09% | 43.75% |
Holloway's numbers were pretty tragic. Goal share is lower than shots share which points to an under performance in PDO. Alas, this is the case. Pulisball has seen Palace take a staggering ~54% of the shots on target, but register just 43% of the goal share. Again, PDO is the culprit. No matter, Pulisball has magical powers and those powers are strong enough to record a ppg of 1.44. Pulis has been an inspired choice to replace poor Holloway. 53.8% of the shots on target, just let that sink in.
Martin Jol
Fired after 13 games with what is, as far as I know, the worst SoTR on record. Not even Sunderland under O'Neill were this insipid.  Since Jol's departure Fulham have posted improved SoTR numbers (just under 50%) but PDO is a real issue. WOWY: Jol
| Jol | W/O Jol | |
| SoTR | 30.3 | 46.7 |
| PDO | 101.6 | 79.89 |
| PPG | 0.77 | 1 |
| Goal Share% | 31.43% | 31.43% |
Jol's numbers were a fair reflection of performance: SoTR matches Goal Share%. thus 0.77 ppg is a fair reflection of his utter ineptitude in managing this football club. Since Jol's departure Fulham have posted relatively strong SoTR numbers but that hasn't led to a goal share% indicative of the strong shots performance. Why is that? PDO is damn crippling this football club. Jol deserved to be sacked, but the decision to sack him was likely 5 or 6 games too late, which was probably caused by the belief that the PDO spike around game 8 was actually real talent instead a temporary variance. Meulensteen has Fulham posting good shots numbers but PDO is a real issue. A point per game pace is fine, and it may improve if PDO regresses.
Andre Villas-Boas
I really didn't like Villas-Boas's sacking, but something was broken at Spurs during those last days and we will likely never find out just what that something was.  Villas-Boas posted strong SoTR numbers but the PDO was crippled by a low scoring% early in the season. Once the scoring% started to improve, along came the save% regression. During the last few games of Villas-Boas's reign Tottenham's lowly PDO was finally destroyed but two alarming blowout losses at the hands of Man city and Liverpool. Since Villas-Boas's departure Tottenham have posted a PDO of, wait for it.........130.03. In layman's terms: the most ridiculous, obscenely unsustainable PDO that not only I have ever seen during a short run of games, but the most obscenely unsustainable PDO one could ever possibly imagine. Poor Andre. WOWY: Villas-Boas
| Villas-Boas | W/O Villas-Boas | |
| SoTR | 57.5 | 55.3 |
| PDO | 85.4 | 130 |
| PPG | 1.68 | 2.66 |
| Goal Share% | 41.67% | 73.68% |
Villas-Boas's goal share% was lower than his SoTR due to the poor PDO. This probably had a knock-on effect to the low ppg number. Sherwood is a genius, the right man for the job, has liberated the Tottenham players, found the right attacking balance a lucky bastard in that Tottenham have posted a 53% scoring% and a 77% save% during his short reign. Goal share% is far higher than SoTR due to that PDO, thus ppg is pretty darn high. That PDO number won't last, Tottenham's ppg number won't continue to be that high. Six games is a tiny sample, good or bad stuff can happen. In Sherwood's case, he has either stumbled on a formula which turns Tottenham into BarcaMunich or he is riding some lucky percentages/unsustainable play. Villas-Boas posted some good fundamental numbers numbers at Tottenham but some systemic and behind the scenes issues meant his sacking was likely a fair one. Jury is out on Sherwood.
Steve Clarke
 I thought the sacking of Steve Clarke was a touch unfair on the dour Scotsman at the time. I may still feel that way for a little more time yet, but Pepe Mel may well be a significant upgrade. We need more data on Mel and for that we must wait. Clarke was posting decent fundamentals but since his departure West Brom have improved their SoTR despite facing some pretty tough opposition. WOWY: Clarke
| Clarke | W/O Clarke | |
| SoTR | 43.1 | 55.3 |
| PDO | 100.6 | 97.7 |
| PPG | 0.93 | 1.16 |
| Goal Share% | 43.59% | 50.00% |
Clarke's numbers were a pretty fair indication of his ability with West Brom: Sub-par shots on target team who posted a sub-par goal share with a league average (fair) PDO. Since Clarke's departure the SoTR number is has improved (small sample), the goal share has improved and thus points per game has also improved. The numbers during the six games without Clarke look pretty good. The sacking seemed harsh but the early returns point to the possibility of this West Brom team having more talent that Clarke was able to coax out of it.
Malky MacKay
Oh dear, Malky. This isn't good.  MacKay's Cardiff were a poor SoTR team under his management, so poor, in fact, they came mighty close to matching the ineptitude shown by Fulham under Martin Jol. The above chart shows us that Cardiff were always a poor shots team but were merely propped up by a high PDO which regressed ever so slowly toward the mean. WOWY: MacKay
| MacKay | W/O MacKay | |
| SoTR | 31.3 | 44.9 |
| PDO | 100.5 | 81.14 |
| PPG | 0.94 | 0.25 |
| Goal Share% | 31.71% | 28.57% |
MacKay's numbers were a fair reflection of what he was able to get out of this team: SoTR matches the goal share, while PPG is fairly impressive due to the early season PDO spike. We don't really have enough information about Cardiff without MacKay but it may be fair to say that Cardiff will likely not continue to post that impressive a SoTR number, nor will they continue to suffer the cruel blows that their low PDO number currently deals them. MacKay was likely not a good enough manager to manage in the PL, but we cannot be completely certain of this due to the talent level at his disposal. Cardiff do have some nice pieces at their club but those pieces are likely not nice enough, nor are there enough of those nice pieces to guarantee safety in their battle against relegation. We wait to see what the super sub can coach out of this team.
Final Thoughts
Managers matter, but so do small samples and the variation in not only performance and luck, but in the variation of strength of schedule and injury. Personalities matter too. Just ask Daniel Levy or Vincent Tan. Managers can be prematurely fired off the back of periods of 'bad luck' just as they can perhaps be fired too late due to periods of 'good luck'. Stuff happens, life for a manager can be as unfair as it is fortuitous. My take is thus: by all means fire a manager for posting poor numbers in terms of control of the shots count (SoTR) but be wary of dismissing a manager due to a low PDO (the coach killer) unless it is absolutely certain that the low PDO number is caused by long standing system issues. Personally, my take away from this piece, and other private work that I have been doing, is how well Goal Share% fits with SoTR (and TSR) numbers. If those two numbers do not sit pretty close to each other then the cause is likely due to a high, or low, burst in PDO. Given enough time, shots talent will equate to goal share talent. And we know what happens to PDO, right?
Comparing Arsenal Midfielders + Explaining CM Radar Charts
I started producing these radars – god, on Monday? This week feels like a year. As mentioned in the initial post, they are something I’ve wanted to do for months, but I didn’t have the data collected yet or the skill to do them. The skill element of these is still in question, but I have gathered a fairly comfortable data set from 09-10 from the many public sources out there.
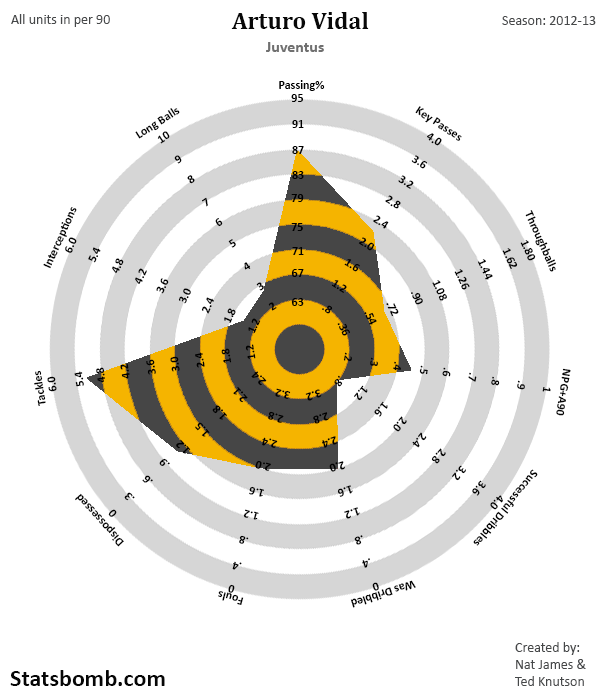
One of the things that occurred to me while building the base template was that these would likely be much more useful for specific positions. We don’t expect defenders to take 8 shots a game like Ronaldo, and it’s pretty silly to expect Ronaldo to make 5 tackles a game like Arturo Vidal. So that’s what I started doing after publishing the Ballon D’or piece.
The first position template I built was for central midfielders. I wanted something that reflected the fact that CMs are potentially the most versatile players on the pitch. They need to attack and defend. Some play a big role in the offense, contributing high levels of key passes, throughballs, some goals, dribbling, etc. Others are destroyers that sit much deeper, and recycle the ball quickly back to offensive players. I figured I could create a radar that reflected the full potential of central midfielders.
This is what I came up with.
[For those wondering about design decisions, I’ll discuss it a bit down at the bottom. I am aware there are imperfections in displaying information like this.]
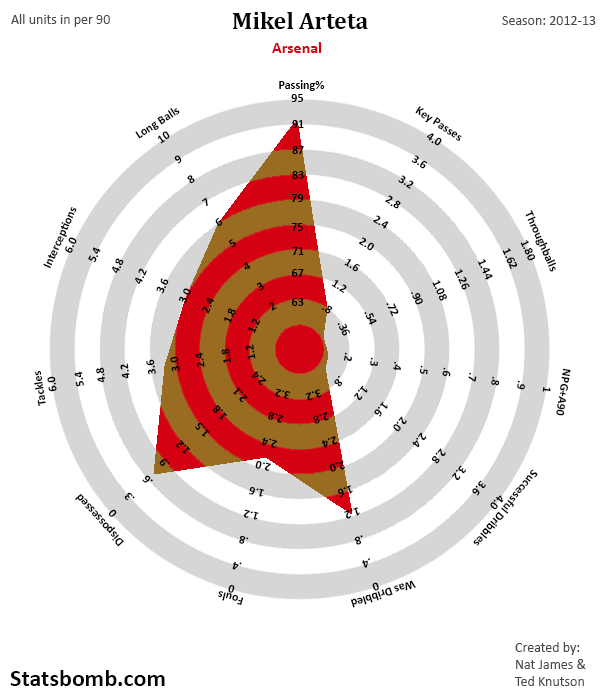
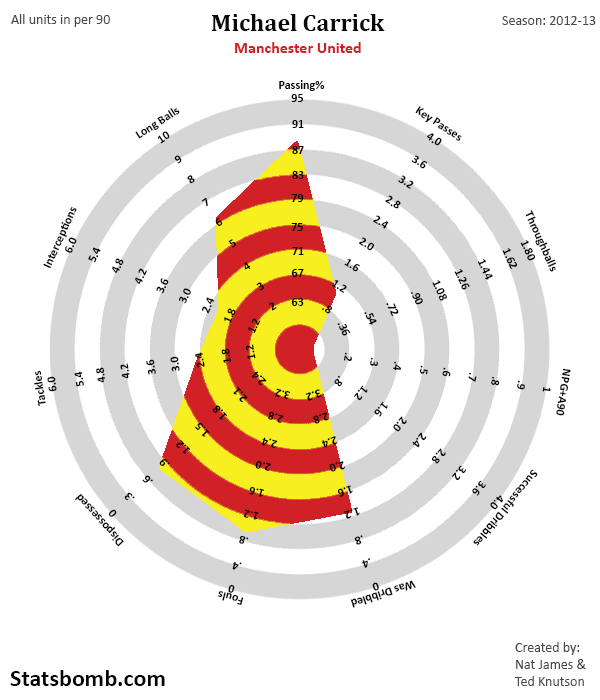
That’s Mikel Arteta from last season. His role is very defensive, with very little area covered on the offensive side of the ball.
Now for someone a little different.
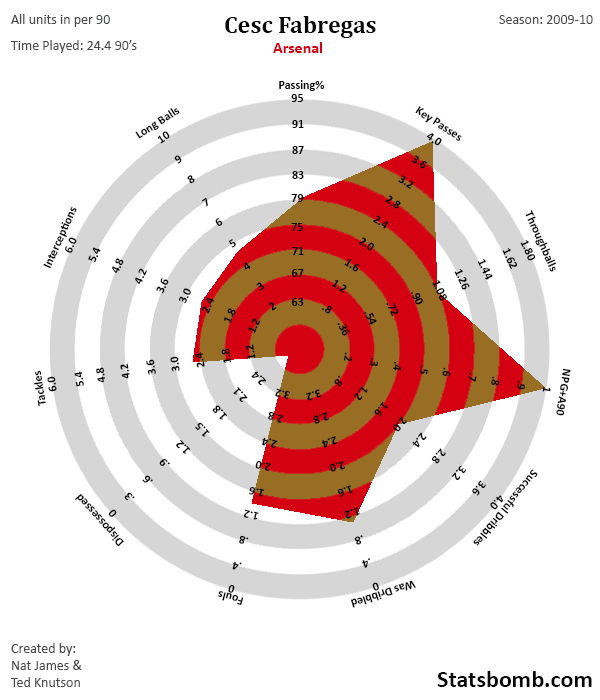
That is Cesc Fabregas at Arsenal in 2009-10. I have stated for quite a while that I think Fabregas is the best attacking passer I have ever seen in the Premier League. Given his key pass and scoring contribution (NPG+A90), that seems pretty accurate.
One of the cool things I was hoping to do was use these radars to display how role changes alter statistical outputs. Check this out.
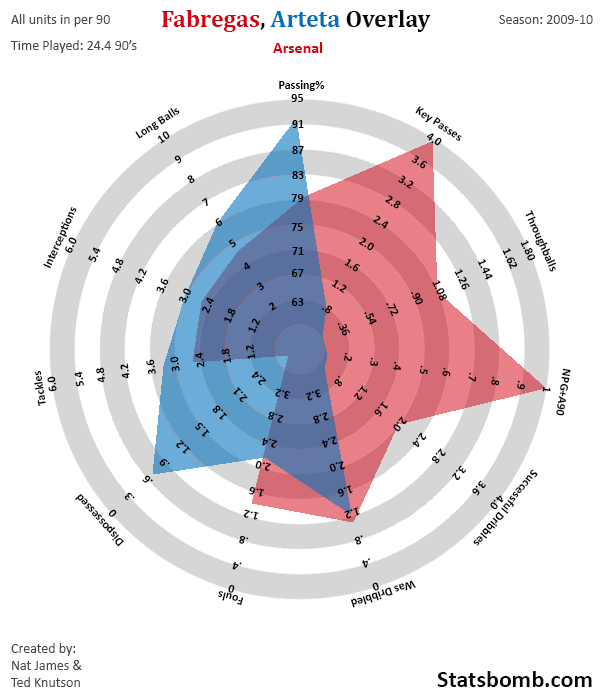
Same chart, two outstanding players, two completely different shapes. Cool, right? Now how about this?
Here’s Aaron Ramsey for Arsenal so far this year (For those reading from the future, the data was good through Jan 17th).
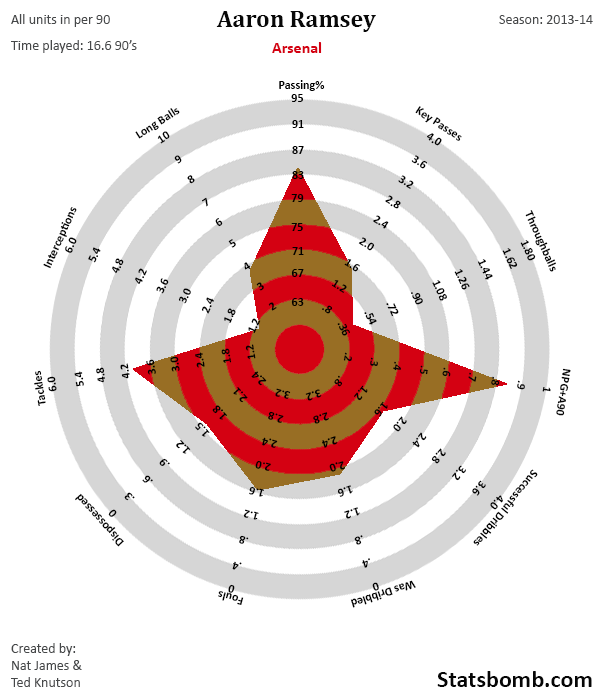
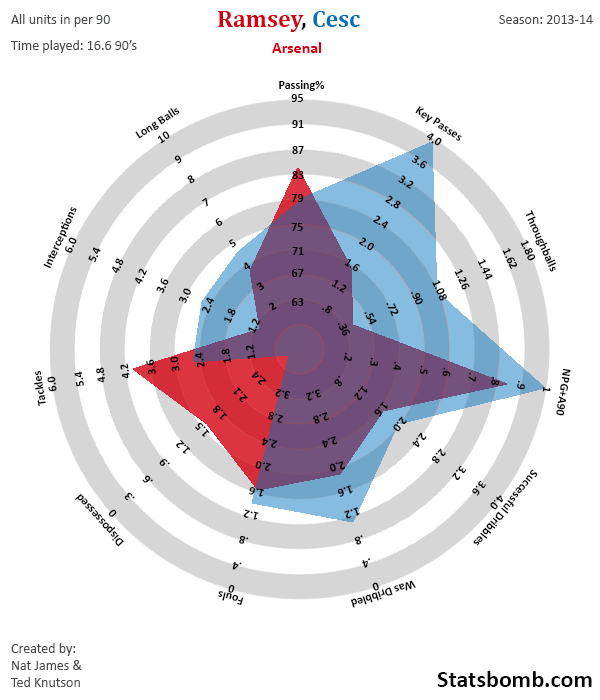
Ramsey probably plays a role much more comparable to what Fabregas played when he was at Arsenal than Arteta, but obviously they aren't the "same." They have similar defensive I+T but Cesc intercepted the ball more and Ramsey tackles more. They even have similar scoring contributions (NPG+A90), but Cesc's were split pretty evenly across assists and goals, while Rambo has scored a ton this year. Fabregas is the more creative passer by far. Now let’s see what happens when we overlay these two.
I’m going to keep developing the positional radars based on KPIs I’ve examined and think are important, some of which will obviously get adjusted after feedback. Some of the contextual ones like Dispossessed, Fouls, Was Dribbled make people shrug, but they are actually fairly important bits of information when evaluating midfielders. Other positions will have different axes, and presumably different contextual stats to go along with them.
If you like these – and response from most people has been very positive – then check back more in the coming weeks for new positions and comparisons. I’m still very much learning with these, but one thing I am hoping to look at is what happens when you overlay entire midfields on top of each other and then compare them across teams.
Bonus Radars
Design Decision Discussion
Though I am new to creating these, I have been studying this for a while and am aware of many of the pitfalls for both the data itself, and then method of display.
- The boundary choices for each axis are the actual boundaries that a player has produced in that position for the data set. So in today’s case, a player has actually produced those numbers playing as a midfielder across a reasonable chunk of one season.
- I have grouped similar attributes together. Passing accuracy is neutral, but tied to the passing stats. Long balls are attached to it, but lie near the defensive metrics as well (typically defenders play many more long passes than offensive-focused playrs). Scoring and offensive metrics are to the right of the chart, while contextual metrics are down at the bottom. Defense is to the left. Thinking about it, Dispossessed should likely be next to Successful Dribbles. I will change that in a future version.
- Good performance should take up more area, so the “bad” contextual stats have had their scales reversed. If a player was never dispossessed, they would hit the outside of the chart. Never dribbled past? The same. Basically, players with the best stats should cover the greatest area in the radar.
Match Simulation: Score Effects and Beyond
During the short time that I've been involved in football analytics I've learned a few things about match prediction, or more specifically win percentage prediction, which is very interesting from a betting perspective because it allows you to directly compare your own predictions to the bookies’ odds and see if there's value in a specific bet.
As I see it odds prediction consists of two major parts: predicting the relative strength of the two teams involved in a match, and estimating the likelihood of a certain outcome given this relative strength. This article is about the second part. It’s common knowledge that given an ‘expected goals’ value for one team in a match, you can calculate the probability of that team scoring a specific number of goals quite easily by using a Poisson or binomial distribution, which can then be turned into win percentages. This actually gives remarkably good results, but it’s not perfect.
It can’t be. It’s ‘only’ simple mathematics so it assumes that the probability of a goal being scored during the time frame of a match is fixed and independent of other events. We know that this isn't the case in reality. For example there’s something called ‘score effects’. The ‘game state’ (in this case the goal difference) influences the probability of scoring, and obviously the probability of scoring eventually influences the game state.
Measuring Effects
After analyzing data from the last four full Premier League seasons I've identified some more of these effects and by putting them together you can see a sort of ‘system’ taking shape that explains/models how a match progresses and that can be used to simulate a match and figure out the chance of a certain outcome.
To do this I've divided each of the 1520 matches into 10 sections and measured team performance (ExpG) during each section, comparing different initial game states (in the broadest sense, not just the score).
Here’s the theory: assuming a random team at a random time and a random game state, all we know is a theoretical average scoring probability. For any extra ‘information’ (about the team, the game state, etc.) we can measure the effect that is has in terms how much it causes the probability to deviate from this theoretical average.
The probability of scoring is influenced by these (independent!*) effects:
- Initial, pre-match expected goals (how good the team is on paper, including home advantage etc.). On average this causes a 43% deviation.
- Time (it’s well known that the amount of goals significantly increases as the match goes on). Average deviation: 14.5%
- Response to goal difference (score effects): 8.5%
- Red card state (being a man up or down): 2.5%
This might seem counter-intuitive in the sense that a red card obviously has a much bigger effect on scoring probability, but the chance of the situation occurring in the first place is also taken into account here, and a team being a man short happens less than 10% of the time. Similarly a goal difference other than 0 only happens about half the time, while the factor ‘time’ itself is always at play.
A note on score effects: I've noticed that score effects are much more pronounced in games where the teams are evenly matched. If a team is really dominant (on paper) they seem to stick to their plan and continue to create a similar amount of chances even when ahead.
It’s also interesting that the total amount of goals scored has no clear effect on the future probability of scoring. Something can seem like an ‘open game’, but that’s mostly in retrospect, as it has little predictive value. Finally you can take this one step further because the probability of a red card occurring isn't fixed either. It’s heavily influenced by:
- Time. Most red cards occur late in the game: 52%
- Goal difference: the chance of receiving a red card somehow increases by about 50% when a team is trailing by one goal. On average this causes a 14.4% deviation.
At this point I’m really stretching my data though, and as sample size is becoming a problem that’s as much detail as I’m daring to go into.
The full picture looks like this (the size of the arrows roughly corresponds to the strength of the effect):
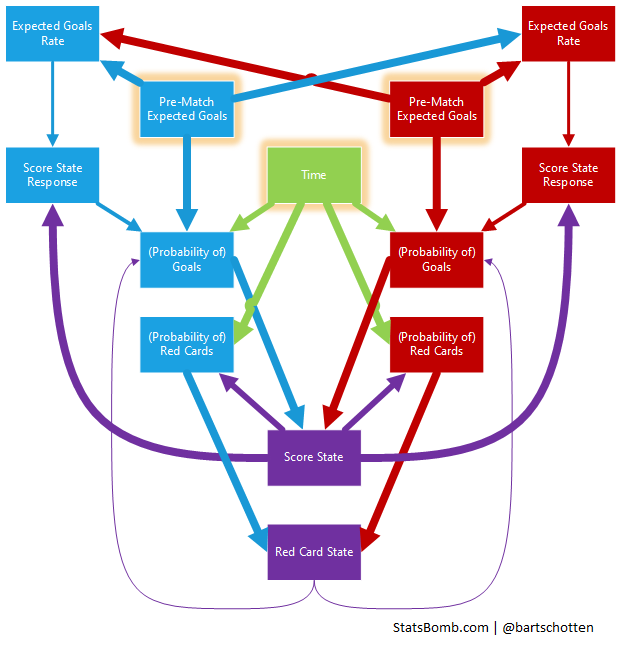
To test this I've built a little “simulator” based on the underlying numbers. It works by taking only initial ExpG values and running through the match in a number of iterations in which the game state influences the scoring probability and the probability (potentially) influences the game state.
It does seem to produce reasonable results, although the jury is still out on whether it’s a significant improvement upon Poisson. As far as betting goes it does have the potential added benefit of being able to quickly run some numbers as the state of the actual game changes (for example after a red card).
*For example: to see the effect of goal difference, the performance I measure is relative to pre-match ExpG and after correcting for the influence of time.
Radar Love: The Three Best Players in the World
Since I started writing about players last summer, I have wanted to get better at doing data visualization. I’ve loved working with data for two decades now, but while comfortable with a database or a spreadsheet, I am D-U-M-B when it comes to anything art-y. Thankfully, there are these things called books, and people like Nathan Yau and Edward Tufte who write about the art and science of visualization.
I’m still a complete and utter novice, but time spent learning has made me just good enough to steal some pretty things and start adapting them to football.
Radar Charts
A couple of months ago, Orbinho linked a big list of data visualization award nominees. I saw it and immediately thought “Sweet! That should work for football as well.”
Ah, but how?
Most football stats are per game or per season, which makes it tougher to compare guys with different playing time…
*Does a couple of months work*
Aha!
What if we normalize most of the stats by percent or per 90? So that’s what I did.
Ballon D’or 2013
Regardless of my feelings about subjective awards (I generally loathe them, especially in football), the Ballon D’or made for an interesting set of players to talk about.
For once in my pieces though, instead of just talking about player production… we can look at them. The charts below are based off stats for the completed 2012-13 seasons. Obviously that doesn’t line up perfectly with the silly award voting, but comparing full seasons makes waaaay more sense than comparing performance over a calendar year.
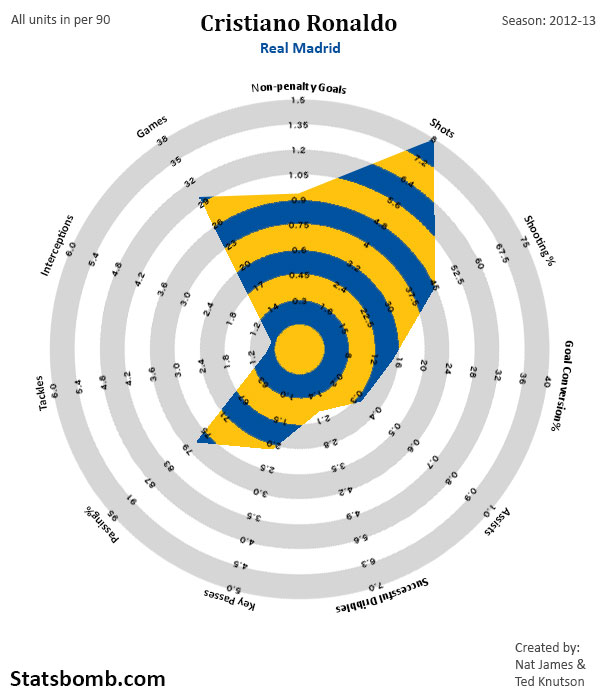
Ronaldo’s shot stats from this season are the boundary for the shots axis, meaning he has the most shots per 90 of any player in the database. In fact, of the 4.5 or so seasons of data I have access to, Ronaldo has all five of the top 5 sports in shots per 90.
I'm surprised he hasn't kicked his leg off.
Luis Suarez is capable of shooting a lot, but no one even approaches Cristiano Ronaldo. One of the things that surprised me is how low Ronaldo’s dribbling rate is, especially compared to his fellow nominees. My brain is burned with an image of Ronaldo that involves ridiculous stepovers and fast feet, but his dribbling at Madrid has never been nearly as high as what Messi and Ribery produced last season.
Additionally, that 1.88 number from last year is the lowest in the data I have, and down almost 1.5 dribbles per 90 from his 2009-10 campaign.
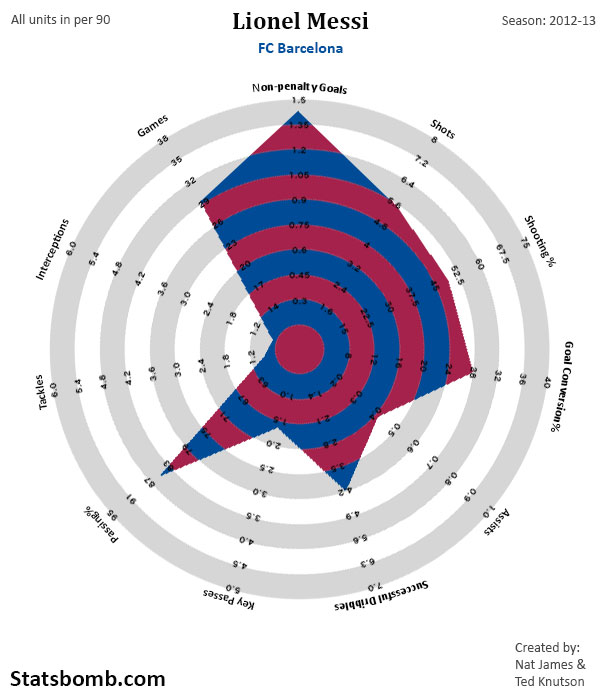
As you can see in this one, Messi’s season last year is the Non-Penalty Goals per 90 boundary. It’s the best in recent times, and possibly the highest in a European big league in the modern era. Messi creates a ton of shots, is good at putting them on target, his goal conversion is great, and he’s an outstanding dribbler.
The area covered in the scoring areas on his radar chart is massive.
From a statistical standpoint, this season was Messi's finest ever. Add the goal and assist rates together, and you see his scoring production was 1.85 per 90 minutes across an entire season, a number we may never see again. Not good enough to win the Ballon D'or though... Subjective awards are still stupid.
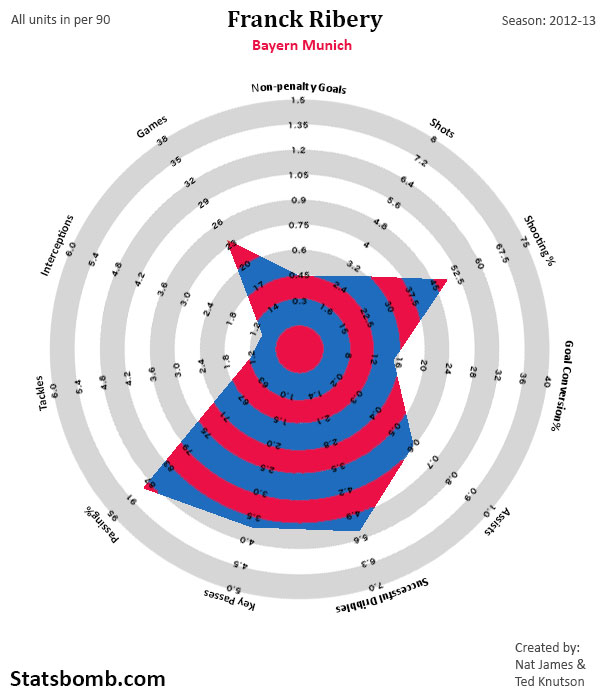
Ribery presents a fascinating contrast to the top two players. Messi and Ronaldo profile quite a bit alike, in that they are high-scoring shot monsters. Ribery is clearly something else. While his goal scoring rate is quite good for normal wide players, and his accuracy and conversion rate are also good, it’s in the passing and dribbling stats where Ribery shines.
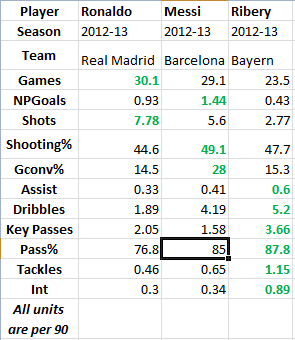
That assist rate is among the best in Europe, and both Successful Dribbles and Key Passes are as well. Ribery’s different role causes there to be completely different areas covered in the chart versus the other two. Meaningful? Maybe. Cool? Certainly. To compare and contrast, this is what the stats look like in basic table format.
Next Steps
Now that I have the template done (and huge thanks to Nat James for helping me create that), we can churn these out fairly regularly with updated data. Expect to see a snapshot or two of interesting players from each week on the basic template, either on the site or on our Twitter feed.
Another thing that I will start to explore soon are position-specific templates that help compare key stats for spots on the pitch. This basic one works reasonably well as is, especially for attackers, but there are plenty of other stats you will want to look at for defensive midfielders, fullbacks, defenders, etc, and I think we can find new templates to emphasize those.
Feel free to leave feedback on them in the comments or on Twitter. It’s taken a plenty of studying and hard work to get here, but I feel like maybe we’ve created (or more appropriately, “adapted”) a new way of looking at football stats that will be both approachable and useful for casual fans and analysts alike. If nothing else, you'll see more pretty pictures on the site. --TK
Midseason Transfer Shopping : Liverpool Midfielders

I left off yesterday promising to do statistical shopping for players with profiles like Andrea Pirlo and Steven Gerrard. I did this because Joe Allen – yes, that Joe Allen – actually profiles similarly to Sergio Busquets and is already on the Liverpool roster.
This isn’t to say that Joe Allen is as good as Busquets. He probably isn’t. But when he plays a football match in the English Premier League, the stat machine spits out numbers shaped like Busquets, almost as if it were a statistical Madame Tussaud’s.
It’s unlikely that they need a second Busquets at Anfield, but another Andrea Pirlo is always welcome, so that's what we're shopping for today.
As noted yesterday, it’s harder to find players in the Pirlo mould than the Busquets one. Aside from Gerrard, the tight filter on Pirlo’s key performance indicators only left me with six other players of interest across the big five European leagues. Two of those are definitely too old (Guti, Pizarro), a couple are definitely not moving (Arteta, Modric), and the other two we will talk about in a minute.
First, some rules.
1) We are searching for players 28 or under. You can get away with having a slightly older limit here because this role takes a bit less of a physical beating than forwards and the like, and the age curve for midfielders runs longer. This role is a mix of thoughtful as well as physical.
2) We are shopping for Liverpool. Despite my #secretfan status of this team and their approach, they would be unable to lure first team starters away from huge clubs. We’re shooting for realistic midseason targets here, so not ones that cost £40M or play for Real Madrid and Bayern Munich. We’ll save that sort of shopping for the summer time.
One of the things that makes the shoes of Pirlo and Gerrard so hard to fill is that they are good at almost everything. We are shopping for players who can tackle, have a high passing accuracy, hit accurate long balls regularly, and still have the ability to rack up key passes (or in layman’s terms, to play passes that put their teammates in good shooting positions). Regardless of potential, there are very few players that actually do this.
To help add to the talent pool, I loosened the key pass requirement a little. The players below still post very good numbers, but are not quite as good on the offensive end as Pirlo.
One filter I did not decrease is the long pass stat. The reason for this comes from how Liverpool play. You really want a long passer to distribute the ball quickly to the wings, where Sturridge, Suarez, and Sterling will likely be waiting. Fast transitions are a huge deal for LFC now, and a midfield general who could even improve that area over current personnel is a requirement.
Target Number 1) Ivan Rakitic
Wait, WHAT?!?
I go on and on about needing a Pirlo-type player and the first target on the list is an attacking midfielder with 8 goals and 6 assists? Snake oil!
Trust me, there’s a point to this. For starters, go to Rakitic’s WhoScored page and look at the positions. He doesn’t always play as an attacking mid for Sevilla this year. Additionally, Rakitic was one of only two players to fully match the similarity score test for his 2011-12 season, before I loosened the filters. He is perfectly capable of playing deeper in the midfield and still producing fantastic numbers.
![]()
Only 25, Rakitic is extremely versatile and capable of producing all across the midfield. This is incredibly useful for Liverpool, as it would let him fill in for a number of different, more limited midfield players currently on the squad.
Coutinho is out and you need someone to play in the hole? Call the Rac Attack! Stevie G is knackered and in need of a rest? Call the Rac Attack! Henderson takes a knock and you need a player who can run and do basically everything in midfield? Rac! Attack!
Most people likely view his attacking midfield production as the thing that makes Rakitic most valuable. My perspective is, due to the paucity of players capable of playing a deeper playmaking position at his exceptional level, that will be Rakitic’s most useful long-term role for almost any buying club.
Verdict: Rakitic is having another great season, but it’s almost certainly time for him to move to a bigger club than Sevilla, either now or in the summer. He’ll also only have a year left on his contract in June, and so all of the leverage will be with the player.
The actual cost will be an interesting one – most clubs in Spain are known to have money problems, and good attacking midfielders aren’t that hard to find in Europe. Deeper lying mids, however, are much rarer and more expensive. Given the contract situation, f he gets valued like an attacking mid, then £13-16M probably still makes sense. In reality, I could see him still having a lot of value even beyond £25M.
Target Number 2) Luca Cigarini
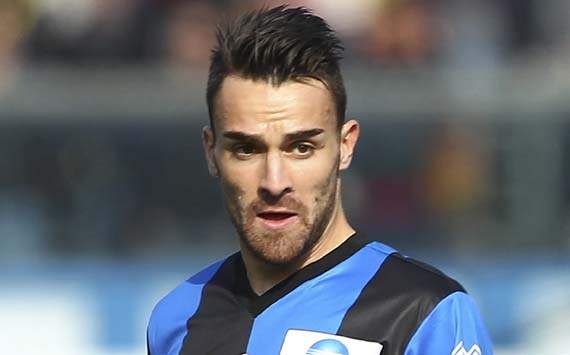
This past summer when I was writing about interesting players under the radar, I discovered Cigarini and described him as a “poor man’s Andrea Pirlo.” That was back before I had multiple seasons of data, and also before I understood just how rare players who produce like Andrea Pirlo actually are. “Poor man’s” doesn’t seem nearly as apt now that I’ve done the research.
This is a player who is so underrated, the first highlight video for him on Youtube is six years old!
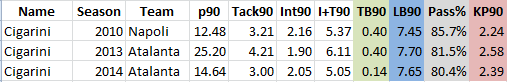
Cigarini is the other guy who matched the similarity scores before the filter was loosened, and he has three seasons so far of Pirloesque production. Of the players we are looking at, he also generally has the highest tackling numbers, but his passing accuracy has suffered a bit while playing at a lesser team (Atlanta).
He had an extremely hot start to the season this year and was tied for the league lead in assists with Totti for quite a while, but has hit a dry patch. That said, he’s still tenth in the current WhoScored rankings for SerieA and the only midfielders above him at the moment are Arturo Vidal and Paul Pogba.
Directly below him are Kevin Strootman and Miralem Pjanic. Cigarini is for real.
Verdict: Cigarini was allowed to make a permanent move to Atalanta this season, as Napoli decided they were not interested in full ownership of the player. This was baffling to me at the time, and given Napoli’s struggles in central midfield, is even more baffling to me now. Any team looking for a deep-lying midfielder that can disrupt opponent attacks as well as make great attacking passes, should be looking at Cigarini.
TransferMarkt also lists his contract as up in 2015, which means there will only be a year left on it this summer. He’ll be 28 at that point, but as noted above, this is a role where players can still thrive into their early 30s. He’s also probably cheaper than Rakitic (and definitely would have been last summer) because you have to be a crazy football hipster or data geek to care about some random guy who plays for Atalanta.
Target Number 3) Ever Banega
People who pay attention to La Liga know who Ever Banega is. The stories that come with Banega are already legendary, and he’s only 25. According to Sid Lowe, back in 2010 Valencia tried desperately to get rid of Banega, but no one wanted him. Six months later, he was their best player.
In 2012, he suffered a broken leg when he tried to stop his own rolling car with his foot.
Banega is… complicated. He’s also really good at football. Though he moves around the Valencia midfield quite a bit, his best role is probably as a defensive or central midfielder. Back in 2011-12, he put up these numbers in a fairly shortened stint.
![]()
The problem is that his defensive stats haven’t even come close to that the last two years. Seeing stats like that drop off after a major injury would give me serious pause in buying a player with such a colourful history. It might be that the stats have dropped off due to a role change, but there’s a statistical red flag right there someone would need to override to make this a buy.
However, there’s another Valencia player who has produced very well this season.
Target Number 3.5) Daniel Parejo
Originally part of the Real Madrid youth system, Parejo first appeared extensively in La Liga for Getafe. Valencia bought him in 2011 for a rumoured 6 million Euros, but seemed to quickly fall out of favour. Still only 24, Parejo has seen quite a bit more playing time in the last two seasons, and this year has put up these stats.
![]()
Tasty! Defensive numbers last season were similar, but it’s the key pass numbers that have pushed him into consideration. It’s an open question of whether he can continue this for an entire season, but Parejo is young enough that he’s still improving, and his past production wasn’t far enough removed from this that I’d be worried about a huge drop off.
Verdict: He’s signed until 2016, so there’d be no player leverage for a move, but he’s practically unknown as well, meaning he could go fairly cheap. Valencia signed him for 6M euros or so – a move in the £10M pound range could be possible. It’s a gamble, but not a huge one in my opinion.
Conclusion
Replacing Andrea Pirlo or Steven Gerrard is hard.
Out of 14-15000 midfielder seasons across the Top 5 leagues in Europe since 09-10, we ended up with a single digit number of guys who fit the stats profile.
Statistical production doesn’t provide the final verdict on any player, but they do provide a really good starting point when doing transfer shopping, especially when you have some idea of the production you are trying to replace.
The first step is finding interesting targets.
The second step is spending an awful lot of time getting to know those players on film, and learning whether they are good risks or not.
If you are looking for the full package of production and also looking for players who can be fixtures in a midfield for the next five years, I’d make a run at the players listed above.
However, there are other young players I would definitely take a closer look at if you want to loosen your offensive creation requirement. Guys like Udinese’s Allan (23) or Feyenoord’s Jordie Clasie(22) should be intriguing options for the right team.
But for Liverpool - right now - these would be the ones.
Data This is the list of potentials I looked at when compiling this piece.
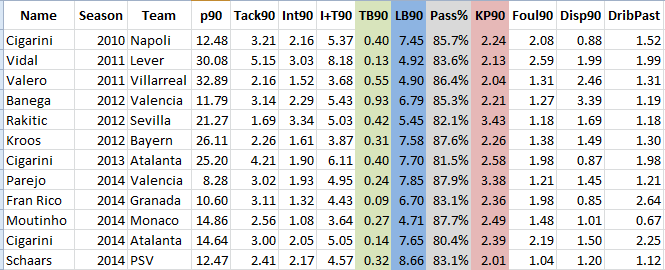
(Click for a larger version)
Notice Vidal putting up jawdropping defensive numbers at Leverkusen at age 23, on his way to becoming one of the most complete midfielders in the world. Eternally underrated Borja Valero is there (now at Fiorentina), as is Bayern’s Tony Kroos (all of 22 that season). Then you hit the current season with Parejo, Fran Rico (no clue), Moutinho, Cigarini (again), and PSV’s Stijn Schaars(30) highlighted. I would place a fairly large wager that Moutinho has looked this good for years, but there isn’t any Portugal data in the public sphere to prove it.
Data Appendix
P90 - Total minutes played in a season divided by 90.
NPG - Non-Penalty Goals
NPG90 - Non-Penalty Goals Per90
ShAcc - Shooting Accuracy (multiply by 100 to get the percent)
Sh90 - Shots per 90
SOT90 - Shots on Target per 90
GConv - Goal conversion rate. (Multiply by 100 to get the percent)
A90 - Assists per 90
GA90 - Non-Penalty Goals + Assists per 90.
A better measure of overall scoring contribution.
Drib90 - Successful dribbles per90
KP90 - Key Pass per 90
TB90 - Throughballs per 90
Pass% - Passing percentage.
Tack90 - Tackles per 90
Int90 - Interceptions per 90
Note for Mike Goodman and Nikos Overheul: Have you stopped trying to break your own arms by patting yourselves on the back about Rakitic yet?
Smart Use of Substitutes Can Make A Difference
Following on from Daniel Altman’s excellent piece on the scoring rate of substitutes I thought I would undertake my own analysis on the impact of substitutes.
The methodology I will use is slightly different to that employed by Altman in his article. I will use the Big 5 European leagues for last season (2012/13), and I will study the goal scoring rates for all players that scored at least 6 league goals last season.
The use of this filter gives me a list of 268 players that scored a combined total of 2,782 goals in 617,331 minutes of playing time. This equates to an average scoring rate of 0.41 goals Per 90 minutes for our sample of players.
At this stage it is a well-documented fact that more goals are scored in the second half of games than the first half, and the apportionment in the Big 5 leagues last season was no different with just 44% of all goals scored in the first half and 56% in the second half.
The following is the distribution of goals in 5 minute time intervals for the 5 leagues last season:
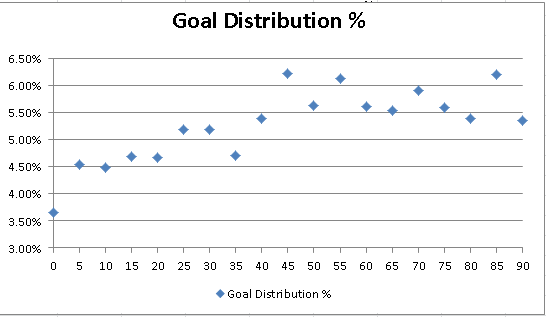
We can see that, generally, the goal scoring rates increase in line with the time elapsed during the match. For my purposes, the minutiae of the goal scoring rates isn’t important, instead we just need confirmation that this trend does exist in my data sample.
In his piece, Daniel Altman found that forwards coming on as substitutes scored at a higher rate than starting forwards. But when we consider that more goals are scored in the second half than the first half then this is no great surprise. Substitutes will spend a greater proportion of their playing time in the second half (when goal expectation is higher) compared to the first half than a starting player.
So what do we take from this?
The fact that substitutes have a higher scoring rate means that you can’t directly compare Goals Per90 figures between players that regularly start and those who make frequent substitute appearances. Very simply, the substitute will have his numbers inflated and we would expect his Per90 numbers to drop in the event that he was handed a starting position.
However, Altman didn’t stop there and he found that “fatigue among forwards was a more powerful force than fatigue among defenders”. That sentence struck a chord with me and I wanted to investigate the general phenomenon of fatigue in footballers a little further.
Hierarchy of Goals Per90
We have established that the longer a match goes on the greater the goal expectation. This is one of the reasons why substitutes score at a higher rate than starting players. So, by extension of this logic we would therefore expect players who are substituted to score less Per90 than players who played the full 90 minutes.
Not only would the substituted player be swimming against the tide of playing at least as many first half minutes as second half minutes when the goal expectation is at its lowest, but the fact that he is substituted may also indicate that he hasn’t played a great game thus far.
That second suggestion certainly won’t be true all the time. The player may be injured, withdrawn for tactical reasons or just tired but it seems reasonable to assume that some of this cohort will have irked the manager enough with their performance to be substituted.
Even ignoring the suggestion that the substituted player has been having a less than stellar performance, due to the increasing goal expectation it is reasonable to assume that the hierarchy of Per90 goal scoring rates would rank as follows:
- Substitutes_On
- Full 90 minutes Players
- Substitutes_Off
Now we're finalised our hypothesis, how does that compare with what actually happened last season?
Each game that our 268 players took part in last season was divided into the 3 categories: Substitutes_On, Full 90 and Substitutes_Off and I totaled the number of goals and minutes that the group of 268 players as a whole racked up in each category.
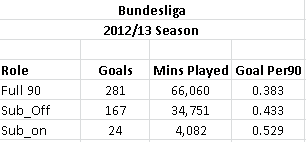
Big 5 Leagues 2012/13
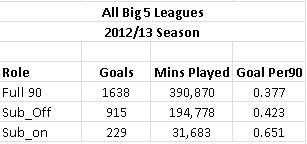
As expected, substitutes coming on scored at the highest rate of our three groups. This group scored at a clip of 0.65 Goals Per90, however players that played the full 90 minutes actually posted the lowest Per90 numbers of 0.38 with the players that were substituted off sandwiched in between at a rate 0.42 Goals Per90.
I think this is a super interesting finding and it appears that Daniel Altman was spot on with his suggestion of fatigue being a big issue in the rate that forwards score goals. My sample doesn’t specifically just include forwards, but as it includes the leading goal scorers it will obviously be forward biased.
It looks like the fatigue factor is so strong that it is even able to overcome the fact that more goals are scored in the second half than the first half. We have shown that a player who starts the games and is withdrawn scores at a higher rate Per90 than a player who completes the full 90 minutes.
When you think about this, it is common sense. Players tire and it’s better to replace them with fresh legs, but I’ve never seen the impact of tiredness quantitatively assessed before. I have no doubt that clubs and organisations like Prozone have data that records the physical drop off in player performance due to fatigue but I am surprised that the impact is so strong for goal scorers that it outweighs the benefit of playing the entire second half of a game with its increasing goal expectation.
I’m sure that if we analysed the actual minutes that each player played and their scoring returns for those minutes we could remove the second half scoring bias and calculate exactly how much more likely a fresh player is to score than a player that has played the entire game. However, I’m going to stop short of these calculations in this article as that would require another level of data analysis.
I am conscious that the above findings are based on just one season of data, so to give me some comfort as to the integrity of those findings I looked at each of the 5 league separately to see how they performed individually.
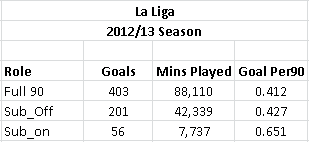
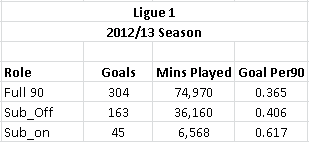
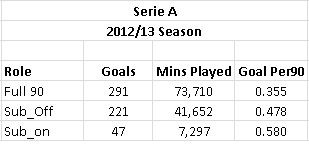
Encouragingly, all 5 of the leagues follow exactly the same trend. The substitutes coming on comfortably post the highest Per90 scoring rates. This group have the parlay of being fresh as well as spending proportionately more of their playing minutes in higher goal expectation periods of the game. The players that were withdrawn have a slightly higher Per90 figure than the footballers that played the full 90 minutes with the benefit of freshness outweighing the back ended scoring bias.
I therefore feel that we can conclude that, not only do substitutes score at a higher rate than starting players but that the players who are subbed off score at a higher clip than their teammates that play the full 90 minutes.
What are the implications of this?
I can think of at least two implications. The first is in terms of comparing players' scoring rates it was presumed that substitutes' scoring rates were inflated due to the nuances of the back ended time they spent on the pitch. Daniel Altman confirmed this in his article. However, we also need to be equally aware of players who were substituted off as they too will tend to possess higher Per90 performances than players who play the full match duration.
The second impact is much more important. Unless there is a large difference in quality between the starting 11 and his substitutes any manager that doesn’t use all 3 substitutes are giving up some expected value. And by "using substitutes" I don’t mean introducing them in the 85th minute or in injury time to simply run down the clock.
I find myself agreeing with Altman’s almost throwaway suggestion that players should be substituted early in the game. Not only do we get the boost of the player coming on having fresh legs but we also reduce the negative impact of the fatigue of the substituted player as the change is being made earlier than "normal".
I realize that managers may need to hold a substitute back to cover the chance of injury later in the game, but leaving that aside there really should be no reason why managers don’t ensure that they empty the bench in enough time to get the full benefit of the fresh player.
When are Substitutes used?
After establishing that it is important that managers properly balance the trade off between ensuring they can finish the game with 11 players and ensuring that they obtain maximum benefit from the use of their substitutes I found myself wondering how subs are currently used.
Here is the data from the first 20 Game Weeks of the 2013/14 Premier League season showing the percentage of possible substitutes that have played a minimum amount of minutes.
2013/14 Premier League (Weeks 1 - 20)
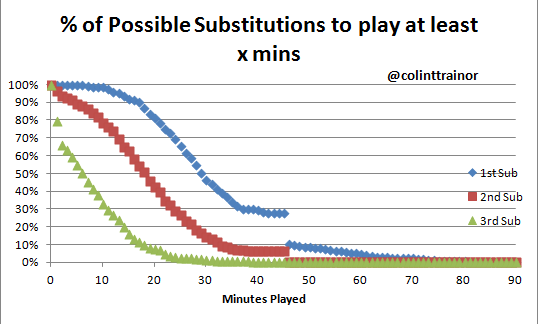
The blue plots are the first subs that were used by Premier League managers. 50% of all first substitutes played at least 30 minutes. The noticeable drop off at the 45 minute mark is interesting; and this clearly shows the reluctance to substitute a player in the final minute of the first half.
The red plots represent a team's second substitute. 50% of second substitutes play less than 20 minutes, and only approx 15% of second substitutes play at least 30 minutes.
We can see from the green plots that, in only 50% of the time does a third substitute play 6 minutes or more and 1 in 5 managers wait until the 89 minute to make their last change. In fact, during the first 20 weeks in the Premier League there was a total of 98 possible substitutes that were not used. I know the managers have a desire to finish the match with a full complement of players, but there is a trade off where this prudence has the opportunity cost of not making maximum use of fresh legs against a tiring opposition.
Other Positions
In this article I have concentrated on scoring players, primarily forwards. Perhaps fatigue affects forwards more than other positions, but it's more likely the case that we are better able to measure a goal scorer’s output and thus comment on their performances.
Would it be far-fetched to assume that a central midfielder would suffer less fatigue than a forward? I don’t think so, and I assume that the clubs would be in the position to know how much physical fatigue each player suffers during a full 90 minutes. But are they in a position to be able to quantify how much that level of fatigue actually affects the chance of his team scoring a goal or conceding a goal? I have my thoughts on this, but I just don’t know.
Am I advocating that players should be substituted on the 30th minute, the 45th minute or the 60th minute? At this stage I cannot answer that. As stated above, I would need to undertake more detailed analysis to assess the fatigue impact on a minute by minute basis to arrive at a definitive answer. However, this analysis has shown that the fatigue impact is large enough to overcome the difference in the scoring rates between the two halves, so with that in mind there is really no reason for a manager not to avail of all of his available substitute opportunities.
Indeed, the use of substitutes is just another facet to the game that good managers will use to their advantage whilst poor managers will not realise the tactical advantage that smart substitutions could be able to give them.
EDIT (16/01/14 at 10:39)- A few comments has suggested that there may be a forward bias in the players that are substituted off. Here is the split of only the starting forwards in my sample:
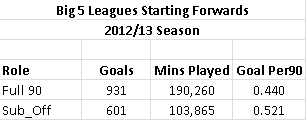
Even within this starting forwards group the players that are substituted have a higher Per90 rate than the forwards that play the entire 90 minutes. Any further granular analysis than this would involve the identifying of individual players to see how they perform when substituted off compared to when they played the full 90 minutes. But I would be concerned that we would be slicing the data very thinly at this point.
ADDITIONAL EDIT - (16/01/14 at 12:40)
To eliminate the data contamination that has been suggested may arise from players with a higher Goal Per90 figure being more likely to be substituted than those with a lower Per90 number I divided my data set into two groups.
I ranked all 268 players by their Goals Per90 figure and divided the table in half, thus creating a top half that includes all the marquee strikers and a bottom half that included players that scored 6 goals but who weren't prolific goal scorers.
Even when looking solely at the bottom half of this table (so the players that aren't prolific goal scorers), this group of players also show that they have a higher scoring rate when they are subbed off than when they play the full 90 minutes.
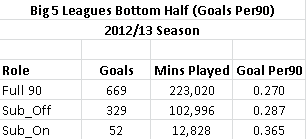
What Does a Great Defensive Midfielder Look Like?

Liverpool is the next team on tap for a transfer shopping piece, but before we get to that, we need to do some more baseline work.
With regard to Liverpool specifically, they need
a) A creative defensive midfielder.
b) A good left back and maaaaybe a good right back too.
For today, I’m going to ignore the second need with a promise that I will come back to it.
The problem here is… There are many, many midfielders in Europe.
They play all sorts of different roles, and the key performance indicators are much more diverse and complex than what we would pick for forwards or attacking midfield players. Hell, even the ones who play defensive midfield vary in role from destroyer to regista to box-to-box.
Sooo… What the hell does a good creative defensive midfielder or regista look like?

No no, not like that. I mean what do they look like statistically? *crickets chirping* Okay then, that’s what we’ll figure out today.
Defensive Midfield KPIs
What stats do we care about for defensive midfielders? Tackles and Interceptions are a given (the defensive part of “defensive mid”), as is passing accuracy. Giving away the ball from a deeper position is bad, so high passing accuracy is a must. Beyond that, things that might be important are offensive passing contributions (key passes, throughballs, but probably not dribbling), and then defensive context factors like how often a player is fouling, or being dribbled past.
I haven’t done any detailed analysis to figure out exactly which of these contextual stats matter, but I will glance over them when looking at player stats to see if anything stands out as impressive or strange. One stat that does matter for this role, perhaps now more than ever, is the ability to hit accurate longballs. Part of this is a tactical response to teams that press – you need a player in a deep-lying role who can hit your forward men with passes and start counterattacks. Another element is simply the need to be able to make longer, accurate passes due to field position.
Andrea Pirlo
Pirlo is the modern game’s prototypical regista. In fact, I find his stats somewhat difficult to wrap my head around. He does just about every single thing incredibly well. Except maybe run.
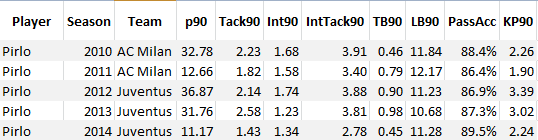
Tackling and Interception stats show he is moderately involved in breaking up the play, but his real value shows itself in the passing stats. He’s averaged 11 accurate long balls a game for as far back as I can see, while adding 2.5 Key Passes per90, .85 throughballs a game (down a bit this year, but Juve are even better than years past.
In general, .85 will be near the top of all players in Europe), and completes passes at about an 87% clip. He even had a 13 assist season at age 32. The guy simply does everything incredibly well.
I ran a very rough similarity score over the data I have access to, and depending on what filters you use, seven or eight unique names show up as players who have come close to replicating Pirlo’s production in a season since 09-10.
The only name to appear on the list for three seasons is… Steven Gerrard.
Right.
So Liverpool are basically replacing their own Andrea Pirlo (who is himself approaching 34).
No problem!
Another was Zonal Marking favourite, the incredibly underrated David Pizarro. He is unfortunately too old for consideration, as is the retired Madrid legend Guti. Current Arsenal player Mikel Arteta also throws up a flag as a potential candidate, which is both surprising and fairly impressive.
Finally, you get Luka Modric’s last season at Spurs before he moved to Madrid and … A couple of guys we will talk about as potential transfer targets for Liverpool tomorrow.
Patience!
Sergio Busquets
If Pirlo is the prototype for the modern regista, than Busquets is the mould for the cultured midfield destroyer. He is the engine that made those amazing Barcelona teams function under Guardiola. His primary skills are breaking up attacks, recycling the ball to Barcelona’s attackers, and almost never making mistakes. This is what Busquets’ destroyer production has looked like over the last 3.5 seasons.
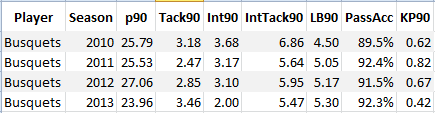
Tackles + Int averaging around 5.5 per90, 4.5 completed longballs per game, and a passing accuracy that… well, that is probably fueled by the crazy Barcelona skew. Normal people on normal teams don’t complete 90% of their passes or more.
At least I think they don’t.
Let’s find out what the data says. Not wanting to break the model concept, I plugged in the main Busquets KPIs of tackling, long balls, passing accuracy and the occasional key pass and found that there are many more Busquets type players in the data than there are Pirlos.
Useful information, that.
Names who show up include Yaya Toure before he left Barcelona, Cambiasso at Inter, Michael Carrick and Paul Scholes, Mikel Arteta (again?), Thiago Alcantara, and… Joe Allen?
*checks data furiously*
Not just once, but twice? First at Swansea and then at Liverpool?

Tomorrow:
I’ll run through a transfer shopping piece for players that Liverpool should be interested in, that play mostly in the Pirlo role. Apparently Liverpool already have their Busquets.
Stats Appendix
P90 - Total minutes played in a season divided by 90.
NPG - Non-Penalty Goals
NPG90 - Non-Penalty Goals Per90
ShAcc - Shooting Accuracy (multiply by 100 to get the percent)
Sh90 - Shots per 90
SOT90 - Shots on Target per 90
GConv - Goal conversion rate. (Multiply by 100 to get the percent)
A90 - Assists per 90
GA90 - Non-Penalty Goals + Assists per 90.
A better measure of overall scoring contribution.
Drib90 - Successful dribbles per90
KP90 - Key Pass per 90
TB90 - Throughballs per 90
Pass% - Passing percentage.
Tack90 - Tackles per 90
Int90 - Interceptions per 90
Midseason Transfer Shopping: Arsenal
One of the things that seemed to go over really well this summer were some transfer shopping pieces I did for The Tomkins Times and Arsenal Column. Instead of the usual rumour patter, or simply quoting popular names in the media to fill holes at the club, I looked at the underlying statistics for players and suggested players based on that. This allowed me to find some names that people probably hadn’t heard of, while also making for interesting and fun pieces to write.
I had hoped to start producing these in mid-December, but data collection time and then the holidays set me back a bit. Thankfully, teams have been incredibly slow at filling any shopping needs so far (except Chelsea), which means I still have time to deliver these before they became stale and moldy. Today’s topic is… Arsenal
Needs: A Forward that scores at better than a league average conversion rate. Possibly one of top, top quality, but honestly… a warm body is needed at this point.
There were other possible needs thrown out (a young center back, a right back to potentially replace the departing Bakary Sagna), but Arsenal’s primary need is exactly the same thing that they needed this summer - another forward.
The problem here is that good forwards are hard to buy. They are expensive, prickly, and come with labels like “High Maintenance” and “Dry Clean Only.” Arsenal needed a world class forward this summer too, but somehow let the one guy not named Ronaldo or Messi who has been in the Top 5 in goalscoring rate 3 of the last 4 seasons slip through their hands because they’d didn’t want to stump up £32.5M. Who, by the way, was also only 25.
I’m not sure what the math on the value equation for
NOT Ronaldo OR Messi BUT Scores LIKE Ronaldo OR Messi?
is but I’m pretty sure Arsenal answered that question wrong.
Aaaaanyway… here we are again.
The rules for Arsenal shopping are as follows:
1) Must be 27 years old or younger. I would not complain about them signing Berbatov, but he’s pretty much the only over 30 I would be in for.
2) Must be maybe, potentially, kindasorta available. Dzeko is possibly the best target man with rumors of availability and Wenger has admitted that he crushes on target man forwards more than in his younger days (I mean… have you looked at Giroud?), but there is ZERO chance City will sell to a title rival midseason. NONE. Fuggeddaboudit.
That’s it. Due to recent commercial revenue growth, Arsenal are now able to fund transfers up to the Edinson Cavani level, which leaves about five guys in the world that they could not potentially afford. Wenger has typically been very frugal in transfer spending, but Ozil’s move in the summer proves that he will spend for the right player.
[Note: All stats are current through at least Dec 30.]
Target 1) Drax the Destroyer
Rumored to have a £40M release written into his contract, Arsenal were supposedly sniffing around this past summer for a potential move in summer 2014. Mounting injuries have pushed that interest forward, but Schalke are still in the Champions League, and while they have already bought Sidney Sam as a potential replacement, he’s not moving from Leverkusen until the summer either.
Here’s Draxler’s statistical profile from the last couple of seasons. Remember, he’s only 20 right now, so earlier seasons were as a teenager.
Shot Stats
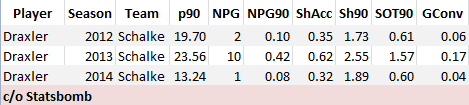
Creativity and Defensive Work 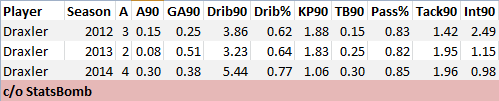
Note: All acronyms are explained at the bottom.
To me, these stats suggest that Draxler has played different roles in each season. I dug into this a bit more, and a profile from Christian Nyari says that Draxler was generally deployed on the left in 11-12, moved central when Holtby left in 12-13, and was moved out left again this year in place of… Kevin-Prince Boateng. Blech. It also suggests that Draxler is playing the wrong position now, as his production from the center was much more valuable than out wide.
It’s tricky to evaluate these stats for a number of reasons. First, Drax gets moved around a bit, which means they are not isolated to one position. Second – and maybe most important to Arsenal – none of these have him playing as the main forward. His central role in the second half of 12-13 was mostly as a 10 or second striker.
The Good When deployed centrally, Draxler can score. .42 NPG90 (Non-Penalty Goals per 90 minutes) for a 19-year-old is great. Shooting accuracy when centrally deployed and SOT90 (Shots on Target per 90) looks like a center forward. 17% conversion (goals/shots) is also really strong out of what is essentially an attacking midfield position.
The other thing that Draxler does absurdly well, both in the center and when out wide, is dribble. His current rate of 5.44 per 90 is better than anyone posted in Europe last season, and assuming my data is correct, he’s never been worse than 62% successful in his three seasons of heavy rotation. For reference, Ribery succeeded at a 51% rate last season, Messi 65%, and Suarez 37%.
This season? 71%. On 101 dribbles.
Is that even possible?
[Checks with Opta Stats guru Duncan Alexander.]
Yep, totally possible.
Woof.
Passing percentages are consistently good, and I love the amount of work he does on the defensive side of the ball, which is considerable for an offensive-minded player.
The Bad
Shooting stats and goal rate when deployed wide are dreadful. His assist rate has creeped up this season as has the throughball rate, and because of his age, you’d he say projects pretty well as a highly creative player for the future. But I would not spend £40M on those stats right now to put him out wide. The fact that he can play wide is a bonus, but you really, really want to plonk this kid in the center of the pitch and let him wreak havoc.
Shot Locations
Comparing Draxler's 12-13 shooting locations to this season, you see what the problem is. Last season, he was able to get the vast majority of his shots from prime and secondary positions. This year, for whatever reason, more shots are coming from further out, and it's obviously affected his scoring. Year after year, Arsenal tend to get shots from great locations, so expect that to change if he moves.
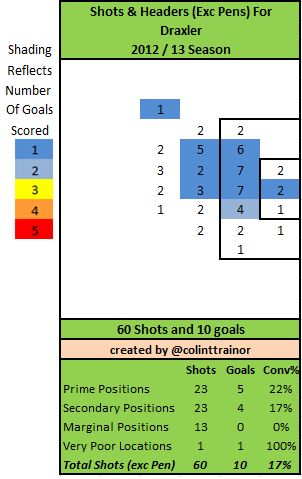
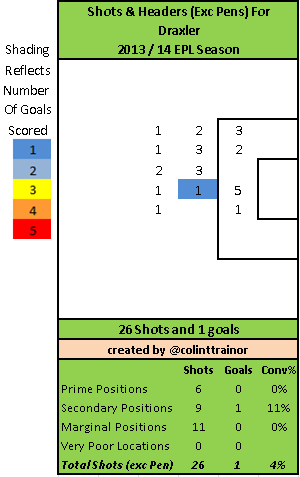
Verdict: Given where he’s played, he’s not exactly a center forward right now. However, looking at the stats Draxler posted when deployed centrally – at age 19! – you see a guy that clearly produces like a center forward can. He’s also got a big frame (185cm), so he’s not frail or a bigger injury risk than normal. I really like him as a player right now and for the future.
Would I pay £30M for him? Definitely. All the signs are there, and the market price, while high, is still acceptable.
Now, would I pay £40M for him, as rumored? That depends… am I going to get fired if he doesn’t end up being awesome?
I think he will be.
The data suggests it’s reasonably likely to happen. But that’s a fee at the very top of the food chain, and an amount you usually expect to pay for proven scorers. Here, you’re putting an awful lot of the upside of this deal on him realizing his potential. That price makes it a bit more risky than I’m totally comfortable with.
I confess… I’m hoping he moves just so we get to use this nickname regularly.
Target 2) Antoine Griezmann
Shot Stats
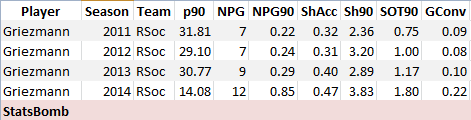
Creativity and Defensive Work
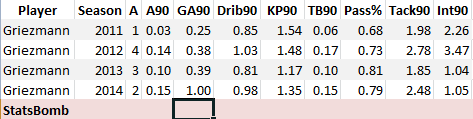
I wrote about Griezmann this summer, and this is what I had to say then.
“[His] offensive numbers are good. Over 80% passing success for an attacker is solid. A goal rate of .32 for a non-primary striker is also good. You could perhaps wish for slightly more key passes per game, but everything else is good to very good, and he’s only 22. Likely Price: He won’t move this year because Sociedad are in the Champions’ League, but if they miss out on 4thspot in La Liga, expect the bigger fish to start recruiting him pretty hard. Players with his eye for goal, plus the passing ability, plus a clear desire to work on the defensive side of the ball are to be treasured. £15-18M a year from now.”
The Good
I was not expecting this year. I’m not sure any sensible person could have. His NPG90 was solid for a young, wide forward in earlier years, but his current scoring rate puts him in the Top 10 of all forwards in Europe.
Not in Spain.
In Europe.
Shooting accuracy has ramped up in each of the last two seasons (a very good sign), shots and shots on target are also up, and the big scoring driver here is the fact that his conversion rate went from 10% to 22%. Is that sustainable? I have no idea – Luis Suarez is currently experiencing a similar increase, and no one has done the analysis to figure out if a good thing like this can stay that way.
Griezmann’s primary role is as a scoring wide forward. He can be somewhat creative, but that’s not really a strength. He is also one of the busiest forwards I have looked at on the defensive end, averaging between 3 and 4 Tack + Int combined nearly every year. That likely equates to a lot of opponent’s-half ball recoveries and great chances on the break.
The Bad
Griezmann’s current stats don’t particularly fit with Arsenal’s philosophy that everyone must pass well and be a good creator. Former Arsenal youngster Carlos Vela is the real string puller up front for Sociedad, and he and Griezmann are obviously great together. AG isn’t a great creator - he's fine, but those numbers aren't that exciting - but the finishing is now top notch.
But isn’t that exactly what Arsenal need and have been lacking? If most of the team are already outstanding passers, can’t you get away with one or two guys who just bang the ball home? Am I overthinking this?
Shot Locations
Using Colin Trainor's magical shot location database, you can look at Griezmann's past two seasons to see where he's shooting and scoring from. This year, those central locations are very strong. Last year?Pretty good too, actually, they just didn't go in.
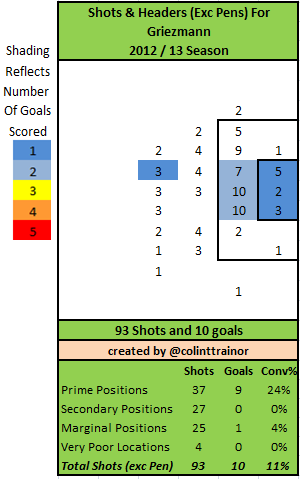
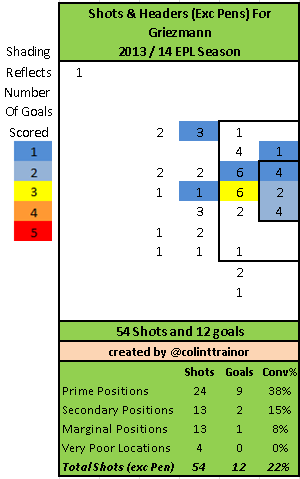
Verdict: Sociedad are out of the Champions League, but still in the running for a return appearance next season. Griezmann will almost certainly move somewhere bigger this summer, but prying him away right now will probably take £25M minimum. On the other hand, he stands a better chance of making the French World Cup squad at Arsenal, his wages are probably fairly low in Spain (a big pay rise is coming soon), and coming to Arsenal now would definitely put him in the CL next season and could help them win the title this year.
The other benefit of moving for Griezmann is that if Arsenal were to find a center forward they wanted to buy this summer, you could play Griezmann back out left (an Arsenal weak spot) with no issues at all. Easy Griezy.
Two Potential Fliers
It’s hard to find available forwards for reasonable prices, period. It’s especially hard to do so midseason. Given that this is Arsenal, I have gone to France to find two young players who seem to have a lot of promise, and good scoring stats to back it up
Target 3) Alexandre Lacazette
A 22-year old speedster who plays for Lyon, Lacazette has certainly benefitted from moving into a more central role this season. He’s young, very fast, and plays forward in Ligue 1 – seems like a perfect Wenger target.
Shot Stats
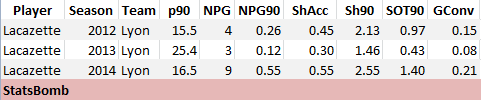
Creativity and Defensive Work
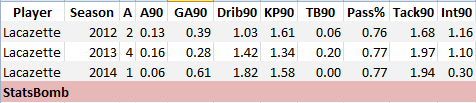
The Good
I really like his shooting stats, and he seems well-adapted to the center forward role. NPG90 is elite for his age (and nearly elite period), and shooting accuracy in two of the last three seasons is exactly what we want from forwards. SOT90 is a bit less than Griezmann or Draxler posted in their best seasons so far, but you likely aren’t paying the same price as you are for either of those guys. Conversion rate has also been over 15% in two of the last three years, including 21% this year. Put a kid with this pace in front of Ozil, Cazorla, Ramsey, etc and you could see some amazing goal numbers go up on the board.
Then imagine a healthy Walcott playing alongside him. Zoom!
The Bad
Shots per 90 isn’t quite as high as you want from an elite forward (you probably want 3+ per game), but he’s young and these can improve. Passing numbers are fine for a center forward, tackling numbers are also good, and though his dribbling doesn’t hit the insane heights you get from Draxler, he’s still pretty good and succeeding at a 50% rate this year.
Verdict
I kind of like this one, depending on price. When was the last time Arsenal had a speed merchant in the center of the pitch to keep central defenders honest and create more space for the attacking midfielders. The numbers add up to a kid who is good already and could potentially be excellent. That said, he’s not playing in as good a league as Griezmann or Draxler, so it may take a while for him to adjust. I think Lacazette would be a nice fall back choice for £13-17M.
Target 4) Vincent Aboubakar
This guy is… a project. He’s not surrounded by cultured players like Lacazette is at Lyon, but he has the physical tools to be a serious pain in someone’s ass – a bit like Christian Benteke at Aston Villa. (But maybe only a bit.)
Shot Stats

Creativity and Defensive Work
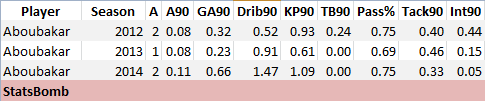
The Good
Okay, maybe I was being a little generous earlier. This is the discount bargain bin of forward shopping. You are getting a guy who can score. And maybe pass a little. But compared to the other guys we looked at earlier, Aboubakar doesn’t bring much else to the table.
On the other hand, he is good at scoring goals, and physically he’s built more in the mold Wenger has said he likes for center forwards (though I personally think that’s overrated, especially seeing how nearly every other great team in Europe plays right now).
Oh, and he’s healthy. Unlike Sanogo, Theo, Lucas for most of this season, and pretty much every other forward Arsenal have outside of Giroud. Given the last eight years or so, I think it’s impossible for Arsenal fans to underrate someone who is actually healthy.
The Bad
He’s pretty average outside of the scoring. He plays on a bad team, which goes one of two ways: either he’s creating goals in spite of them and would look even better in a good team or he’s about the same level as they are and will look out of his depth when he moves.
His defensive work rate is about the same as Adebayor after signing a fat new contract. Actually... it's worse than that. It's probably closer to Adebayor playing for the reserve team after signing a fat new contract.
We’re desperate here, people – it’s January! No good forwards are moving without overpaying.
Verdict
I hope it doesn’t come to this. Also, Wenger would not make this deal.
In fact, he’d probably just stick with what he has and hope it all works out.
Which it won’t.
Because Arsenal are exceptionally thin at forward, are still competing in the CL, FA Cup, and Premier League.
And are almost certainly not going to win any of those with a single forward who converts at a 13% lifetime rate.
Yet, for the first time in seemingly ages, the league is right there for the taking, almost in spite of the fact that Wenger and company failed to address their biggest need this summer.
Pull the trigger! Win some silverware!
Please?
Stats Appendix
P90 - Total minutes played in a season divided by 90.
NPG - Non-Penalty Goals
NPG90 - Non-Penalty Goals Per90
ShAcc - Shooting Accuracy (multiply by 100 to get the percent)
Sh90 - Shots per 90
SOT90 - Shots on Target per 90
GConv - Goal conversion rate. (Multiply by 100 to get the percent)
A90 - Assists per 90
GA90 - Non-Penalty Goals + Assists per 90. A better measure of overall scoring contribution.
Drib90 - Successful dribbles per90
KP90 - Key Pass per 90
TB90 - Throughballs per 90
Pass% - Passing percentage.
Tack90 - Tackles per 90
Int90 - Interceptions per 90