Zone Entries: The 2012/13 Champions League Final

Ever experience that rare moment where you find something, say, a spreadsheet, with information on it you barely recall recording some three months earlier? No? Well, I did. And that information involves a quirky new team and player stat called Final Third Zone Entries.

Today's article is going to focus on the Final 1/3rd Zone Entries for 2013 CL final, the method of entry and the outcome of entry.

What Is A Final 1/3rd Zone Entry?

A controlled entry into the final 1/3rd of the pitch, which is where all the magic happens. EPL Index is a popular stats site that houses all kinds of numbers on final third actions - passing%, pass volume, turnovers - and we know virtually every shot is attempted from the final 1/3rd of the pitch, so we then take a step back. What did the attacking team do to get deep into opposition territory? Was it a long pass, a carry, a short pass? Over a large sample, do any of these methods result in a higher number of shots?

Why Is It Important?

The ability to gain entry into the final 1/3rd leads to possession around the opponents 18 yard box, this possession leads to shots and goals and wins. A team really needs to have some ability to gain entry into the final 1/3rd in a controlled manner. A team could try the direct Stoke method of 'chance' balls into the box, this may method be necessary if a team has a sub-par midfield, but it is surely better to have control of the football whilst entering the oppositions territory.

What Are The Methods Of Final 1/3rd Entry?

There's a few: Carry (dribble), Turnover and passes of the long, medium and short variety. If a throw-in was used to gain the final 1/3rd (rare) then it is grouped as a pass.

Can These Methods Of Entry Tell Us Anything About Tactics?

It's early doors for Zone Entries, but if I had a Stoke Season ticket pointed to my head I'd say lots of short passes are generally a sign of a slow build-up/possession heavy teams.

Long passes could be the sign of a long ball team, or as with medium passes, it could be a sign of a good counter attacking tactics.

Carrying the ball into the zone is either due to outstanding skill when faced with a set defense, but it's more likely to be down to quick, skilled forwards launching full or partial counter attacks.

Turnovers are pretty important. The attacking team regains possession in the crucial final 1/3rd and the oppositions defense is likely not in a correct defensive position.

Are There Any Examples Of Previous Zone Entry Work?

Yes, Danny looked at zone entries first (link) and I looked at them for Man City (link) and Spain (link). I'm almost done with setting up a framework for recording Zone Entries, and it is something Danny and I will be recording for every Man City game next season. It's also come to light that a regular of StatsBomb has been recording their own Zone data for the MLS. Guess who?!

That recording of data should, hopefully, yield some cool info on teams' preferred method of entry and give us a baseline success rate of each type of entry. We will also find out who is 'driving the bus', as the 'Mericans say. A single season should give us an N of ~3700 to 3900 zone entries. It'll probably tell us some cool things about team tactics and how teams behave at certain game states.

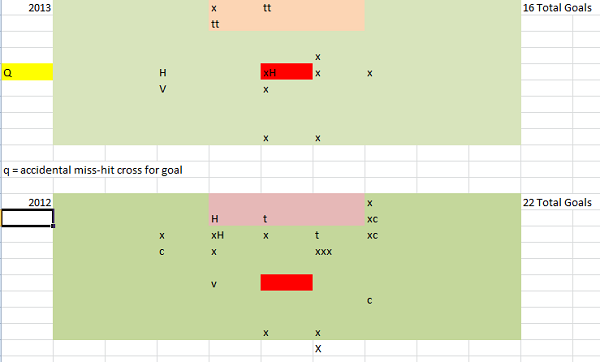
Let's get started on the Champions League Final

Zone Entries


Team Carry Turnover Long Pass Med Pass Short Pass Total
Dortmund 12 3 9 11 6 41
Bayern 7 6 13 15 6 47

This is the basic data. I would normally post the success and failure rate of each entry, but for clarity I will only post succesful entries today.

The method of controlled entries varies for each team. Bayern seemed to employ a quick and direct tactic against Dortmund which relied upon medium to long passes to spring Robben and Ribery on counter attacking raids. Bayern also had more success in turning the ball over in the final third, which usually causes havoc but, strangely, that wasn't the case for Bayern in this CL final.

Dortmund recorded fewer overall entries, turned the ball over on fewer occasions than Bayern did and carried the ball into the final third on more occasions than the opposition. One Dortmund player was driving that ball carrying controlled entry number. More on that later.

First Half, Second Half, Final 30 Minutes

Carry Turnover Long Pass Med Pass Short Pass Total
1st Half
Dortmund 4 2 6 7 4 23
Bayern 1 2 7 7 2 19
2nd Half
Dortmund 8 1 3 4 2 18
Bayern 6 4 6 8 4 28
Last ½ an Hour
Dortmund 3 1 3 3 1 11
Bayern 2 2 4 6 2 16

Here we break the entries down into halves and final 30 minute segments.
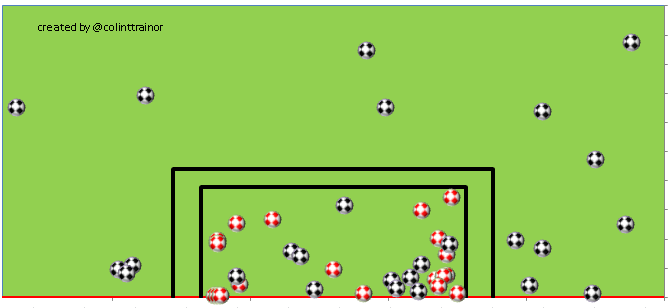
First Half

It was Dortmund who came out quicker, passed the ball with more purpose and enjoyed the early territory advantage. This showed in their final third zone entry numbers. Dortmund edged Bayern in the first half and did so with more short passes and carries into the zone.
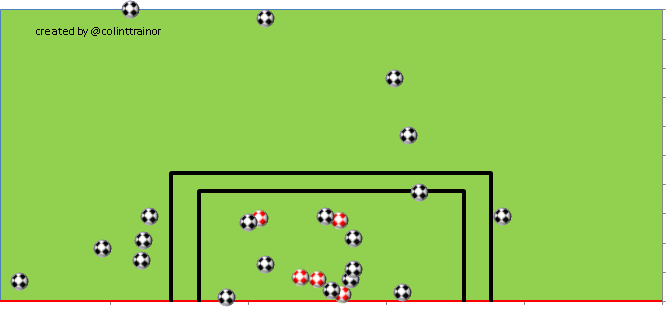
Second Half

It wasn't even close, Dortmund continued to rely on carrying the ball into the zone on counter attacks and using a mixed passing strategy. Bayern, in that second half, were by far the better team with 10 more controlled zone entries and Bayern achieved this using every method available: carries, turnovers and a mixed passing strategy.

Watching the game back, Dortmund definitely seemed to flag and run out of ideas in that second half.

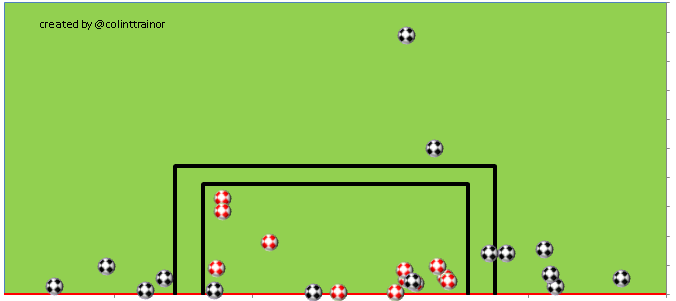
Final 30 Minutes saw 3 goals scored, but really it was about what happened after Bayern scored their opener: They played long and medium passes, carried the ball fewer times (less risk) and employed a pretty good defensive system, even after conceding an equalizer, that, when added to Dortmund's struggles, led to just 7 final third entries against in the last 26 minutes.

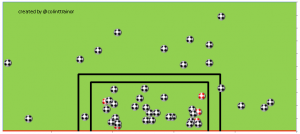
Frequency Of Zone Entries

Freq_of_zone_entries_cl_final_medium

Dortmund went off great guns at the start of both halves but the inability of Dortmund to gain entry in Bayern's defensive end in the last 15 minutes was telling. Bayern started slowly, got better, improved even more in the second half and took control of the game accoriding to the entry count in the crucial last 15 minutes of the game.

Zone Entry And Outcome

This next section features the method of entry and the outcome of that method.

Dortmund Back Out Shot Tackled Giveaway
Carry 4 6 2
Turnover 1 2
Long Pass 1 1 3 4
Medium Pass 5 3 3
Short Pass 2 1 3

For Dortmund, carrying the ball into the final third was a high risk/high reward tactic. It generated shots but it led to losing the ball often. Medium length passes was Dortmund's best shot generating tactic. A medium pass, and to some extent, carries, are probably signs of quick attacks.

Bayern Back Out Shot Tackled Giveaway
Carry 1 1 1 4
Turnover 2 4
Long Pass 8 4 3
Medium Pass 6 2 9
Short Pass 1 1 1 3

Bayern's outcome chart is a lot different to Dortmunds. Just look at the shots generated from long ball passes (mostly center back passes) and medium passes.   Both teams generated a lot of shots from medium passes (10-25 yarders) but whereas DOrtmund were able to generate shots from medium passes into the final third, Bayern generated shots by using long balls to Robben, Mandzukic and Ribery. Different tactics.

Player Zone Entries

A list of the players, the number of entries created, the method and how many shots each players zone entry created. In descending order:

Entries Carry Short Pass Medium Pass Long Pass Shots
Reus 9 4 2 3 4
Ribery 7 1 2 2 2 2
Gundogan 7 1 4 2 2
Turnovers 6 0
Robben 6 2 1 3 2
Boateng 5 5 3
Schweinsteiger 5 1 1 1 2 3
Lahm 4 1 2 1 0
hummels 4 2 2 1
Piszczek 4 1 2 1 0
Blaszczykowski 4 2 2 2
Martinez 3 1 2 1
Dante 3 1 2 1
Muller 3 1 2 3
Alaba 3 1 1 1 1
Turnovers 3 1
Mandzukic 2 1 1 0
Subotic 2 2 0
Bender 2 1 1 1
Grosskreutz 2 2 1 1
Weidenfeller 2 2 0
Lewandowski 1 1 1

I have a long standing admiration for Reus. And frankly, Dortmund relied heavily on Reus's dribbling and passing to gain the final third zone. Gundogan's dream like passing was as important as it was impressive. These two players accounted for 39% of all Dortmund entries in the game.

Hummels, strangely, is Dortmund's 3rd ranked player and Dortmund's right sided players, aided by an early second half burst, accounted for 8 zone entries.

It was a different story for Bayern. who had four players contribute 5 or more zone entries. Bayern also turned the ball over on 6 occasions which is mighty impressive, but managed zero shots from turnovers which is, well, as unimpressive as it is strange.

Final Thoughts

Final Third Zone Entries are, in my opinion, pretty important. If a team can not gain entry into the heart of the opoositions territory with a modicum of control then how can it be expected to register shots at goal, score or even win games?

I'm only guessing here, but over a large sample, the team with a higher number of controlled final third entries will likely be the teams who outshot their opponents. And what does out-shooting your opponents usually lead to? More points.

As for this specific game and it's data, it's clear that the teams had different tactical set-up's with Bayern relying on long and direct passes and Dortmund utilizing Reus' dribbling ability and Gundogan's balanced passing to gain the final third.

The frequency of final third entries is really interesting: Dortmund went off early and dominated the count for a huge portion of the game, but Bayern tactics, or Dortmund's fatigue, were important.

Bayern, ever so slowly, began to gain Dortmund's zone which led to more shots and more pressure and in the last 15 minutes of the 2013 CL final, it was Bayern who were getting into the final third zone with more frequency, it was Bayern who were shooting more.

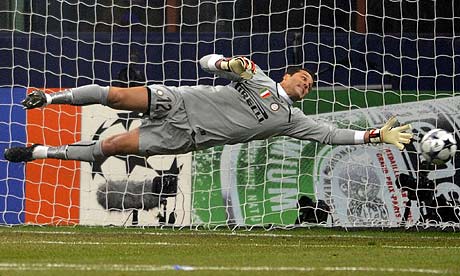
Finally, in the 89th minute, a long pass from Boateng (one of five long passes) enabled Bayern to gain controlled entry in the final third and from there, a twist, a turn and a toe-poke was all it took for Robben and Bayern to score the game winner.

Our eyes told us Dortmund were the better and more threatening team in the first half. Our eyes told us Bayern took hold of this game in the second half. The final third zone data tells us the same thing, but it tells us the about how (method) each team created it's shots, the frequency of that creation and the players who were driving the play in terms of controlled entry into the final third zone.

Shelvey and Coutinho Shots

This unplanned post has been prompted by the following tweet from Ben where he outlined how similar, with the exception of goals, the stats were for Coutinho (during his time at Liverpool) and Shelvey: BenTweet Shelvey might have had more shots on target per 90 than Liverpool's new acquisition, but there is a very good reason for the difference in scoring rates - Shelvey's awful shot placement. As always with these images, we are looking at the goal mouth from the striker's Point of View. Shelvey Shelvey Shots Look at how many shots were placed at a goalkeeper's height and centrally ,which of course are the easiest saves to make. His goal (which could be a generous dscription given the circumstances it was scored in) was the effort that went closest to the left corner, whilst he could arguably consider himself unlucky that Begovic saved the shot that was destined for the bottom right corner. Coutinho Coutinho Shots Coutinho was much cannier with his shot placement with the shots tending to be daisy cutters and / or angled into the corners. Looking at the map, you probably wouldn't have expected a return of 3 goals based on the shot placements.  However, it's clear that see that Coutinho at least looks like he has put some thought into where the shots might end up. Unfortunately based on the Shot Placement chart above it doesn't look like Jonjo Shelvey can make the same claim.   The Location of the Shots To put some context on the shot placements I thought I would use some charts created by Constantinos Chappas which shows where the two players took their shots from: Shelvey Locations Shelvey Locations Coutinho Locations Coutinho Locations When we see how advantageous the shooting positions of Shelvey were (not just in comparison to Coutinho, but in absolute terms) he's got to be really disappointed given where the shots ended up.

Near or Far Post Shooting

In a previous article which can be found here I did some research on the percentage of scoring shots and headers that a shooting player can expect to achieve given a specific shot placement. As it was my first attempt at looking at shot placements I grouped all shots together but the difficulty with stats and data is that you can never just take the first metric at face value as further analysis can be undertaken, and inevitably this second level of analysis can provide interesting insights that are missed at the higher level of data review.

In order to refresh memories, here is the scoring percentage for each shot placement zone for all shots and headers:

AllShots

Remember that we are looking at the goal mouth from the point of view of the striker. I now want to undertake some further analysis to see what other information we can learn, and to do this I am going to look at shot placement based on which area on the pitch the shots or headers were struck from. I have divided all unblocked shots and headers into three pitch areas (right, left and central) as laid out in this image below:

Pitch Sides

The boundaries of the three zones have been deliberately chosen to ensure that approximately 50% of shots in the sample fall within the Central Shots zone, with the other 50% being split almost equally between right and left sides.

Central Shots Zone

Let’s have a look first of all at shots which were struck from the Central zone.

Central

No surprise to see the general “shape” of the scoring rates heatmap pretty similar to the one at the top of the article which is for all shots.  The main difference is that the scoring rates are higher across the board, hence the increased level of "redness" in this plot.  As we are looking at the shots from the best positions (straight in front of goal) this would be in line with our expectation

Shots from the Right

We'll now cast our eyes at shots which came from the right side of the pitch as defined in the image above.

RightSide

Now it gets interesting!!!!!

The above image shows the scoring rates for shots taken from the right hand side of the pitch and immediately a clear pattern jumps out.  As expected there is considerably more blue and less red on this image than the previous heatmap due to the fact that we are now looking at attempts from less attractive shooting locations. However, that's not what is so intriguing about this heatmap.

The heatmap is extremely unbalanced, with all the red and orange zones concentrated onto the left side. The imbalance is so great that if we divide the plane of the goal into thirds, the average conversion rate for shots that hit the target in the left most third (Far Post) is 32%, the central third 7% and the right third (Near Post) is 14%.

As seen in my previous piece and logic would dictate, it would be expected that shots struck towards the centre of the goal would have the lowest scoring rate; but a conversion rate of 2.25 times higher for on-target shots aimed towards the Far Post than than those aimed for the Near Post appears hugely significant to these eyes.

Shots from the Left

And what about for shots from the other side of the pitch, the left?

LeftSide

The exact same pattern, only in reverse, emerges.

From this left side, the Far Post third (right) has an on target conversion rate of 30%, 8% for central third and 15% for the left third. This means that Far Post on-target shots from the left hand side of the pitch are converted at twice the rate of Near Post on target shots.  This ties in pretty neatly with the finding from the other side of the pitch.

At this stage I think it’s safe to conclude that on target shots towards the far post (third of the goal) has twice the success rate of near post shots.  Even without going any further, that strikes me as a pretty darn important piece of information.

Point of Order: For the rest of this piece, Far Post is defined as any shot where the ball would cross the plane of the goal line in the Far Post third of the goalmouth or wider.  Whereas Near Post is the opposite, it would cross the goal line either in the Near Post third of the goalmouth or wider. Also the remainder of this piece will concentrate on just the shots taken from the right and left sides of the pitch as I want to investigate in greater detail the apparent Near and Far Posts phenomenon.

Far Post is Superior

So what does this mean?  My first thoughts are that the Andy Gray cliché of “he should have went across the keeper there” is correct. However, I’m only going to give him half marks as I believe his assertion was based on the fact that, if missed, a shot across the keeper has a chance of being parried, allowing the attacking team to pick up the rebound and have another strike at goal.  A shot missed on the narrow side does not have this luxury. Not for one second do I think that Andy Gray was aware that on target shots to the far post are scored at rates of 2 to 2.25 times more than those shot towards the near post.  At least if he was aware of that fact then he, along with everyone else in football, kept that particular nugget very quiet.

Possible Reasons for Discrepancy

1 - The first possible explanation for this difference is that I’m only looking at shots that are on target, ie in this analysis I have ignored shots that were wide or high of the target. Perhaps looking at goals as a percentage of all unblocked shots is required as it may be more difficult to hit the target with cross shots than near post shots.

After investigation, it turns out that this was indeed the case as 68% of all Far Post shots missed the target, compared with 64% of Near Post shots.   However, that small difference isn’t anywhere near sufficient to explain the difference in goals scored as a percentage of unblocked shots.

After including missed shots, 9.9% of unblocked Far Post shots are scored, whereas the rate substantially falls to 5.3% for Near Post unblocked shots.  This means we end up with a final ratio of unblocked Far Post shots being scored at 1.8 times the rate of Near Post shots. So after ruling out the difference being attributable to off target shots we are still left with a significant unexplained difference in terms of the scoring rate for Far and Near Post shots.

2 - Could it be that goalkeepers are overly concerned with getting beaten at their near posts?

There is no doubt that it looks bad for a keeper if he is beaten at his near post, but perhaps they are trying to guard the near post at the detriment of the cross shot? At this point (with no access to goalkeeper positioning at the time of the shot) I don’t have any way to either prove or disprove this possible explanation, so unfortunately I have no other option than moving on to my next possibility.

3 - Another possible explanation for the difference is that I have so far excluded blocked shots from this analysis (as we never know where they will cross the plane of the goal).

Due to the fact that a cross shot has to travel through the central area of the pitch it certainly seems likely that shots aimed towards the Far Post have a greater chance of being blocked than those targeted towards the near post.  But is the difference in the rates that Near and Far Post shots are blocked enough to explain the near twice as often conversion differential?

This could be quite a difficult question to answer as we have no way of knowing where the shots would have crossed the goal line had they not been blocked.  However, I have been spared some potentially impossible mental gymnastics as even if EVERY blocked shot was a Far Post shot (so none of the blocked shots were destined for Central or Near Post!!) the scoring rate for all Far Post shots would still exceed that of Near Post shots. That really is something. So although that is good news, as a numbers man I have an innate desire to quantify effects and so I’m going to try to make an educated guess at the location in the goal where blocked shots were destined for.

First up, what’s our split of non-blocked shots:

ShotsSplit

As stated above, I would assume that Near Post shots are likely to get blocked less than Far Post shots, but I would assume it would be reasonable for Central shots to be blocked at the same rate as Far Post shots.

Having established this, let’s then assume that Far Post and Central shots are blocked at twice the rate of Near Post shots (this is only a guess, but seems reasonable to me and I need to pick a number).

This blocked shots weighting combined with the volume of non blocked shots results in an assumed distribution of the Blocked Shots as follows:

Far Post               53%

Central                 21%

Near Post            26%

Total                     100%

I will therefore split the Blocked shots in my data sample as being destined for Far Post, Near Post and Centrally in the ratios of 53%, 26% and 21% respectively.

At this stage, I want to point out that the only purpose of the preceding couple of paragraphs is to approximate the number of blocked shots for each of the goal zones (Far and Near Posts and Central) as the analysis cannot be properly completed with some attempt at apportioning blocked shots.

Yes, some of my assumption can be challenged but I don’t think that I can be that far out in the approximations I have used; and importantly certainly not enough to change the core findings of this analysis piece.

Conversion % of All Shots           

Armed with an approximation of blocked shots for each goal zone we can now reach a conclusion which takes into account the percentage of all shots which are scored from the sides of the pitch (the areas denoted in the second image in this piece) depending on whether the ball would have ended up Near Post, Far Post or centrally in the goal.

Remarkably, 6.8% of Far Post shots were scored, this compares with just 4.4% of Near Post shots.  As raw numbers, both of those conversion rates appear fairly small, but don’t forget that we are dealing with shots that are struck from less attractive locations on the pitch (ie away from the central strip of the pitch).

Conclusion

What I have laid out in this article appears to be quite fundamental. When shooting from less attractive positions, the player shooting has a conversion rate which is more than 1.5 times better for Far Post attempts than for Near Post attempts.

If this fact wasn’t impressive in its own right, when this is parlayed with the chance of a Far Post shot being parried and the rebound scored from then the advantage is even greater than the basic 1.5 multiple as calculated above.

Why?

The question I haven’t been able to answer properly is why this phenomenon exists in professional football when clubs have access to both better data and bigger brains than mine?

I don’t think it can be due to variance as my sample has a huge amount of shots, it contains every shot taken in the Big 5 Leagues during the 2012/13 season – that’s almost 50,000 shots.

After undertaking the work for this article the only conclusion I can arrive at is that it’s due to Goalkeeper positioning.  I have taken account of most other things, ie the difficulty of hitting the target and the apportionment of blocked shots. Could it really be that keepers are so conscious about the “Pride of the Near Post” that they over compensate?  I am unable to coherently put forward any other possible reasons.

In order to gauge reaction to this piece I sent a draft to David Sally and Chris Anderson, the co-authors of "The Numbers Game".  David made the point that a higher success rate for Far Post shots could be indicative of another aspect of the way goalkeepers play.  If they were slow to come off the line then due to basic geometry they would be more exposed to Far Post shots than Near Post efforts.

As alluded to in my preamble to this post, you can look at a facet of the game using just the headline measurements (conversion % for all shots in this instance), we can then go one level deeper into the data (slice the data by pitch sides) but even this may not be enough.  Chris Anderson made the point that I should probably further divide the data into shooting distances.  This would involve going yet another level deeper into the data. Perhaps I might further subdivide the data in a future article so that I can see the impact of shot distance on this Near and Far post phenomenon.  However, for my money that lack of further slicing of the data doesn't diminish the importance of the findings laid out here.

As an aside, this clearly demonstrates why the basic match stats information is so lacking in detail to give fans a proper understanding of what has happened in a game.  Despite using data in a format that I hadn't seen before (placement success rates), then going one level deeper, I find myself in the position where I could go another level deeper to try to complete our understanding of this quirk.

Whatever the reason, there is no getting away from the fact that that shooting Far Post seems to have a significantly increased higher goal expectation than shooting Near Post. In a game of such small margins were teams try to gain from any advantage where possible let’s see if clubs and players learn from this and we begin to see either a greater proportion of shots being fired towards the Far Post or keepers minding their Near Post just a little less in this coming season.

Links From Around The Web

Welcome to the weekly links round-up on StatsBomb.   5 Maths and Stats Guru's (link) With Nate Silver taking the FiveThirtyEight brand and his considerably sized brain to ESPN the Score made a quick list of 5 maths and stats guys you should know. Richard Whitall Takes A Look At Shot Quality And Shot Quality (link) I really, really wanted to include Cam Charron's links to quality and quantity but Whitall beat me to it with this article. Do read this article. This from Charron: Well… winning counts, and to win you need to score goals, and to score goals you need to get scoring chances. It sounds easy enough to suggest that you want to eschew bad shots and take good shots, but that isn’t the case. Sidney Crosby and Henrik Sedin’s teams don’t have high shooting percentages when they’re on the ice because they wait around for the perfect set up, they just plain set up scoring chances more than other players possibly can. With other guys, it’s different and for a guy with a buttload of goals in his career and the reputation of having a deadly wrist shot, Alexander Ovechkin is simply a player that takes a tonne of shots, and sometimes they go in. Replace Ovechkin with Bale/Suarez.   Deep Blue v Kasparov (link) A nice short story on the controversy - including the bug in Deep Blue's system - surrounding Gary Kasparov's re-match with IBM's Deep Blue. 'At the time, Deep Blue versus Kasparov was hailed as a seminal moment in the history of computer science — and lamented as a humiliating defeat for the human intellect' Interesting Stats Breakdown Of Luis Suarez  (link) There is an awful lot of information in this article from @7amkickoff, and it shows us some of Suarez's good and bad traits. I'm not a big fan of using 'big chance' but I did like the authors use of 'Sum Actions per 90'. Suarez is a hub player, he has some efficiency issues, but I believe the good really outweighs the bad in regard to the player. Soccer Passing Location (link) Gabe Desjardins: Teams have almost no chance to complete a pass inside the 18-yard box. Total passes in and of themselves do not predict a team's likelihood of winning. But a team that is able to pass into more dangerous - and lower percentage pass - areas is more likely to get opportunities to win.   Pass_comp_location_medium   Do Those Who Deny Advanced Statistics Even Watch The Games? (link) A beautiful, well written article which questions the position of those who bash advanced stats in the NFL. This is excellent from John Morgan of Football Outsiders. 'Yes, we understand your hostility, your fear, because we are dangerous. We know embarrassing facts about you. We know you watch First TakeSportsCenter; we know you watch highlights on your phone, gloss opinions from PTI, unwittingly gloss opinions from people that glossed opinions from PTI; and we know you watch sports entertainment much more than you watch sports.' The trouble with the world is that the stupid are cocksure and the intelligent are full of doubt. —Bertrand Russell Why MLB batters can't hit Jenny Finch's softball pitch (link) This is a long article which sprawls across many pages and looks at many different topics. All excerpts are from a new book by David Finch. Mainly it's about Jenny Finch, MLB batters and the science of reaction time. Finch: 'Still, Pujols and other All-Stars see -- and crush -- 95-mph fastballs for a living. So why are they transmogrified into Little Leaguers when faced with 68-mph softballs? It's because the only way to hit a ball traveling at high speed is to be able to see into the future, and when a baseball player faces a softball pitcher, he is stripped of his crystal ball.' Read More: Link We are Premier League with a full shots conversion breakdown (link) This article features a hellacious amount of research and it must have taken an age to put together. There's lots of interesting information in here, some of it I like less (CCC's) than others. But do go and check it out, it has a 20 team conversion chart from the important locations of the pitch.   Luck vs shot quality (link) Desjardins. This link has relevance to football. Bottom line: shot distance/location/quality is just a tiny sliver of shooting percentage (both for and against.) When you factor in the 33% regression to the mean we see in odd and even samples, shot quality accounts for just under 10% of team shooting percentage. I had a short, but interesting conversation with the author about this type of breakdown for football.   The Power Of Goals On Turnovers In The Final Third (link) Mark Taylor looks at the 'Rare And Significant From The Incidental And Commonplace' over at his blog. Mark focuses on winning possession differential. It's a thought provoking article on a topic that has been well known inside the game for a number of years now. The negative reaction of The Secret Footballer when told by an analyst that final third turnovers were a crucial part of a teams performance attests not only to their existence, but probably their importance too.

How do Headers compare to Shots?

In performing some of my shooting analysis work I have struggled with how best to deal with headers.

It is obvious that, on average, headers are taken from locations closer to goal than non-headed attempts on goal (these non-headed attempts will be defined as “shots” during the rest of this piece).  That alone would be enough to ensure that we shouldn’t group together headers and shots when undertaking any aggregate analysis.

The combining together of shots and headers is even more problematic when we consider that they may have different outcome profiles even when taken from similar locations.  This realisation has had some recent airings on Twitter, so I thought I would use the data that I have collected from the Big 5 leagues last season to put on record just how a header compares against a shot.

Summary Numbers

Heads1

When looking at all shots and all headers we can see that there is only a negligible difference in the amount of each type that are on target (34% of headers vs 33% of shots).  However of those on target attempts, a header is more likely to be scored than a shot (12% v 9%).  It is no surprise to see that headers are blocked much more infrequently than shots; shots are blocked approximately three times as often as headers.

So, if headers are scored at a higher rate than shots, does that mean that, given the choice we would prefer our team to be having a headed attempt at goal rather than a shot struck with the foot?

I would suggest that the answer to that question would be “no”.  The main driver of why headers are converted more frequently than shots is due to the location of where the attempts originate.

Location of Attempts

Heads2

Almost 95% of all headers are taken from the central portion (within the width of the 6yd box) of the penalty area, this compares with just 25% of shots.  Virtually no headers are taken from outside the penalty area; whereas more than 54% of shots originate from these longer distances. At this stage, it’s now easy to see why headers are converted with greater frequencies than shots.

Direct Comparisons

How would the conversion rates for shots and headers compare if we looked at like for like, ie removed the location basis that is inherent with headers?

Inside 6yd box

In6

Shots taken from inside the 6 yard box are converted at 40%, compared to less than 25% for headers.  So within these close range locations headers were scored only 62% as often as shots were.

One other takeaway from this grouping of shots is that less than 40% of headers from this extremely close location were put on target.  Presumably this is indicative of the pressure that is applied to headers that are attempted from such close range.

Other Central Locations Inside Penalty Area

InC

This time we are looking at shots within the central portion of the penalty area, but beyond the 6 yard line. Once again, shots are converted at vastly superior rates to headers.  This time the conversion rate for shots is almost double that of headers at 20% and 10% respectively.  As before, we can see the difficulty that headers have in even just hitting the target.

Sides of Penalty Area

InS

Now turning our attention to shots / headers that were struck from the sides of the penalty areas (outside the width of the 6 yard box) we can see the familiar pattern continuing as yet again shots are converted at twice the efficiency of headers.

Summary In writing this article I set out to determine how much less likely a header was to score than a shot.  Without adjusting for shot location headers are scored at a greater rate to those of shots.  However, in respect to this particular topic the devil is in the detail as we determined that when shots and headers that were struck from similar places were compared the conversion rate for headers was only approximately half of that for shots. This is a fact that should be remembered by anyone interested in the analytical side of football

Perhaps I could go as far to suggest that with shots and headers having such vast differences in conversion rates, perhaps the time has come for shots and headers to be disclosed separately in post match statistics instead of them being aggregated together as is the current norm.

Premier League Forwards 2008-13: Time On Pitch%, Shots And Goals

After a short break away from football, numbers and banging my head against the keyboard I am back. My work here at StatsBomb has mainly comprised of all things Premier League forwards and their stats from 2008-13. Think of this article (and maybe one other) as a wrap-up of all the information I have on Premier league Forwards spanning from 2008 to 2013. Right now I want to look specifically at the relationships, if there are any, between some of the numbers I have previously looked at. Do shots and shots on target begin to decay as the ToP% increases? How about scoring%? Goals, even? Let's find out. This is all about decay as time (players minutes on the pitch) increases.  

Shots And Shots On Target

  X axis=time (ToP%) Y axis=Statistic   Decay_shots_medium This chart is shows us the relationship between time (x) and shots and shots on target per90 (y). This is the full sample of players in my database with no outliers removed. The correlations for shots and ToP% and SoT and ToP% are super weak, almost non-existent. But what we can see is a slight angling of the trend line: Shots increases from ~2.75 to 3.1 as we move from left to right. Shots on target increases from ~1 per90 to ~1.2 per 90 left to right. As we move upwards in the units of x (Time) the units of y increases slightly. If I had cherry picked the sample and discarded all players who played less than a league average ToP% (44.29%) then the trend lines would be much steeper. Alas, I wanted to use the entire sample. Reasons for Increase in Shots per90 as ToP% increases? It's probably to do with survivor bias. The players that play the most minutes tend to be the best players, the best players tend to be the one's who generate the most shots and shots on target, hence the slight upward slope of the trend line. The more minutes a player plays may be a rough proxy for talent, manager trust and an ability to stay healthy. The trend line indicates -ever so slightly in this full sample of players - that the more a player plays (talent?) the more shots and shots on target he registers.

Scoring%

  Decay_sc__medium   Now we move onto Scoring% (goals/shots on target) with ToP%. From left to right we see the trend line is decreasing ever so slightly from 35% to 31%. Reasons why Scoring% decreases? I'd love to hear some reader comments on this. I'd probably need some more time to think about it, but a rough guess would probably look like this: The more minutes (ToP%) a player plays, the more raw shots on target he records. The more shots on target a player has the more likely it is that variance will wash out and his scoring% will regress toward the mean. Random Thoughts * Colin Trainor posted some excellent articles here on StatsBomb which looked at shot locations and shot placement maps (where on the goals frame the shot would have crossed the goal line) which questioned, if I understood it correctly, whether we need to sort shots on target by quality. As I was making this chart today some interesting information cropped up: Why does a player post such different scoring% numbers each year? Now, some players, like Messi and RvP are pretty consistent in terms of scoring%, this may be due to their shot locations and shot placements. But they are the exceptions, nearly every other player has their scoring% vary somewhat. This could well be down to shot location and placement as Colin stated. But what if a players location/placement varies year to year? Does this mean that the popular train of thought that a strikers main skill, that of shot location/placement, is non-repeatable and that there are other factors involved that influence a strikers shot location? If a players shots location/placement is stable year to year then why does the player suffer the dips and spikes in scoring%. If player X shoots from the same location, why doesn't he score as much? Does variance, non-skill factors, defensive pressure, goalkeeper position play a bigger role in a players season scoring% than just static shot location? If it does, it would go a long way in helping explain the variance in season-to-season scoring% and level of regression involved in scoring%. I have highlighted a couple of names on the chart above: Adebayor and Berbatov. Adebayor posted consecutive scoring% seasons of ~13%, 35% and 58%. Berbatov posted scoring% seasons of 35%, 72% (tiny sample), 47% and 35%. Are these numbers due to the lack of repeatability of locations/placements or are these two players shooting from the same locations and merely suffering through variance/bad or good luck? Or is there something we are not currently capturing? I guess what is part of the fun and debate, which is always friendly and aimed at trying to figure out what the hell is going on, is to discover just what drives stats like scoring%. What is the constituent make-up of scoring%, it's repeatability et cetera. This is why myself and Ted created this site. Any thoughts, comment away.  

Goals Per90

  Decay_goals_medium   This is goals per90 with ToP%. Again we see a weak correlation, but a slight decline in the trend line which indicates that as x increases y decreases ever so slightly. I highlighted some of the best goal scoring performances of the last years in the top right hand side of this chart. Familiar names. I think it is pretty clear why goals per90 decreases over time, it is scoring% driven. The bottom left side of this chart is really cool. It shows the groupings of below league average ToP% players and the rate at which they score goals per90. Seems to be six or seven different bands of players featured in the circled area and each group has it's own talent level curve for goals per90. I checked the data before posting and it seems sound, but my those curves are mighty intriguing.  

The Problem with Shots on Target Metric

Ask anyone to measure the efficiency of a striker today and invariably you will receive a reply which will include a metric that is linked to shots on target.  Of course any such measure will be more accurate than those which are based solely on the number of shots that a player took, however that doesn’t mean that is the best measure by which to measure the effectiveness of strikers.

That opening thought was prompted by the following tweet from Squawka Football that I read this morning

Squawka

So Adebayor had the best shot accuracy, yet he only scored a handful of goals and I didn’t recall anyone last season remarking on well the big forward was striking the ball.  Although 70% of Adebayor’s shots found the target (which is the traditional method for defining accuracy) he was missing some va-va-voom which would have allowed more of those shots to turn into goals.

At this, I dusted down my trusty database and had a look at the shots that Adebayor took last season:

Adebayor Shots

Adebayor Shots

We are looking at the goal from the view of the striker, with the two black rectangles representing the frame of the goal.  The red balls signify shots that resulted in goals, and the white balls are shots that either missed the target or were saved.

Now, we can begin to understand why despite having such a high proportion of shots on target that Adebayor didn’t overly work the scoreboard operators across the country last season.

Virtually all of his on target shots were hit straight up the central channel of the goal.  In fact I only count five on target shots which were directed towards the corners, of which two were goals.

If you read my piece from yesterday you will recall that, all other things being equal, a player can only expect to score from shots which are hit straight up the middle about 12% of the time.  That compares to 50% or more when the shot is tucked right into the corners.

I would contend that the metric of shots on target as the measure of choice for determining player accuracy is flawed such is the rarity of centrally struck shots becoming goals.  I believe it’s time to start thinking of centrally struck shots as relatively bad things, not good things; or at the very least that not all shots on target are equal.

Rafael van der Vaart and Darío Cvitanich

Here are the stats for last season for two players, one of whom is much better known than the other.  We have the Hamburg and former Tottenham Dutch man Rafael van der Vaart and Dario Cvitanich a player without any international caps who plays for Nice in Ligue 1.

VDV Comp

The two players had virtually identical numbers in terms of shots and shots on target, yet we can see that Cvitanich had a conversion record for his unblocked shots which is worthy of another planet.  His total of 19 goals was enough to see him finish as joint runner up to Ibra in the French Ligue 1 goal standings table last season.

Although the two players played in different positions, and thus I have no doubt that the types of shots that each player had were not comparable, both players would have identical accuracy ratings per the current accuracy metric.

Based on this bare statistic, that both had an “accuracy rating” of  approximately 60%, we are left to wonder why one player scored almost four times as many goals as the other. We might be forgiven for thinking that it was due to variance in that the Van der Vaart faced a series of keepers who had the games of their lives, but that thought is short lived when we actually see the location of where the shots were targeted.

Van der Vaart Shots

It’s no surprise to me to see that all five of VDV’s goals were scored with shots that were aimed towards the sides of the goal and that the whole cluster of shots that would have hit the goalkeeper were effectively wasted, as not one single goal came from them.

Cvitanich Shots

Cvitanich Shots

Now isn’t that a pretty picture?

Despite having a similar volume of non blocked shots as Van der Vaart look at how few of Cvitanich’s 47 shots were hit straight up the middle. Again, I have no doubt that the types of shots taken by the Nice striker meant that it was easier for him to hit the sides of the goals than Van der Vaart.

But this article isn’t written as a downer on the Dutch maestro, instead it is intended to highlight why simply using a shots on target measure to determine accuracy is flawed, especially give the level of data and statistics that are available in today’s football world. The above is not an isolated case either.

Pog Comparison

As before we can see that the number of unblocked shots and shots on target are similar for Reading’s Russian forward Pavel Pogrebnyak and another relatively unknown Ligue 1 player, Toulouse’s Israeli international Eden Ben Basat. However, the two players post vastly different goal scoring records from last season, and again the shot placement images for them clearly reveals the reason for this.

Pogrebnyak Shots

Pog Shots

Ben Basat Shots

Ben Basat Shots

Pretty much all of Pogrebnyak’s shots were struck towards the central portion of the goal, whereas Ben Basat’s shot placements seem almost remarkable.  The central portion of the goal, the area that leads to easy saves for the goalkeepers has a noticeable absence of footballs – there were simply no shots aimed there.

eden-ben-basat

Either Ben Basat was lucky in where the shots were targeted or else the Israeli has a serious football brain on him.  A clear pattern can even be seen in the shots that he struck off target, nearly all of them are arrowed towards the bottom corners.

Of course, by attempting to seek out the corners of the net he is going to have his share of off target shots, but with those shots which do hit the target attracting a success rate of five times that of the centrally struck shots so favoured by Pogrebnyak I know which player is likely to turn more of his shots into goals.

Parting Thoughts

In this piece I have set out why I feel that the traditional shots on target metric has its shortfalls in assessing player accuracy, I’m just not sure it’s measuring the correct thing. Perhaps in a future piece I will have a look at creating a metric that I feel better reflects the expected goals value of shots that a player took, which after all  is what the shooting accuracy metric is supposed to do in my opinion.

StatsBomb Myth Busting: Gonzalo Higuain

One of the things we’re going to do pretty regularly on the site is apply data to popular media myths and see if they hold up. Media myths or “popular wisdom” result for a variety of reasons. Sometimes they crop up in the pursuit of a narrative. Other times, they are carried down as actual knowledge from past generations. Sometimes they even result because someone, somewhere has an agenda they want to push.

Whatever the reason, there are some times where popular wisdom is correct… and plenty of other times where it is just plain wrong. Today I’m going to look at some opinions surrounding one of the hottest transfer targets of the summer:

Gonzalo Higuain.

The Popular Wisdom

Lone wolf striker.

Poacher.

Talented.

Lazy and inconsistent.

Only scores tap-ins.

Disappears in big games.

Karim Benzema is better.

"Daydreams of lollipops during corners."

Injured regularly. Can’t play heavy minutes.

Weaknesses: He can lack the ruthlessness that a world-class poacher must have.

Some of these, we have no way of knowing if they are correct or translating them directly to stats (lazy, poacher). Also, I don’t know how to define ruthlessness in Statanese, but I assume it means taking chances, which translates into conversion?

However, most of these we can evaluate through different forms of analysis. Obviously we can look at the types of goals he scores and see if they are mostly tap-ins. We can also examine his performances versus quality competition (big games), and compare him to teammate Karim Benzema. We know he had previous issues with a back injury, but can also check his playing history before and since to see whether he is playing regularly.

Big Game Gone-Zalo?

The first thing I want to take a look at is his performance in “big games.” Words mean different things to different people, but I’d say any big games sample should include Champions’ League performances, games against the best teams in the league (whoever qualified for Europe in a given season), and top tier international matches (World Cups, Copa America, and because South America is one of the toughest places to play, World Cup Qualifying). That should give us a reasonable sample of games to examine.

Over the last five seasons in La Liga, Higuain has a per90 goal rate of .89.

Over the last five seasons against Top 5 teams in La Liga, Higuain has per90 goal rate of.85.

What about the other “big game” areas? Well for Argentina, he scores at the exact same per 90 as he does in La Liga, .89. That’s a helluva rate at the national team level, and better than Messi’s there (though you assume he benefits from having Messi around).

The problem comes when you look at his Champions’ League scoring. There the per90 rate dips to .35, which is just barely acceptable on a normal team.  That’s over 25 matches of playing time, too, so it’s more than just a few matches. Compare this to Karim Benzema, who competes directly with Hig for playing time and always scores in the CL.

And yet Higuain has a better rate in the league and for his country. If the ESPN page is to be believed, Benzema hasn’t scored a goal for France in a WCQ or at Euros in like two years. Does that make him bad? Hardly. It just means variance exists (okay, and that France might be awful, but I live in England, soooo glass houses, etc).

I actually ran the numbers on RVP to try and look beyond Real Madrid at a guy who is now universally regarded as a great forward. Of course, up until three years ago, RVP was a “talented goalscorer, who was always injured.” Sound familiar?

RVP’s per 90 goalscoring rate against all EPL over the last five seasons is .72.

Against the yearly Top 5 in EPL, it’s .64.

His rate in the Champions’ League is again .64.

And his rate for his country is a data mess, so I threw it out, but if someone with a better data hookup wanted to do a tally of ECQ, WCQ, World Cup and Euros for me in the comments, that would be swell.

Anyway, regarding Higuain, two out of the three “big game” data sources are not just good, they are fantastic. His average across all big games is also fantastic. You can bash his Champions’ League return if you want, but that’s either cherry-picking or agenda-setting designed to ignore the bigger picture.

Oh, and he’s played 55 total minutes in league Classicos in the last three seasons, so that whole thing about how he doesn’t score against Barcelona? He hasn’t played against Barcelona.

Toofless?

I have to assume the ruthlessness comment from ESPNFC above relates to converting chances, as that is the traditional usage. On the other hand, if that is the case, whoever wrote that line is completely and utterly clueless. Over the last five seasons, Higuain has converted a higher percentage of his shots into goals every other player in Europe, except…

Lionel Messi.

So he’s the best in Europe, except for the guy whose home planet is Krypton.

Let’s move along.

Plays Well With Others?

“Lone wolf striker” was one of the phrases that was tossed out as potentially descriptive of Higuain. Translating this, I take it to mean the type of guy who shoots whenever he gets the ball, and isn’t that involved overall. Think Jermain Defoe.

Last season, Defoe averaged 16.3 passes per90.

Last season, van Persie averaged 29.4 passes per90.

Last season, Higuain averaged 27.4 passes per90.

RVP is a great passer, and his rate from the front is very high compared to the vast majority of central forwards. Defoe has a high completion rate, but oh my god does he have a shoot-first mentality.

To look at another team play metric, across the past five seasons, RVP and Higuain have nearly identical assist rates (.31 per90 vs .29).

I hesitate to evaluate someone’s upbringing, but it looks like someone certainly taught Gonzo how to share.

Only Scores Tap-Ins?

I looked at all of Higuain’s goals over the last two seasons on video.  Below are the shot charts on his 38 league goals in those two years.

Higuain_Goal_Locations

Legend: T = Tap-in. H = Header. C = Chip. Q = Total fluke. X = normal shot.

6 tap-ins out of 38 goals seems like a fine ratio. That leaves 32 other goals that he did significant work to earn. From watching film, he’s really good at playing off the shoulder of opposing center backs and running on to through balls from his teammates, which obviously result in +EV chances, but not because he isn’t doing anything to help create them. He also ends up offside a bit more often than you might like, but his dispossession and turnover numbers are very low.

Higuain scores with both feet (59R, 30L in La Liga), his head (7H), and has a slick little chip in his arsenal for frisky keepers.

Injury History

In 2010-11, Higuain missed 16 matches because of back problems. The next season he appeared in 69 matches across La Liga, the CL, and international duty. This season he missed 7 more matches due to “muscular problems,” but appeared in 46 matches total – that’s fairly normal. The injury issue seems overblown, as he’s available to play nearly all the time since his back trouble.

Inconsistent

Consistency is hard to define in terms of football, but for now let’s just boil it down to goal contributions. Is Gonzo the type of player who scores in bunches and then disappears for a month or two?

In 2012-13 he scored in 14 different La Liga matches. He only started 19.

In 2011-12 he scored in 16 different La Liga matches. He only started 18.

In 2010-11 he scored in 7 different La Liga matches. He started 16.

In 2009-10 he scored in 19 different La Liga matches. He started 28.

That seems outrageously consistent to me. Maybe we have to label him as “not explosive” from now on.

Well, except those two hat tricks in 2011. And the two in 2010. And the braces of goals dotted all over the place.

“Occasionally explosive?”  /*troll*

The Facts

  • Higuain is a great scorer. Over the last five seasons in the league, he has a goals rate of .89 per90, which is among the best in the world. He also has the second best conversion rate of shots to goals in Europe over that period, trailing behind some dude named Lionel Messi.
  • His “big game” scoring rate is nearly identical to his overall per90 rate in both La Liga and for his national team. For whatever reason, he doesn’t have a great scoring record in the Champions League (.35 per90 is okay, but not ridiculous like his rate elsewhere), but when you average all “big games” then he’s still one of the best forwards in the world.
  • In the last two years, 6 of his 38 goals in La Liga were the result of tap-ins. He seems to do a lot more than just score tap-ins.
  • Higuain’s passing and assist rate are nearly identical to Robin van Persie’s. He is clearly involved in the build-up play and capable of setting up teammates for goalscoring opportunities.
  • The year after his back injury, he played 69 matches. A year after that, he had some minor injury issues, but played 46. This seems fairly normal for a football player.

Conclusion

I came to the conclusion in May that Higuain and Lewandowski were probably the two best forwards on the market, and having looked at the data, I see no reason to change that evaluation. Lewa is locked on Bayern. He hasn’t been introduced in the shirt yet, but allegedly Higuain is most likely to end up in Napoli, as a great Cavani replacement.

Arsenal were thisclose to signing Gonzo. The great Sid Lowe even wrote up the details of the transfer, and he almost never gets anything wrong, so you know this was just about to happen. He would have been absolutely perfect in Arsenal’s system, and converts chances at more than double the rate of Olivier Giroud. This is the type of thing that could have made Arsenal into title contenders. If they miss out on Higuain for want of an extra few million pounds, it will be a painful oversight.

In short, Gonzalo Higuain is one of the greatest forwards in the world. It’s fine to value him as such.

--TK

Higgy Higgy Higgy, can't you see. Your dope moves, they hypnotize me.

Man City's Managerial Makeover

Over at Grantland Chris Ryan has revived his Reducer column, which is great news for people who like reading about the Premier League. In its return Ryan takes a look at the moves Manchester City made this summer and seems barely able to restrain his giddy optimism over the direction of the club. It’s a good read and a nice counterpoint to some of the less optimistic interpretations floating around here. Basically he concludes, with all the appropriate caveats attached, that Roberto Mancini’s Manchester City teams were boring:

For as renowned as some of their players were, for all the tabloid headlines, training-ground fights, and fireworks set off indoors, there was just something strangely anonymous about the team. For several years, that anonymity, compounded by Mancini's punishingly pragmatic football, was an insurmountable hurdle for many football fans. It was like we were collectively wondering, You spent all that money for … this?

And Manuel Pellegirini’s will be awesome:

I think this team finally is a team. They finally have an identity. Say what you will about slick-passing La Liga imports bought by an Abu Dhabi billionaire. At least it's an ethos.

And, that’s all fine and good, and it may well be true (can you feel the but coming?)….but inherent in that conclusion, and in a couple of other places throughout Ryan’s piece, are some widely held beliefs about what the international soccer landscape is that just aren’t true anymore, if they ever were. Image from The SunFor starters, let’s talk about this idea that Mancini’s team were this dour, unfun, clinical boring squad. Fact is, over the last two seasons they were first and second in possession time, and shot the ball the fourth and first quickest per minute in possession (MiP). In other words, not only did they have the ball a ton, they shot it at a faster pace when they did have it than almost anybody else. That’s not particularly what I think of as “punishingly pragmatic” on its face. Still though, talk to a Manchester City fan and they’ll tell you, it wasn’t so much the end result as how they got there. Watching the team, especially at 0-0, left the impression that Mancini was happy to kill off the first hour of the game, before substituting player A into role B, with tactical tweak C, and voila creating a goal through the magic of Mancini. That’s a particularly dumb strategy when your owners are perfectly happy to dive into the Scrooge McDuck swimming pool any time you ask and buy enough talent to crush lesser opponents under the weight of international superstars. The point isn’t that City weren’t dour. They probably were. The point is that there’s a general misconception about what makes a team dour. We tend to view things in binary. A team does X, which is fun, or Y, which is dull, but that’s not right and it really limits our understanding of the game. Certain traits get associated with fun, happy time football, like possession, and playing in the opponent’s half, and creating good chances. Others get associated with old, bad, boring, out of touch (English) style, things like long balls, crossing, compactness, cold rainy Wednesdays in small English towns you’ve never heard of. Here’s the quote of Pellegrini’s that Ryan pulls to emphasize the new pleasing style on its way to Manchester City.

One of the important [factors why] I am here is the way my other teams always played. I think fans of Manchester City will see a different way to how they played in the other years. I am sure we are going to play an attractive game. We will always try to play in the opposition's [half], try to be an attacking team, do what all the other teams I worked with before did.

Image from CNN
Image from CNN.com
Want to guess how good Manchester City was at doing that recently? They were second each of the last two years at time spent in their opponents' half, and time spent in the final third. This is Manuel Pellegrini, this time, making the incorrect assumption about how City played. They were dull, so they must have done these things badly. Not true. Again, I’m perfectly happy to believe that Manchester City were aesthetically unpleasant. But, aesthetically unpleasant isn’t the same as not playing in the opposition’s half, or not attacking, or not playing long balls, or any other particular statistical trait you want to attach to it. Mancini built a lethal attacking force over the last two years, it was just one that tended to look pretty indifferent while dismantling teams. As for the idea that Pellegrini is going to bring in a bunch of slick passing La Liga players familiar with his style... I’m pretty skeptical of that as well.  Stepping away from  the specifics of the situation, the idea that there are stark differences between the overall styles of the major leagues in Europe at this point is dubious. Most of the elite teams in the world (with notable exceptions in Barcelona and Manchester United) are increasingly adopting the same approach. The world is gripped by a Phoenix Suns type seven seconds or less ethos. Rather than break down defenses, teams all across Europe have decided the best shot is the first shot, the one that comes before defenses are settled in. To the extent that any of the big four leagues are immune from the trend, it’s Germany, not Spain where teams are more comfortable holding the ball and trying to create quality shot opportunities. That, by the way, is despite the Bundesliga’s two international power houses (sidebar: is it too early to call Dortmund an international powerhouse? Is that like asking –insert cool, hip indie band name here—to do a stadium tour?) fully subscribing to the shoot first, shoot fast, shoot often, mentality. Although, with Pep’s arrival at Bayern Munich, who knows how long that will be the case. That strategy, which City excelled at, was also one employed by Pellegrini in his only year at a club with resources to rival the ones he now has at his exposure. Real Madrid under Pellegirini had almost 60% possession and used that time on the ball to take an avalanche of shots, nearly 6 more per game than any other team in La Liga. They shot the ball at a faster pace per MiP than any team in England, Spain, Italy or Germany did this year. Now, to be fair, Pellegrini’s time at Malaga looks distinctly different. Last season his squad played slowly, in a style which seemed to mimic notable-exception-to-the-fast-playing-rule Barcelona. Those two teams, along with Athletic Bilbao, were the only clubs to combine a majority of possession and a shot per MiP of slower than four minutes (and these three teams are the sum of your argument for a "La Liga playing style"). Which approach will Pellegrini bring to City? I have no idea. I also have no idea how his iconic Villareal teams would profile statistically, since they were in the pre-statistic dark ages. Pellegrini may walk into City and completely change the way the team plays. He may have them hold the ball, and pass circles around teams, and play short, clever, Barcelona style one-twos. And people may swoon, and get all twitterpated over the newly revamped, pretty Manchester City. He also may not. He may keep the same Phoenix Suns-style bury ‘em in an avalanche of shots gameplan. The point is there are lots of ways to attack, and there are lots of ways to look good doing it. The assumption that because City lacked the latter, they were somehow missing the former is flat out wrong, but it’s ubiquitous. Pellegrini fell into the trap, so did Ryan, and so do most fans, but its near unanimous belief doesn’t make it true.

Links from Around the Web

Welcome one and all to a new feature on StatsBomb which will showcase some of the best articles I have read this week. I read a lot of stuff, some of it shit, some of it intelligently written that makes me feel smarter for having had the pleasure of reading it.

It's worth noting that as much as I would like to link to a 2000 word piece on the innovation and creativity of the seminal mid 90's double album Mellon Collie and The Infinite Sadness, most links featured here will be about sports or analytics. [Editor's Note: Hit Ben up on Twitter for Mellon Collie.]

Also, it must be said that I don't read everything that is published in the sports or analytics world. I will miss an awful lot of excellent and innovative writing. If I have failed to link to a really cool or smart article, please link it in the comments section below and I will feature it in the following week's round-up.

Please do send in your links - let's try and make this a community project and apologies if this weeks list is a little light. My flat is like a hotel at the moment. Time is short, hangovers are more frequent than would be advisable.

Links

Doping In Sport: The Athlete's Dilemma (link)

Interesting article that explores some of the possible reasons as to why athletes take performing enhancing drugs.

'The simplest game in game theory is "prisoner’s dilemma". In the athletes’ version, both players will be better off if neither takes drugs, but because neither can trust the other, both have to take them to make sure they have a chance of winning.'

Colby Cosh Profiles the mysterious TangoTiger (link)

From 2010 a Macleans profile of the man known as TangoTiger. Colby Cosh gives us some background information on one of sabermetrics leading figures and writes of Tango's consultancy work with MLB teams. This on TangoTiger's anonymity:  

"Take all my past and current employers, colleagues, peers and readers, and I have met exactly one person."

Look out for Cosh's reply to the first comment from a reader.

Zac Macphee takes an in-depth look at Stevan Jovetic and Man City's tactical flexibilty (link)

A detailed write up on what Stevan Jovetic's signing means for Man City and the flexibility it gives the club in terms of potential formations. I really like the 4-2-3-1 formation that Zac lays out in the article.

Soccermetrics with an alternative formulation of tempo in football (link)

Howard Hamilton takes a unique look at speed of possession - match tempo. It's an excellent article with some fresh and alternative analysis. The team with the quickest average match tempo? Stoke City.....

Watch This The full article can be found here (link). God bless them boys!

Gabe Desjardins/Hawerchuk (link)

I'm not sure if anybody remembers this but about a year ago now, James Grayson, in a moment of rare frustration at the self congratulory nature of the football analytics community, posted a really interesting tweet. It went something like this: As far as we think we have come in football analysis none of it even comes close to the work Gabe did 2 years ago.

Grayson was completely correct. Desjardins is a wizard, who along with Vic Ferrari of Irreverent Oil, was the pioneer of the hockey analytics scene. Desjardins turned his attention to soccer/football in the summer of 2010 and some 3 years later a lot of his work still hasn't been surpassed.

Anyhow, the link above is a very short article on score effects on the percentage of passes and weighted passes.

Eric Tulsky on the effects of rest on a NHL teams' schedule (link)

If Desjardins is the past of hockey analytics then Eric Tulsky, the inorganic chemist and nano technology researcher, is very much the future. In the link above Eric takes a light-hearted look at the amount of rest a team has between games and the effect it has on expected wins. If you have any free time to spare, do go and check out his archive.

Macaree on the economics of transfers (link)

This article dates back to June, but it's a really interesting article on the complexities of player transfers.

That's all until next week.

A Way to Assess One Season in the Bigs

Most football fans on these shores weren’t aware of Michu’s pedigree when he pitched up at Swansea. There was good reason. He barely had one. Even Sir Alex Ferguson stated: “2m and I’d never really heard of him. I should have a word with my scouting department.” This is the same man, however, that said Charlie Adam corners alone were worth 10m, before he passed and let Liverpool take that hit.

I’ll be honest, I don’t watch Spanish football myself, save the glimpses of it I see at Champions League or national team level. I’m one of those who hadn’t heard of Michu or seen him play either.

It would be nice to believe that Michael Laudrup did his homework thoroughly when he bought the Spaniard to Swansea City. Then you look at the 6m he’s just spent on Jonjo Shelvey and think  maybe they DO just put a blindfold on and try to pin a tail on the donkey.

At the age of 25, Michu had mostly picked up lower league experience. His scoring record at the club he was about to leave, Celta, was decidedly average. That all changed when he made it to the bigs and joined Rayo Vallecano, a team that had just been promoted to the top flight. Michu suddenly scored 15 league goals - a tally he hadn’t reached in the lower leagues with Celta in over a 100 appearances. Was it a fluke? 18 Premier League goals the following year now suggests not.

Let’s switch our attention to someone else who had his first full season in the big leagues and did well:  Christian Benteke. The Belgian was being touted around for £25m last week until he signed a new deal with Aston Villa. The prospective buyers were British, they had a load of cash on the hip, but most of all they’d all seen him play with their own eyes. This matters in traditional scouting. A lot. And so it should, but there’s no way it justifies an extra 20m odd on a player’s price. Traditional scouting should be one part of the jigsaw. A player's underlying numbers should  be part of the jigsaw too. But you have to look at the right numbers unless you want to be the next Damien Commoli.

Concentrating purely on predicting future goal tally, it’s important to strip the wheat from the chaff. Wheat is a goal scored from the central area inside the box – a goal that is repeatable. Chaff is the rest – goals from wide areas in the box, goals from outside the box – the kind of goals that only a select few are able to repeat. When you only have one season of big league data, it’s unwise to gamble just yet that your man is able to repeat goals from the chaff.

Stripping out the penalties and chaff, and purely concentrating on the wheat, Benteke is down to 11 league goals for last season. ALL of Michu’s 15 league goals at Rayo were wheat. Well over 70% of Michu’s shots were from wheat areas. Benteke on the other hand was shooting from much deeper in the chaff.

Even the fact that Michu was transferring from Spain to England wasn’t too much of a gamble as Ted Knutson has discussed here on this very site. Michu continued his shooting patterns in the Premier League. Well over 70% of shots taken in wheat areas, 17 of 18 goals scored from there too. Just two seasons in to the bigs and he’s become way more predictable.

Benteke is currently a problem. 8 of 19 goals are chaff or penalties at this stage. If someone really was willing to fork out 25m this summer Villa should have bitten hands off. Even if he repeats his goal scoring feats next season, his value isn’t going to increase in line with them – we might be talking around 30m tops. If his form takes a nosedive next year, we’re probably looking at the 15m mark.

To compare, I was poking around the numbers trying to find a La Liga prospect I’ve not heard mentioned before or indeed seen play. I found Tomer Hemed - a 26 year old Israeli international who plays for Mallorca. His wheat numbers last year were almost identical to Benteke’s.  Hemed scored 10 goals in 64 shots from wheat areas, Benteke 11 from 63. What’s more, this was his second season in the bigs. He’d scored 8 goals in 29 appearances (11 as sub) in his first. Half of those were penalties so need to be stripped out. That left 4 goals from 32 shots in wheat areas. That was a below average return first time round, but this guy has improved with playing time, even as the team took a hit and got relegated last year.

So now he’s at a Benteke level of finishing with two seasons of top flight experience under his belt. Here’s the thing. Both are no better than average at finishing where it matters. One is seen as a legitimate target for big clubs at big prices. The other may be bumming around 2nd tier Spanish next season.

This brings us nicely onto new Liverpool signing Iago Aspas. He scored one more goal than Hemed did in La Liga last year. I looked at the youtube reel for both. A couple of minutes was enough to see why Liverpool opted for Aspas rather than the Israeli. The Israeli looks like a typical British centre forward. A bustling type with a bullet header on him. Aspas looks tricky and quick – much more in keeping with the new “philosophy” over at Anfield.

Last year was Aspas’ first in the bigs too. He scored 12 goals in all, but taking out penalties and chaff he’s left with just 5 goals in the wheat at the same below-average conversion rate that Hemed chalked up in his first bit-part season for Mallorca. If Liverpool fans are expecting goal haulage from Aspas, they may be disappointed. He looks like a wide forward who stays wide - only a third of his shots are from wheat areas. The one thing that may make him able to repeat his goals from wide areas of the box is his pace. Getting that extra yard of room seems to be important for those who can repeat getting goals from here. But you still have to be able to control the finish and few are able to.

Getting a controlling handle of your striker transfers needn’t be as cereally (ahem) difficult as football clubs seem to find it year after year. To conclude, I’d be surprised if Michu didn’t comfortably reach double figures again next year, and I’d be surprised if Benteke matches his previous tally. Someone needs to take a small gamble on Hemed who’s out of contract at the end of next season, and Liverpool better hope Aspas lays on some goals to make up for the fact he’ll probably not reach double figures in the goals column.

The Enigma of Shot Placement

To be honest, I’m not sure if I’m a great fan of shot placement work or not.

It’s reasonable to assume that when a player is shooting he is aiming for the target, however more than 50% of non blocked shots miss the target.  This means that in the majority of cases the player isn’t successful in actually putting the ball where he intended. With than in mind, I wondered what there is to gain in attempting to undertake meaningful analysis due to the apparent difficulty for players to have as much influence on the accuracy of their shooting as they would like. However, I realised it would be useful to create a reference source for what actually happens a shot or header once it reaches the plane of the goal line.

It’s worth noting that at this stage I am looking at all shots and headers.  I wanted to have a large enough data sample so meaningful high level patterns would emerge.

Expectation

It would certainly be expected that a shot hit down the goalkeeper’s throat would be a relatively simple save to make for the keeper, whereas a shot arrowed right into any of the corners would be substantially more difficult to save. But just how more likely is the latter shot to score than the former? Presently I can’t put my finger on a source that will give me that answer, hence this point of reference article. As an aside, in my opinion this was part of the reason why this site was created in the first place.  Up until now there just hadn’t been a stats based site that can deliver articulate articles and data in user-friendly formats.  Hopefully that will change.

Probability of a Shot being scored

Here is a front-on view of the goalmouth showing the percentage of shots that resulted in a goal.  The plane of the goal has been divided into zones according to where the ball did or would have crossed the plane of the goal line had it not been saved:

ScoreZones

We can see that a ball hit dead centre at low to medium height will result in a goal 12% - 13% of the time (1 shot in every 8).

At the other extreme, a shot that is set to nestle in the corners will result in a goal approx  50% - 60% of the time (1 shot in every 2). For the shots in between, we can see that there is a definite pattern where the percentage success gradually increases the further that the ball is struck away from the centre of the goal.

It is also clear to see that shots struck towards the higher parts of the goal are scored at higher rates than those that keep low to the ground.

Cheat Sheet I have changed the magnitude of the above graph to create an “easy to remember Cheat Sheet”:

Cheat

The scale has been modified so that the figures in the chart now reflect how likely a shot is to be scored compared to a shot that is hit dead central at mid / low height.

The rate in the centre of the goal is 1, whereas shots into the corners are scored 4 or 5 times as often.  Shots that the keepers have to scamper across the goals to cover are scored 3 times as often as those hit straight at them.

Who knows, perhaps some time in the future we may hear a knowing pundit inform their viewers how much more likely the shot they have just witnessed was to score than one hit straight down the middle........

Significance

Not sure really, but the main aim was to create a point of reference that could be referred to in the future.

We know that players don’t miss the target on purpose, yet most shots fail to trouble the goalkeeper.  It would therefore be a tall order for managers or coaches to instruct players to deliberately shoot for the corners and there is certainly comfort for strikers (especially those short on confidence) to ensure that they hit the target. I’d wager that the next time you watch a match on television you won’t have to wait too long until you hear the commentator extol the virtues of “making the keeper work”, ie whatever you do ensure that the shot is on target.

However, if the striker had known the relative successes of shots hit towards different areas of the goal, and indeed that the success factor can increase by as much as 5 fold, would his thought process be any different?

Well, we can but hope.   Article written by Colin Trainor.  Colin can be followed on Twitter here.