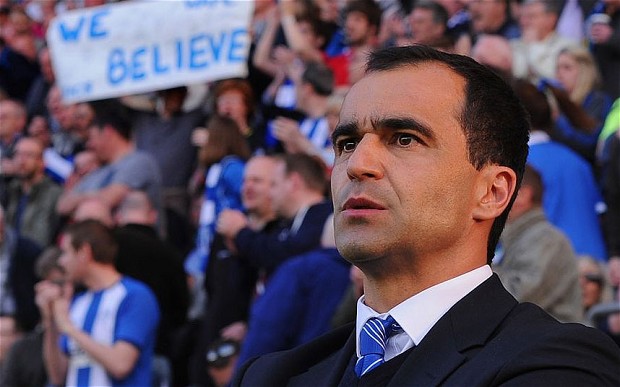
Everton finished 11th. That may not mean much to you right now, desensitized by the difficulty of maintaining long term schadenfreude (unless you’re unhealthily obsessed Arsenal fans on St Totteringham’s Day), but it’s pretty insane and has kind of gone completely under the radar (pun intentionally not avoided). In his StatsBomb preview for the 2014/15 season, Paul Riley predicted that they would finish 5th-7th. And that was pretty reserved, especially for a fan – when Everton signed Lukaku, it was seen as a declaration of intent; not to languish in midtable or, indeed, even Europa, but to compete for the Champions League. Yet here we are, a year later, with all the joys of hindsight and the destruction of a 38-game implosion in front of us. Magnifying glass in hand, we start to sift through the debris, an aching question on the periphery of our minds: Dafuq happened to Everton? The overall picture Everton’s TSR, 10th highest in the league, doesn’t present us with anything initially shocking, although they slightly underperformed according to the metric. 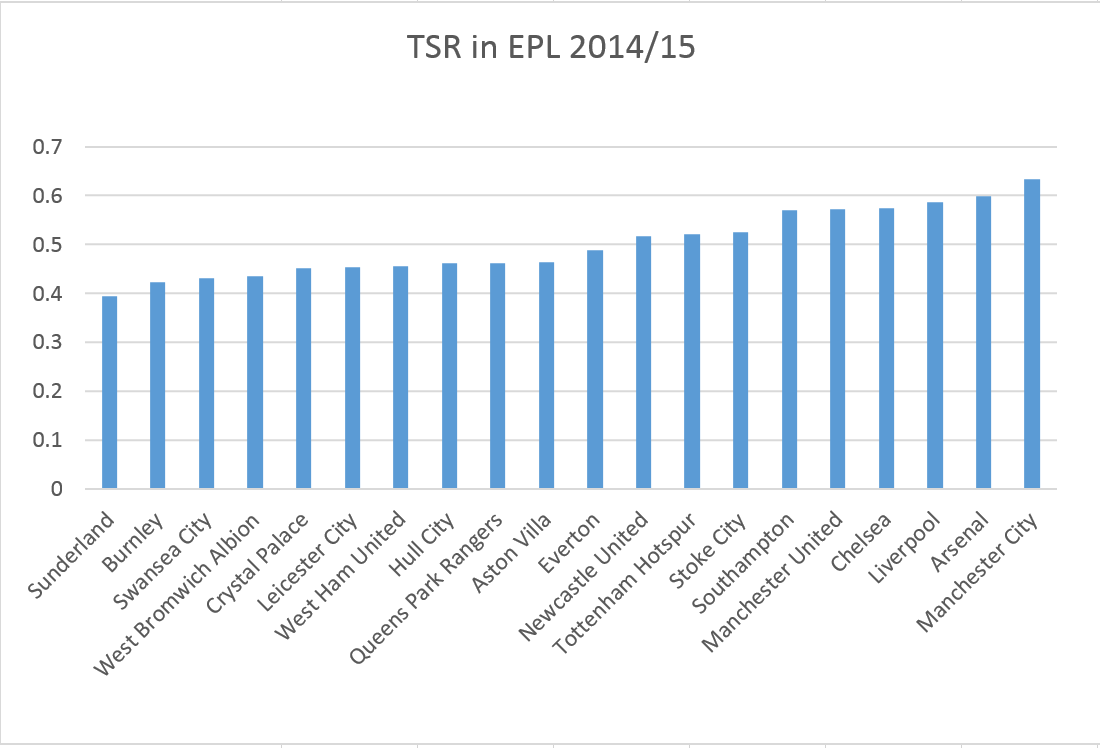 Everton’s Expected Goals Ratio ranks them 13th in the league. Their season doesn’t seem to be one of huge ExpG over-performance like Chelsea or Swansea, or under-performance like QPR, though their Expected Goal Difference (-7.7) was 5.7 goals lower than their actual Goal Difference (-2). But that should, in theory, mean that Everton’s poor (relative to last season) point performance is explainable by the model. Through separating attack and defence, we may be able to find out more about the difference between this Everton and the one of yesteryear.
 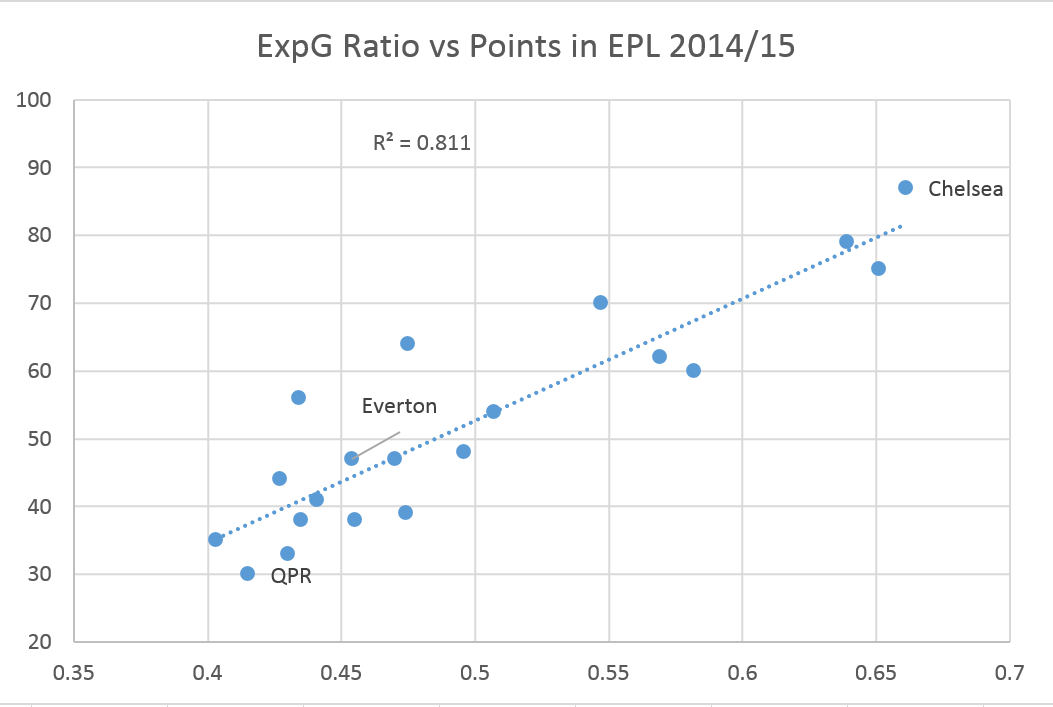 Woeful attack Everton of 2014/15 scored 13 less goals than the year before, and took the 11th most shots (471) in the league, which ties up pretty well with their league position. But, if we look at Expected Goals For, the picture drastically changes.
 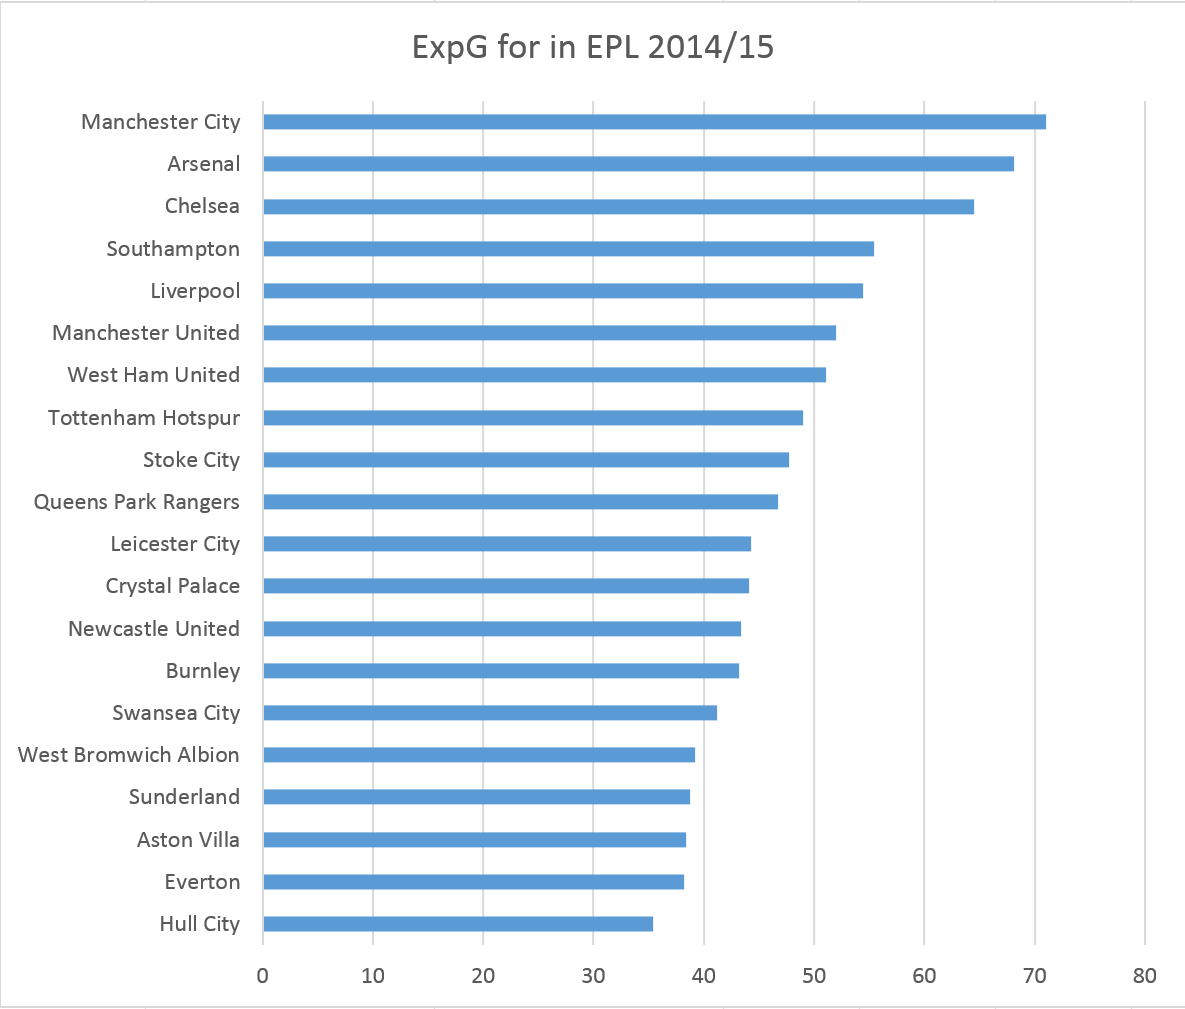 According to Michael Caley’s Expected Goals model, Everton had the second worst attack in the league last season. That’s an attack worse than Sunderland. That’s an attack worse than West Bromwich Albion. You get the picture, you understand rankings – you fully comprehend that’s an attack worse than EVERYONE other than Hull City. And that’s backed up by Paul Riley, who said, of this season, “It’s the worst attacking performance from Everton I have on record”. But, why? What about Everton’s shots isn’t translating into Expected Goals?
  Everton take 49% of their shots from outsize of the box, according to WhoScored, while only 4% of their shots were in the 6 yard box. I’m sure all of us, even you, Charlie Adam, can see why that’s stupid. To contextualise a bit, Chelsea took 41% of their shots from outside the box, and 7% from the 6 yard box. Stoke, with aforementioned punter on the books, took 48% of their shots from outside the area but managed 9% in the six-yard box. Shot location being an issue for Everton explains, at least in part, why Expected Goals rates their attack so poorly.
 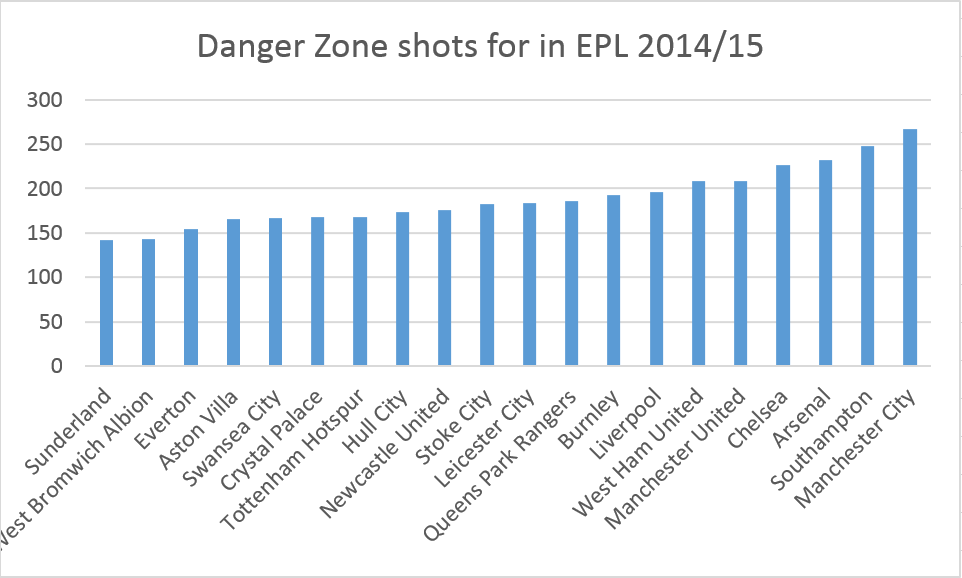 The message is echoed in volume, too. Everton managed the 3rd fewest shots in the danger zone, and according to Paul Riley, “along with Hull, [Everton had] the lowest number of danger zone SoTs last season”. Interestingly, Paul goes onto say that “in two of the the three years I have for Martinez at Wigan they were in the bottom two on this measure”, which would imply that this is a direct consequence of Martinez’s idiosyncratic tactics. You have to feel sorry for Romelu Lukaku. On the surface, his mere 10 goals in the league seems poor for someone bought for £28m, but being a striker is as much about finishing chances as getting them. Looking at shots per 90 and key passes per 90 as a crude measure of selfishness/creativity, we can see how uncreative the attackers behind Lukaku are. Ozil is there as a sort of altruistic benchmark – it may be that you can only have one designated creator in a 4231, but Everton have none in their attack (except…err…*arguably*…Aaron Lennon…).
 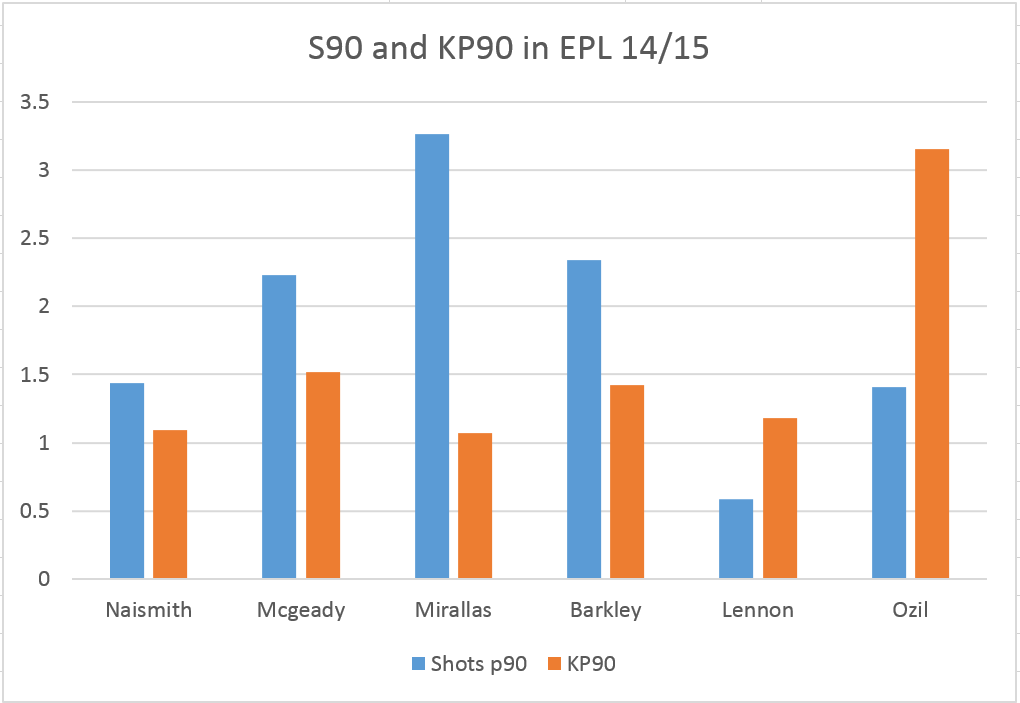 Everton lean on Baines for his creative ability – in 13/14, he assisted 0.13 per 90; in 14/15, that number rose to 0.29. This could just be random variance, but Baines of the season to just finish played 0.58 more key passes per 90 too. From 13/14 to 14/15, Everton had a marked drop in attacking strength according to Expected Goals. Since there hasn’t been a huge personnel change (signed Lukaku, replaced Deulofeu with Atsu), it may be that Martinez’s tactics are failing to create as many chances as they used to. Perhaps teams have clued up to the Spaniard’s game-plan, or maybe the attackers just had really poor seasons (Mirallas’ assist rate dropped from 0.31 P90 to 0.06, though his NPG90 increased from 0.31 to 0.44). Figuring out the exact cause of Everton’s attack becoming so blunt would probably take more granular analysis, but that it is blunt is there for all to see. This isn’t ExpG under-performance that could be classed as unlucky or variance, this is a massive observable difference in the team’s ability to create chances.
 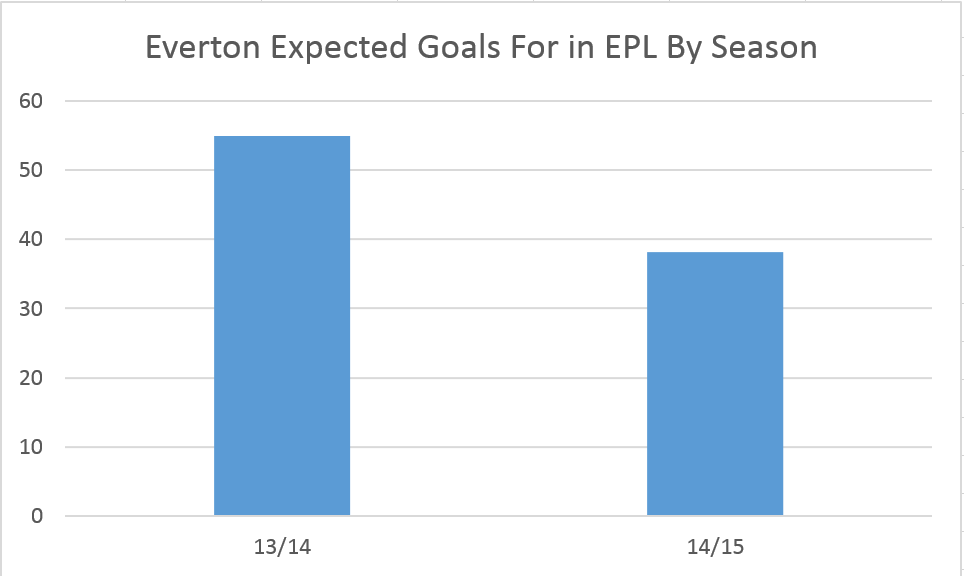 Average defence and the R word In terms of Expected Goals Against, Everton rank 13th in the league.
 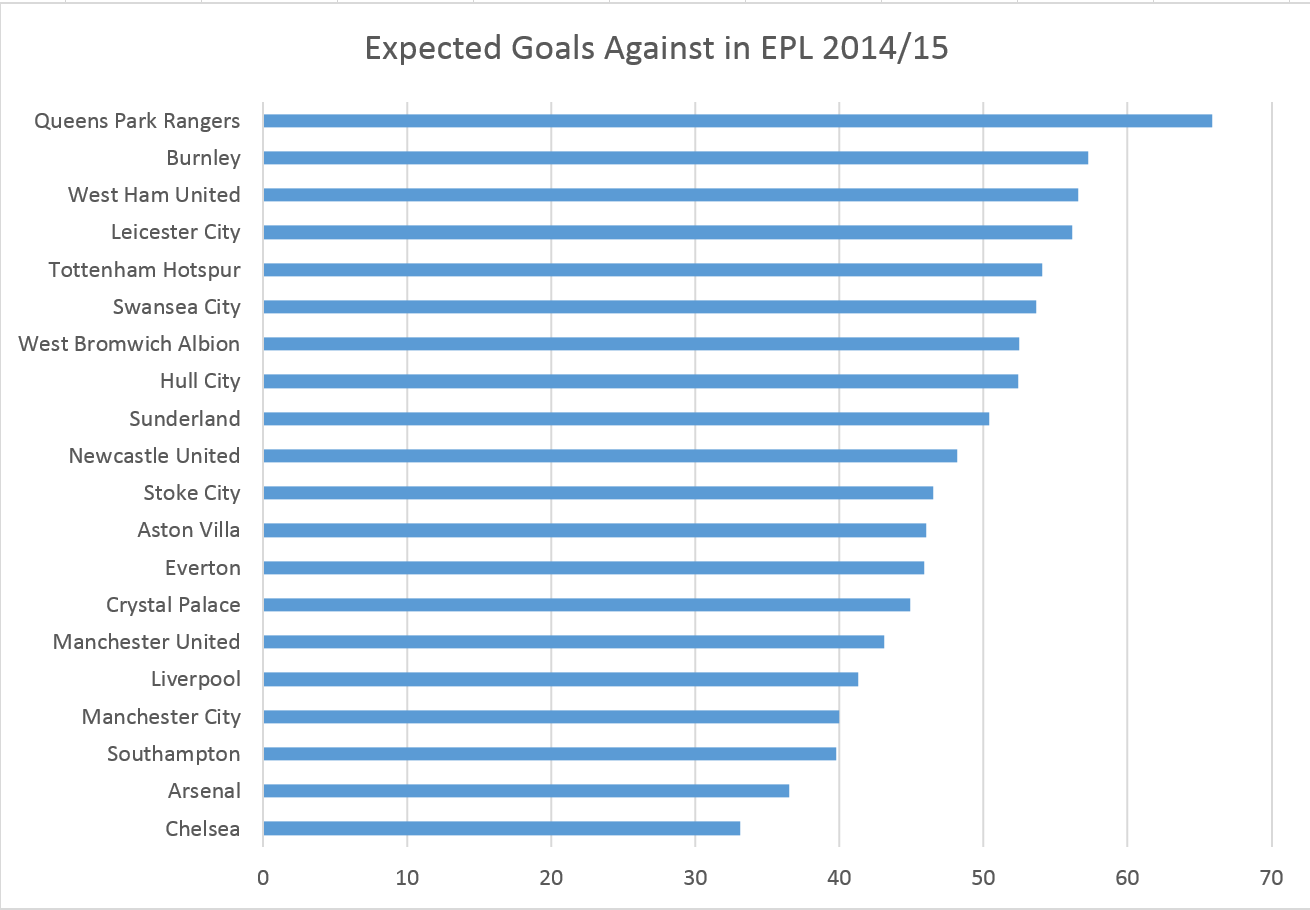 Their defence isn’t particularly bad, but it’s by no means brilliant either. They were expected to concede 7.7 goals more in 14/15 than in 13/14 – in reality, Everton’s 14/15 defence was 11 goals worse off than the one of the year before.
 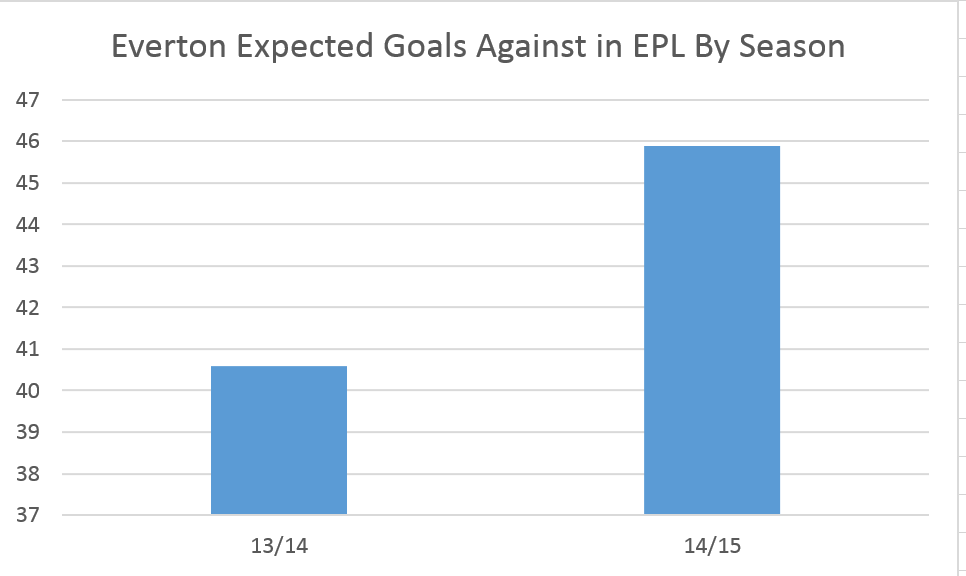 A big difference that the model won’t be picking up (and may account for the extra goals conceded) between this season and last year can be found just behind the defence, in between the goalposts. Tim Howard’s save % from the danger zone was 57% last year, while the league average is 44%. This year, Everton’s was 43.59%, worsened only by Liverpool and Newcastle. As I pointed out in my piece on Swansea, and Paul did in his Everton season preview, danger-zone save percentage isn’t the most repeatable of metrics. Furthermore, according to Objective Football, Everton’s overall save % (half of the make-up of PDO) of 61.2% was the lowest in the league this season. Paul’s prediction of the effect of the inevitable regression in save percentage was almost perfect: “the numbers suggest it’s far more likely that more of the same next season will result in nearer 50 goals conceded than 40.” In the end, they conceded 50. Conclusion Dafuq happened to Everton, Bobby of a thousand words and countless graphs ago? Well, two extremely noticeable things, as far as we can tell: their attack retired, and Tim Howard regressed from Superman to Clark Kent. The former is a way bigger issue, because attacking prowess is something that can (in theory) be rectified and repeated, whereas danger zone save percentage is always likely to regress to the mean. The difference in Expected Goals For was also much bigger (16.7 goals) than in Expected Goals Against (5.3 goals). If the defence and attack were boats, the defence has a slightly bigger hole in the bottom this year round, while the attack has capsized altogether. Quite why Everton’s tactics worked so much less than the year before, considering a minimal amount of change in personnel, is a harder question to answer. The evidence is there – a lack of danger-zone shots, not enough creative play from attackers, too much shooting outside the box – but pinning the exact causes would probably take far more granular and comparative analysis. It may be infinitely more complex than needing a creator in attack, but I do wonder how this Everton team would play with someone like Gylfi Sigurdsson behind Lukaku. Martinez has to fix his attack, or his promise to Bill Kenwright of Champions League football will become increasingly laughable. Thanks for reading, and many thanks to Paul Riley and Michael Caley for data. I can be found on Twitter if you wanna discuss the piece.
Month: June 2015
Match Day Analysis: going granular to try and gain the extra 2%
 I've often heard soccer described as a data thin sport, a sport where the lack of big events holds back analysis. While that's true with regards to shots, saves, expected goals and goals, it's far from true for the rest of the game. Everywhere else, it is an extremely data-rich game because of how many actions each player makes. One single match can tell you more about a player in soccer than it does in most any other sport due to this high number of actions, we just haven't quite made all that data accessible yet. This post will be diving into the granularity of a single half looking at only one side of the ball and attempting to use some of this data to help our team get an edge. The goal is not to analyze one Milan-Torino match and be done, but to hopefully illuminate how stats and analysis can be of great help to teams on a time-frame of minutes and days not just months and years. Before any of this analysis becomes useful for a team, analysts at clubs have to have good relationships with the coaching staff and players. They could be creating impeccable game plans but if it's dry, technical and they have no relationship with the playing staff it will not get implemented. The Pittsburgh Pirates found real success at blending analytics onto the field by having a analytics staffer travel with the team, sit in on every pre-game meeting with the coaching staff, and spend more time in the clubhouse. This led to great two-way communication where experienced baseball coaches could get to know the analytics staff and begin to trust them more and players and staff could ask questions and led the analysts to places that would never have occurred to them without this interaction. This relationship often means presenting your findings in a different way than you might at an academic conference:
"They had to democratize the data and turn it into something that not only stat wonks understood, but athletes, too. Fox and Fitzgerald knew they might lose players if they just passed along numerical data. They had learned in their limited conversations with players that they absorbed visual materials amazingly fast and retained the information."
-from the recommended book Big Data Baseball. The need for communication is key in soccer as well. Carles Planchart is Bayern's head analyst and he puts it this way: "The most efficient method is to show them visual images, because that gets the idea across very quickly." Planchart discussed his and Pep's halftime routine in the book Pep Confidential:
"He usually picks three or four concepts to cover at half-time and will use two or three three-second videos to demonstrate what he means about each one. In total, there will be rapid shots of roughly 10 specific moves. ‘What are we doing at half-time? That’ll be Pep’s first question. He comes into his office and asks, “what are you seeing up there?” Because you get a completely different view of the action from up above and you spot different things. He always listens attentively when I make my report."
For soccer analysts at a club, detailed single-match work like this is where most of your time and impact should be. Even turning 2% of losses into draws and 2% of draws into wins could make a big difference in the table and the clubs finances in a way that I don't think is as easy to do through analysis in the transfer market at this point. In this example I am hypothetically working as one of the defensive analysts for AC Milan as we prepare for our match against Torino in Serie A. I say "one of the defensive analysts" because any large team should have way more staff than they do now. The Pirates have 7 people on an analytics staff with revenues of $229 million, according to Forbes. AC Milan have revenues of $339 million and play in a sport that is probably 25 times harder to analyze and 25 years behind in terms of the statistical work done. If the Pirates can hire 5 full-time guys and 2 part-timers just for analytics, there’s no reason AC Milan can’t have a dozen analysts working for them. Anyway, for this piece I’m imagining I am one of those guys.  Build-Up While some of my partners review our previous match, it falls to me to prepare a basic scouting report on the upcoming attack. I start with a Style Profile featuring their offense and our defense:
 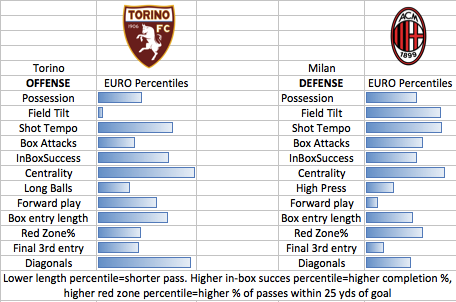 The two main characteristics our coaches need to know are they are off the charts at playing centrally in the final third and playing deep in their own half. They can then decide if they want to press high to attempt to kickstart the offense or sit back and avoid being stretched as Torino coach Giampiero Ventura always tries to do (quote from his thesis: "possession of the ball aims to attract the opposing players in one area of the field to take advantage of the spaces that are created in other areas"). Next up, we want to see how Torino plays against teams similar to our defense. We know from our previous analysis on similarity scores that our defense plays similarly to Atalanta, Sampdoria, and Verona and is closely related to Cagliaro, Chievo, and Palermo. Stuffing down our disgust that mighty AC Milan is grouped in with these teams, we do some analysis on how Torino approached those teams, especially when playing away. We see they pass even deeper in their own half (vertical line represents about midfield)
 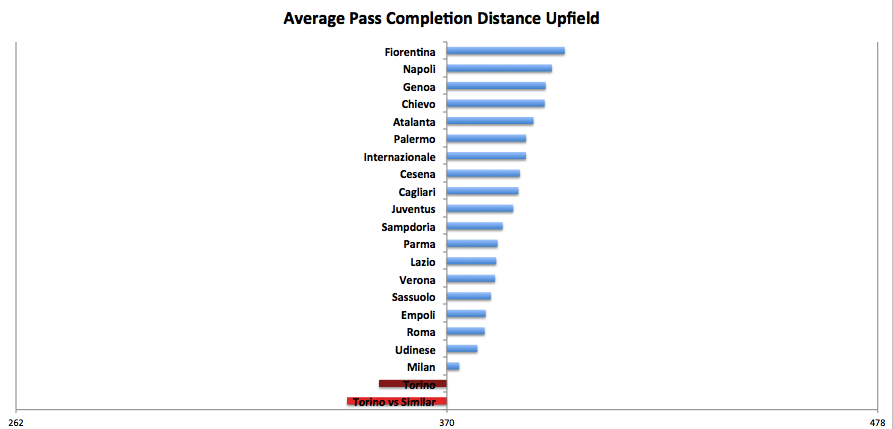 and pass even more centrally
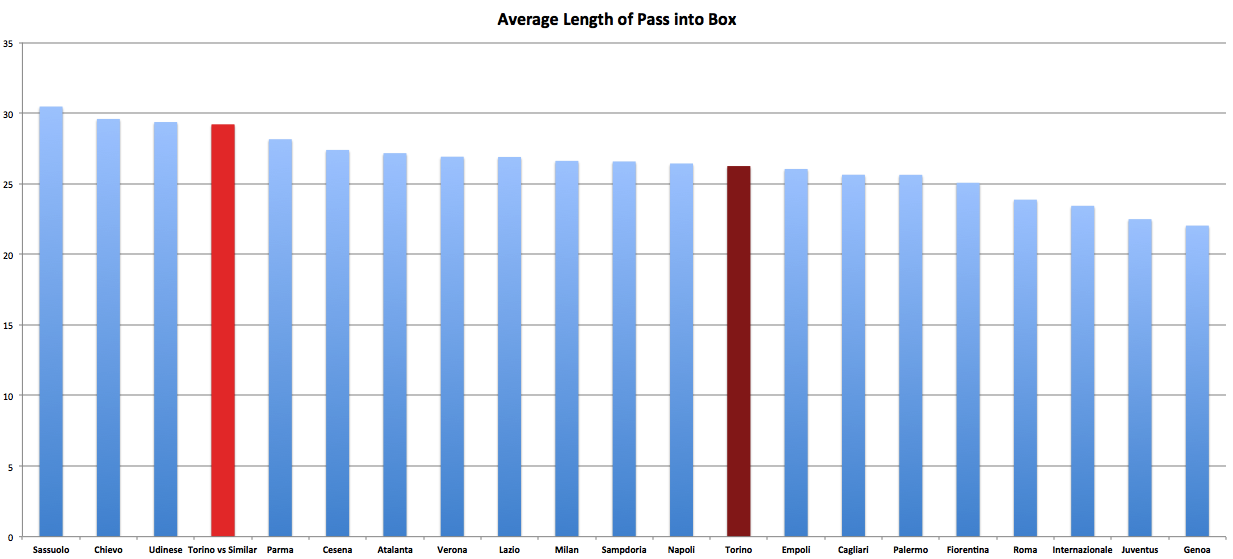
 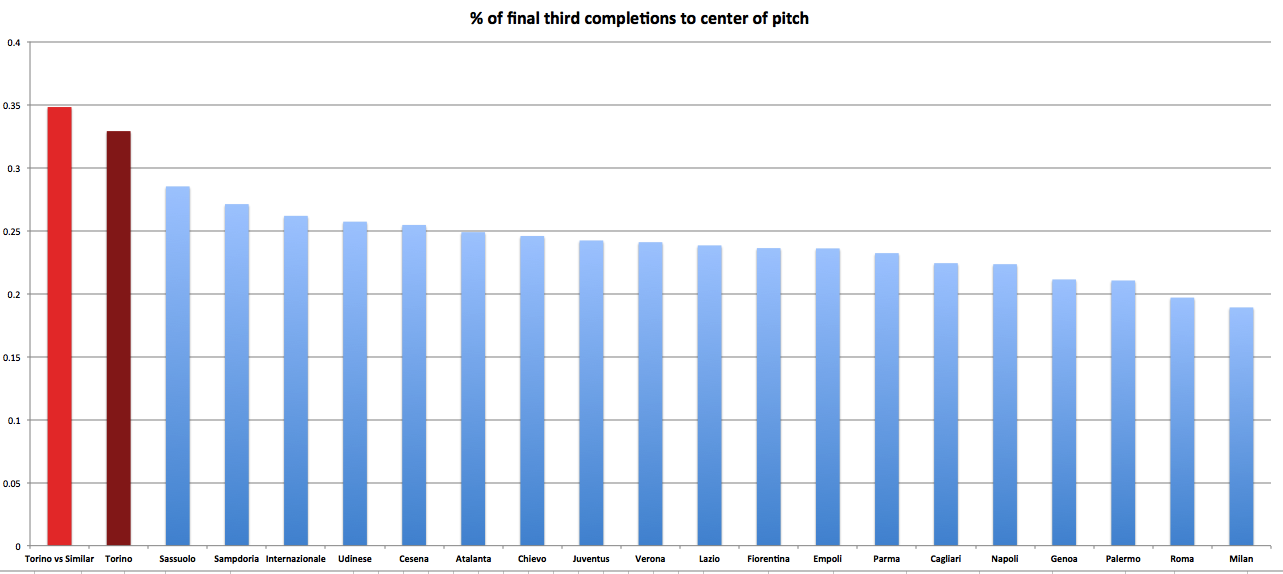 This just drives home the point that we need a coherent plan on how we will try to defend their build-up play. Our deepest midfielders can be used to force play wide or to try and break up the moves by pushing higher with our attackers. We aren't an accomplished pressing team so this might be given high priority in training. We want to make teams go away from what they want to do. The major differences vs similar defenses: lower shot tempo, longer passes into the box, and lower share of their passes in the "red zone" (within 25 yards of the opposing goal).
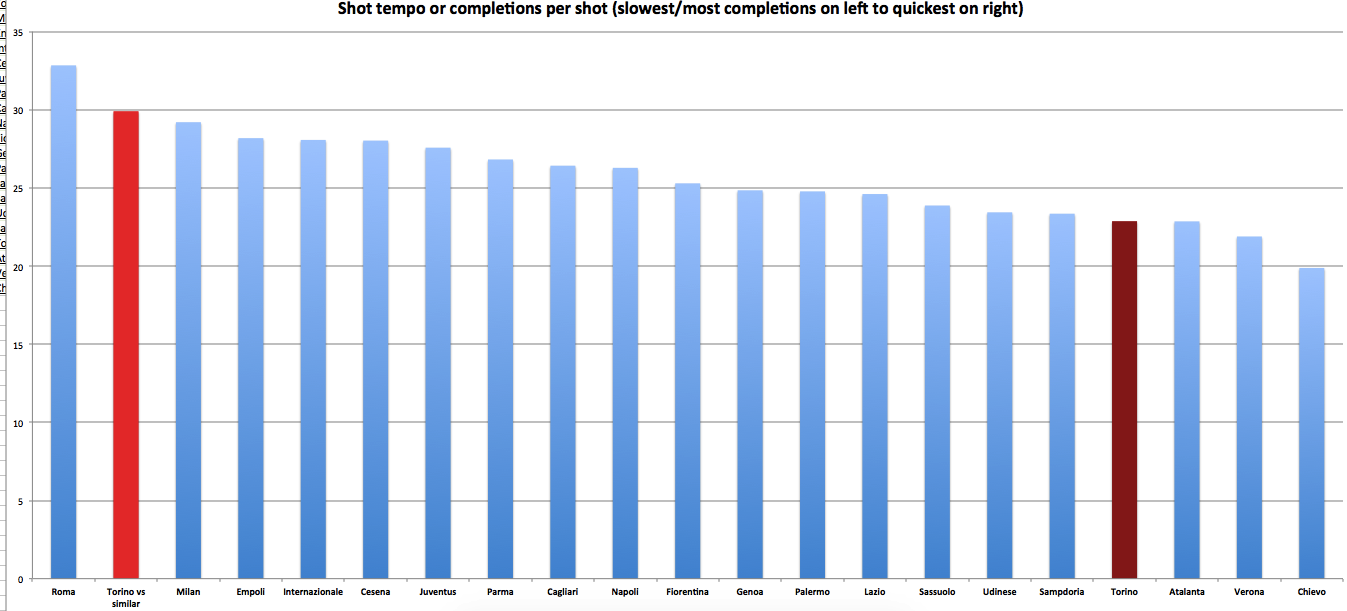
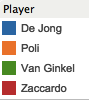
 From this we start to suspect they won't flood the box with numbers. They will pick their spots to attack and will use Omar El Kaddouri to spearhead them. Against Chievo in their last game, El Kaddouri completed 18 passes to their two forwards, all of them coming in the center of the pitch. No other player completed more than 9 passes to forwards and they only completed 1 pass between themselves. Here is an example of where he was feeding the forwards
 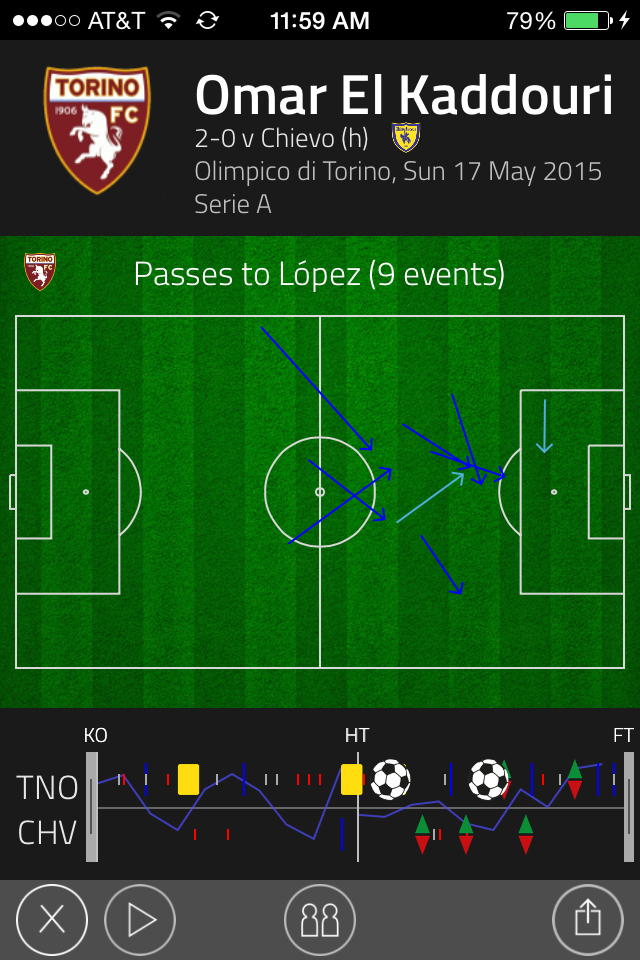 and here is how he was supplied, map via analyst Tom Worville
 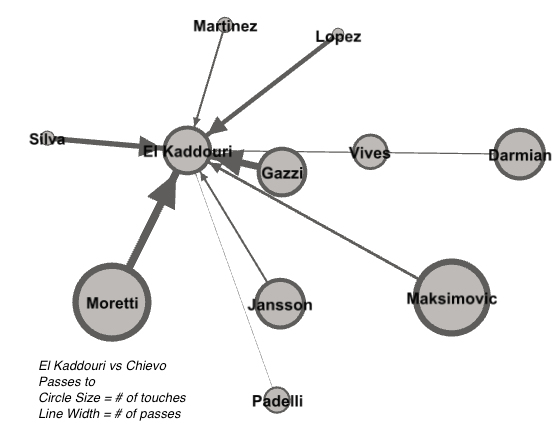 A player who is not going to start the match will be briefed on how El Kaddouri functions and simulate him throughout the week in training for our starters to get to know. Some of the rest of the staff will be working on building shorter versions of videos like this one: 2-3 minutes of build-up from the most recent Torino games and from games vs similar defenses and 2-3 minutes from each game showcasing their attacking moves. If our manager says he wants to see Torino against other styles as he is considering a tactical change, we can compile reports and videos on those as well. Summary -they will play from deep -will target center of final third -will use El Kaddouri to get ball there -won't commit big numbers to attacks Match Day All of our systems are hooked up and churning and the defensive staff is prepared and working during the first 45 minutes. Note-worthy moments are clipped and sent to the coaches computers instantly so they can view them at halftime. A box score, maps and any other interesting things we can show them will be collected and sent down in a package that can be digested in a few minutes. We are winning 1-0 at the break but there are worrying signs on the pitch. They have not generated a lot of shots against us (0.34 raw expG) but the ball has gotten to dangerous positions too often and our right back was sent off during one of those. The basic box score looks like this:
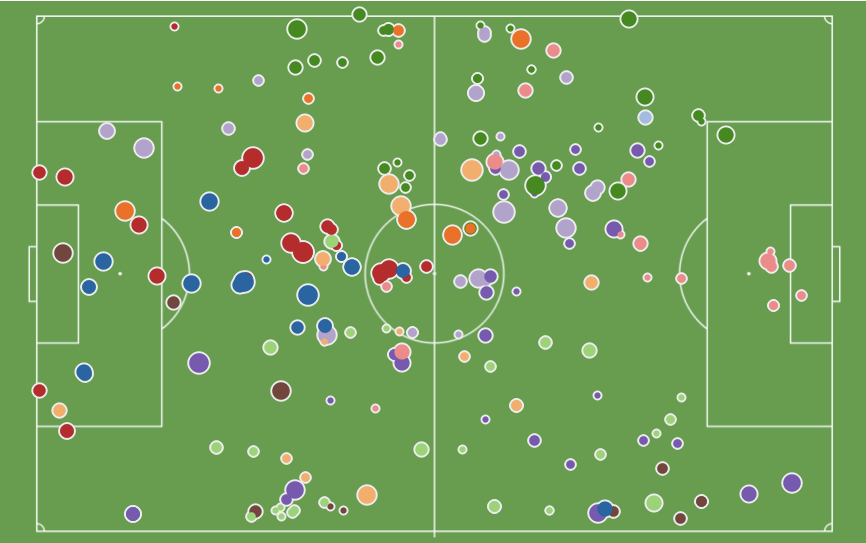
 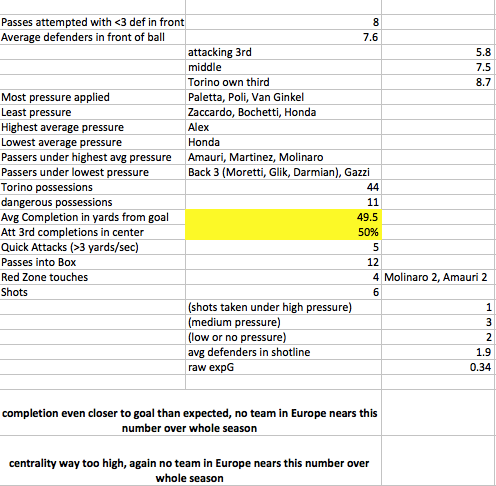 The highlighted areas are the things we think stick out, with a few comments below. We also send down our pressure map, which shows where a player pressured the ball with the size showing how much pressure he put on:
 This is assuming they have a video system that can track the ball and players at the same time. If they do not, this is prime intern duty. We attach a second map with key players we want to point out, as the entire map can be overwhelming.
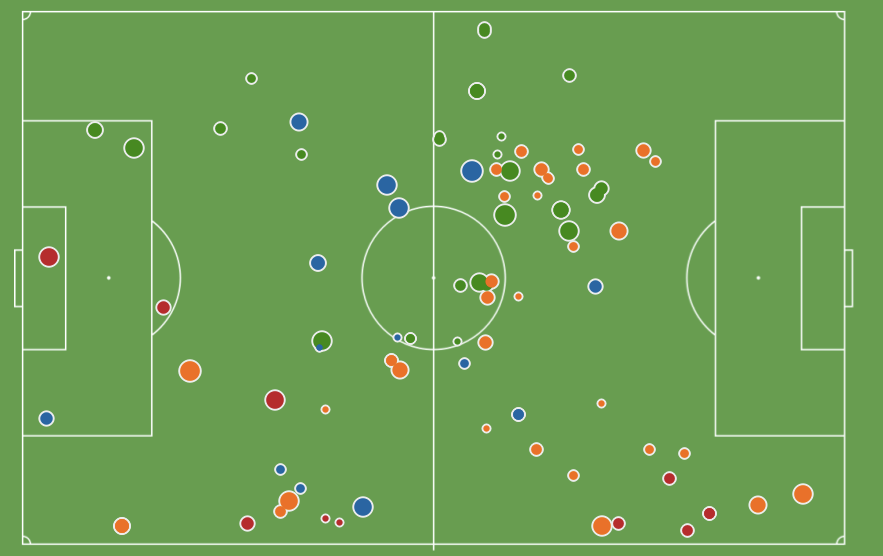
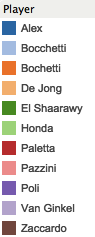
 We want to emphasize that De Jong and Van Ginkel seem to be overlapping on the left side and don’t show up in the right-sided center of the pitch when Torino are attacking through there very often. Poli is roaming all over the place and Zaccardo is completely nonexistent. Torino pass breakdown is 66/105/71 from left to right so it's not their offense that explains all our pressure lining up on the left. Cross-checking with our offensive touch map will likely show our offense is bogging down there with too many people in the same area, leaving openings on defense when we do lose the ball. We include their offensive average on the ball positions with the shading showing how much pressure they were usually under in the first half. We chide the intern responsible for lining up the map the wrong way (Torino is shown attacking to the right here)
 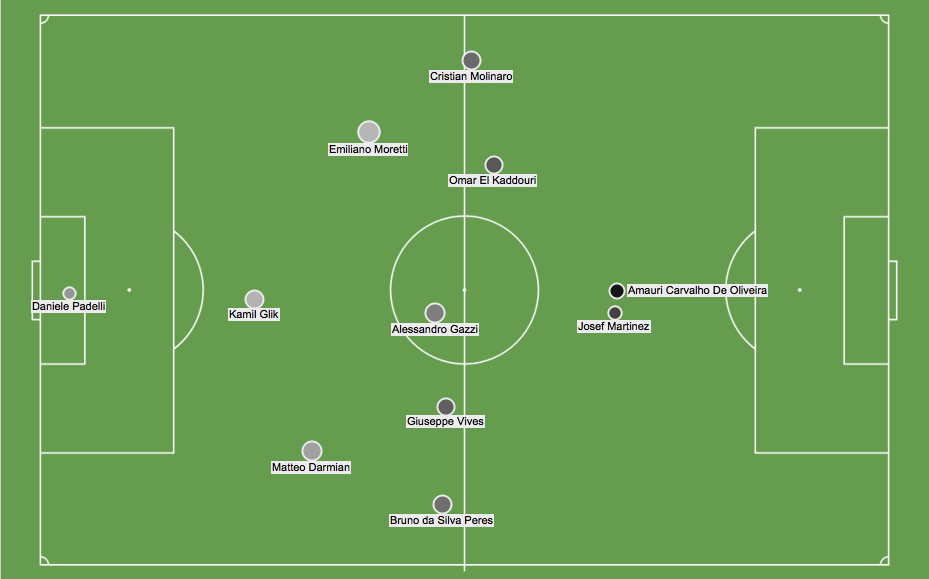 We include their forward movement/attacking passing map (thick end is end of pass). Blue is complete, red incomplete. Attacking to the left
  We include their key build-up combinations and where they take place on average. These are the most common forward passes made by Torino. We have a clickable option to expand on each of the buildup and see what happened with the ensuing possession.
 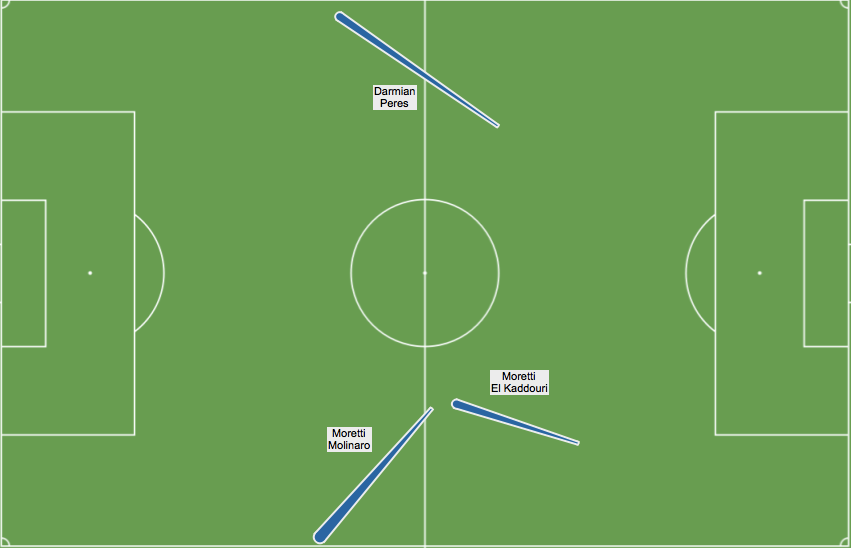 If you wanted to see more info about the 5 passes in the Moretti-El Kaddouri combo all the passes are described and video linked so you can click on time and the video plays from there: 5:16 (starts a move that winds up with Poli intercepting a pass just outside the Milan box) 18:44 (move broken up as De Jong takes ball away in Torino half, directly leads to contested shot on break by De Jong) 30:39 (starts break that leads to speculative Martinez long shot) 31:22 (Honda tackles El Kaddouri quickly takes ball, break looks semi-promising but fizzles out) 43:47 (El Kaddouri finds Amauri on edge of 6-yard box, who plays dangerous ball across goalmouth). The final map is one of dangerous dribbles. El Kaddouri is in blue, Molinaro is in orange. Thickness is how many defenders they bypass. Milan goal on left, thin end is end of dribble. We see the long dribbles coming through the middle, weighted toward the right side.
 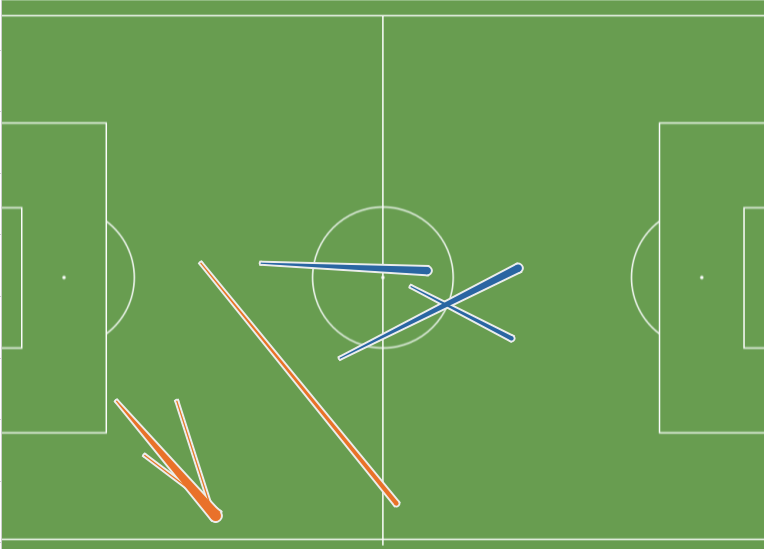 Finally we want to link to some key moves in the first half. Too many players getting up the left side and De Jong also on the left behind Van Ginkel. Space opens for a El Kaddouri driving dribble
Podcast: Premier League Review 2014-15

Returning from hiatus, it's the Podcast! [soundcloud url="https://api.soundcloud.com/tracks/211028079" params="color=ff5500&auto_play=false&hide_related=false&show_comments=true&show_user=true&show_reposts=false" width="100%" height="166" iframe="true" /] This edition focuses on the Premier League 2014-15: which teams will have been happy with their season? Who had cause for concern and what truths were outed by the numbers? Also highlighted are players that may have had better (or worse) seasons than you may think. And I am mean about Coutinho, which will be popular. *ducks* If you are an iTunes user (or want to subscribe to the pod via a different player) this link should help: Statsbomb pod (thanks to @cricsheet for the help here) Hosted by James Yorke (@jair1970) and Benjamin Pugsley (@benjaminpugsley)
Who Are The Most Promising Young Attackers In The Big European Leagues?
If I were to give you a list with these players names on it... Felipe Anderson Nabil Fekir Raheem Sterling Hakan Calhanoglu Harry Kane Paul Pogba Romelu Lukaku Paulo Dybala Luciano Vietto ...then many of you would recognise it for what it is: established but young super talented players based in the top five European Leagues. Run the numbers and these guys are the top guns. One would imagine that many a boardroom has a list of paper with these names and others printed on it but transfers involving these players will not come easily. Why so? Well each of these players is either one of two things: a) based already in the Premier League or b) attached to a club qualified for next season's Champions League. These two factors imply further points: a) they are already likely to be quite well paid and will be expensive b) only a significant step up in club stature is likely to permit transfer. By that regard, as we've already seen with the fees and wages theorised around any potential Sterling transfer, and provided that they maintain form going forward, these are players that will only interest the mega-rich clubs; nobody else can afford them. We can see this already, as Dybala has recently agreed a £23m transfer to Juventus, Kane is thought to have rejected speculative interest from Manchester United and Pogba is high on Real Madrid and Manchester City's wish list despite already playing for Juve. Also Vietto seems set to join Atletico Madrid and with Memphis Depay already transfered the hipster choice for “transfer to watch” is Felipe Anderson. (A quick aside on Sterling: he's the youngest player on the list yet played the most minutes.) How have I actually derived these players though? Well, it's an inevitable trawl through the numbers, specifically, these players have all played a minimum of 1200 minutes in 2014-15 in one of the top five leagues, were 22 or younger on the 1st of January and i've fiddled with a measure that adjusts for a broad expectation of attacking contribution whilst eliminating freakishly high and likely unrepeatable rates. This gives us players trusted to play and when playing, contributing. Ted Knutson did something similar here on Statsbomb this time last year, but with wider scope and I suspect greater detail. What i'm endeavouring to do is create a list of potential, some realised, others on the cusp. We look for attackers because it's easier and their contributions are far more measurable, indeed things like shots, goals assists and shot assists are measured and recorded. Sam Gregory even devised a specific metric in a similar vein and later Colin Trainor took it that bit further. But what of defenders? Well, solving defense is on the list of things to do, indeed it is on everybody's list of things to do, so we'll leave that for now. “But you've just got a list of all the good players, what's the point of that? It tells us nothing” This is true. But also conversely it tells us everything: any estimation that generates the better players at the top is a positive. Looking back at Ted's work from last year and prior, he was identifying around a 70% hit rate for attacking talent. What i've done is far more of an initial glance and i'm not claiming advanced modelling skills, but maybe we can generate a few names that are of interest. And if your club should embark on a transfer bid for one of these names, wouldn't it be cool to think that they had got smart, and were at least on some level using the numbers? I think so. So here we have, in no specific order three more names that might interest switched on teams, the conditions are sufficient minutes and young but not (yet) playing for an English or Champions League qualified team: 1. Andrea Belotti 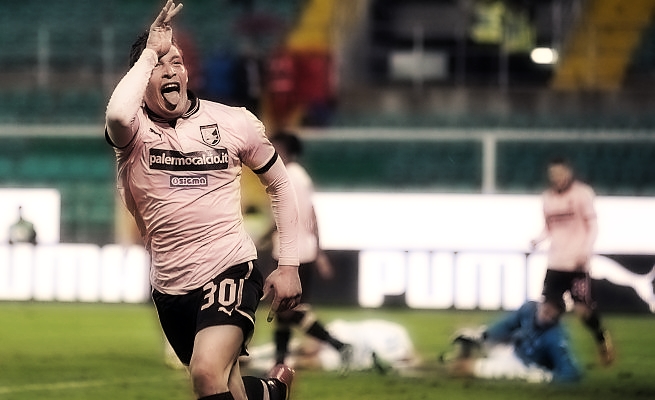 In a marvellously neat finale to Palermo's season, in the last moments of a game at Roma, Andrea Belotti stole in at the far post and studded the ball across the line to secure a 2-1 victory. Despite only securing nine starts in 2014-15, he looks to have a future, given the sale of Dybala to Juventus. Palermo spent most of the season playing a 3-5-1-1 with Vazquez behind Dybala, leaving Belotti little chance to secure meaningful game time but he scored four non-penalty goals (and two penalties), three of which secured 2-1 victories. Somewhat of an outright striker, he contributed to a solid 4.3 shots per game, played over 1200 minutes and has represented Italy at multiple levels up to under-21s, in which he has a decent goal record. Should Palermo entrust him with the starting striker's role next year, he appears equipped to build on a promising first season in Serie A. 2. Diego Rolan
  In his third season at Bordeaux, Rolan has broken though quite effectively, so much so that with Luis Suarez suspended for the Copa America, he has become Uruguay's number 9. Having only scored once in bits and bobs minutes in his first two seasons, 12 non-penalty goals have followed this year, most of which have come from a forward role, but he has also showed versatility and played in a variety of right sided positions. He's constructed 0.54 goals and assists per 90 minutes played from a 3.8 per 90 shot contribution, a decent ~30% of his teams shots. Bordeaux finished 6th in Ligue 1 this year, and with no European football forthcoming and just two years on his contract, it is quite possible that he will attract suitors. 3. Johannes Geis
 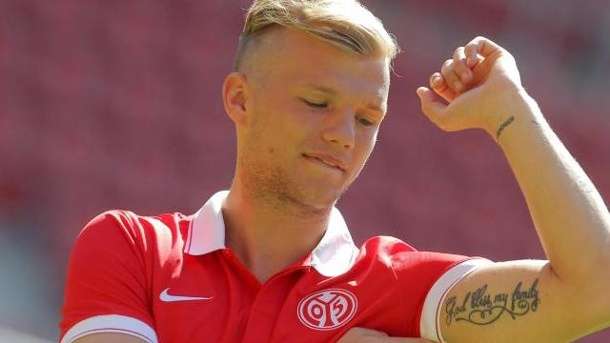 That a predominantly defensive midfielder should show up on this list is a testament to the qualities of Johannes Geis. Two seasons of over four shots per game contribution for a 21 year old is highly impressive and that he has secured a starting spot and performed consistently in the middle of the pitch at such a young age is rare. Like Belotti he is capped throughout his country's youth system and has been strongly linked with a move away from Mainz with Dortmund suggested as a likely destination. *Two other possible qualifiers that prospered for smaller clubs were Marcos Lopes (played at Lille, owned by Man City) and Fede Cartabia (Cordoba/Valencia). So, each of these players performed at a promising level during 2014-15 and could well find the next rung of the ladder coming within reach very shortly. And I think what i've represented here is that a starting point for potential attacking player analysis can be made using straightforward metrics revolving around shot creation. None of this is a new procedure but it follows a similar line to some of the work we've seen before on this site and gives us a handful of names to watch out for in the future. I would also hope that any club with a transfer budget to use this summer had performed, at an absolute bare minimum, similar fundamental analysis of the players within their range on the market. My analysis was necessarily brief and top-level, I am merely highlighting, but there are many people in the analytics community that would be able to drill down far into the statistics and tailor their analysis for any requested nuance, and that can form part of the process towards recruitment, in hand with traditional techniques. Pitfalls in transfers will never be eliminated, but the use of statistics and analytical techniques as an aid towards recruitment can certainly contribute towards a minimisation of error. Thanks for reading ~~~~~~~~~~~~~~~~~~~~~~~ Follow me on Twitter here: @jair1970
Were Swansea Lucky To Finish 8th?
It’s been a confusing season to be both a Swansea fan and maintain an interest in analytics. On one hand, a record points finish and altogether hugely celebrated season; but on the other, repeated pessimism about Swansea’s “underlying numbers” from the analytics community:
I’ve been left in a sort of un-opinionated grey area – I know that mere point totals aren’t everything, but I’m similarly aware of problems with metrics in general. A full season since I claimed to be optimistic about Swansea’s chances of breaking into the top half in my StatsBomb Season Preview, I’m unable to gloat shamelessly.
And so, people of the analytics underworld, Swansea fans and any neutrals brave or interested enough to read this, I shall attempt to answer the question that undoubtedly keeps you up at night – “Are Swansea crap?”
Why would they be?
Swansea didn’t shoot much this season relative to how many shots they conceded, basically. Their Total Shots Ratio (TSR) is the 3rd lowest in the league, better than only Burnley and Sunderland. TSR is a reasonably good indicator of team performance:
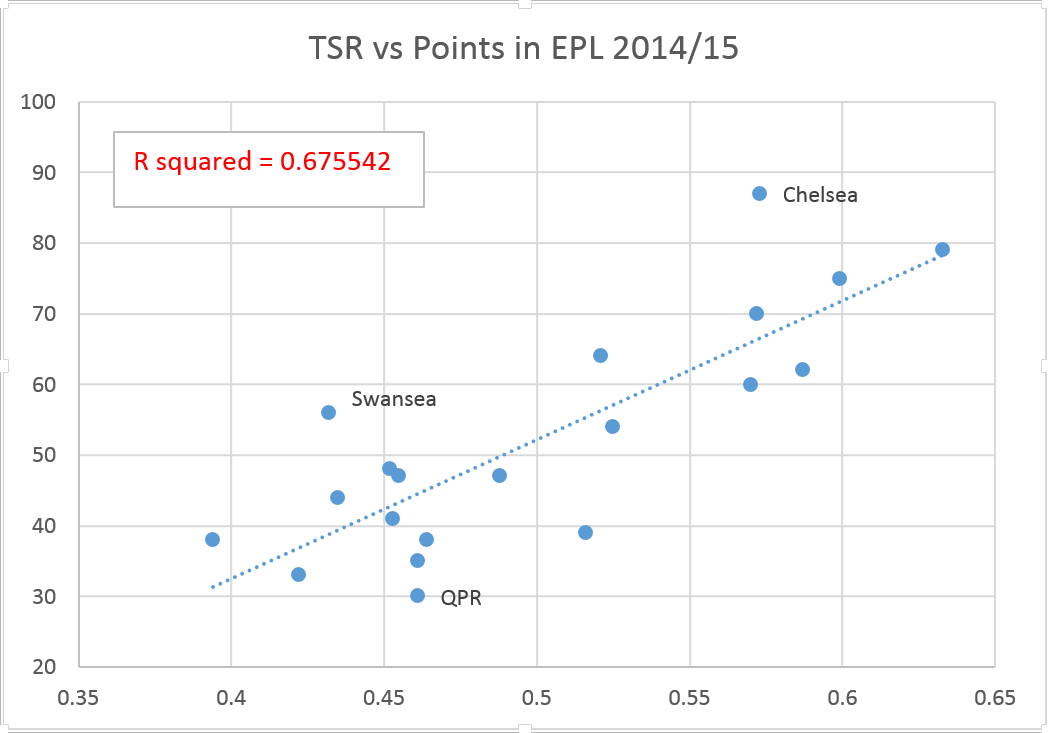
But it isn’t perfect.
Swansea are obviously anomalistic here, but two other teams are similarly so: Chelsea and QPR, who over and underperformed respectively based on their TSR.
There’s some explanatory power lost in TSR - this season, the power to explain the best and the worst teams in the league. Which is why the analytics community upgraded with Expected Goals. In layman's terms, ExpG are the amount of goals a team might have expected to score/concede in a game based on historical trends, predominantly location i.e. Bobby shot from X yards away, and he might have expected a Z chance of scoring. In more complicated terms, they’re this.
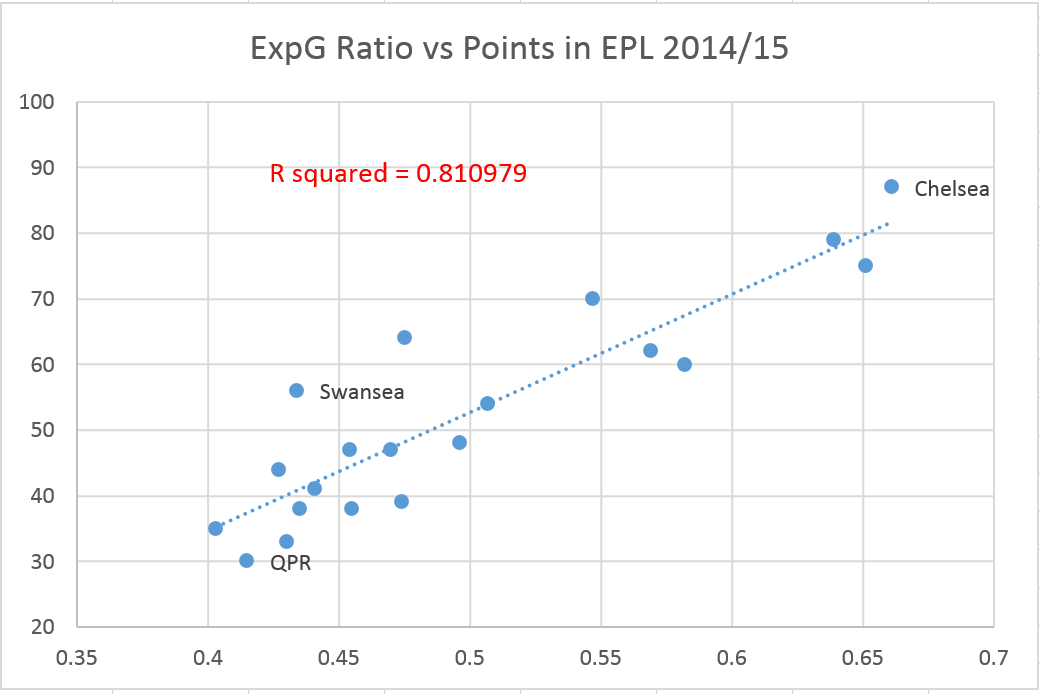
As can be seen immediately, ExpG Ratio (ratio of ExpG for and against) was markedly better at explaining point performance this season than TSR. Chelsea and QPR still over/underperformed, but by less.
Swansea, though, are still a prominent outlier, their 16th placed ExpGR contrasting harshly with their 8th placed finish. And this is where one might conclude Swansea are ‘crap’ (or at least not good enough to be 8th) and lucky. Not one of the two, but both. Their point performance should, over some period of time, regress, possibly deflating the wheels of the Monk bandwagon balloon before it had any time to properly get going.
Picking apart their overperformance
Michael Caley’s wonderfully public ExpG model has Swansea scoring 41.2 goals last year and conceding 53.7. In reality, they scored 46 and conceded 49, which (+4.8 and -4.7) is almost identical overperformance in both Swansea’s attacking and defending.
The question, then, becomes not “Are Swansea crap?” but “Is there anything that might suggest Swansea’s overperformance is a product of anything other than luck/variance?” A less catchy title, and one with huge confirmation bias problems for a Swansea fan to examine. But maybe, just maybe, Swansea are anomalistic because of footballing idiosyncrasies.
Unusual attacking style
Swansea are a hipster club for a reason, their possession football mantra setting them apart from the otherwise boring mediocrity of mid-table. This season, though, Swansea’s football has been (on the surface) much less atypical. Monk is far more focused on adaptability and contextualised match tactics rather than the poetic Laudrupian ‘go forth and pass’ mantra, which has been hard for people to criticise given the record points total etc.
But if you look at the type of shots Swansea take, they remain unusual for a mid-table side. The percentage of shots they take from a through-ball (6.4%) is the fifth highest in the league, with Arsenal, Manchester United, West Brom and Manchester City ahead of them in this particular measure. And the percentage of shots they take from a cross (40.7%) is the sixth lowest; only Chelsea, Liverpool, Arsenal, City and United rely on crossing less. Swansea’s attack shares some of the characteristics with the ‘big sides’ that tend to differentiate them from the minnows, but differs in terms of volume of production.
Examining United’s overperformance in the 2012/13 season, Daniel Altman highlighted two possibilities (other than luck) – set piece goals, and Robin Van Persie. Swansea, however, scored the least set piece goals last season (4) and Gomis, although he came to late form, only scored 7 of his 69 Premier League shots while Bony, at the club until January, scored 9 of his 66. Ki Sung Yueng managed 8 goals from 28 shots though, giving him a ridiculous conversion rate of 28.6% from centre-midfield. According to objective football's numbers, this is the highest shot conversion rate of ANYONE in the league to have played more than 1000 minutes.
I’m trying desperately to avoid a “the key to…is Ki” pun here, for the record, but Monk’s switch to a diamond in January allowed Ki more freedom to attack and he definitely made the most of it. It’s unlikely that Swansea’s over-performance in attack comes from them creating chances uniquely unexplainable by ExpG, especially given their similarity in style with the big clubs for whom ExpG was pretty accurate this season.
A fair portion of their 4.8 goal over-performance might be explained by Ki’s unusually high conversion rate. Sadly for us Swans, this isn’t particularly repeatable - Ki’s own conversion rates were 7.5% and 0% in the two seasons prior to this one. For Swansea’s attack to score as many or more next season, Monk should look to drastically increase the amount of passes they make in the final third. Only Palace manage less than Swansea per90, and that suits their extremely different attacking style more. Gylfi Sigurdsson is key to this.
His drop in performance in the second half of the season may have been because of a formation change, but I’d be wary of viewing Bony’s exit as only a loss of goals. Bony’s hold up play facilitated Swansea’s slower attacks and gave Gylfi freedom, Bafe Gomis has been less good at this despite his late surge of goals.
Fab-ulous defence
PDO is a loose measure for ‘luck’ or unsustainable variance. It combines a shooting component (goals for/shots on target for) and a saves component (100 minus goals against/shots on target against). Swansea’s PDO for last season was 105.4, the 4th highest in the league and noticeably higher than the league average of 100. Based on what we’ve already been through, it may be obvious that Swansea’s high PDO isn’t primarily attack driven: Swansea’s shooting component (scoring %) is 31.4, closer to the league average of 30.4 than any other team.
One man is the reason for Swansea’s high PDO, and his name is Lukasz Fabianski. Swansea’s saves component (save %) is 74.3, the highest in the league, followed closely by Chelsea with 74.2 and less closely by West Ham with 73.7. According to Paul Riley, Fabianski has the highest danger zone shots saved percentage of any goalkeeper in the league in the last five years.
This would go some way to explaining Swansea’s over-performance in defence against ExpG, which can’t account for Fabianski’s ridiculous shot stopping. In one of his weekly round-ups, James Yorke illustrated the effects of a noticeable difference in save percentage on the output of the otherwise statistically similar Swansea and Leicester.
So that’s good, right – Swansea have a great keeper?
Well, much like with Ki but to a far more important degree, the issue here is repeatability. Fabianski might be a fantastic keeper, and is almost certainly better than the general perception of him a year ago, but keeping up this level of shot-stopping is extremely unlikely.
Swansea need to look at stopping the danger zone shots altogether, not relying on Fabianski to save them.
Wrapping it up
Are Swansea crap? Err. Umm.
Completely objectively, they’re probably lucky to be 8th, especially given they’re the 6th worst team both in terms of ExpG for and against. Through separating and cross examining attack and defence, we’ve seen that the factors that probably pushed their ExpG overperformance to allow them to finish so high are also unlikely to be repeated.
This isn’t great news for a Swansea fan. But issues only really start to arise if Swansea, and Monk in particular, were to take their 8th placed finish for granted. Of course luck is involved, albeit to an arguable degree; it would be criminal for Monk to look back at the 1-0 away wins at Arsenal, United and Southampton and not realise that in most timelines you come back with 0 points, not 9.
My analysis has been inherently retrospective, but how well one can evaluate this season depends hugely on the next.
Say Swansea post similar numbers and still finish 8th, it becomes increasingly likely that they’re doing something unique (and repeatable) that the models aren’t picking up. Sure, hoping this happens might be naïve on my part, but isn’t that kind of the point of supporting a football team?
Discussion: I'd be really interested in any thoughts on this piece/methodology.
You can find me at @BobbyGardiner on the ol' Twitter.
Liverpool's Striking Choices And Problem Shooters In The Premier League 2014-15
 If you are a club aiming to infiltrate the Premier League's top four on a regular basis, how does this sound as a description of one of your strikers for next season:
- 4 time League Champion in Top 5 leagues
- 2 time Domestic Cup winner
- Champions League Winner
- Established international for major European nation
- 24 years old
This player is coming into his peak years and his club have already secured his services on a long contract. This is a winning situation, right? 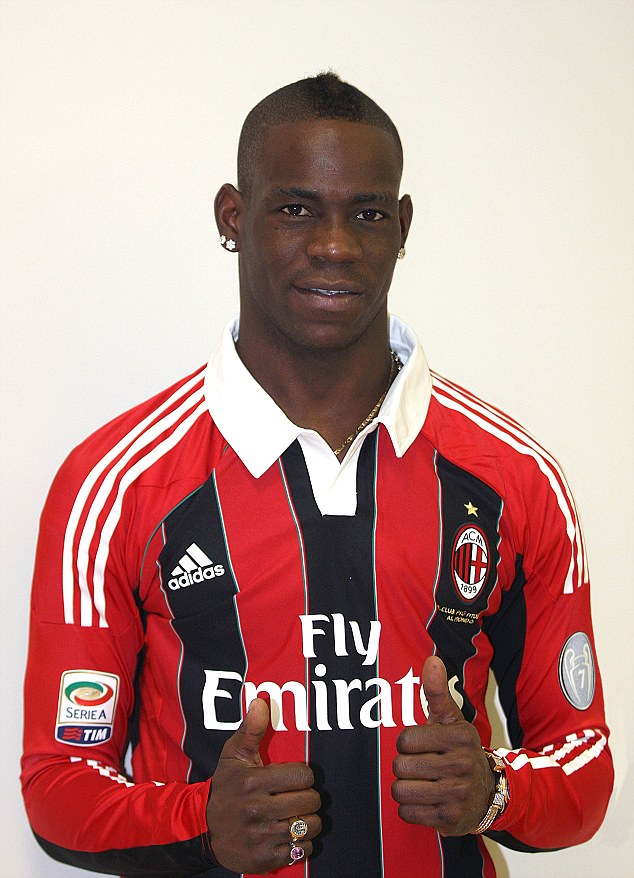
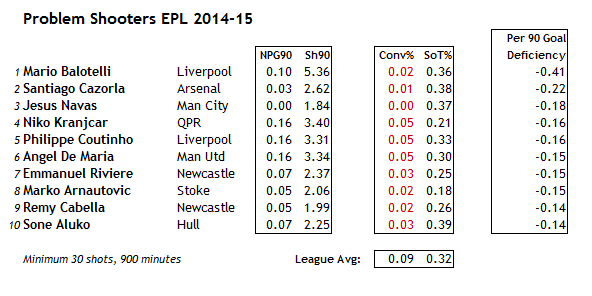 Ok, so we now have a list of leaden booted types. Each is characterised by a truly miserable raw all shot conversion rate with none exceeding 5% this last year. Fascinatingly, Balotelli's under-performance is nearly twice that of Cazorla, it's a freakish outlier but, as ever, he's taking a ton of shots and getting a solid amount of them on target. Anyway, are these players prone to such seasons; are they genuinely bad shooters?
 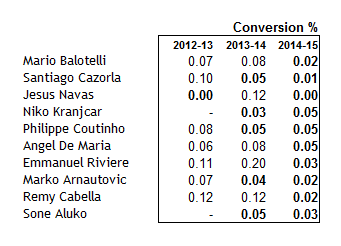 A few of these players appear to be regularly sub-par, and that may well be a function of shot selection, Kranjcar instantly comes to mind as a player who takes a lot of shots from range and my memory of Navas is of him on the right byline, so understandably goals may be in short supply from there too. Amusingly, given their periodic reputation for shrewd usage of the French market, it appears Newcastle made a classic faux-pas in purchasing Riviere off the back of an overachieving season and he promptly headed towards balancing things out. That Cabella forgot where the goal was too seems more in the realm of misfortune. Cazorla and Coutinho had solid creative seasons and gained many plaudits but have each spent the last two seasons as high volume, low conversion shooters, which is an aspect of their game that a coach might well note. Along that line, shot volumes of certain players increase by their taking a large amount of low expectation range shots. This can surely only be achieved by the least compliant and thick skinned player. Mario fits into this category well, but i'd posit that it's an irregular role for others. Team dynamics and coach orders are usually effective in minimising the volume of wild shots within a team. We've all witnessed an early “sighter” fly towards the upper tiers early in a match accompanied by a wave of acknowledgement from a player who is well aware he'll be given less grace if he tries similar again. All interesting stuff, but no more than lightly informative. Work in other sports has implied that shot volumes would need to be far higher than we see in football on a season to season basis for us to solidly attempt to parse out shooting ability from the numbers. Indeed as this post from Will Gurpinar-Morgan shows, even Balotelli's dismal 2014-15 only just breaches the line for statistical significance. It is within touching distance of pure random variation and all Balotelli's prior seasons were comfortably in amongst the mass. By using very basic location measures we can see how Balotelli's career numbers reflect compared to this last year:
 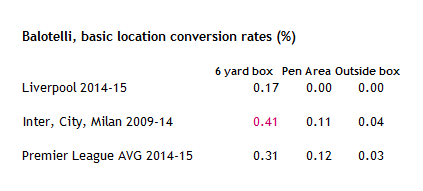 Significantly good from close in, usually, and broadly par around the rest of the pitch. Worth noting here is despite the regular wild potshots, his long term conversion rate here seems just fine. And a total washout for 2014-15. Liverpool fans have not seen Balotelli's best. Conversion is a noisy measure and fluctates regularly; and it can affect even the best, as noted this last season by Michael Caley, Sergio Aguero ran at one goal in around 50 shots during Man City's mid season slump. So the fundamental takeaway here is that Balotelli's shot volume (always high) and his history suggest he is capable and likely to contribute a higher goal tally next year. But who for? Liverpool striking corps received it's first new addition today in the form of Danny Ings, a promising player, yet only a couple of years younger than Balotelli and fresh from (under)powering a relegated attack. I suspect many will perceive his role as number two behind or alongside Sturridge, but with a haul of ten non-penalty goals and four assists last season coming out at about par for expectation based on shot and shot assist numbers, it's hard to see how he tangibly improves Liverpool's attack. With Lambert 33 and coming off a season as untrusted and sporadic as Mario and Borini surely moving on, there are vacancies around the squad, for all that we have no idea what kind of strikerless 3-4-3 Liverpool may play. Or it could end up completely different, such is Brendan's way. To my mind the Sterling behind Sturridge and Balotelli idea they used in dismantling Tottenham early last year was a solid blueprint that was discarded as Sturridge headed to the treatment room. As ever his fitness will be key. And that's partly the reason retaining and empowering Balotelli makes sense, he's as close as Liverpool will likely find to a Sturridge plug and play replacement in any given system, and it makes sense to plan for that. What of Divock Origi? Two shots per game and one goal every four matches in Ligue One does not scream “breakout star” either. To me, both he and Ings look more like options for mid-table sides opposed to Champions League contenders. Benteke has been mooted in parts, and it would likely spell curtains for Balotelli if so, but both he and Ings are ballpark three shots per game players, a significant drop on Balotelli or Sturridge's five. You clearly get an aerial masterclass from Benteke but is that in Liverpool's methodology with Sterling and Coutinho still likely to be buzzing around nearby playing intricately? None of Liverpool's forwards played over 1000 minutes in the league last season, which was a bizarre blend of injury, formations and trust issues. What is certain looking towards 2015-16 is that a degree of forward consistency both in style and personnel would likely assist Liverpool's cause. One presumes that Balotelli's all round contribution hasn't impressed Rodgers but in any system requiring a pure forward, Balotelli is clear second best behind only Sturridge. Rodgers has little time left for experimentation and may need to start non-typically fast and be in contention early on. Maybe Mario can help? ~~~~~~~~~~~~~~~~~~~~~~~~~~~~~~~~~~ Thanks for reading! Follow me on Twitter here: @jair1970 If you don't already, be sure to follow the @Statsbomb account to ensure you are aware of all new content And if this piqued your interest, check out our other articles: StatsBomb
A Family Tree of European Offenses


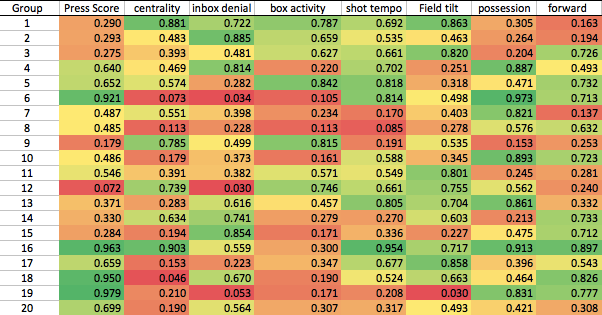
In my previous two posts on StatsBomb, I have used passing data to create team profiles and find similarity scores and then built on that to create a family tree relating how teams defend all across Europe. Today brings the offensive side of the ball to the forefront. You can read the full process of how these metrics are created and related in the previous two pieces but I will give a quick run-through here. The metrics used are:
Shot tempo: shots per pass (3 highest tempos: QPR, Leverkusen, Crystal Palace. Lowest: PSG, Bayern, Manchester United)
Box activity: how often a team passes into the box per game (3 highest: Bayern, Dortmund, Man City. Lowest: Nantes, Bastia, Cordoba)
Intra-box success rate: completion % of passes that start and end inside the box (3 highest: Man City, Lyon, Bordeaux. Lowest: Hertha, Koln, Athletic Bilbao)
Centrality: % of completions in middle of pitch when in final third (3 highest: Torino, Dortmund, Hoffenheim. Lowest: Real Sociedad, Atletico Madrid, Levante)
Possession: share of possession (3 highest: Bayern, Barcelona, PSG. Lowest: Palace, Hertha, Eibar)
Forward play: % of completions that are forward (3 highest: Paderborn, Marseille, Hoffenheim. Lowest: Manchester United, Roma, Manchester City)
Field tilt: how far up the pitch the average pass is completed at (Highest: Man City, Barcelona, Chelsea. Lowest: Augsburg, Torino, Rennes) and a few new ones for offense instead of simple long ball%, two metrics replace it
Penalty box entry length: the average distance of a pass in which a team enters the box (Shortest: Barcelona, Arsenal, Manchester City. Longest: Eibar, Evian, Levante)
Playout length: average length of completions from deep in own half (shortest: PSG, Cagliari, Inter. Longest: Burnley, Eibar, QPR) also new are
Red Zone%: % of passes that are completed within 20 yards of the opposition goal (highest: Man City, Leverkusen, Burnley. Lowest: Cordoba, Elche, Levante)
Diagonals: added thanks to this treatise from Adin Osmanbasic it is a measure of what % of a teams passes are long and diagonal. (highest: Bayern, Lyon, Lazio. Lowest: Palace, Palermo, Sunderland) Are these the best metrics for judging a style of play? Almost certainly not, that will be a long process full of tweaking and testing. Right now, I feel satisfied this gives us good groupings as the variables are generally measuring different things (none correlate above .5 with each other) and are measuring some reasonably distinctive part of the game. I've weighted some metrics more (shot tempo, box attacks, possession, intra-box success rate) and some less (diagonals, forward play) before running these analyses. The first analysis was a k-means cluster analysis using those metrics to group similar teams together. "K" is number of groups and there is always a debate as to how many you should choose. I ran analysis with k ranging from 12 to 35 and then looked at how much variance was explained by each one. 20 was where the variance seemed to stop decreasing consistently and since I used 20 groups in my defensive piece, I was happy to go with 20 again. If you choose a different k, you will get teams shuffled around a bit within groups as obviously certain teams are barely part of one group and could be moved to another without much concern. Once they had been grouped I ran an agglomerative hierarchal clustering on those group metrics to create a tree graph relating all the groups of teams across Europe. The tree graph as a whole is below, then I will go through each branch for a quick overview.
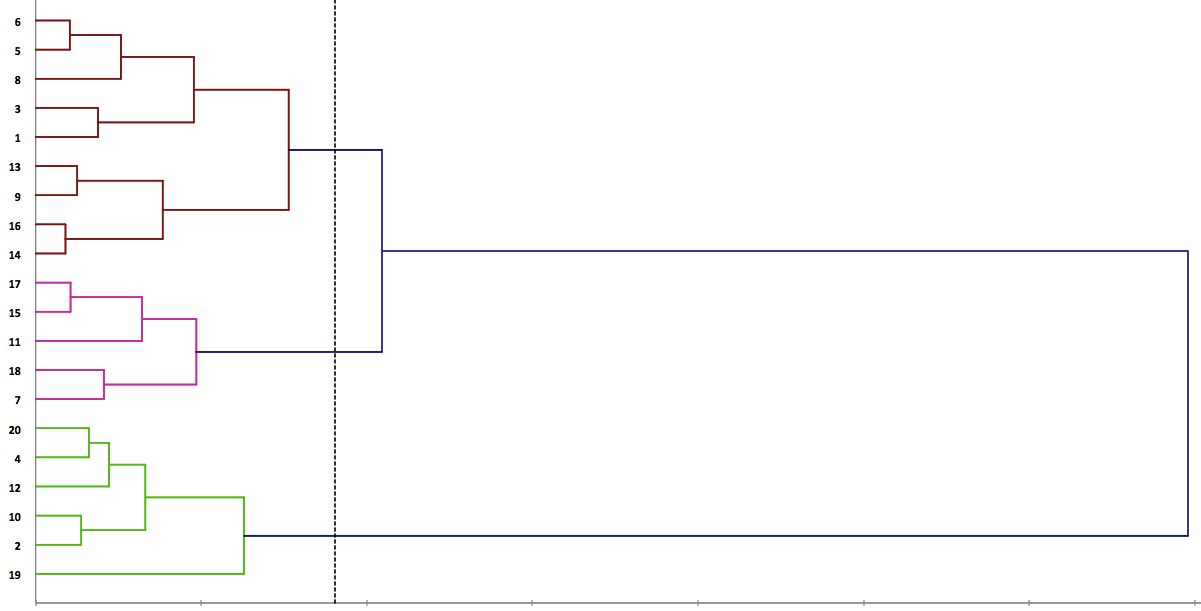 We will start with the 5 groups at the top.
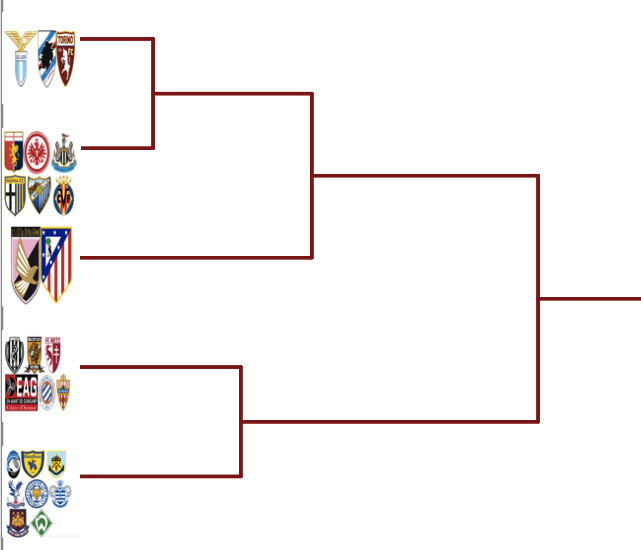
From top to bottom:
Group 6: Lazio, Sampdoria, Torino is closely related to
Group 5: Genoa, Frankfurt, Newcastle, Parma, Malaga, Villarreal We start out with an enormous yawn. A bunch of solidly midtable teams along with Newcastle and Parma (whose defenses were historically awful, offenses weren't near as bad). These teams have few standout characteristics either way. They do have well above average shot tempos and are good at passing inside the box. The main difference is Group 6 plays extremely centrally and play a lot of diagonal balls while Group 5 plays higher up the pitch and spends a high % of their time in the "red zone" (within approximately 25 yards of goal).
Group 8: Palermo, Atletico Madrid Don't play in the center and essentially never play diagonal passes. Have a very high field tilt, yet are well below average at time spent in the red zone and box attacks. I do wonder which metrics are mainly manager-related and which are player-related and if it's even possible to separate them satisfactorily. If you have Messi and Neymar, you will hit a lot of diagonals and have a great intra-box passing % no matter what, even if they play for Diego Simeone right? I tend to think Atletico rarely play diagonal passes because so many attacks go through the wings and where there is only one way to play a diagonal ball and that's into the teeth of the defense. The fact Atletico don't commit many men to attack and seem to set up defense first means there will be less options to hit across the field. Hopefully a piece on variance of styles throughout the season can help find manager effect.
Group 3: Cesena, Hull City, Guingamp, Metz, Montpellier, Almeria and
Group 1: Atalanta, Chievo, Burnley, Palace, Leicester, QPR, West Ham, Bremen These teams rarely play with the ball and play it long repeatedly. Group 1's shot tempo is by some distance the highest of any group, and they generally spend a lot of time in the red zone and are above average at putting balls into the box. Group 3 has neither of those last two positive metrics, providing the difference. West Ham at some point this season were being mentioned as a team that might break into the top 5 and were good enough to qualify for Europe (I guess they did, but I doubt many of those pundits were eyeing the Fair Play Table at the time). They wound up as a pretty poor team playing similarly to a lot of other poor teams.
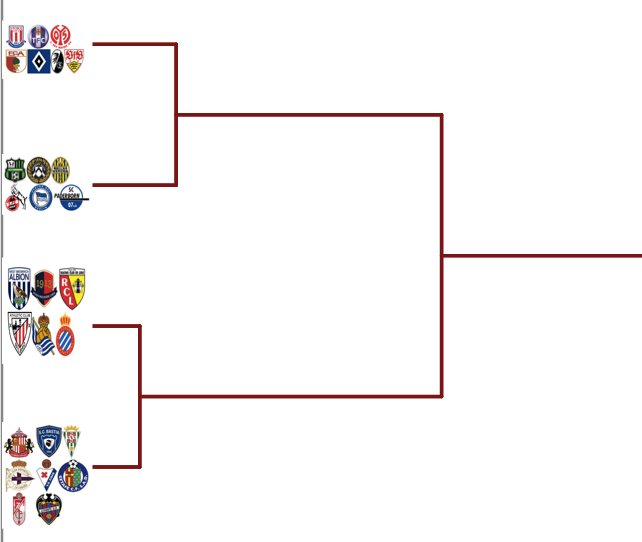
Group 13: Stoke, Toulouse, Mainz, Augsburg, Hamburg, Freiburg, Stuttgart and
Group 9: Sassuolo, Udinese, Verona, Koln, Hertha, Paderborn Here we find most of the bottom of the German table. We find teams in this group play normal length passes deep in their own half but play long balls into the box. They have low possession rates, low field tilt and very low intra-box success rates. Group 13 has the ball and tests the box a lot more than group 9.
Group 16: West Brom, Caen, Lens, Athletic, Espanyol, Real Sociedad and
Group 14: Sunderland, Bastia, Cordoba, Deportivo, Eibar, Getafe, Granada, Levante These teams are even worse at passing inside the box and couple it with rarely getting the ball to the box. They generally play long balls throughout the entire field, don't play centrally, and don't have a large share of the ball. Group 16 has a higher share of the ball, play shorter passes into the box, and have a significantly higher field tilt. Last year David Moyes was in the Champions League managing Manchester United against Bayern Munich and he ends this season lumped in with Caen and West Brom by some guy on StatsBomb. What a fall. 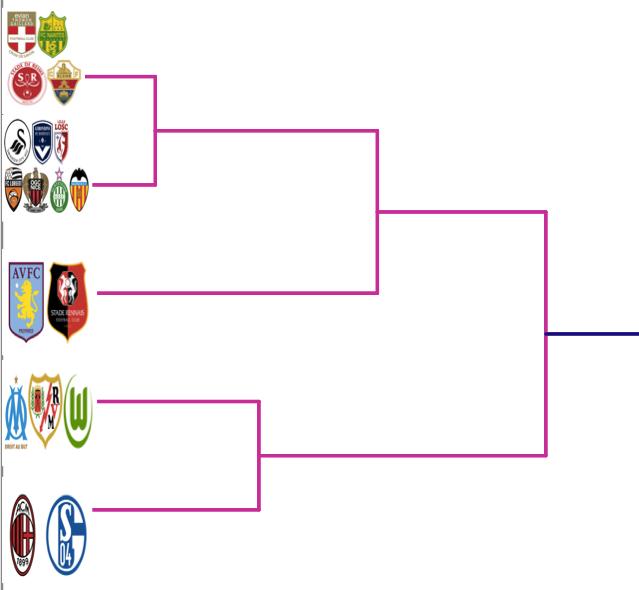
Group 17: Evian, Nantes, Reims, Elche and Group 15: Swansea, Bordeaux, Lille, Lorient, Nice, St Etienne, Valencia Here we have the patient, pick your spots teams. These teams breach the box at very low rates, but break into the box using short passes (group 15 significantly shorter) and complete a very high rate of their intra-box passes. Group 15 sees more of the ball while Group 17 plays mainly through the wings.
Group 11: Aston Villa, Rennes Low possession teams generally play directly and shoot quickly when they get the ball. They don't have the quality to hold the ball and play intricately so seem to
rush the ball up the pitch and fire. Aston Villa and Rennes do not: 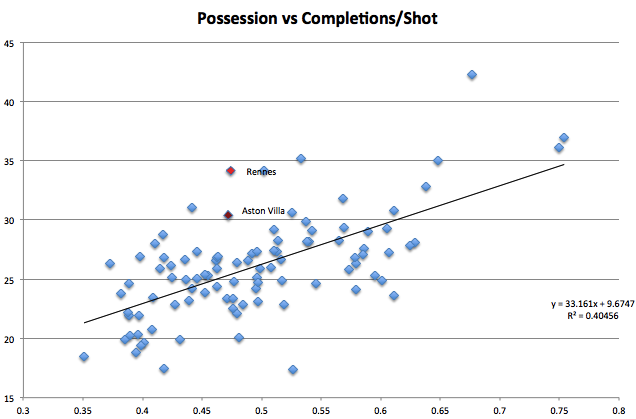
They couple their low shot tempo with the longest average pass length of any group when entering the ball into the box and below average intra-box pass success rates. So they aren't picking and choosing prime spots, but seem to simply have a lot of useless completions that don't get them closer to the box or a shot. Not pretty.
Group 18: Marseille, Wolfsburg, Rayo Vallecano An interesting group here with two high-pressing defenses in Marseille and Rayo. These teams have the lowest average field tilt of any group and a high rate of forward play. They play short passes at both ends of the field and tend to play through the wings in the attacking third. It's a strange profile as they almost play counter-attack football with very high possession rates. I am guessing the fact the game has become very stretched in Marseille and Rayo's case leads to many of these numbers. When the other team is wide open you can play forward and don't spend a lot of time passing it around against a set box (which would raise your field tilt rating).
Group 7: Milan, Schalke If nothing else comes from this, I think the grouping absolutely got this one right. On a gut level this just feels perfect. Two big-budget teams who performed absolutely dreadfully this season (barring maybe the most bizarre game of the season in Madrid). Slow, ponderous play that rarely gets the ball near the goal or tests the box does not make for good watching. For good measure they are atrocious at passing inside the box. At least they don't hit a lot of long balls, right? After this group there is a big gap. Look back up at the main tree and you will see there isn't much similarity between groups 7 and 18 and then 20. 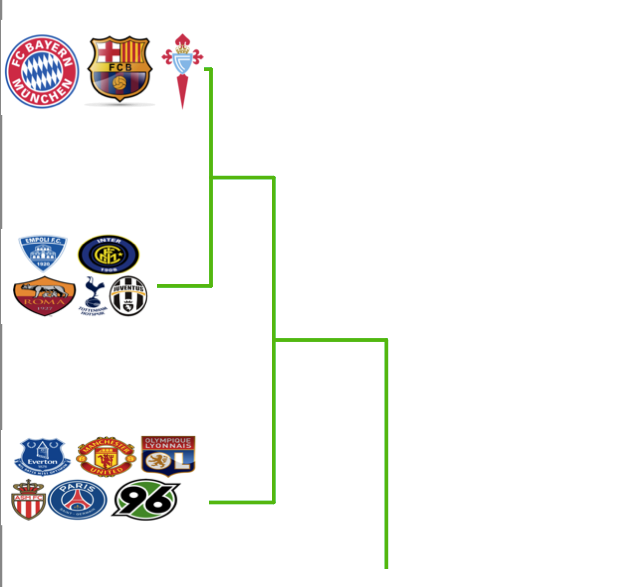
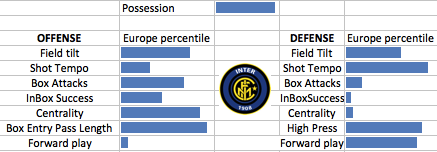
Group 20: Bayern, Barcelona, Celta Vigo and Group 4: Empoli, Inter, Roma, Spurs, Juventus Now we start to get to the high possession, highly effective offenses clustered here at the bottom of the tree. Celta Vigo kind of stand out here and while they certainly don't reach the heights of Bayern or Barca, they style themselves similarly. They are good inside the box, hold the ball at very high rates, attack the box a lot and play short passes to enter the box. When you combine this offensive style with the crazy Bielsa pressing tactics and taking impeccably named Chilean team O'Higgins to their first league title ever back in 2013, Celta manager Eduardo Berizzo should at least be taken a look at for bigger and better jobs in the coming years. Inter and AC Milan finished near each other in the table and are linked together in my generally EPL-centric mind but actually played very differently (a high box entry pass length bar here actually refers to a short pass in
what was an astoundingly poor design choice): 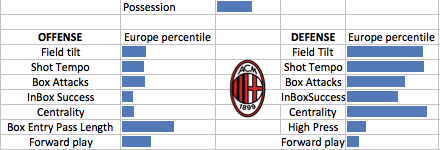
Another team who is interesting in how they profile with these metrics is Empoli. Their defense was mixed in with Fiorentina, PSG, and Manchester United and now their offense reaches high class company as well. Kind of strange for a team that won 8 games all year and finished 15th a year after promotion from Serie B. Without knowing much else about him except these profiles, I'd wager that Maurizio Sarri will be another manager to watch going forward. And as soon as I typed that sentence I scrolled down on his Wiki page to find out that he has been confirmed as the new Napoli manager. Another instance of the profiles running ahead of my knowledge. To get a team with no players on more than $300,000 yearly salary to play like this is quite an achievement. Group 12: Everton, Manchester United, Lyon, Monaco, PSG, Hannover, Gladbach An imaging error has led to the Gladbach logo being left off. Any Foals fans feeling left out, please go read my long investigation into the entirety of Gladbach and get back to me. These teams have very slow developing attacks that don't get up the field at high rates. They are very good at passing inside the
box. 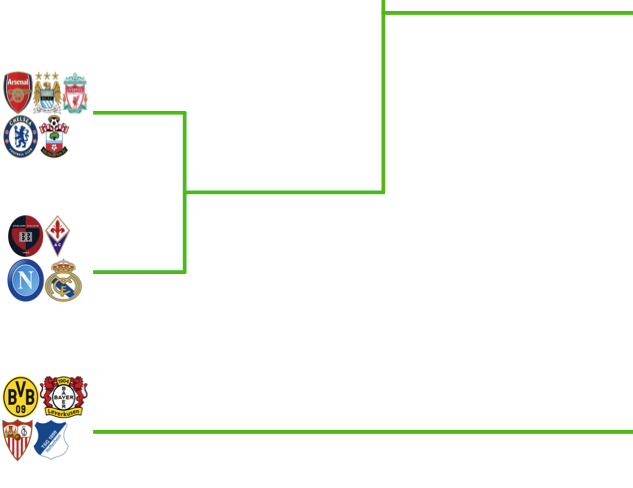
Group 10: Arsenal, Man City, Liverpool, Chelsea, Southampton Saints and Liverpool just barely make this group, but it shows the serious stratification of the EPL once again. These teams pepper the box (Saints 62nd percentile, all others 78+) from central areas (all above 80th percentile), with short passes (all above 72nd percentile) and are great at completing passes once inside the box (each team above 80th percentile). Chelsea and especially Arsenal and City are near the top of Europe at all of these things but Liverpool and Saints are like the little brothers who are doing what their big brothers do, just not quite as well.
Group 2: Cagliari, Fiorentina, Napoli, Real Madrid Only PSG played out of the back using shorter passes than Cagliari. They can take some solace in that stat and the fact their offense was grouped with these 3 teams next season as they play in Serie B. The main problem there was they allowed 68 goals and their defense was grouped with QPR, Burnley, and Chievo.
Group 19: Dortmund, Leverkusen, Sevilla, Hoffenheim The crazy uncles who seem to have little relation to anyone else. Usually shot speed is correlated with possession, as the chart with Aston Villa and Rennes showed earlier. Here we see it flipped the other way: teams with high possession who still fire a lot of shots per pass. 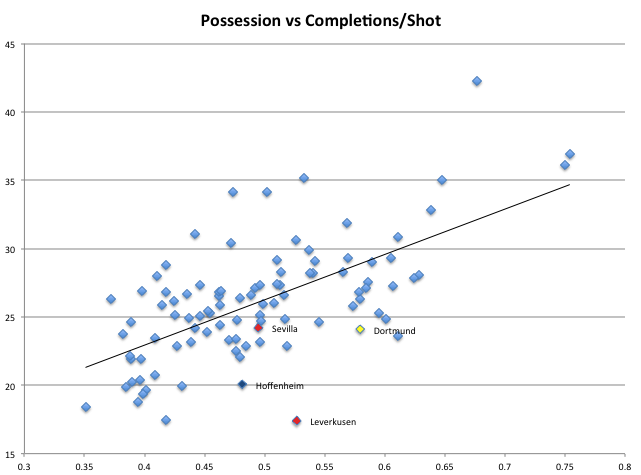 This group also has a higher % of their passes in the "red zone" or the 25 yards or so within the goal of any group. They pepper the box more than anyone bar the Bayern/Barca group and play extremely centrally.
Going forward I think there is great potential with this type of analysis, especially once we begin to drill down into style vs style or game to game analysis. Tom Worville thought it could be used for transfers for teams looking for flexible players or possibly players with experience playing the style they wanted to. I am not sure if I would feel comfortable basing player analyses on this broad, team-level data right not but certainly it could be good for a starting point. For example, if Sunderland is looking to fix their offense maybe they would study what Athletic Bilbao does differently. Since Bilbao does a lot of things similarly to Sunderland, the differences might be easier to reach than studying Arsenal or Barcelona. At the very least, a quick glance at these graphs can make anyone much more knowledgable about the game across Europe and then decide what to look at further from that. For example, I had no idea about Empoli or Celta Vigo's style of play before a week or so ago. Now I will keep my eye on Maurizio Sarri and Eduardo Berizzo going forward despite having not watched more than 30 minutes of those two teams total in the previous year. And again, this is a rough guideline. If you change any of the metrics or the number of clusters you would get slightly different results. Southampton and Liverpool were close to breaking off into a separate group from the big 3 English offenses, Swansea was close to joining group 17, Bremen and Hannover are only loosely attached to their groups and several more things might have changed. These groups are not set in stone at all. Discussion If you have any questions, criticisms, comments or want to discuss this further you can reach me on twitter @SaturdayonCouch or post a comment on my blog. I'd love to discuss.
A Family Tree of European Defenses

 Last week on StatsBomb I wrote about profiling teams and finding similar teams through styles of play. In that piece I mentioned the next step might be grouping teams as a basis for comparing how certain styles of plays match up against each other. This is the first step toward that, as I've compiled a rough family tree of European defenses playing styles. First, a reminder of what metrics I'm using to determine style of play: 1. Possession 2. High press score (completion % allowed 60 yards+ from goal) 3. Shot Tempo (shots per completion) 4. Field Tilt (ratio of final third/own third completions allowed, higher means opposition spends more time upfield) 5. Box Activity (passes into box allowed per game) 6. Intra-box completion % (passes that start and end in box) 7. Forward play (% of passes that are forward) 8. Centrality (% of final third completions that are in the middle of pitch) In the previous piece, I found similarity scores for entire teams. Now, I am focusing only on the defensive side of the ball. I couldn't go team-by-team manually grouping teams and I couldn't eyeball teams so to group the teams I used a k-means cluster analysis. All the metrics had been normalized, so no one variable dominated. The problem with k-means is you have to choose how many groups there are yourself. To choose how many groups to use, I ran a k-means analysis for each possible number of groups from 5 to 35 and found that 20 was right about the spot that the amount of variance stopped decreasing consistently. This is called the elbow test and while the results weren't totally definitive, they fit in well with the general rule of thumb for determining # of groups which is the square root of the # of observations/2. All this to say, the 98 teams are divided into 20 groups. Let's look at some of the interesting groupings. First, group 4:
  Something stands out here. You've got these teams with large profiles that you've seen late in European competitions recently and then United and Empoli, am I right? Seriously, I've never watched a full Empoli game so was surprised to see them pop up in this group. The defining characteristics of this group are very high levels of possession, a low defensive field tilt (opponents spend relatively more time in their own third than in attacking third), low box activity, high shot tempo allowed and are easy to complete the final pass against inside the box. It's not always easy to get the ball upfield past these defenses, but once you do you have a good chance of a quality look at goal. Might call them the soft underbellies.
 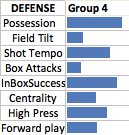 Group 8 is another interesting group to look at, I like to call them the nullifiers:
  Napoli, Lille, St Etienne, Nantes, and Atletico Madrid have a little above average possession and an average press score as a group and then allow almost no central play (11th percentile), are very good inside the box (23rd), rarely have the box tested (11th), and allow an extremely low shot tempo (9th). This all adds up to under 10 shots allowed per game and barely over a goal per game allowed. I'd figure the managers of these teams are thinking first, second, third and fourth about nullifying the opposition when they set their teams out.
 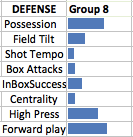 The final group of teams to look at is one near and dear to my heart, the Bielsa Disciples in Group 16:
  I personally absolutely love watching the style that Marseille, Celta de Vigo, and Rayo Vallecano play. I say that somewhat hypothetically as I haven't watched more than a half of Celta de Vigo and didn't know much about them before I began this process. When I saw them popping up alongside Marseille I looked them up to make sure I wasn't missing something. I found their coach Eduardo Berizzo is a Bielsa disciple who worked as an assistant to him for several years for Chile. The fact the algorithm knew it before I did is a good sign. These teams all have high possession numbers and have extremely high presses. They also allow a higher centrality than any other group, a higher shot tempo than any other group, and higher forward play than any other group. If you love to see crazy man-to-man marking up the pitch with a high risk of a long ball down the center of the pitch leading to a shot, these are the teams to watch. Rayo came into the Camp Nou and ruffled Barcelona for about a half late this season before being eventually blown away 6-1. Marseille led PSG through goal off a high takeaway before being cut open 3 times in quick succession. This group provides exciting, physical games with lots and lots of open space.
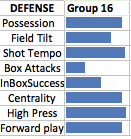 There is a lot more interesting stuff in all the individual groups, but more on another day. Each group and their central metrics will be at the bottom of the article. Building the tree I had a bunch of groups or families of teams but I wanted to know which were related. I knew the Bielsa Disciples group wasn't going to be close to a group with Aston Villa, but how close were they to the soft underbelly of United? I wanted to know. So with the 20 groups average metrics replacing the individual teams metrics, I ran another type of cluster analysis called agglomerative hierarchical clustering. It basically uses similarity scores among groups to build a family tree showing who is related and by how much until all the groups are connected. I will post the tree with the group names (which mean very little to you), and then go through an example involving a team. Here is what the tree looks like:
 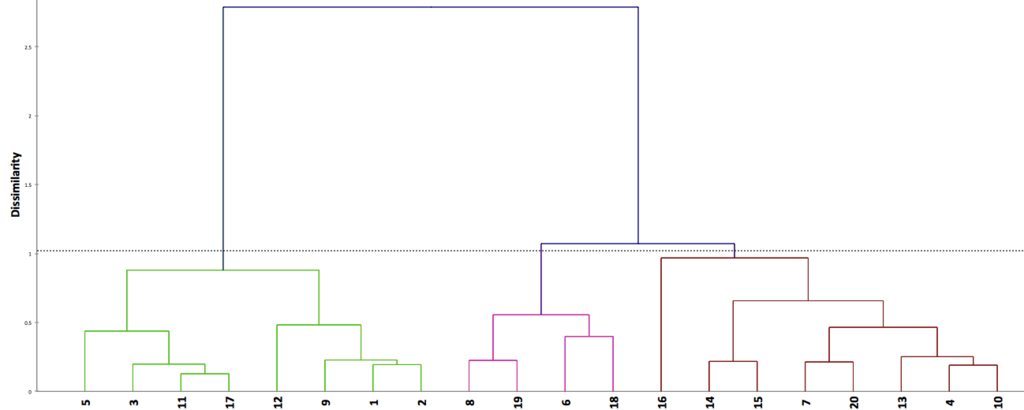 We will be using a team from group 7 to follow up the tree. Group 7 teams are distinctive for a very low shot tempo allowed, low box activity, and high possession. This is a common defensive profile among good Italian and English teams (why that is is a fascinating question but well beyond the scope of this article). The profile and members are below:
 So if you are Liverpool (our example), the teams who defended most similarly to you this year were Saints, Juventus, Chelsea, Arsenal, Lazio and Man City. These are your siblings on the defensive family tree. We can see on the tree that this group of teams are very closely related to group 20 mainly due to the fact that group 20 teams have a very low box activity and very low shot tempo against as well. Group 20 is an all-Spanish affair:
  On the family tree, these are the cousins/primos who you see at the holidays if you are Liverpool. The main differences between group 7 and 20 are the Spanish sides have lower possession, higher pressing, have a much lower centrality percentage, and are a bit easier to pass against inside the box. You can see that playing a similar style doesn't guarantee similar results as Levante and Athletic's style's led to a 25 goals allowed difference, the huge possession difference a big factor there. The next step up the tree we see groups 13, 4, and 10. These are the relatives you might see at a family reunion every few years. We already saw group 4 above (the soft underbellies of United, Empoli, PSG, and Fiorentina). Group 10 has Lyon, Roma, and Bordeaux:
  and group 13 has the strange trio of Spurs, Everton, and Real Madrid:
  The rest of the teams on the right side of the defensive family tree are only tangentially related to Liverpool and their siblings: Group 16 (Bielsa Disciples), Group 18 (Toulouse and Malaga), Group 6 (Inter and Barcelona), Group 19 (the dominant German pressure of Dortmund, Bayern, and Leverkusen), and Group 8 (the Nullifiers). Maybe at a funeral or a wedding you see one or two of these guys, but you are vaguely aware there is a little of your blood in their bodies. Once you get to the other side of the family tree, it's open season. No longer are you close enough relatives to know any of the same people or worry about incest, you are basically total strangers. Some of these total strangers include a massive group 5 full of German teams, Gladbach and Torino's total box shutdowns in group 12 and the general low quality of Chievo, QPR, Burnley, and Villa in group 2. Strengths, weaknesses and looking forward This is the next step on a project that is eventually wanting to determine if certain types of teams play better against other types. Maybe we find out that the Bielsa Disciples do better than expected against teams who like to have low possession and use long balls to move the ball upfield. Maybe the Nullifiers don't do well against those teams. I don't know if anything will come of that but that's what I'm going to continue to look at. The next step is to build an offensive family tree and then start looking at match-ups between the two. Eventually, we can drill down to game-to-game or month-to-month level and see how teams are adjusting their styles throughout the season or against different teams. Another step, and one that could a massive project will be who is dictating what on the pitch. If a team like Torino who is almost off the charts at getting the ball central plays Metz who allows almost no central play, what would we expect? How does this change for shots, long balls, in-box passing skill, etc. It sounds like a very hard but worthwhile project and I think these steps can help build the groundwork for that. The strengths are I like identifying relationships I had no idea about before. The Celta Vigo example is perfect. It was a team I knew little about and the numbers told me they played like Bielsa disciples before I had researched them or watched a game. The possible weaknesses are maybe too much info is being lost along the way here. Passing numbers are being converted to percentiles which are being used as one of 8 metrics to group teams together, then clustered further. So much is lost at each step, it's hard to make any concrete conclusions from just seeing this tree. It's an incredibly fun and I think a valuable informational tool, but might have limited value if you are a coach or a GM setting up a team. Also, the metrics could (and almost surely should) use some fine-tuning. Field tilt in particular needs to be honed to include every pass, and each one could use a full article or two to really flesh out. For know, this remains a first draft but one that could open promising new areas for exploration. To conclude the article, every group and their metrics are posted below. Hopefully you enjoyed! Comments are closed here, so if you have questions, comments, or want to discuss the article you can go to my blog by clicking here and comment on the article which should be posted soon after this article runs here or chat with me on twitter @SaturdayonCouch The Groups Group 1 Atalanta, Milan, Sampdoria, Verona, Leicester City, Stoke City, Sunderland, Swansea City, West Brom, West Ham Group 2 Cagliari, Chievo, Palermo, Aston Villa, Burnley, QPR Group 3 Cesena, Udinese, Lens Group 4 Empoli, Fiorentina, Manchester United, PSG Group 5 Genoa, Mainz, Frankfurt, Augsburg, Schalke, Hamburg, Hannover, Freiburg, Bremen, Hoffenheim, Stuttgart, Wolfsburg Group 6 Inter, Barcelona Group 7 Juventus, Lazio, Arsenal, Chelsea, Liverpool, Southampton, Man City Group 8 Napoli, Lille, Nantes, St Etienne, Atletico Madrid Group 9 Parma, Palace, Hull, Newcastle, Koln, Hertha, Paderborn Group 10 Roma, Bordeaux, Lyon Group 11 Sassuolo, Cordoba, Deportivo, Eibar, Espanyol, Getafe Group 12 Torino, Gladbach Group 13 Everton, Spurs, Real Madrid Group 14 Bastia, Caen, Evian, Guingamp, Montpellier, Rennes Group 15 Lorient, Metz, Monaco, Reims Group 16 Marseille, Celta de Vigo, Ray Vallecano Group 17 Nice, Almeria, Elche, Granada, Real Sociedad, Sevilla, Villarreal Group 18 Toulouse, Malaga Group 19 Leverkusen, Dortmund, Bayern Group 20 Athletic, Levante, Valencia The central metrics for each group: (percentiles)