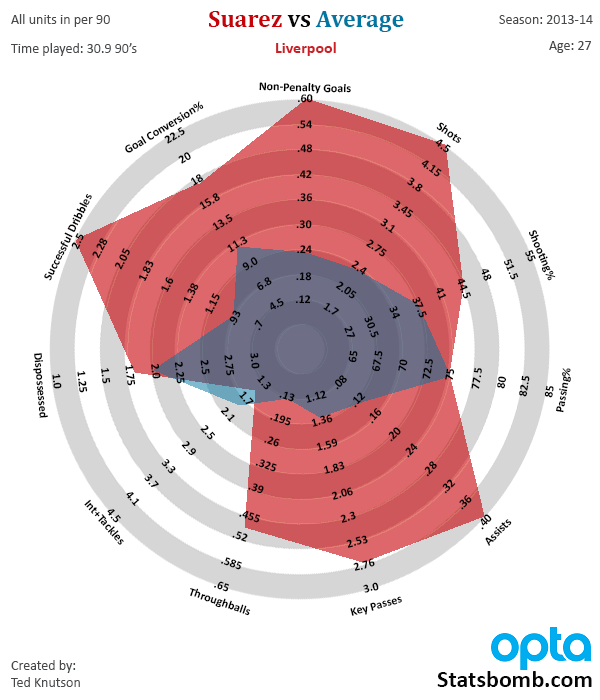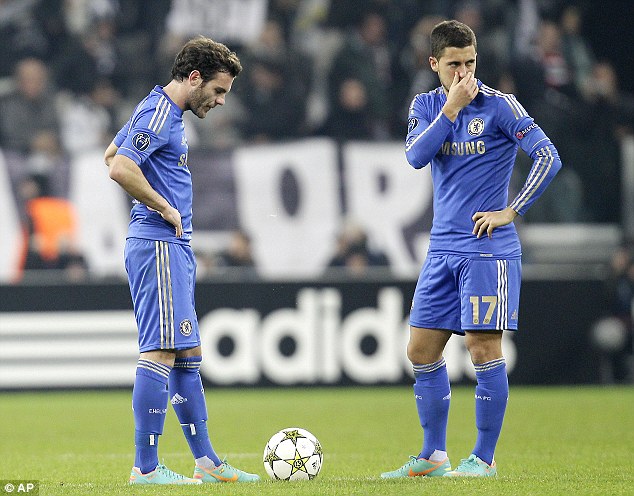
One of the things we like to do here at StatsBomb is to take popular perception of things in football and apply stats to them to see if they hold true. Today I want to examine the stats a couple of star-crossed attacking midfielders to see whether they are over or underrated in popular opinion versus actual performance. Eden Hazard The little Belgian mastermind was one of Chelsea’s most exciting players this season. With 14 goals and 7 assists in 32 starts, he was the driving for behind their effective, but sometimes stunted offense. Transfer rumors this summer have linked linked him with moves to PSG worth up to £50M (though these seem less likely now that PSG have bought David Luiz for £48M. It feels like there should be a clause “and a player to be named later” added to the transfer or something). Should Chelsea laugh in the Parisien club’s face at the thought of stealing away one of their most exciting young players, or should they jump at the offer? These are some key stats for Hazard this past season. 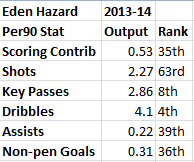 Now explain to me, what combination of those stats would make Hazard worth £50M? He is a great dribbler, and his key passes are quite good. In fact, you could argue that his KP to Assists return this season (ranked 8th in one and 39th in another) was deeply unlucky and would have bumped him up the scoring ladder in the process. That said, Hazard isn’t a shot monster. He’s not leading the league in shot creation like Suarez was last season, and he’s .7 of a key pass per 90 behind David Silva on that front. For those who suggest he could mature into that guy - even when he scored 20 goals for Lille, 9 of those were penalties and he only averaged 3 shots a game. To put it another way: His combined scoring contribution this season fell between Emmanuel Giaccherini and Charlie Adam. Seriously! It’s his dribbling and passing ability that make him truly valuable, but he’s not in that top, top tier of guys in any of those categories yet, and he is playing for a good team. Verdict: Overrated. Hazard is a very good young player, but you can’t argue he’s in the same ballpark as Suarez, Reus, Cavani, or even Sturridge. Juan Mata Chelsea’s player of the season in 2012-13, Mata was the subject of a £37M move to United in January after being found to be surplus to requirements by Jose Mourinho. That’s a strange season. I thought United overpaid at the time by £5-7M, and that’s based on what Mata’s previous season was probably worth and not the numbers he put up in his struggles under Mourinho. That said, his team splits make for some awfully interesting reading.
  Whether it’s the product of luck, different systems and roles, different managers, or whatever, Mata has been worth half a goal more per 90 minutes at United than he was at Chelsea. If you take his full-season scoring contribution, he ranks right behind Eden Hazard for the season, and directly above Charlie Adam. However, if you just take his United splits, he shoots up to 13th or so, right above Yaya Toure (remember, penalties are excluded). That’s a massive swing. The other thing I find fascinating about Mata is that despite the claims that he wasn’t defensive enough for Jose, he still produces half a tackle and interception better per game than Eden Hazard does, though it’s admittedly over 1 I+T less than Oscar. Verdict: Underrated. United probably still overpaid when they bought him, but Old Trafford will be happily singing his name if he produces like he did in a red shirt again next season. Willian I know, I know, this is suddenly strangely Chelsea-heavy when I meant to take a wider look, but this needs to be said: Willian had a great first season in England. This guy does not get nearly enough love – he might be the best two-way attacking midfielder in the league.
 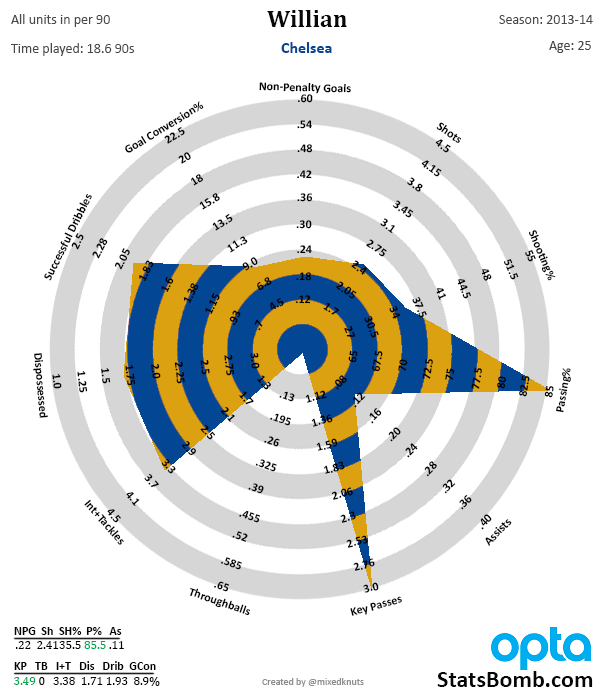 Much like Hazard, the assists lag severely behind the key pass figure, where he was second in the league, just a snip behind David Silva, and better than Ozil, Nasri, Eriksen, etc. Very impressive stuff, as is his defensive output of 3.38 Interceptions +Tackles per 90. The only guy that’s even close among the top 10 KP guys is Phillipe Coutinho, and he’s completing 1 entire KP per 90 fewer than Willian. Add in nearly 2 dribbles per game and a better-than-league-average crossing percentage and you have a quietly outstanding player. The one issue at hand is his shooting. He’s below average in shooting percentage and conversion rate, which means that his shooting locations could probably be better. He clearly has the skills to do so, though, and a small adjustment in decision-making there will likely pay big dividends in front of goal next season. I look forward to seeing what he does with more lethal forwards up front for Chelsea. Verdict: Underrated. He’s possibly the best two-way (attack and defense) attacking midfielder in the league.
Month: May 2014
Wayne Rooney's Fantastic Career
This morning Paul Scholes broke rank somewhat by giving his opinion on Wayne Rooney's mentality, training ethic, and somewhat logically, his unsuitability to play center forward for the remainder of his career. It has long been mooted that Rooney would into a deeper tactical position as the years progress, an dit isn't beyond possibility to see Rooney played as an attacking midfielder/schemer/roamer type once into his 30's.
I'd link you to the article Scholes wrote (ha) but search for "Nicklas Bendtner arse" and you'll find it easily enough from there.
See:

Scholes Quotes:
Wayne was in the Everton team at 16 years of age, in 2003. Since then he’s played at Euro 2004, two World Cups, Premier League, and Champions League every year at United. There’s a chance he’s worn out. Wayne’s peak may have been a lot younger than what we’d expect of footballers traditionally. Age 28 or 29 has been the normal ‘peak’. With Wayne, it could have been when he scored 27 league goals in 2011/2012 when he was 26.Pretty juicy.
Scholes continues:
Wayne might be a player who’d retire come 31 or 32, given the amount of football he’s played. Ryan Giggs has been on the go for ages, but he adjusted his position. Can Wayne do the same?I don’t think Wayne will be able to play centre forward until he’s 34 or 35. But he could play centre midfield, possibly, into his mid-thirties.
In short, Scholes thinks that Rooney may well have peaked in 11/12; that he may have a lower age peak than other players due to miles on the clock; and that Rooney can't play center forward until he's 34 or 35. I'm not in huge disagreement with points 2 and 3, and if Rooney is still playing center forward at 35 it will be because he has followed the Martin petrov route.
I was thinking over some of the points made in Scholes' article, specifically: has Rooney peaked and what does Rooney's career arc look like?
A quick search later and I stumbled on earlier StatsBomb work from Ted which looked at Rooney's most recent 5 seasons using detailed stats. You should check it out, there's radars and all! What I wanted to do was look at the entirety of Rooney's pro career (12 seasons) and to be able to do this we have to abandon some of the more detailed stats featured in the radar piece. Why? Well, the football stats dark age ended in 2008-09 and from that point onward we began to have access to more detailed game stats like accurate shots on target info, key passes, giveaways, takeaways etc. etc.
I don't want to repeat previous work so what I decided to was take Rooney's basic info from all 12 seasons of his pro career including the Everton days.
All numbers are from the Premier League only.
Stats we can examine:
- Percentage of minutes played.
- Goals p90
- Assists p90
- Scoring Contribution p90
- Shots p90
- Conversion%
Six categories which will be broken down by age during the relevant season. I'll also include a rolling average of his performance throughout his career.
Percentage Of Minutes Played

Rooney's career average sits around 70% of minutes played which, for a player with that many miles on the clock, is pretty impressive. Pretty durable player, alright.
Goals p90
Penalties, penalty shots are, and always have been, stripped out.

Remember Scholes' quote about Rooney having peaked in 11/12 (26 yo season)? Was Scholes fooled by Rooney's excellent goalscoring in 11/12 and thus concluded that "peak" must have arrived in the season he scored the most goals, ignoring Rooney's general contribution as a forward?
Scholes obviously watched Rooney up close and may have been able to detect subtle changes in Rooney's game and where he may have declined over the years, but 11/12 looks like a spike in performance (as does 09/10) due to shot volume or conversion% or tactical usage and not the start of some terminal decline.
Despite varying quality of teammates this chart is actualy quite clean: growth in the early part of his career, 2 years of overperformance, one year of underperformance and pretty consistent numbers apart from those over/under seasons.
Assists p90 
Remember how I mentioned usage when talking of Rooney's goals p90 numbers.
Check his 24 to 26 year old seasons out:
Age 24
Goals p90 0.73 Assists p90 0.10
Age 25
Goals p90 0.32 Assists p90 0.45
Age 26
Goals p90 0.67 Assists p90 0.13
I could be wrong but that looks like tactical usage. In general assist rates for Rooney's career are all over the place.
Scoring Contribution p90

Once we add Goals p90 and Assists p90 we see can clearly see Rooney's consistent contribution as a forward. Scholes may well believe Rooney peaked in 11/12 (age 26) but age 22 and age 27 stand out above all others.
At age 22 Rooney posted an excellent scoring contribution number and part of this was due to operating in close proximity to the legendary Cristiano Ronaldo. That was the year that Ronaldo scored 31(27) league goals (5.76 shots p90, 0.88 Goals p90). Ronaldo draws teammates into his orbit of excellence and thus they post better numbers.
All told, since Rooney's peak, at least according to Scholes, the England forward has posted 2 of the best 3 Premier League seasons of his career in terms of scoring contribution p90 minutes. The rate stats don't lie although it is important to factor in the percent of minutes Rooney has played in each season.
Shots p90

Rooney has always posted pretty good shot volume, even in his 17 and 18 yo seasons (he was really something at that age), but three of the last four seasons of shot volume have fallen below Rooney's career average. Not entirely sure why that has happened:
- Declining team talent level?
- Different tactical usage?
- Different team tactics?
- Decline in his own game?
The first 3 points have merit, hell even the fourth one may have merit but Rooney's contribution numbers have held steady despite his shot rate declining.
Conversion% 
Part of the reason Rooney's Goals p90 numbers have remained strong despite below average shots generation is due to the graph above. Rooney's conversion % has been on an upward trend (bar a couple of down years) for the players entire career. It is possible that Rooney has become a better shooter as he has grown older, or that he has learned how to shoot from better positions on the field. It is also possible that tactics were geared towards getting Rooney into the best scoring positions possible.
It is certainly a curious trend, though.
Conclusion
Rooney has been an excellent footballer throughout his career and we don't need to waste too much time arguing otherwise. Has he become as good as hoped? Maybe not, but he is a player who contributes in terms of goals and assists at a very good level despite the changeable quality of teammate over the years.
As for Scholes' theory that Rooney may have peaked in 11/12 (26), well, I'm not so sure.
It is easy to see why Scholes may have come to that conclusion: Rooney played the most number of minutes of his career and as the main striker. He scored a ton, had his 3rd best shot volume season while posting the 2nd best conversion%. It is easy to see why such a season is held up as the last of Rooney's peak. Instead, it should be held up as an outlier season. A season of splendid achievement created by tactical usage, excellent health and a spike in both shot volume and accuracy.
It likely wasn't Rooney's peak from which he has now regressed. It's just that since that season Rooney's role has changed (he's assisting more goals), the quality of teammate and tactics may have changed, but still the player has posted 2 of his best 3 seasons of scoring contribution since he "peaked".
Rooney has been mighty good since 11/12, but he's been mighty good in a slightly different, more all-round way.
Career

Premier League 13/14: Players that shot from best and worst places

In an article published last week I looked at which Premier League players performed particularly badly in terms of finishing the chances that they had. We discovered that Chelsea's Ramires had the dubious honour of being the inaugural winner of the Premier League Sodden Boot. In this second installment of our end of season Premier League shooting review I want to look at the average chance quality of shots taken by individual players. Once again, I will undertake this analysis through the lens of the ExpG model (created with Constantinos Chappas) as we determine which players’ choice of shot quality gave them the greatest chance of scoring, as well as those that did anything but that. The ExpG model takes into account much more of each shot's specific circumstances than just the location, but the shot location is extremely important; hence the title of this article. Data Rules As with the Sodden Boot analysis I am only looking at players that took in excess of 50 shots (or headers) in the Premier League this season. In performing this analysis I have excluded penalties and shots taken directly from free kicks. A penalty taken will see a player’s overall average ExpG value per shot increase due to the approximate ExpG of 0.77 that a penalty gives them, and this is not required as the purpose of this article is to assess the quality of the chances attempted. Top of the Pops Based on the stated criteria – at least 50 shots / headers, excluding penalties and direct free kicks - can you take a guess as to which player’s chances, on average, were of the highest quality this season in the Premier League? [table id=67 /] At 6ft 7in, Peter Crouch certainly wasn’t the first name that I thought of, but, by some margin, his shots and headers had the highest average ExpG value, ie chance of the shot resulting in a goal, during the 2013/14 Premier League. In fact, Crouch was the only player to have an average ExpG per shot of greater than 0.20. As expected of a player with such a physical advantage, Crouch had a large number of headed attempts with just 34 of his 60 efforts at goal being struck with his feet. I have written previously that headers are converted at lower rates than kicked shots, and so it is worth pointing out that our ExpG model does actually award a lower value for a header compared to a kicked shot from the same location. I'm sure that Crouch will be disappointed that his 60 shots resulted in just 8 goals this season, compared to the 12.5 that the ExpG values of his shots would have suggested. Crouch’s Shot Locations Crouch’s very attractive shooting locations, split by headers and shots, are as shown below: 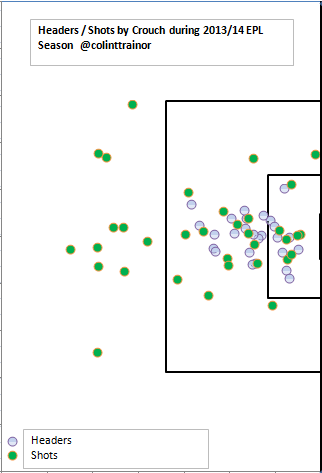 Source for Shot Locations: Opta Best Of The Rest Very interestingly, the three players that follow Crouch and occupy 2nd – 4th place are the three Man City strikers – Aguero, Dzeko and Negredo. Below this grouping of Man City strikers we have the main attacking threat of each of the other leading teams, with one notable exception. Luis Suarez. Although Suarez improved his shooting discipline this season, with the result that the average ExpG of his shots (exc pens and direct free kicks) increased to 0.131 from 0.12 last term, his penchant for long range shooting ensures that he fails to occupy one of the leading positions in respect of the quality of the average shot taken. I hasten to add that, in theory his shooting opportunities were of lower quality on average than those players appearing on the list!! Suarez's average shot quality of 0.131 was enough to see him placed in 19th in the rankings of average ExpG per shot. Man City Attacking Prowess When we see how the remaining leading positions in the chance quality table were shared out amongst the other teams, it is very noticeable that Man City managed to have three strikers that had truly excellent shot chance quality. It is possible that all three players have superb footballing brains and only choose to shoot when the chance is of a sufficiently high quality. Whilst this may be true, it is difficult to think that there are not some serious team effects at play here. Man City’s style of patient, probing play, through balls and pullbacks resulted in them having 47% of their shots from the Prime Zone – the highest rate in the Premier League. Attaining this level of shot quality, whilst also taking the second most shots in the league is the short hand reason why Man City won the league this season. David Silva's average ExpG of 0.148 seen him post the highest figure in the EPL for non strikers; yet another example of just how City were able to create high quality chances this season.
 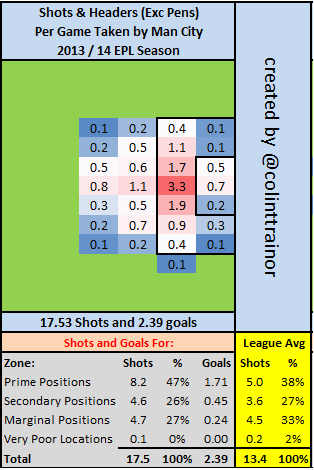 Shot Quality by Team Unsurprisingly, these shooting locations seen Man City possess the highest average ExpG value per shot (exc penalties and direct free kicks) in this year’s Premier League: [table id=69 /] Repeatability of Average ExpG In my Sodden Boot article I stressed that the conversion rate of Goals : ExpG on an individual player level does not yet seem to be repeatable from season to season. The little work I have carried out has indicated that the average ExpG per shot on a player level does show some level of correlation. This is something that I hope to look at closer during the summer recess. However, it is intuitive to think that the average ExpG per shot value is more likely to be influenced by the role played in the team than by a desire inherent in the player to just shoot from positive EV places. Of course, the people at the very top of this table will be in that position due to a very effective combination of both factors; their role on the team as the main striker as well as possessing the smarts to be aware of the quality of the shots they attempt. The Other End of the Table That then leads us to a group of players that do not seem to view shot quality as being of any great importance to them. At this stage I should point out that some of these players do appear to be very good at long range shooting, one such example is the ex-Newcastle midfielder Yohan Cabaye. However, for every Cabaye we have players who, for their own benefit, should be pointed to the following table: [table id=70 /] Nathan Redmond
 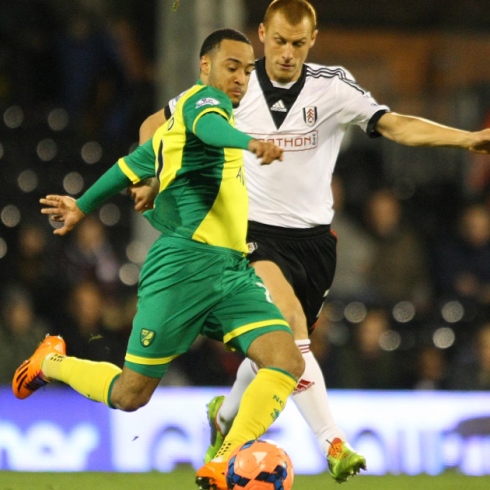 Andros Townsend certainly gained notoriety during the early part of the campaign for his hugely wasteful shooting, and so it is perhaps with some surprise that Townsend doesn’t have the honour of topping this particular table of shame. Instead, with each shot having an average ExpG value of less than 4%, Norwich’s Nathan Redmond can lay claim to be the player that shot from the worst positions during the 2013/14 Premier League campaign. Redmond's Shot Locations
 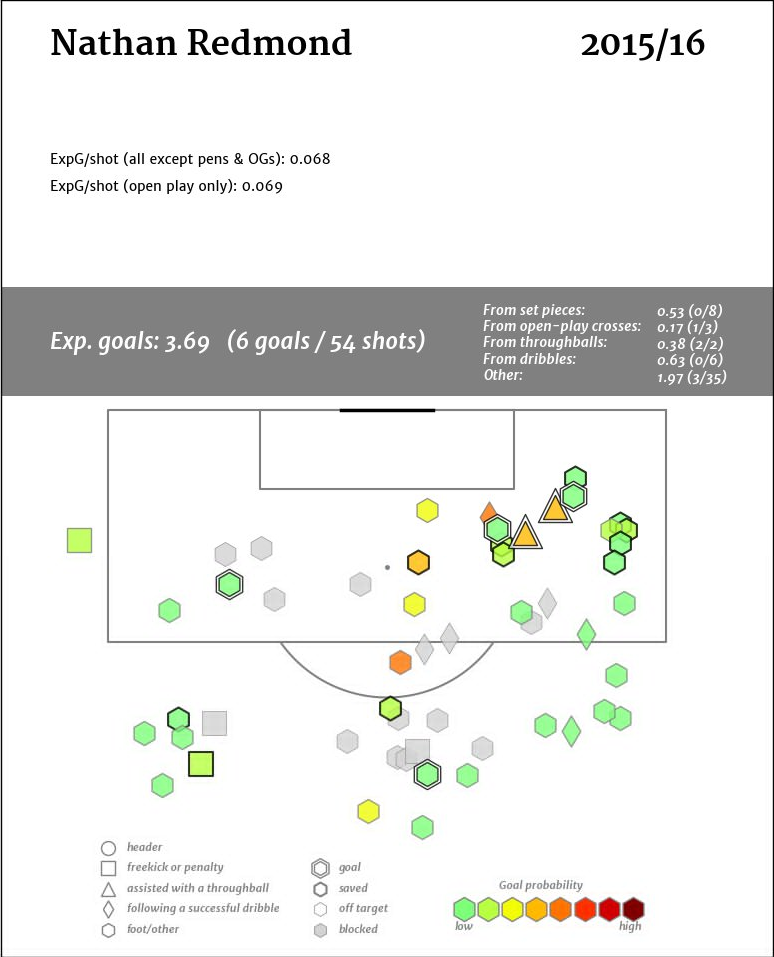 Source for Shot Locations: Opta Townsend and Redmond are both young, at 22 and 20 respectively, so perhaps their shot decision making will improve as they mature. As it stands, however, they only serve to frustrate the Spurs and Norwich supporters as they brought too many of their team's attacks to a premature end this season.
The Top 25 Scoring Leaders: La Liga 2014

Welcome back to scoring contribution week. In today’s scintillating edition, we will look at the Top 25 scorers in La Liga. Who had the biggest scoring contribution rate in La Liga this season? Was it Ronaldo? Messi? New boy Gareth Bale? And where did the ferocious Diego Costa land on the list? I’ll cover all that plus various other topics below. The Top 5 Just like yesterday, I’ll present these in animated radar format, and then give some thoughts about the data.  [All single radars for the Top 5 are included at the end of this article.] WOW, the scoring rate battle in La Liga was tight. You’ll see in the full Top 25 data below that Ronaldo lead the league with 1.20 Non-penalty Goals + Assists per 90 in 2013-14, but there were .01 points per90 separating him from Messi this season. And only .03 points per90 separating Ronaldo from Gareth Bale. That’s razor thin. The other two members of the top 5 are both Barcelona players, giving the Catalan club three of the top 5, and four of the top 10. (Neymar was the other one.)
- This season, I read Barcelona fans on Twitter saying Messi doesn’t tackle much anymore. This is his 5-year trend in Interceptions + Tackles per90: 2.28, 1.39, 1.27, 1.00, .58. And here I thought the Ronaldo puppet’s line was “No trackin’ back.”
- The numbers for Bale, Sanchez, and Pedro are all really interesting because they are all second or third scoring options on their teams, yet performing better than the bulk of Europe. There’s a huge question of whether or not they would continue this level of production if they transferred teams, and both Pedro and Alexis are allegedly available for the right price this summer.
- Re: point directly above. Alexis’s shooting and conversion rates are ridiculous. In fact, Alexis’s conversion rate is not sustainable in the long-term even at Barcelona, and unless his shots go up somewhere (remember, he’s 2nd fiddle to Messi), then his scoring will go down. In his younger days at Udinese, he played more of an attacking midfield role instead of a wide forward, and the bulk of the play went through him. That said, his scoring rate is absolutely tremendous, and he consistently looks awesome when playing for Chile as well. Can he play center forward in the Premier League at only 5’7? Not in a traditional team, no. But can he be a primary scorer on a team that is flexible enough to play to his strengths? Almost certainly. Tevez and Aguero are both shorter, non-traditional forwards who have done very well in England in the past.
- As you’ll see in the big list below, there’s a big drop from Alexis to Pedro, with Pedro’s production basically the same as the second tier of outstanding La Liga players like Benzema, Neymar, Aduriz, etc.
- I think it’s safe to say that Gareth Bale’s first season in Spain has been a success.
The Top 25 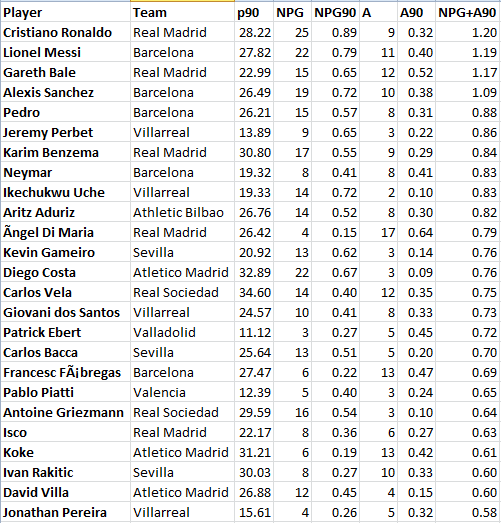 The thing that strikes me about this list is how few young players there are. Outside of the big 2, almost every player in the top 25 is in their prime or still performing well into their 30’s. That makes it tougher to spot bargains that English clubs should be grabbing before they explode into the mainstream. From my transfer profiles last season, I had Costa, Vela, Ebert, Griezman, Koke, and Rakitic all as great targets. (Vela and Isco were fairly obvious, so I didn’t profile them, but I do hope Vela comes back to England this summer. He had an amazing season for Sociedad.) After that it gets tricky to find pure value for age targets in Spain right now, at least in the scoring department. Some lower-half English clubs might take shots at some of the older scorers in Spain right now, but all the best young guys are either already stars (Neymar) or simply owned by the top 2 clubs anyway (Rafinha). Individual Radars
The Top 25 Bundesliga Scoring Leaders - 2014
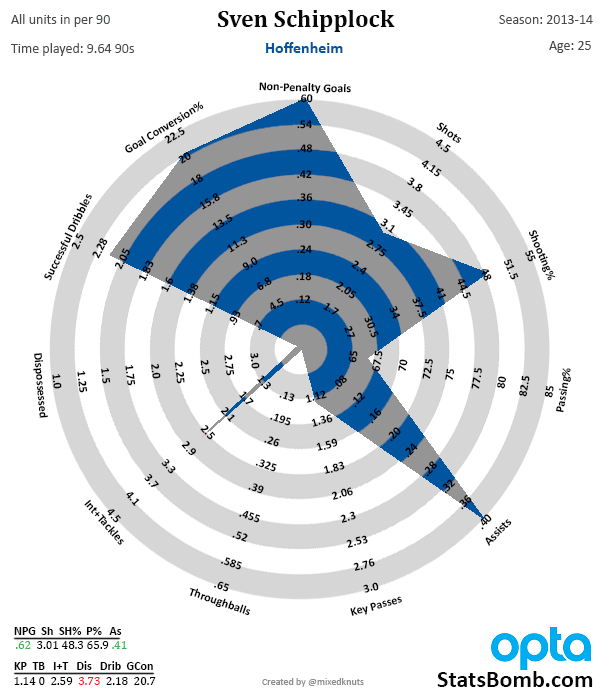
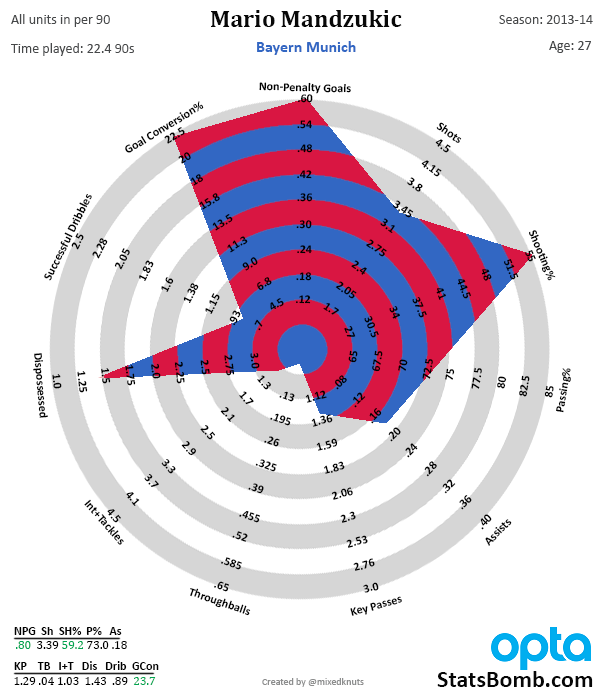
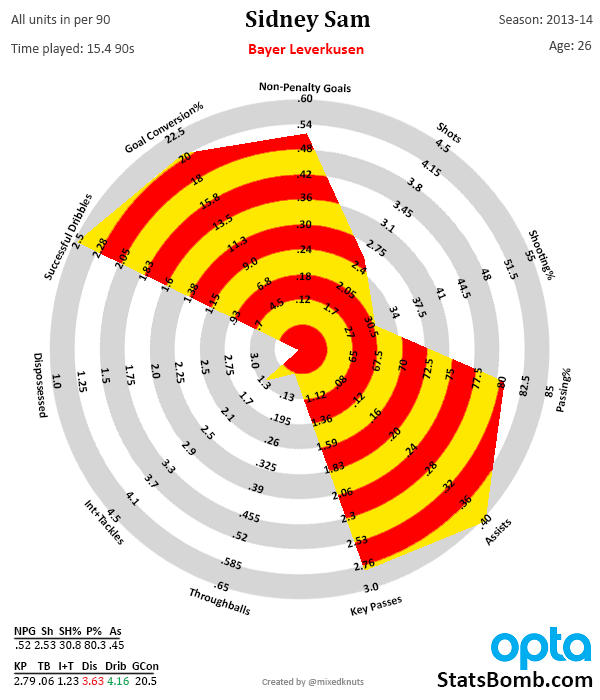
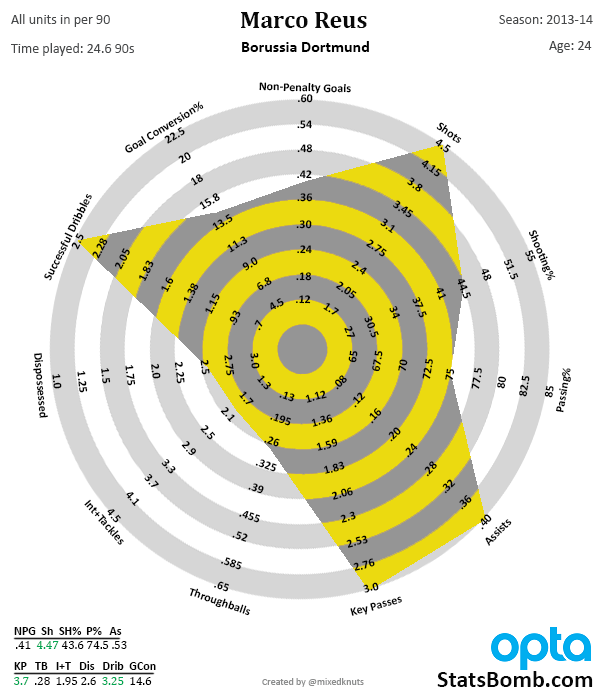
Welcome to scoring contribution week! Sounds exciting, doesn't it? Like ooooo, look at that sexy scoring contribution. No? You may have clicked the wrong link. For everyone else, the deal is this. Now that the season is over, I can finish crunching all the numbers and take a look at who provided the biggest contribution to goals and assists per 90 minutes in each major league in Europe. (To pre-empt Twitter questions: Yes, I will also include the Eredivisie). Why look at Scoring Contribution? Because some of us... okay mainly me... are agnostic about whether a person scores a goal or contributes the pass that leads directly to that goal. Football is a complicated game, full of a tremendous number of moving parts. Focusing on just the guys who get the final touch before the goal can be misleading, but combining goals and assists seems to lead to the best evaluation of overall attacking contribution that we can find right now. Additionally, it's not abstract like key passes and shots on target per 90 or anything - this just counts goals and passes that lead to goals. Simples! For time's sake, I am not going to spend a ton of time on analysis in these pieces, though you can expect to see me refer back to them regularly throughout the summer. Instead of detailed analysis, for right now you will get radars. And gifs. And animated gif radars. The Top 5  If you don't like the gif version, I have broken out each of the top 5 into their own radars below. More information on the new radars can be found here. Also, you will notice I have added the stats grid for the radars in the bottom left now. Red numbers are bottom 5%, green numbers are top 5%. High levels of dispossessions and dribbles are highly correlated. A few quick notes:
- Ribery? Still really good. Also still kinda injury prone. How much will he fall off as he continues through his 30s? We'll find out.
- I had literally never heard of Sven Schipplock until I started playing with these numbers a month ago. Hoffenheim players may need some sort of tax on their offensive numbers to make them compare to the rest of the world.
- Re: Mandzukic... the chances that Bayern create for him are absurd. Conversion rate? Bonkers. Shots on target rate? Bonkers. Combine those with a reasonable number of shots and you will end up with one of the best goal rates in the league. He's good, but I have questions about whether he'll be this awesome elsewhere. Also, he turns 28 in two days. Caution is warranted.
- Sidney Sam... 2.5M Euros. Schalke are stuntin' and flossin' and savin' they money and they hella happy that's a bargain, bitch.
- Marco Reus allegedly has a £30M release clause that becomes active in 2015. If he were on the open market this summer, his expected price would be at least £55-60M. Somebody is getting PAID next summer.
Everybody Else in the Top 25 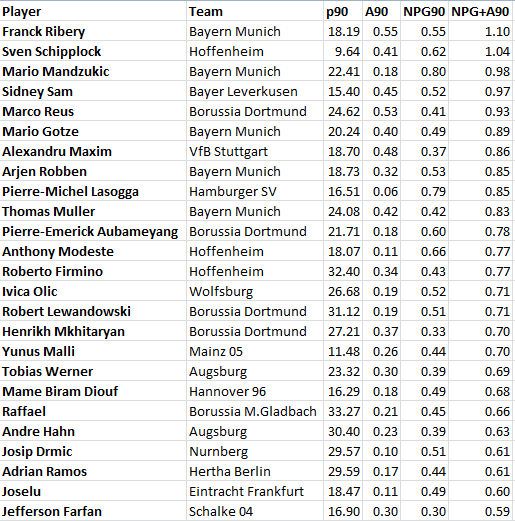 Feel free to hit me up with comments on Twitter, and link to these on Reddit, forums, your Facebook page, print it off and send it through the mail to your dad, or John Cross, or whatever. Top 5 Individual Radars
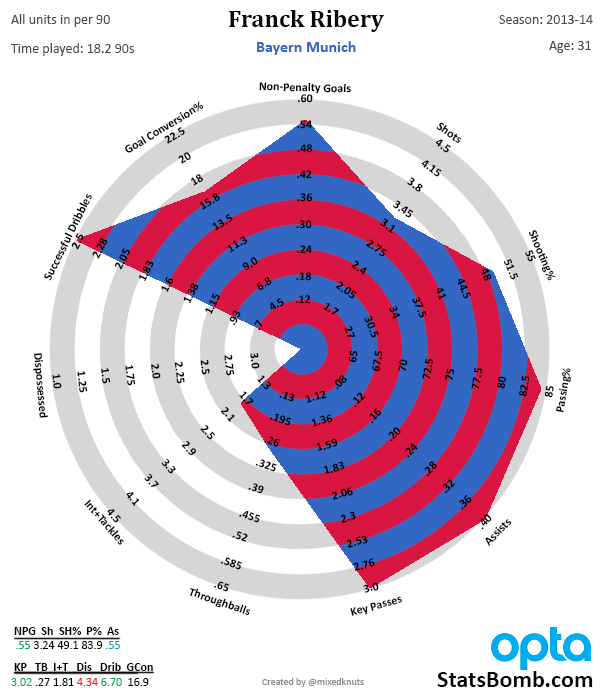
The Sodden Boot: The Worst Finisher in the Premier League
With a total of 31 goals, Luis Suarez won the Golden Boot award for scoring the most Premier League goals during the 2013/14 season.
I felt it was unfair that it is only success that is recognized in the annual end of season awards circuit; surely it is right that glorious failure should be recognized too? So in that regard I wanted to create an award for the worst finisher during the Premier League season.
We know that the Golden Boot is awarded to the player that scores the most goals during the league campaign. However, we can't simply give our award, the Sodden Boot, to the player that scores the least goals. It seems reasonable then that in looking at how a player took his chances that we make reference to the quality of those chances, ie ExpG.
The Soden Boot
The Sodden Boot is to be awarded to the player that had the worst performance in converting their attempts at goal in the Premier League this season.
I decided the cut off should be 50 shots, so I’m only including players that had more than 50 shots (including headers) at goal and I am using a ratio of Goals : ExpG to rank the players.
I’m sure that most reading this article will be familiar with the concept of ExpG, but for those that aren’t please scroll down to the bottom of this article for some brief details.
2013 / 14 Table [table id=64 /]
For information purposes, I have included any player that achieved an actual goals total of less than 80% of the ExpG per our model.
Ramires 
The inaugural winner of the Sodden Boot is Ramires of Chelsea with a dismal return of just 1 goal from his 51 shots. Based on the quality of his chances, our model expected the Brazilian to score 5 goals which results in a Goals : ExpG ratio of just 20%.
The following curve helps us realise how much of an outlier scoring just 1 goal from a sample of shots with a total ExpG of more than 5 is:
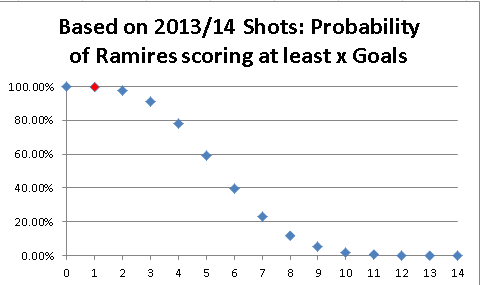
Ramires’ total of 1 goal is the red data point. Based on 10,000 simulations of the shots he took, Ramires should have scored more than 1 goal almost 98% of the time.
With his shots having an average ExpG value of 0.10 we can see that he wasn’t shooting from bad locations.
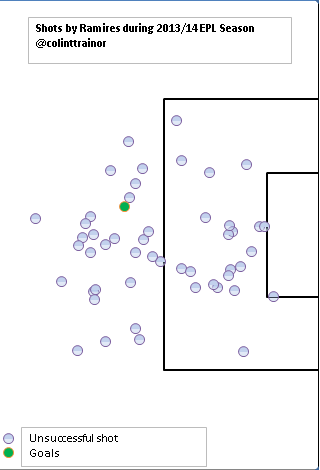
With just 12 of his 51 shots on target (24%) the Brazilian “Running Man” can’t even claim that he was unlucky in terms of opposition keepers performing heroics.
No, quite simply he just had a shocker in front of goals.
To be fair to Ramires, he has some previous form in this regard:
[youtube id="o6HzALxW8jU" width="633" height="356"] Other Notables
Many felt that West Ham’s season took a turn for the better with the return from injury of Andy Carroll. I’m on record as saying that I feel it’s more a case that Carroll’s return coincided with West Ham riding the upswing of volatility and variance. In either case he certainly didn’t add many goals to the West Ham team.
The appearance of the Spurs trio of Soldado, Townsend and Paulinho towards the top of the Sodden Boot table serves as a cursory summary of AVB’s time in charge of Spurs. The poor guy just couldn’t buy a goal.
For a man who was presumably bought to score goals, Nikica Jelavic is perched much too close to the top of that table for anyone’s liking, most of all Steve Bruce’s.
Last Season While Ramires had the worst scoring record on this measure during the 2013/14 season, he would be rightfully annoyed to be thought of as a poor finisher. His performance last season (2012/13) serves to remind us why judging goal scorers, even with the use of analytics and advance stats still has some way to go. In 2012/13, Ramires scored 5 goals from his ExpG total of just 2.4!!!
This is what Ramires' shot locations for 2012/13 looked like:
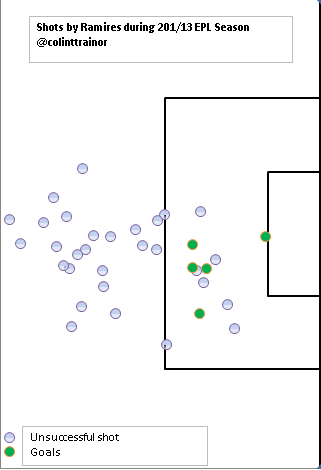
That’s right; in 2012/13 he scored he scored 5 goals from his 35 shots. He went from achieving 210% of his ExpG figure last season to just 20% this season. We have seen that he was the worst finisher in the EPL this season, however last season he had the BEST Goals : ExpG ratio out of the 138 players that took more than 25 shots. That is quite the turnaround. Correlation of ExpG performance from Season to Season
Those numbers clearly show the enormous volatility that exists in the act of shooting. Given the relatively low probability of scoring any individual shot, players simply do not take enough shots over the course of the season to enable us (so far) to pick out the signal from the noise.
It also puts into context just how difficult it is to scout forwards. Even with the use of an advanced metric like ExpG we currently have no way of knowing if a guy that achieved just 70% of his ExpG total last season is likely to shoot at 70% or 140% next season. That just doesn’t seem right, and it’s certainly something that I’ll be trying to work towards understanding better in the future.
That being said, and just for fun, what did the Sodden Boot table for 2012/13 look like?
2012/13 Table [table id=65 /]
I have often seen Glen Johnson criticized for being wasteful in shooting for Liverpool; our ExpG numbers confirm that this was the case last season anyway. Johnson was the worst finisher in the EPL last season (again, based on at least 50 shots).
Jelavic Once again, Jelavic appears towards the top of this table with a pretty poor return of 7 goals from an ExpG total of 12.5 last season. At this point, there is no correlation between how well or poorly a player finishes his chances from one season compared to the next, however as a striker I wonder if Jelavic can continue to post such poor numbers as he has done for the last two seasons. Just because we haven't been able to find a correlation from season to season doesn't mean that it's not there Andy Carroll also reappears on the list from last season. Wrap Up
This short piece had a number of purposes.
It was to serve as a data dump to show which players under performed badly in terms of dispatching their chances this season (and last), but it was also to remind our readers that we haven't so far uncovered any meaningful correlation between the skill that a player showed in finishing their chances from one season to the next. Just remember that, the next time your club is linked to a striker that has just come off a great season. The only thing certain in such an instance is that the player's value will have increased as a result of his good season, but sadly, past performance is certainly no guarantee (or maybe even an indication) of future returns.
 ExpG Our ExpG model looks at the specific details of each shot, including the location, whether it was a shot or a header and how it came about and assigns an objective probability of that shot being scored.
Picking the optimal Colombian XI for the World Cup
This article is part of the Goalimpact World Cup series. The Colombian XI was picked by Bobby Gardiner. Bobby regularly writes about a variety of football topics on his own blog and other outlets. To read more from him, follow him on twitter at @BobbyGardiner or have a look at www.falseix.com. The eminently skippable subjective introduction to player ratings and Goalimpact is by Marek Kwiatkowski (@statlurker).
Player analysis is a big deal given the sums spent in transfer fees and player wages. Accurate measurement of players' actions is now possible in a number of areas thanks to the detailed data collected by companies like Prozone, Opta and Infostrada. But individual output is at best a proxy for performance, and the same has to be true of any player rating built on top of individual action counts. Often there will be players with excellent output who are clearly less valuable than some of their peers with lower output. You could call this effect the Podolski Paradox, only it is anything but a paradox: it is a logical, mundane consequence of the fact that at the low level, football is not bean counting but a complex, non-linear and, above all, densely interlinked dynamical system, where individual events take place in a rich context.
Consider for a moment the steps necessary to turn actions into a rating: a single-number performance score for individual players. First, you need to select the relevant actions, and these will be different for different player positions. Incidentally, "position" is not a very well defined concept at all, but we plough on. Now you need to weigh the actions: how many tackles is a key pass worth for a full-back? How about for a forward? Hmmmm. But let's go on; say we scored all actions separately. Now we need to normalise these scores for various factors such as time spend on the pitch (easy-peasy), quality of opposition (feasible) and opportunity to perform every kind of action (errrrrr). But say we've managed to do that, so now it's time to combine the scores into a single rating. Is it a straight sum, or at least a linear combination? No it isn't, and so on. The multi-dimensionality and complexity of the game bites you in the ass as soon as you begin and doesn't give up until you do.
In other words, what we need before we can build a robust player rating system based on individual actions is nothing less than a complete theory of football: a set of axioms that would allow us to put a precise value on every action in every context. We often -- always -- proceed as if such theory were not a prerequisite for bottom-up player evaluation, and as long as we do ad-hoc comparisons and the signal is strong we can get away with it, too; whatever that elusive ultimate theory is, it contains rules like "more goals is better" and "give-aways are bad". But a comprehensive player rating system developed on such a flimsy basis is guaranteed to be bad -- witness the WhoScored ratings, whose chuckle:insight ratio is somewhere in high single digits. Lastly, even if we ever arrived at an apparently robust action-based rating and tied it to real-world outcomes such as wages, chances are it would be gamed by players before you could say "Hang on, Mr Mendes".
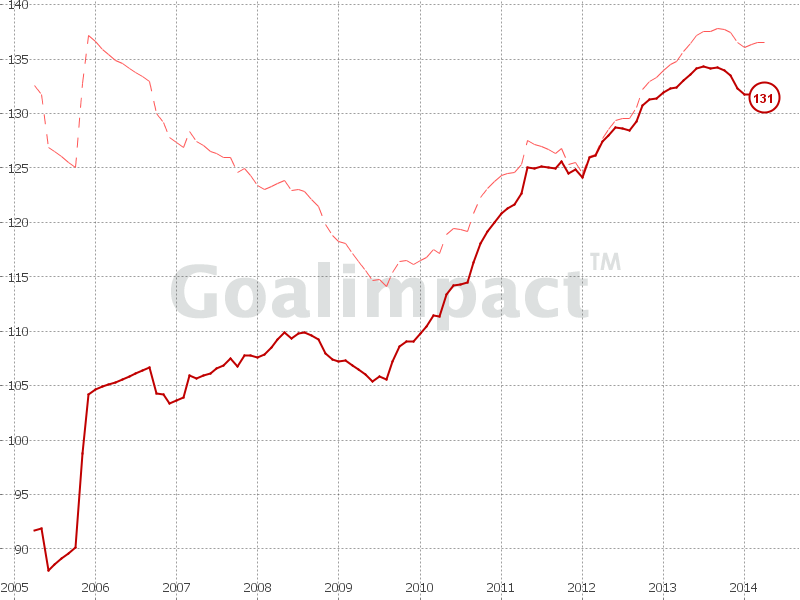
But once we free ourselves from thinking in terms of individual actions, a new perspective opens. Football is a team sport, as the cliché goes, so how about giving equal credit for every goal scored (and equal blame for every goal conceded) to all players on the team, regardless of who scored it, who assisted it, who intercepted the ball for the move and who made the decoy run? This simple, elegant and fair approach is the basis of top-down player ratings, chief among them the Goalimpact, developed by Jörg Seidel. Goalimpact has its weaknesses, but in my opinion is still miles ahead of any other systematic, public player rating scheme. To give you a flavour of Goalimpact, the most recent update (February 2014), has Ronaldo, Lahm, Fabregas, Schweinsteiger and Messi, in that order, as the five best players in the world. I wouldn't be a lapsing academic if I didn't use this list as a starting point for a quick overview of the strengths and weaknesses of the model.
Ronaldo makes perfect sense and provides basic validation of the model. Lahm is a fantastic pick, highlighting the core strength of top-down ratings: independence from individual output, the scoring of which is as a rule more difficult (or at least less settled) for defenders. By way of strengthening this point: Lahm is not in the top 50 players according to WhoScored, who instead have Wolfsburg's attacking left-back Ricardo Rodriguez as the 5th best player in the world (good player; no further comment). Messi in 5th seems low, but perhaps it's a sign that his otherworldly performances over the years should be also credited to his excellent Barcelona teammates? Schweinsteiger on the other hand looks too high, but maybe he is responsible for Bayern's runaway success -- or maybe his position is a signal of an unindentified (by me, as yet) bias in the GI formula. That leaves Fabregas, who can be a poster boy for Goalimpact's major weakness: a standout player who remains at a level lower than that to which he belongs will be overvalued. This refers to Fabregas' time at Arsenal, and we also found similar issue with the Goalimpact of the Colombians who made it to the big European leagues being often lower than that of the best players in the Colombian league.
Over to Bobby.
* * *
Thanks to Jörg Seidel of Goalimpact for the data. If you're wondering what Goalimpact is/entials, check it out here - http://www.goalimpact.com/p/blog-page.html (or, indeed, scroll up --ed).
After a sixteen year wait, Colombia are returning to the World Cup Finals. Inspired by a ‘golden generation’, Los Cafeteros have risen to fifth in Fifa's World Rankings and given their notoriously passionate fan-base cause for genuine hope. Their first obstacle is escaping unscathed from what is possibly the most even of Rio’s groups – Greece, Côte D’Ivoire and Japan join them in C.
The XI crafted from GoalImpact scores alone:
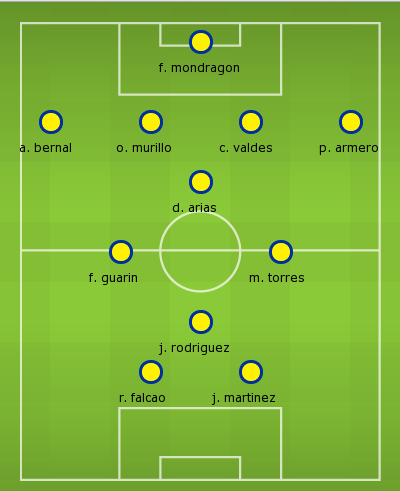
This particular set up is quite far off a likely XI, probably due to a combination of old defenders (Perea, Yepes and Mosquera are all in their 30s and in Pekerman’s squad) and a lot of players in the Colombian League. That isn’t to criticise GoalImpact as a measurement, though, as we all know that players aren’t always picked or not picked based on ability and/or output alone (ask Samir Nasri or Carlos Tevez). Context is needed, and so I’ll somewhat systematically rifle through each area of the team:
Defence
In between the posts, David Ospina of Nice is likely to start. His GI of 92.6 is quite noticeably lower than the 123.67 of Faryd Mondragon, but he is 17 years younger and fast establishing himself as Colombia’s first choice keeper. They’ll be joined in the squad by the uncapped Camilo Vargas (102.78).
Oscar Murillo (110.46) and Alejandro Bernal (110.78), both of Atletico Nacional in Colombia, failed to make Pekerman’s initial 30 man squad and so are out of contention.
Pablo Armero (116.39), recently on loan at West Ham, is likely to start at LB while PSV’s Santiago Arias (94.5) should take up the other full back spot. The young right back may have been capped just 4 times by his country but he is only 22 and has been linked with the likes of Manchester United recently.
I’m not sure what the oldest centre back pairing at a WC is, but if Luis Perea (93.92) and Mario Yepes (40.97) start together as they did in Colombia’s most recent friendly against Tunisia, their combined 72 years may just break that record. Although their GIs (especially Yepes’) are very low, their peak GoalImpact scores are 123.67 and 138.33 respectively and so an experience vs current output trade-off may be Pekerman’s thinking here. I would personally start AC Milan’s Cristian Zapata (102.17) over Yepes. At 27, he’s not far off his peak but still possesses the necessary experience for the occasion.
Midfield
The general rule of thumb with the Columbian team is the more you push into the attack, the higher the quality of the players. Sadly, Diego Arias (110.86) will not play a part in Rio - like his aforementioned Atletico Nacional teammates, he failed to make the provisional squad.
If you didn’t know who Fredy Guarin (115.04) is, you probably did come January after a frankly confusing transfer fiasco with his club Internazionale and a whole host of English and Italian clubs. In the end the talented all-rounder stayed and he is extremely likely to start in Rio. One of Abel Aguilar of Toulouse (94.08), Elche’s Carlos Sanchez (92.35) or Monarcas’ Aldo Ramirez (93.6) will probably start next to him at centre-mid. I’d go with Aguilar myself. In terms of GI, there’s almost no difference between the three, but the first two are a tad more defensively minded than Ramirez while Aguilar edges it over Sanchez because of his ability to (albeit occasionally) score.
James (pronounced Ha-Mez) Rodriguez (122.87) is one of my favourite players in the world. At 22, he is quickly becoming the perfect combination of dangerous pace and brilliant creativity; managing an extremely healthy NPGA90 of 0.65 this season at Monaco. A lot of attention directed towards the Columbian team will focus on his Monaco teammate, but keep an eye on the man likely to start as a winger but equally adept in a 10 role. On the opposite flank, Juan Cuadrado (106.87) is my choice. An extremely important part of Fiorentina’s attack this season, the skilful winger has improved tremendously in terms of efficiency with a NPGA90 of 0.52. If Pekerman wants a more central attacking midfielder, Macnelly Torres (116.13) is almost a certainty for the squad. Although now plying his trade at Al-Shabab in Qatar, the quirkily named creator is renowned and feared in South America for his trickery.
Attack
To be honest, the shape of Columbia’s attack is entirely dependent upon the fitness of one man – Radamel Falcao, whose GoalImpact score is the highest of any of the squad at 131.46. Any ‘golden generation’ comments or ‘dark horse’ bets are almost entirely focused on him. Seen by many as one of the best strikers in the world, his race to fitness has encouraged Pekerman enough to include him in the provisional squad and we all hope that he makes it.
The thing is…it might not be THAT big of a deal if he doesn’t. Before I’m thrown into some kind of metaphorical football taboo dungeon, let’s have a look at Columbia’s other striker options. Jackson Martinez of Porto (119.5), soon-to-be Dortmund’s Adrian Ramos (109.4), Sevilla’s Carlos Bacca (112.46), Luis Muriel of Udinese (105.08) and Cagliari’s Victor Ibarbo (99.52) have all made the provisional squad. That’s an incredible amount of good quality strikers, and Ramos and Bacca especially are coming off the back of very strong seasons with their club sides. As for which of those start if Falcao is out, I’d go with Martinez and/or Ramos depending on the formation. Both are adept target men, but deceptively good with their feet and I think they’d provide the best outlet to James.
My XI, combining context and GI scores:
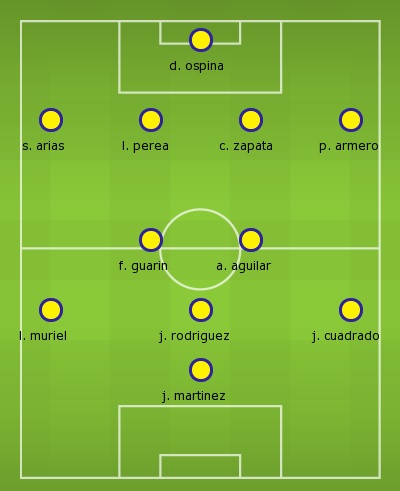
Formation wise, it’s quite difficult to predict what Pekerman will do. A 4222 type set up helped him through the qualifiers but he was equally reliant on a more defensive 4231 away from home. Against the offensive prowess of Cote D’Ivoire and Japan, the latter might be the better option.
Muriel has been regularly used by club and country as a winger and putting him there allows James to unleash his creativity more centrally. Obviously, if Falcao is fit, he starts either over Martinez or alongside him (or any other one of their billion strikers) in a 4222. The average GoalImpact score of this particular team is 107.60 which is pretty low, but a lot of these players are either young and having their first few good seasons (Muriel, James, Cuadrado) or old and likely to bow out after the World Cup.
‘16’ is an important number for Los Cafeteros in another sense - the furthest they've been in a World Cup was the round of 16 in 1990. Maybe, with or without Falcao, Pekerman's men will be able to better that this summer.
Are some Goalkeepers better at saving shots than others?

This post has been written by Dan Kennett.
In the last year, this site has led the way on Goalkeeping analytics. In that time the focus has become more on “Expected Saves” rather than the humble old Save% (Sv%) i.e. [Total Number of Saves] / [Total Shots On Target Faced]
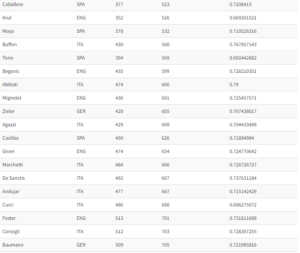
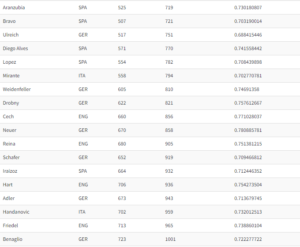
Following a chance discovery on the NBC Sports website, it’s been possible to quickly collect Sv% data going back to 2007/08 for England & Germany and 2008/09 for Italy & Spain, resulting in almost 48,000 Shots On Target with an average of 360 saves for 95 Goalkeepers (Individual Goalkeeper sample size is currently the main constraint with Goalkeeping models).
With this data it’s now possible to re-revisit the humble old Sv% and ask if some Goalkeepers are betting at saving shots than others over the course of their career. All Goalkeepers with > 100 saves were put into a funnel plot and the results are below:
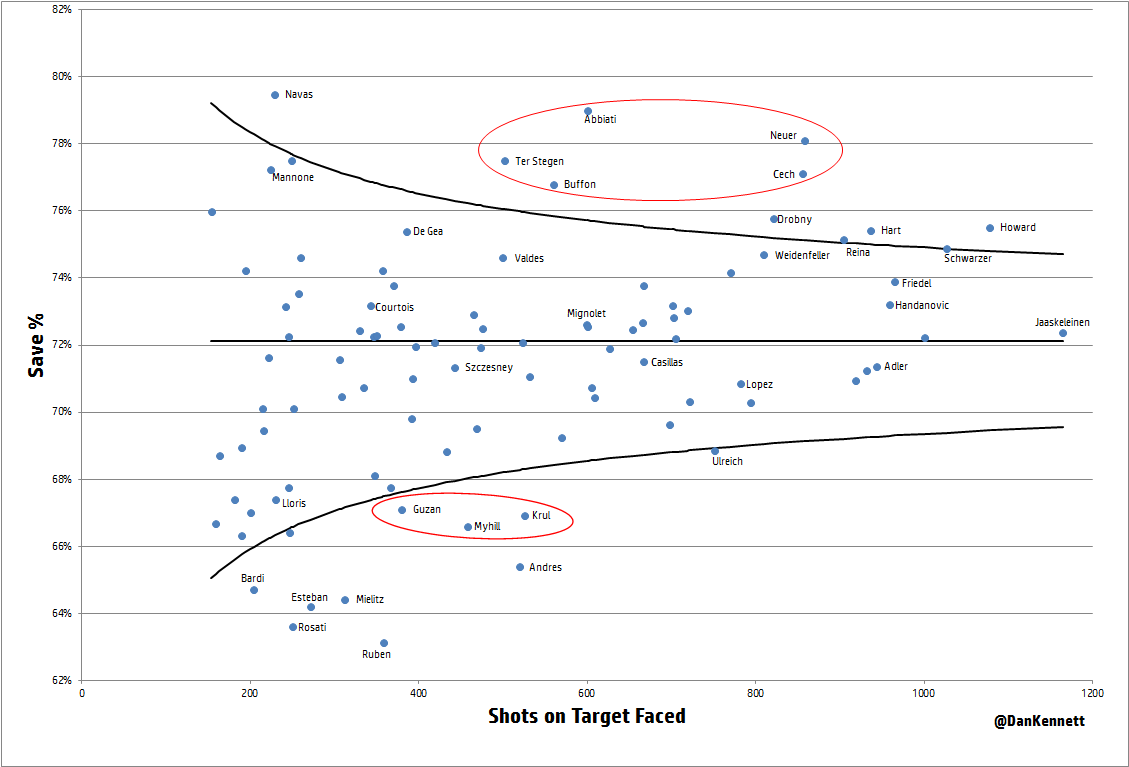
The purpose of the funnel plot is to show how randomness decreases as the sample size increases. In this case, as a Goalkeeper faces more Shots On Target. This is represented by the curved lines getting closer to the horizontal line.
- The horizontal black line is the overall Sv% for the 48,000 shots (72.13%)
- The curved black lines represent 2 standard errors above and below the mean
At the top centre of the chart there are 5 dots above the curved line that tally with the received wisdom of “good goalkeepers”: Gigi Buffon, Marc-Andre Ter Stegen, Petr Cech, Christian Abbiati and Manuel Neuer. Maybe Neuer genuinely does deserve his unofficial title of “world’s best Goalkeeper”?
Some love should also be shown for Tim Howard who has been consistently excellent for Everton over 7 seasons.
At the bottom centre of the chart there’s a cluster of 3 keepers from the Premier League who should set alarm bells ringing for fans: Brad Guzan, Boaz Myhill and Tim Krul. This statto will also be keeping close tabs on Ruben Ivan Martinez of Rayo Vallecano from now on!
Geek Notes
Sv% is normally distributed (p = 0.256)
There is a weak relationship between Sv% and SoT Faced (r = 0.345) but the p-value is very low (0.001)
We can rule out “league effects” as once goalkeepers from different leagues are grouped together and compared, there is no significant difference amongst the means (p=0.471)
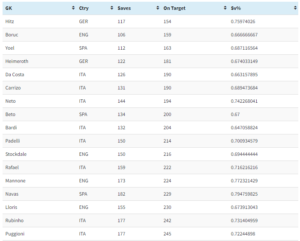
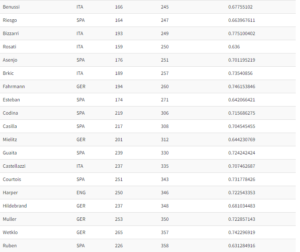
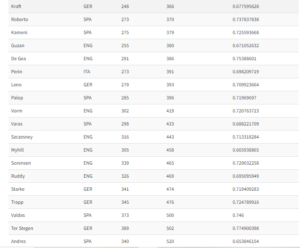
Data
The following is a copy of the collated data:
Liverpool: An Analytical look at 2013/14 - A Missed Opportunity?
With Man City's win over Aston Villa on Wednesday night it now appears that Liverpool will narrowly fail in their quest to win the 2013/14 Premier League. Regardless of the destination of the Premier League title, the general consensus is that the Reds have improved considerably from last season. A cursory look at the league tables appears to confirm this to be the case.
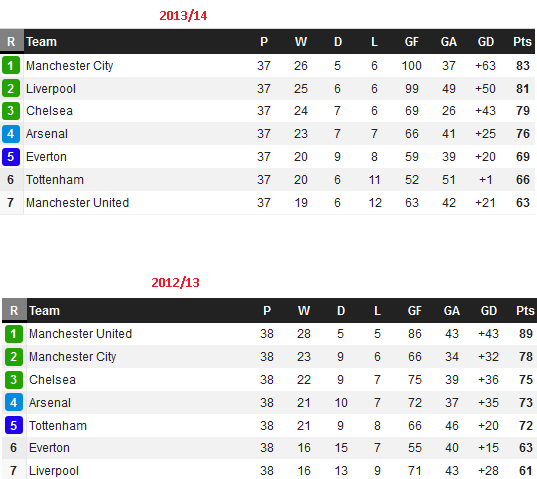
With one game left to play, Liverpool have already gained 20 league points more than last season. Unsurprisingly, their goal difference is also showing a marked improvement as they have scored 28 goals more whilst conceding just 6 goals more than last term – this equates to an improvement in goal difference of 22 goals compared to 12 months ago.
However, for me, the improvement in the general performances of the team isn't quite as marked as the league table suggests being the case. Before Liverpool fans shut down this page please note that this isn't entirely a bad thing.
Last Season
We live in the “here and now” and a lot can happen in 12 months, much of which we seem to have the capacity to forget. The Liverpool team of 2012/13 that were dreadful in front of goal now seem to be from another era. Last Summer Constantinos Chappas wrote specifically about Liverpool’s wastefulness in converting chances during the 2012/13 season in this article The second plot in that article shows that Liverpool were just the 14th best Premier League team in terms of how they finished their chances (once the chances were controlled for quality).
Fast forward 12 months and things are entirely different, with the triumvirate of Suarez, Sturridge and Sterling seemingly knocking in goals for fun.
Expected Goals 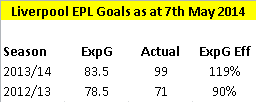
Based on our ExpG model (in short it assigns goal scoring probabilities based on the specifics of the shot) we expected Liverpool to score 5 goals more than last season. However, we have seen that they have scored a whopping 28 goals more than last term. This substantial increase in goals scored is due to the double effect of Liverpool’s finishing last season being very poor and this one being exceptionally good.
Liverpool fans may say that the brand of football their team is playing this season is much better and expansive than last season, that there has to be a greater difference than just 5 goals between what my model has expected them to score last season and this; that my model is wrong.
To coin a phrase use regularly used by Simon Gleave, this may be a case of Scoreboard Journalism. We (be that football fans or members of the media) tend to evaluate events by reference to the once off outcome rather than evaluating the process or by adequate reference to what “should have happened" . The difficulty with deciding what "should have happened" is that there is no one agreed uniform metric for how to measure this, but all I can say on this is that our ExpG measure is an objective measure that has used the same claculation method over the two seasons in question.
Liverpool's Fast Breaks
Perhaps my ExpG measure doesn’t accurately take account of the scintillating counter attacks that seem to have been the signature of Liverpool’s charge for the title. Thanks to some research undertaken by Andrew Beasley we can see that Liverpool have had 27 shots from counter attacks this season. So how does that compare with last season?
It may surprise you to discover that they also had 27 last term!!!
In Beasley’s article he makes the point that there is some subjective assessment by Opta in what qualifies as a Fast Break and there may well be attacks that many observers would think qualifies as a Fast Break but which Opta haven’t denoted as such. However, on the assumption that Opta have been consistently applying the same criteria in denoting a Fast Break over the last few seasons then this point is moot for the purposes of this analysis as the same narrow definition would have been applicable last term too.
It appears that Liverpool haven’t actually had more Fast Breaks than they had last season, but their conversion rate of 33% (9 goals scored compared to just 1 last season) on such attacks has perhaps fooled us into thinking that this form of attack has been used more often this season than before. Perhaps that notion can be put down to Scoreboard Journalism as well, although I do agree that there is the possibility that Liverpool attack in a manner that could provide them with good scoring opportunities which Opta do not classify as a Fast Break. More on this later.
Liverpool’s Shot Choices
Liverpool’s average shot quality has improved this season, with their average ExpG per shot (exc penalties) of 0.118 dwarfing the 0.101 they achieved last season. However, this improvement in shot quality has partly been offset by the fact that they are shooting considerably less than last season. With 1 game remaining, the Reds have taken 101 less shots than during 2012/13. I’m not arguing that this drop off in shot volume is necessarily a bad thing (as the conversion rates are so low on long distance shots) but it helps explain why we have Liverpool in for just 5 more goals than last year despite an increase of almost 20% in their average shot goal chance.
The difference in the shot choices taken by Liverpool this season can be clearly seen in the Shot Charts, with the 13/14 chart being shown on the left, and last season's Shot Chart appearing on the right.
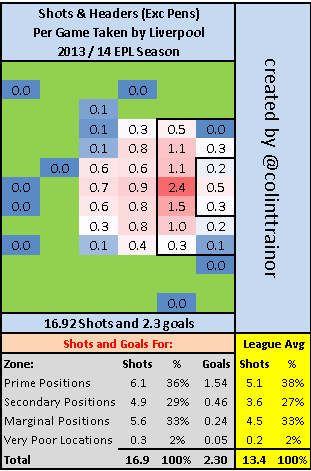
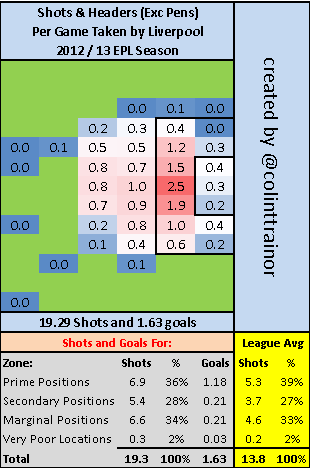
We can see the noticeable reduction in shooting volume by almost 2.5 shots per game (19.3 down to 16.9), but the shots from within the Prime Zone (central area inside the penalty area) has reduced by just 0.8 per game. The remaining decrease of 1.5 shots per game in shot volume has occurred in the Secondary and Marginal zones, where the expected conversion rates will be lower.
A template outlining the perimeters of the four zones has been included at the bottom of this article.
Although Liverpool are now shooting from smarter locations on average we can see why this only has the impact of increasing their Expected goal total by 5 year on year (albeit I am comparing the 37 games played so far this season with the previous full 38 game season).
So how the hell have they managed to score 99 league goals so far this campaign?
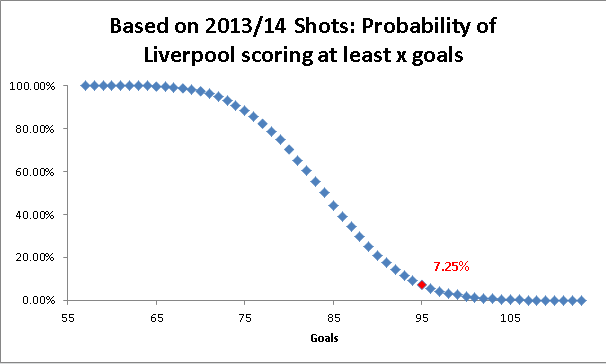
A 1 in 14 Season
Very simply, Liverpool have had an amazing season in converting their chances; they have ran incredibly hot. I processed 10,000 simulations of the shots that Liverpool took this season and they achieved their current total of at least 95 goals (as this excludes Own Goals) just 7% of the time.
So, based on their shots taken, just 1 time in 14 could they be expected to score at least as many goals as they have achieved.
 Comparing to previous Premier League Performances
Using Opta data I have gone back 5 seasons in the EPL (until the start of the 2009/10 campaign) – this gives me a sample size of 100 (5 x 20) individual team seasons.
Shot Conversion %
Liverpool’s current conversion rate of 16% (99 goals from 638 shots) is the highest conversion rate for any team over the last 5 seasons. That is quite the accolade. Interestingly they are closely followed by this current Man City team.
(The table below includes OGs)
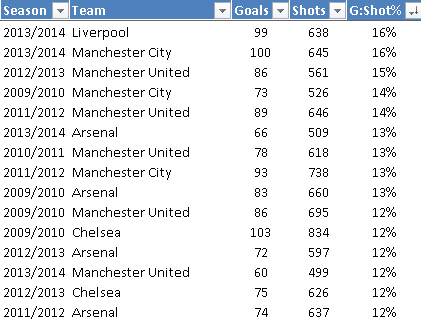
The two teams that immediately trail Liverpool in this metric are the mystical 2012/13 Man United side who somehow won the Premier league last year and the current version of Man City.
We have shown that Liverpool’s chance quality has improved this season, but their average ExpG (exc penalties) of 0.118 is lower than the two Manchester teams that immediately follow Liverpool in this table. Man United’s average shot quality was 0.13 last season, and the 2013/14 Man City team has an even higher average shot quality of 0.132. All three of these teams mentioned have over performed their Expected goals total, but none by as much as Liverpool have done this season.
On my numbers, Liverpool couldn’t have expected to convert at a rate of 16% of the shots they took this season - even allowing for their improved shot quality. However, this is exactly the feat they achieved and I can help to understand how that happened.
Liverpool’s Blocked Shots
As we draw towards the end of the season and I reviewed Liverpool’s shot numbers, the lack of Liverpool’s blocked shots was extremely noticeable. Using the same 100 team sample as outlined above, I looked at the rate which those teams had their efforts at goal blocked.
Once again, the Anfield side sit proudly atop this particular table, and comfortably so.
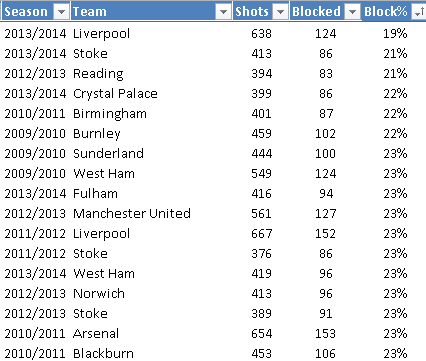
The other 99 teams had their shots blocked between 21% and 31% of the time, but we can see there is clear space between the remainder and Liverpool’s incredibly low blocked shots ratio this season of just 19%. It may be suggested that with Liverpool’s very fast transitions it is reasonable to expect a lower rate of blocked shots than the average team due to the opposition defences being unable to set themselves properly. However, I have shown that, according to Opta, Liverpool had the same number of Fast Breaks as they had last season and at 27, they have just 6 more than Man City have had this season.
It is possible that Liverpool’s attacking strategy is such that they do have faster transitions than other teams, yet they don’t trigger Opta’s definition of “Fast Break”. However, in the absence of more detailed data I have no alternative but to work with this (possibly) narrow definition. I would like to revisit this area again if detailed event data becomes available, but until then I can only make reference to the Opta designated Fast Breaks and this metric doesn't seem to explain away such a low rate of blocked shots.
Having Few Blocked Shots is good?
Of course this is the case, but if I were a Liverpool fan I would want to know how likely it is that their team will enjoy such a low rate of blocked shots again next season. Is this aspect of Liverpool’s attacking strategy something that they can hope to replicate next season?
Looking at the EPL for the last 5 seasons I plotted the correlation between Blocked Shots % in Year n and Year n+1, ie how repeatable are offensive blocked shot percentages.
As I needed two consecutive seasons in the Premier League, I was left with 68 pairs of Blocked % to plot as follows:
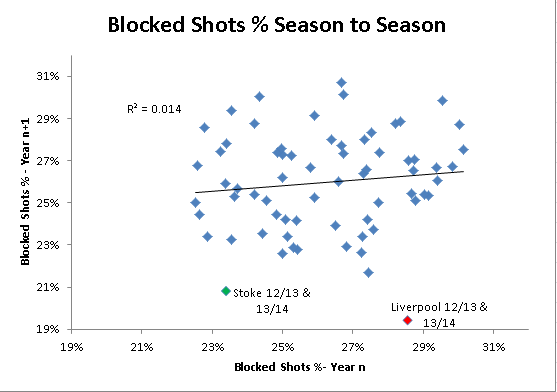
Although the sample size is small, unfortunately for Liverpool there appears to be virtually no correlation between a team’s percentage of shots that are blocked from one season to the next. A perfect example of this is Liverpool themselves.
The Reds’ record low Blocked % of 19% this season follows last year’s 29%. Out of the 100 teams, their 2012/13 rate of blocked shots was 84th, but just 1 season later Liverpool followed that up with the best ratio posted in terms of blocked shots %!!
I have previously shown that the further out a shot is taken the greater the chance that it will be blocked. We have seen that Liverpool have been shooting smarter this season, however, the differences in the rate of being blocked are nowhere near large enough to explain a difference of even 1%, never mind 10% over their entire shot sample for the two seasons in question. The above plot also visually shows us just how much of an outlier Liverpool’s rate of blocked shots this season has been.
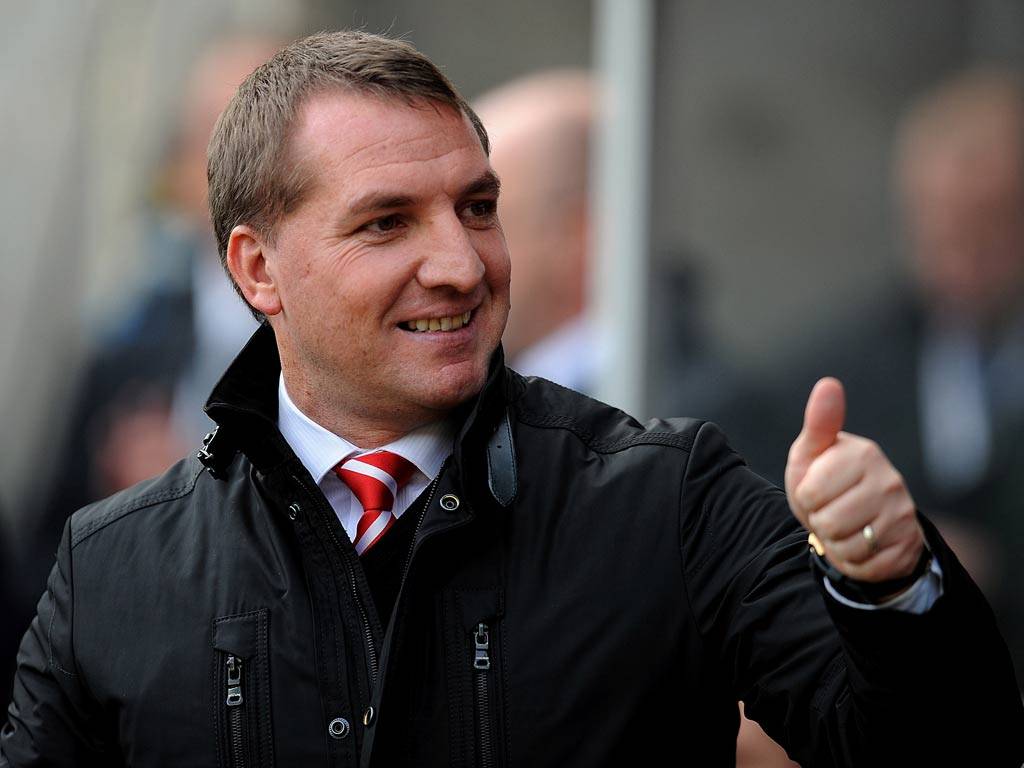
Based on the data available to us, which currently excludes very detailed event data, I don’t see any reason for Liverpool to expect to enjoy such a low rate of blocked shots again next season. There is always the possibility that I’ll be proven wrong as every outcome has a chance, no matter how small - just like Liverpool had an extremley slim 1 in 300 chance of winning their 11 games in a row. Perhaps Brendan Rodgers may do something that EPL managers have generally failed to do over the last 5 seasons, ie come up with a tactical wrinkle that leads to a consistently low rate of blocked shots. But until that point, I’m firmly in the “Liverpool will regress in respect of their percentage of blocked shots next season” camp. Needless to say, if that does happen then Liverpool's scoring percentage will correspondingly drop. Liverpool’s Defense
One aspect that Liverpool could improve on next season is in defence. Jamie Carragher, amongst others, has been critical of Liverpool’s defense.[youtube id="ptF89E-MEAs" width="640" height="360"]
I’m not going to comment on whether Liverpool have been below par in preventing opposition chances, but my numbers tell me that Liverpool have defended the chances they have conceded poorly with the concession of 6 more goals than I would have expected based on the opposition shots.
When I take into account the shot placement, it is clear that Simon Mignolet has had a poor season (as far as shot stopping is concerned). There are 17 Premier League goalkeepers that have faced at least 100 on target shots this season, and Mignolet has been the worst performing keeper of them.
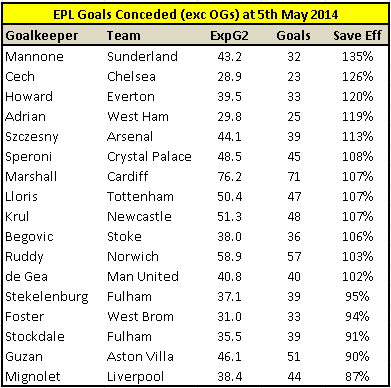
Based on the Shots on Target faced by the Belgian, I estimated that he should have conceded 38 goals, instead of the 44 (this excludes Liverpool’s 5 Own Goals allowed) that he did concede. These numbers result in a save ratio of 87% which places him at the bottom of my Goalkeeper Saves ranking table for 2013/14 (of those that have faced at least 100 shots).
Although this information will make sorry reading for the Liverpool defence, the analytical work undertaken in the area of goalkeeper saves, such as this by Sander Ijstma suggests that there is next to no correlation in terms of how saves above or below expectation correlate from season to season. One possible reason for this is that the difference in shot stopping skills between professional top-flight goalkeepers is so small that the inevitable variance inherent in facing less than 200 shots per season drowns out any signal that there may be in the data.
As with Liverpool and their blocked shots, Simon Mignolet is a perfect example of this variance. Last season he was the 4th best Goalkeeper in the EPL as he conceded just 50 goals compared to the expected 62, yet 12 months later he appears right at the foot of the table. Proof, if it ever was needed about how volatility and variance plays such an important part in football, even over a full 38 game season.
The Future
In the event that Liverpool do not win the league this season I think that they will really rue this lost opportunity. Leaving analytics aside, the media have latched on to the fact that this season was a terrific opportunity for them to lift the title and there are several reasons why it might be more difficult for Liverpool to launch a similar title charge next term. Without me repeating these often trotted out reasons, example of same can be found here and here.
The reasons stated in those article may or may not come to pass, however I am confident that Liverpool have had a season in front of goal that they are unlikely to replicate in the near future. And, in the likely event that they don’t win the league this season, their inability to take full advantage of the way the cards have fallen in terms of their incredible shooting numbers will surely be frustrating for the fans and those involved with the club.
Liverpool fans point to the fact that they would have settled for Top 4 at the start of the season. On my ratings, Liverpool deserved to win a Champions League place last season. It was just their rank bad shot conversion that prevented this happening, but the underlying numbers don't back up the thought that there has been huge improvement in performance that the two league tables would suggest at first glance. As almost always is the case, when looking at two extremes I would suggest that the true picture is somewhere in the middle.
Liverpool are certainly amongst the best four teams in the country, and have been for at least the last two seasons. But although they could count themselves unfortunate to have come up against a Man City team that themselves have overperformed in terms of ExpG this season (although not as much as Liverpool have done) I can't help but feel that this was a terrific chance for the Reds to win their first Premier League.
Finally, unless their chance quality improves even more next season I'll be surprised if Liverpool are able to post the same sort of goal totals that we have seen this season, in which case 2013/14 really was a missed opportunity.
Unless of course that Man City do the untinkable on Sunday at home to West Ham.
Zones Template for Shot Charts 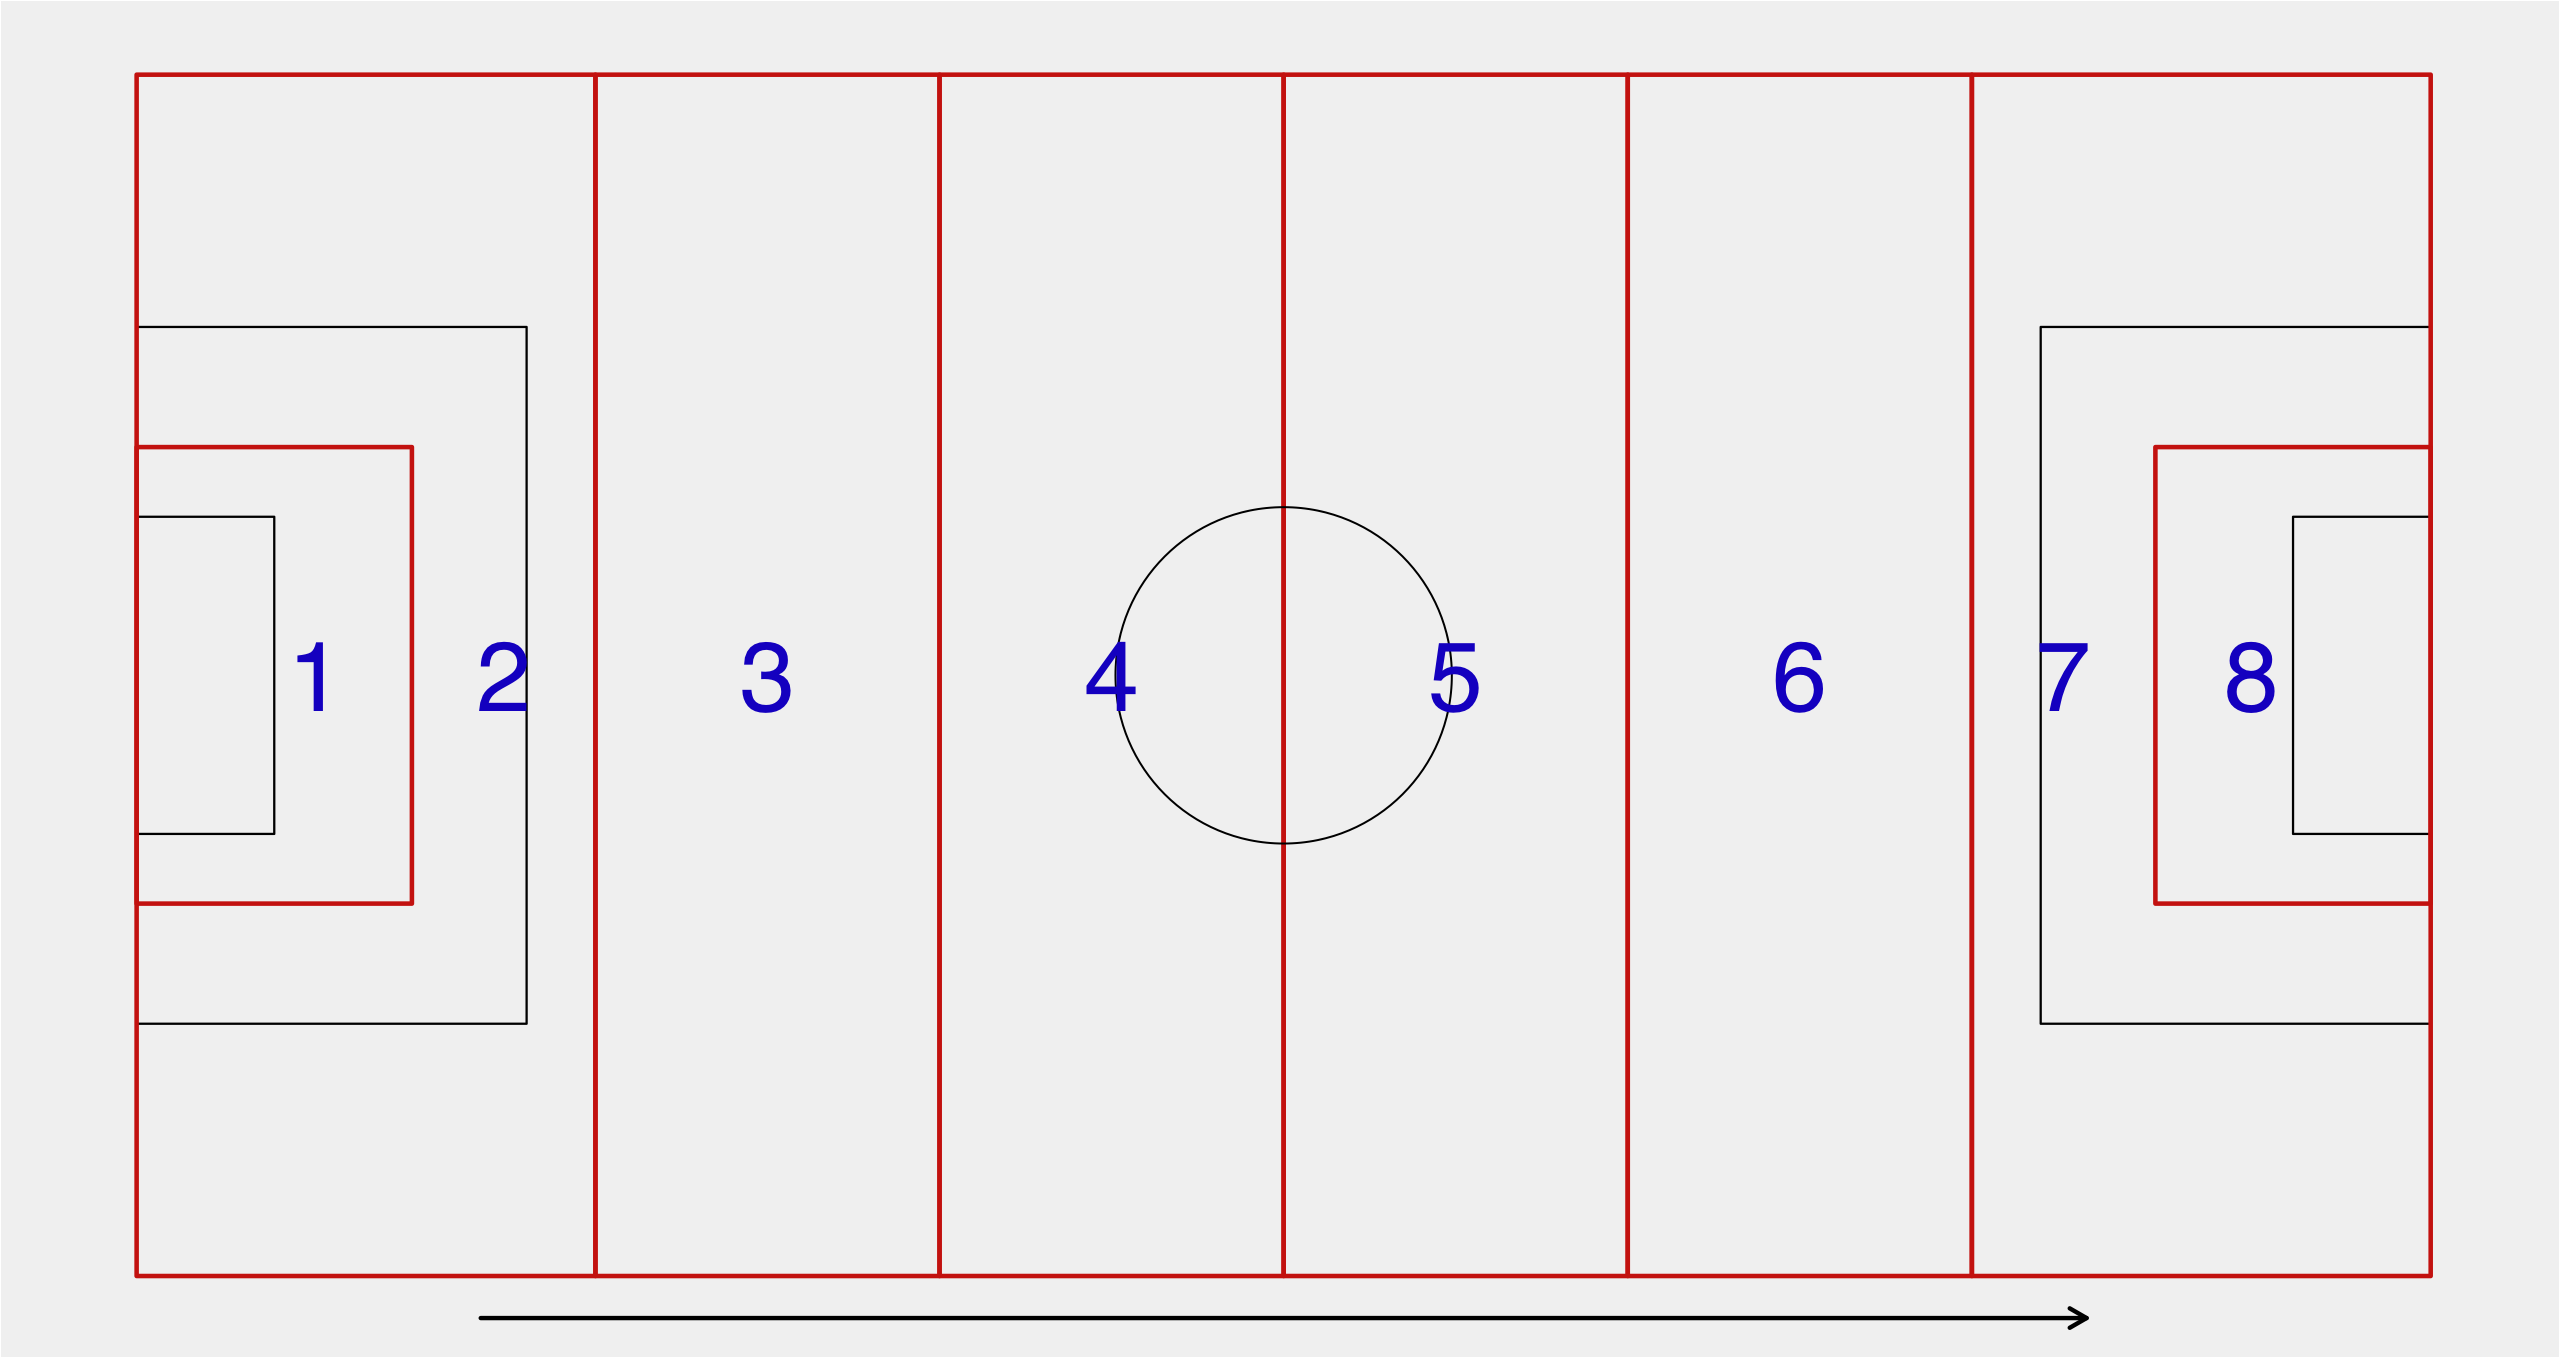
StatsBomb’s Recommended Germany World Cup Squad
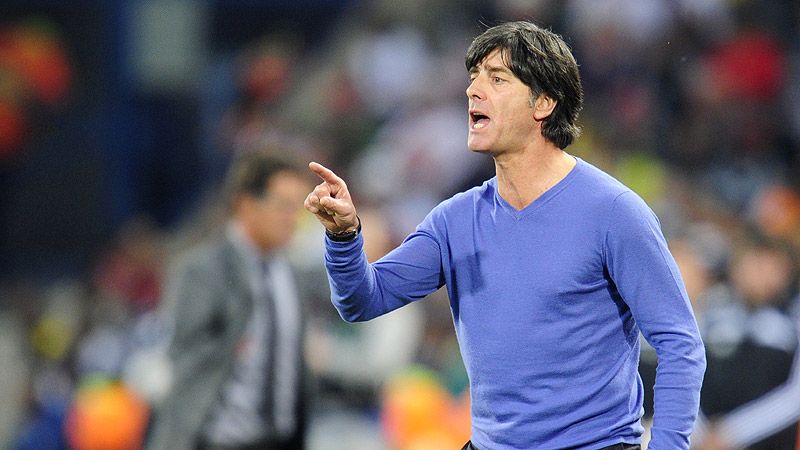
Much like winter, the World Cup is coming. In winter, even. Okay, except that it will be held in Brazil, in June, and average temperatures at the World Cup venues will be somewhere between 70 and 90F, which don’t exactly sound very winter-like unless you grew up in Florida or Southern California or something, and your definition of winter is walking outside and not immediately breaking a sweat. Aside from all that, the World Cup is finally (almost) here! Obviously we here at Der StatsBomb will be covering as much World Cup stuff as we can make time for, and it starts with discussing who should be picked for the various big national teams. I’m going to lead off with Germany, partly because I tend to follow the German players fairly closely, and partly because Jogi Loew is expected to announce his initial squad tomorrow and I wanted to beat the deadline. In addition to my own opinions, which are based on a combination of statistical analysis and watching a ton of football, my choices will be guided by players' Goal Impact ratings as well. For those who are unfamiliar with what Goal Impact actually is, you can find detailed information here. Needless to say, this is a tremendous additional tool to have access to, especially when trying to evaluate such a massive pool of potentially good players. Germany are the powerhouses in Group G in this World Cup, the group that is widely considered to be this year’s Group of Pain. Or Group of Maiming. Or maybe it was the Group of Mostly Dead? It's definitely something like that. Anyway, they are the best team in the group, but they will have to compete against Portugal and Ronaldo, Ghana, and the always scrappy United States squad (TM). Regardless of how you slice it, it’s a tough group of teams. Thankfully for followers of Der Mannschaft, the pool of players Germany has to choose from is really bloody good. Not good enough, however, that there isn't a big gaping hole right at the top of the formation that will need to be filled by someone. Follow along, and we’ll discuss each of those points in detail. Team Strengths Before I get into a positional breakdown, let me give you the broad strokes. Germany have one of the five best goalkeepers in the world in Manuel Neuer. That’s a good start. Additionally, Germany has one of the best pools of combined central and attacking midfielders on the planet, to the point that a player with a transfer value approaching £40M is almost guaranteed to be riding the bench at the start of every one of their matches. They are deep and extremely talented in the center of the pitch. Team Weaknesses Center forward is a massive issue, and left back is a minor one. One of these is a gaping hole that will need to be filled either by a player who doesn’t normally play in that position. The other is not a real problem – there’s talent there – but more a big question mark of who is best to fill that spot right now. I’ll propose a couple of answers for each, along with my Starting XI and finalized squad list at the bottom. Center Forward We’ll start with Germany’s biggest weakness. It is strange that the team with perhaps the greatest depth in talent at attacking midfield have almost no viable center forward candidates right now, but that’s the position Germany find themselves in. Mario Gomez, he of the Gomez Button and amazing goalscoring rate with Bayern Munich, has been out injured all year. He’s unfit and I’m crossing his name off the list. Former World Cup golden boot winner Miroslav Klose turns 52* three days before the World Cup starts. I’m not ageist, but it’s possible he will have a tough time making it through the condensed tournament schedule. (*Okay fine, he turns 36. Still!) I’m only taking Klose if I am truly desperate. After those two guys you have a host of question marks. Max Kruse has seen playing time there in the last year, and he’s good, but he’s not really a true CF. Nor is Thomas Muller, who is amazing, but best when he’s not the focus of all defensive attention. Pierre-Michel Lasogga is a beast, but lacks the necessary refinement to lead the German line at the World Cup. Perhaps the most natural, talented fit is a guy who has somehow never really been in contention for the national team setup – one Stefan Kiessling. Now age 30, Kiessling’s stats have been exceptional for the last half decade, and his Goal Impact remains in the top 6 of all potential names for the German forward slot. That said, Loew has never shown an interest in choosing him, and I’m going to assume that despite the need and Kiessling’s natural goals-coring talents, he will again be overlooked. This leaves the German manager in a tough spot. Goal Impact says that throwing Muller up front will lead to best statistical starting lineup. I’m okay with this, but I have a slightly different preference. I feel like Germany should put Andre Schurrle up front as the primary option. He’s big, strong, can run at opponents, and provides an excellent option on the counter. It also frees Muller to do what he does best, and find space off the ball, while combining with the rest of Germany’s amazing midfield, either as the starting right wing, or off the bench. Schurrle has some limited experience in this role with Chelsea and it’s been mixed at best, but I feel like he’d have better support in the national team, and is the best healthy, non-Kiessling option on the board. What? I left Podolski out? As someone who has watched him play at Arsenal for the last two seasons all I can say is yes, of course I did. He’s not a center forward. You might bring him off the bench late in the game, but he’s not your 60-minute man in the middle. Attacking Midfield Dear lord, to be blessed with such riches… Assuming you have Schurrle up front, and are playing a basic 4-2-3-1 shell, which of the following do you leave out of the starting lineup? Ozil. Gotze. Reus. Muller. Kroos. That assumes that you aren’t playing Kroos deeper, because there are great options there as well. The first three names on that list are probably 3 of the Top 10 creative midfielders in Europe right now. The 4th is the most continually underrated player on a team that won the Champions League last season and locked up the Bundesliga title in a record number of games this season. And the other guy is Toni Kroos. If you based your selection strictly on Goal Impact, Reus would be the odd man out, and your starters would be Ozil, Gotze, and Muller. That’s not crazy, but for an attacking setup my preference would be Reus on the left, Gotze central (remember, they played like that at Dortmund), and Ozil starting on the right and doing his floaty thing. You’d have the best right back in the world behind him, so I feel you can get away with this without suffering. Against Ronaldo, however, I’d start Muller right and expect him to do more two-way duty. Midfielders As mentioned above, Germany’s surfeit of attacking midfielders is a blessing almost every other national team in the world would like to have. The quality of the players in their midfield pool nearly matches it. The first name in the midfield is this guy: Bastien Schweinsteiger. Schweini has been the rock in the middle of the Bayern Munich and German midfields for a decade now, and is one of the winningest players ever in Germany. Of the players on the GI list, only teammate Philip Lahm eclipses his Goal Impact number, and the fact of the matter is, Schweini is a living legend. Only 29, he probably has another Euros and World Cup after this before he looks to hang up the boots. For those who are curious, this is his ridiculous GI plot:  The average Bundesliga player has a GI of 110. The second name on the sheet, however, is tricky. In part, it depends on opponent matchups, but I feel more probably depends on the health of Sami Khedira. If Khedira is back to fitness, then he is the box-to-box machine that best fits the German system. He’s a dervish on both the attacking and defensive ends, and plays an important role in disrupting opponent attacks, while being best able to flood zones for overloads in the attack. If Khedira is not fully healthy, then I have the following names on my list to pick from: Kroos, Lars Bender, Sven Bender, Roman Neustadter, Stefan Reinartz, and Daniel Baier. Kroos is the guy I would have against any team where I wanted to emphasize attack more than defense. He’s capable of being a deep-lying playmaker or a more pure attacking midfielder, and he has a hammer of a shot from deeper positions. If Khedira isn’t ready to go full speed, Kroos gets his spot in the bulk of matches. After that, it gets very tricky. Both Bender brothers have been on the outskirts of the national team for some time, as has Neustadter. All play for teams that regularly appear in the Champions League, and all have defensive/holding qualities that pair well with what Loew has shown he wants to do in the past. Reinartz has 3 NT appearances, but is a bit further afield and probably not a real consideration, though his GI number says he should be. I honestly don’t see a ton between any of these choices. The Bender brothers probably have more flexibility in their skill set, while Neustadter is basically the perfect, clean DM. Not a lot of flash in his play, but a ton of quality and good choices made along the way. The last name on MY list is Daniel Baier. He plays for Augsburg, and hasn’t been involved in any level of German National Team since 2005, but in my opinion, has been the best defensive midfielder outside of a CL team this season. The guys like Rene Maric over at Spielverlagerung are also big fans, so I feel like I’m in good company with my man crush. He was absolutely everywhere for Augsburg this year, and at age 29, this represents probably his one and only opportunity to appear for Germany in an international competition. I feel he deserves it on merit, but given how far away from the NT setup he’s been, he’s a very long shot to make the team. This is what Baier's radar looks like for the past season. It is one of the most unusual CM/DM radars I've ever seen. It's rare you see quite that broad a set of skills offensively and defensively, and the Ints really stand out. He's been absolutely tremendous.
 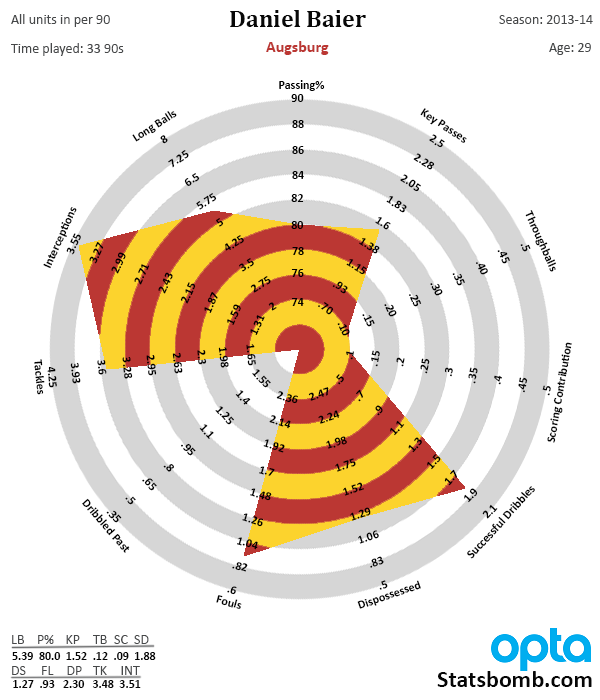 Right Back THE MAGIC DWARF!!!
 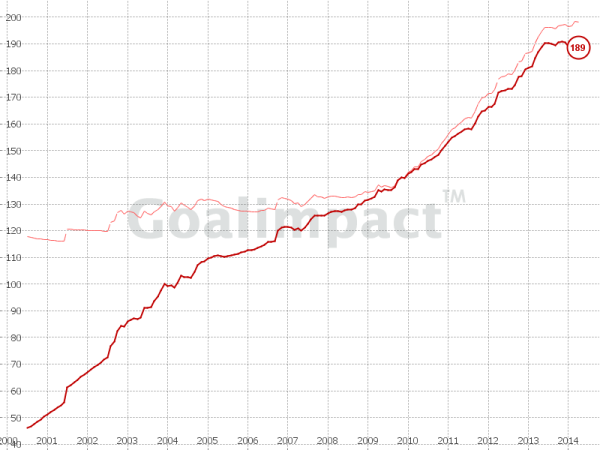 Wait, I have to pick someone in addition to Philip Lahm? Fine… Kevin Grosskreutz, you’re on the plane! Not only does he rate well in GI and right back stats, but he’s flexible enough to play further forward if the need arises, though given Germany’s depth in those areas, they’d need something like a plague of ACL tears or a squad outbreak of the ebola virus for this to matter. Guys like Grosskreutz are invaluable on World Cup rosters because they cover a bunch of different roles while taking up just one roster slot. Left Back Ahhh, we finally hit another trouble spot. The left back position in recent years in Germany has been populated by Borussia Dortmund’s Marcel Schmelzer, who is good, and Marcel Jansen who is… less good? Jansen has been stuck on Hamburg this season, a team that has struggled horrifically in spite of a massive budget, and are standing with both feet in the relegation zone with only one match to go. You have to be wildly talented to play left back on a team that has given up 72! goals this season and still make the World Cup roster. I don’t think Jansen fits that description. One kid who does though is Erik Durm. [youtube id="jEGS_1oyc7Y" width="633" height="356"] He completely shut down Robben in this match. He also shut down Real Madrid’s attackers in the match in Dortmund where they nearly pulled off a huge scalp if [it would be mean to shame him] had managed to put the ball in an open goal. Durm used to be a fairly indifferent forward (check his FIFA Ultimate Team card which may or may not look strangely like Channing Tatum), but the switch to full back has been a revelation. He has been immense the last couple of months, and I feel like he’d be the perfect choice not just to go to the World Cup at left back, but also to probably start. Center Back The starting pairing is simple. Mats Hummels and Per Mertesacker are the best two choices for Germany. Hummels’ swashbuckling style is complemented perfectly with Mertesacker as the organizer and stay at home man, and while Mert might have some trouble with extremely mobile forward lines, Low isn’t dumb enough not to help him out by giving him DM cover. After that you hit some speed bumps. The 3rd choice is a regular player at CB for Bayern Munich, but at this point in his career, Jerome Boateng and “dumb mistake” are practically synonymous. He’ll make the flight, but there’s always an element of discomfort should he be required to perform when it really matters. Boateng is physically gifted, but I’d be unhappy if he had to play a constant starting role in my team. The next choice is one of those roster arguments you end up having when you can only choose 23 players to go to the tournament. I feel like you have to sacrifice depth somewhere, and since CBs run the least of any outfield position and rarely seem to get injured, I feel this is the spot you cut a name, and not in midfield or at fullback. My plane to Germany only has 3 CBs on it, but if I’m choosing a 4th, both myself and GoalImpact are choosing Benedikt Howedes from Schalke. Not only is Howedes solid centrally, but he can cover for RB when necessary. Goalkeeper I mentioned Neuer at the outset, but this is another area where Germany are quite deep. Marc-Andre ter Stegen, a.k.a “The New Barcelona Goalkeeper” is my second choice for this position, and the third slot will likely be taken by Dortmund’s Roman Weidenfeller. Starting XI
 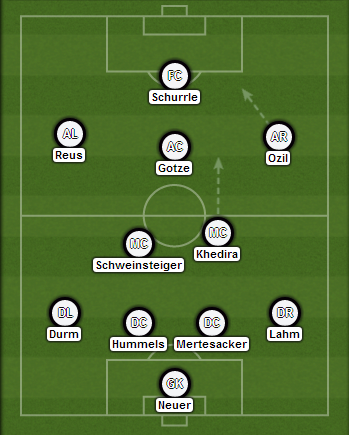 Positional Backups GK: ter Stegen, Weidenfeller CB: Boateng LB: Schmelzer RB: Grosskreutz MC: Kroos, Lars Bender, Baier AM: Muller, Sidney Sam CF: Kiessling, Max Kruse (can fill for AM) Alternates: Benedikt Howedes, Roman Neustadter, Miroslav Klose(?) Conclusion Obviously my team choices are made based on my own judgments, and without any of the politics Jogi Loew has to deal with. Even without a true center forward, I think Germany have one of the deepest, most talented teams in the tournament, and they also have a good manager. They would have to get extremely unlucky not to make it into the knockout rounds, and from that point, who knows? A big thanks to Jorg Seidel for his Goal Impact data. Aside from Reus, the only starters I have that his model doesn’t is Durm over Schmelzer, which is debatable, and Schurrle over Muller, which I’m not entirely sure is the right choice anyway. For Germany at least, GI lines up extremely well with my own evaluations for the starting 11 and most of the 23. --Knutson
Can UEFA Design A Sensible Financial Fair Play System?

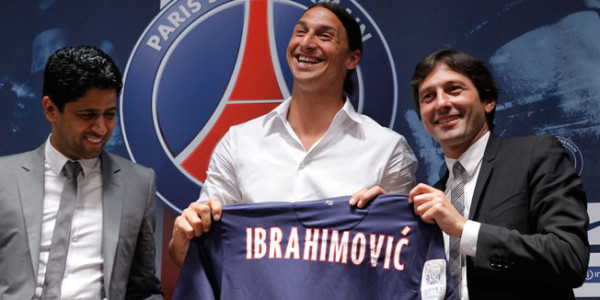 Potential sanctions were announced this morning from the results of the FFP investigations against Manchester City and Paris Saint Germain. Included with the 60M Euro fine for each club are also Champions League roster size restrictions, and a wage cap. Where is the fine that each team pays going? We don’t know. At this point, we’re not even sure UEFA knows. That’s pretty awkward, given how long a period FFP has been phased in for, and how long UEFA have had to actually think about such things, but hey, it’s football. In fact, the whole thing is kind of awkward, as clubs are involved in negotiating their own sanctions, as well as admissions of what they did and did not breach. Regardless, these sanctions are actually quite a bit more than a slap on the wrist. The fine from UEFA is enough to wipe out the entirety of City’s Champions League payout from 2011-13. Yes, the owners are unbelievably rich, but in terms of financial impact on City itself, that fine is large. The roster size restriction also inflicts some pain, though that will mostly be restricted to City’s adventures in Europe. Regardless of all this, the whole thing feels unmistakeably haphazard. Are the sanctions actually going to achieve their goal? What was the goal in the first place? And sweet jebus, if you are going to fine a club £50M, you might want to have a clear concept of where the money is supposed to go. Today I want to briefly outline a system that I think would actually work to accomplish the goals UEFA has set out for this program. They are based on sticks and carrots that have worked extremely well in American sports, and ones that only make minor adjustments to the current system in the name of better achieving the overall goals the FFP program was designed for. [Note: I am not a lawyer, so if this breaks EU laws in about 1000 places as part of the proposal, I apologize.] A Better FFP When designing any system, you need to have clear and distinct goals for what you are trying to accomplish. From that point, you build incentives and punishments in to encourage actors to meet said goals. This is true for computer and board games, it’s true for international financial systems, and it’s when addressing financial fair play and football. UEFA has stated that the design of FFP is to cause clubs to better live within their means and to prevent them from going bankrupt. This is a laudable goal, because far too many football clubs in Europe currently have massive debt, much of which is actually owed to their owners, either for loans, or for leverage they used to buy the club in the first place, or for years and years of sketchy financial management in the pursuit of trophies. That said, is levying monster fines – to be paid directly by club owners – actually helping with that? £50Mis a lot of scratch, even to sheiks and oil barons, but does that fine do anything to help the clubs be self-sustaining? There’s a second concept about UEFA’s FFP that we need to keep in mind though. We keep hearing about how clubs who were directly impacted by a team’s lack of FFP compliance can appeal to UEFA for uh… things. What they are appealing for exactly, we don’t know (and it looks as if they aren’t going to be awarded a high place in European competitions as part of a swap deal), but the concept is there. Presumably, if a club (or multiple clubs) in violation of FFP qualify for the Champions League, they likely have a competitive advantage over those who are compliant. Is that competitive advantage costing those other clubs prize and TV money from the Champions League? Does it impact their ability to attract talent, which in turn impacts gate receipts? Potentially yes, otherwise it wouldn’t be a consideration in the program. So if there is a direct financial impact when a long-term, non-compliant club replaces compliant clubs in the Champions League and Europa League, should the clubs who miss out get financial compensation? Additionally, it’s not just teams that miss out that are financially affected. If an FFP violator finishes higher in the league table than a compliant club, they also get a bigger portion of the country TV pool from UEFA as a result, which is another potential financial impact to consider. What Are the Goals of the FFP System? 1) To lessen the chance that teams will go bankrupt by forcing them to buy and spend more within their means. 2) To make certain there is some form of compensation for teams who miss out on European places due to non-compliant teams taking their spots in the Champions and Europa Leagues. So those are our two primary goals based completely on UEFA’s stated goals and the potential for filing appeals and protests to settlements. However, I feel like there are secondary goals that also need to be addressed either directly or implicitly. Sub Goal 1) To allow owners of clubs to invest heavily in their clubs for a period of time, with an eye to becoming compliant in the medium and long terms. FFP was phased in slowly to allow exactly this. It would be harsh and unfair to lock down new owners who did not fall directly within the initial FFP umbrella from spending money to improve their clubs. We want owners to do this. Investing in a club, whether it be the stadium, the academy, the training ground, or in better players and coaches, is to be encouraged. However, they need to do so in a way that doesn’t put the club in danger of going bankrupt, or completely disrupt finances for other teams in the league for the future. Sub Goal 2) Clubs that are consistent violators of FFP regulations need to be punished in a way that makes them want to stop violating those regulations as quickly as they can. Aha! This is the tricky one that needs care in figuring out the best way to wield the stick with regard to FFP violators. Proposed System As I said above, this current system isn’t that bad. Fines/taxes for violating FFP can actually be a good deterrent in the right system, and the additional wage and roster restrictions UEFA has put in place will be a serious headache for most clubs. The fine levied on City and PSG is massive in footballing terms, even if it doesn’t particularly dent their owners’ bankroll. That said, the really big thing that matters here is: What to do with the money? I talked to football’s most-connected journalist Gabriel Marcotti about this briefly, and he said he thought UEFA would use the fine money to increase prize payouts to CL and EL competitions, as well as increasing contributions to grass roots programs. I’m all for increasing grass roots money, but increasing CL and EL payouts seems ridiculous. If the presence of FFP violators in European competitions is directly affecting the teams around them in the domestic leagues, then shouldn’t the bulk of the fine go to them? A Quick Word About the NBA America is obviously a different place than Europe, and though they are equally sports mad, all of the major leagues in the U.S. operate under a single entity umbrella that negotiates National TV deals (outside the NFL, clubs do their own local deals), rights packages, and agreements with player labor unions. Each team is owned by a different ownership group, but the league is empowered to make a ton of decisions directly for the good of the product itself. Nowhere is this more true than the National Basketball Association. Now, NBA owners were rampant overspenders for years. Dumb contracts in the league abound, and at some point they cleverly built a soft cap and a luxury tax into their labor deals to prevent owners with super-rich franchises (like the New York Knicks and Los Angeles Lakers) from leveraging their enormous financial might to the detriment of teams in smaller markets like New Orleans and Milwaukee. Sound familiar? The soft cap and tax did not prevent owners from spending, but what it did was taxed the owners who did spend big money beyond the soft cap number and redistribute it to the teams in the league who were under the salary cap. Let me tell you, there is nothing that owners hate more than writing checks to other owners in their league who are being cheap. And they especially hate to do this when said “cheap” teams finish above them in the league table. This is especially true when you have the side effect of making those teams more competitive in the process. But the cap and tax had the impact the league as a whole wanted. Player wages as a percentage of overall revenue went down, teams that were constant luxury tax payers tightened up their spending, and the value of teams in the league went through the roof. It’s been stated in the media many times that one of the long-term goals of the Premier League owners is to get wage spending under control. Unfortunately for those owners (who are all rich, by the way), the structure of the Football League itself combined with European labor laws makes this a lot more complicated than it is in the U.S. Anyway, I digress. To recap: NBA, soft cap and tax, BIG impact on rich owner spending. Back to Football If you are going to fine FFP violators large amounts of money, it makes the most sense if the bulk of the money goes back to the domestic league the violators are from as a sort of redress for skewing the financial situation and competitiveness of the league. This takes a fine and turns it into a progressive taxation scheme for frequent financial violators. The devil is obviously in the details here, but given the fact that City were an average, midtable side in the years before they started their massive spending spree (14th, 9th, 10th from 2006-2009), there’s a reasonable argument that their current spending has cost teams like Tottenham, Liverpool, Everton, Newcastle and the like tens of millions in Champions League money in the process. The simple solution to this issue is to give most of the fine money back to the teams who lost out because of the new financial imbalance. However, add the caveat that fine money will only be distributed to teams who are themselves FFP compliant. This has a three-fold effect. A) It punishes FFP violators in a way that is now distinctly uncomfortable. Not only are they paying fines, but the fines go directly to their competition. B) It attempts to repair damage to a league that occurs when a couple of teams become huge spenders, which either wrecks the competitiveness of the league (see PSG and Ligue 1), or forces all the other teams to spend vast amounts more simply to try and maintain the status quo. [Note: In the six seasons from 2006 to 2012, Ligue 1 had five different teams win the title. With PSG and Monaco obliterating the financial structure of the league, how long will it be before that happens again?] C) It incentivizes all teams in a league to be FFP compliant, should they wish to partake of any current or future fines handed out from UEFA. This has the beneficial trickle-down effect of nudging clubs everywhere to comply with UEFA financial regulations whether they are in a European competition or not. Obviously this doesn’t matter in a league that has no teams breaching FFP, but that’s kind of the point. In that type of utopian football setting, UEFA is already content, even if the majority of the footballers themselves are the result of secret cloning experiments based on Maradona’s DNA. (Or potentially in the next generation, the fact that Raheem Sterling has sired children with all native English women.) Conclusion So there’s my simple take on a change that would take UEFA’s current FFP system and switch it to something that actually matters. Tax/Fines systems can work incredibly well, if you are providing the proper incentives for all teams to comply. The system proposed above allows new club owners to invest in their clubs (this increasing interest and long-term franchise potential of buyers and sellers) initially, but then expects them to come in line with UEFA regulations. If they don’t, it fines them in exactly the same way as we are currently seeing in the City and PSG proposals, but it makes certain that those fines are distributed in a fashion that is really annoying to the violating team, and which takes direct steps to repair some of the damage done by the FFP violations themselves.
The Danger Of Predictions: Luis Suarez Edition
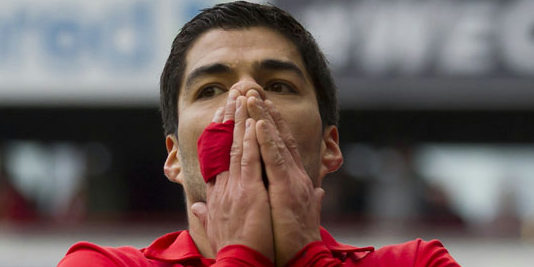
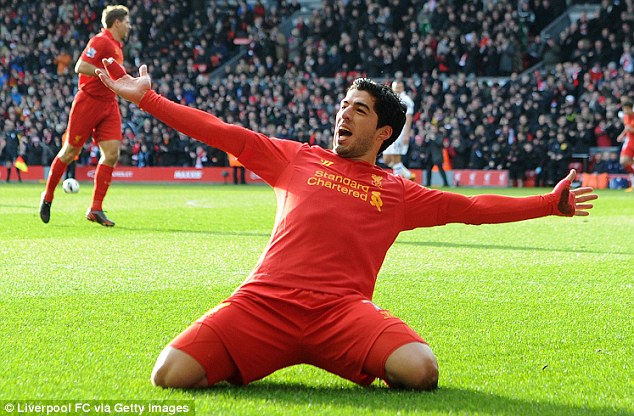 Last summer, I said I thought Liverpool should sell Luis Suarez. There were a lot of reasons behind it, but most of it boiled down to the fact that Suarez was one of the worst high volume shooters in Europe when it came to converting shots into goals. A non-penalty conversion rate of 8.7% in his first season in the league, followed by another of 12.3% in his second season weren’t impressive enough for me to think his dribbling (also inefficient) and ability to create his own shot were enough. Liverpool were already near the limit in how often teams can generally shoot in a game (19.4 in 2012-13), and in my opinion, Suarez’ inefficiency was keeping Liverpool from taking the next step and competing for a Champions League place. Obviously, I was wrong, and Luis Suarez has been having one of the greatest scoring seasons in English Premier League history. He’s done it on the back of a conversion percentage that has improved by about 50% over what it was last season (and it was nearly 100% better for most of the season, before he eventually cooled off). What bothers me isn’t that I was wrong. If you have opinions about football and vocalize them, you will sometimes be wrong. If you make predictions based on probability, being wrong is a way of life (and I work in gambling, so this happens basically every day). If people want to pick you to bits and act like probabilities are certainties while ignoring all the positive stuff, there is not a damned thing you can do about it. I have reviewed my work fairly regularly on this site, both when it comes to player analysis and to predictive models, and will continue to do so. I’m actually quite happy with the player modelling I’ve done over the last two years and ability to pick out likely transfer bargains via stats. I’m less happy with the predictive modelling and certain mistakes I made early in the season, but I’ll write about that another time. Anyway, back to the topic at hand, I get things wrong all the time. That’s what happens when you express a lot of opinions. What bothers me, however, is wondering if I should have expected or predicted Suarez’s conversion increase. How often do we see major leaps in conversion percentage for high volume shooters? And when we do see this, what are the possible explanations? I think I now have enough player data to take at least a back of the envelope swipe at this topic, so let’s crunch some numbers and see what we get. The Criteria 1) Players must be a high volume shooter. I set the cutoff for qualifying at 75 shots in a season, with at least 9 90’s worth of playing time. The reason for this choice is that lower volume shooters are likely to encounter a lot more variance. Even 75 shots in a season isn’t a huge amount, but if I upped the number to 100, I’d lose too much sample to make this worthwhile. Sometimes you work with what you’ve got. As it is, I ended up with 100 names who had a multi-season dyad of 75-shot seasons to analyse (I counted Sturridge at LFC 2012-13 on a technicality, even though last year he had 70 shots, because I wanted to look at Liverpool players). Even this was imperfect because a few of those players had gaps between comparison seasons, but it was the best I could do. Out of the 100, I ended up with 166 dyads to compare. I would like more, obviously, but for now we’ll work with what we’ve got. The next question is, what represents a significant improvement in conversion? 3%? 5%? Conveniently, the population had an average number of shots of 100 per season and an average conversion rate of on non-penalty shots of 11.5%, for the obvious 11.5 NPG per season (once in a while, math is easy). A 4% increase would represent just a hair over 33% bump in conversion arate and boost the average goals to 15.5 goals a year, which certainly feels significant. So with a population of 166 dyads to compare, how often did we see a 4% or more improvement? Answer: 24 times, or 14.5% of the time. The bulk of those seasons were done by younger players (usually 22-24 years old), who for whatever reason made a big improvement in conversion percentages. Sturridge, Bale, and Lewandowski have both done it twice. Some of these are a bit awkward because they include guys like Tevez who transferred leagues and managers and posted a big improvement against different competition, but that’s football. Alright, based on this smallish population, there’s a 14.5% chance someone will post a big gain in conversion percentage. What about the inverse? Out of these 166 season-to-season comparisons, how many had a big fall? Answer: 27 times or 16.3%. In reality, this is about the same as the jump, as these numbers aren’t nearly large enough represent a significant difference. So 1 in 7 players will get a big bounce like Suarez did, and 1 in every 6 will hit a cliff and become less efficient. That’s more than I was expecting, but it’s still not frequent enough to call this a normal event. What might cause a big boost?
- Change of position, especially when wide players are played more centrally.
- Improved shooting locations (typically via a change in tactics)
- Less defensive pressure (via counter-attacking goals or throughball passes)
- Better players around them. (Also likely to result in less defensive pressure)
- Worse competition
- The age curve. (On average, Forwards have their peak seasons between ages 24 and 26, which also coincides with peak male muscle mass at age 25. Thus younger players do tend to show improvement in this area.
And obviously the drops tend to be caused by the reverse of these things, including getting older. Some More Notes Suarez is converting 17.5% of his shots with two games left to play. How good is that? Well, out of 447 high volume seasons (this number is different because I’m not looking at season-to-season dyads), Suarez ranks 46th. However, out of the top 50 seasons in that stat, only 6 are from the Premier League. The vast majority of the top 50 are taken up by players who played in Spain or Germany, which makes sense because they tend to allow a much higher percentage of shots on target as well. In short, it’s tough to convert in England. Even more intriguingly, 3 of those 6 seasons happened this year – one by Sturridge, one by Aguero, and one by Suarez (all of whom also experienced a huge bump in conversion rate over last year as well). That’s really unusual. Hrm… The Water In Liverpool  While I’m here, I probably should point out that Liverpool had a third player from this season experiencing a huge jump in conversion rate, but Raheem Sterling doesn’t shoot quite enough to qualify for the study (only 40 shots so far this year). He went from 5.9% last season to 22.5% this season though, which is in the top 5% for all FWD/AM seasons, period. One player from Liverpool with a huge bump in conversion percentage I could believe. Two players with a huge bump from the same team, I would start to get sceptical. When all three players in your front line experience a huge leap at the same time… that ain’t chance. My feeling is that this is less a “players got better” effect and more a “Brendan Rodgers found a tactical wrinkle.” Which is awesome work from the manager, because too often managers are inflexible instead of playing to the strength of their personnel. This change from Rodgers is hugely impressive, and effective. It remains to be seen if they can do like Real Madrid, Barcelona, and Bayern Munich do and maintain an extremely high conversion rate from season to season. The biggest question though, might be whether Rodgers can keep the efficiency in attack and sort out the defense… What Happens Next Season? Is a large leap in conversion rate like Suarez, Sturridge, and Aguero all experienced this season sustainable? Unfortunately, we don’t really have enough data to know. In both cases for those personnel, you are likely to have the same manager at the club next season who will employ similar tactics, so that’s a positive start. This is especially true if you think Liverpool’s change of style from last season to this under Brendan Rodgers is a significant driver of the better finishing rates for Suarez, Sturridge, and Sterling. I’m sceptical they can remain in the stratosphere for a second season in a row, if only because teams will start to adjust to what they’ve done this year tactically, and that will make it harder to score goals. I’m also sceptical because out of the 100 player sample, there are seven guys who have made a leap above 16% conversion rate and stuck it for at least one more season. They have played for: Real Madrid, Barcelona, Arsenal/Manchester United, Arsenal, Bayern Munich, Bayer Leverkusen (the world missed out on Kiessling). Wait, that’s only six. Oh right, the seventh one was Roberto Soldado. [Cue: Spooky Scooby-Doo music] That was obviously before transferring to Tottenham this season. It’s possible Liverpool are the new Real Madrid. But would I bet on two out of the three front men maintaining this level of finishing next season? Yikes. Back to the Opening Question: Should Liverpool Have Sold Suarez? Armed with just this study, should Liverpool have taken £42.5M or whatever Arsenal offered at the end? Remember, this was a player who was banned for biting Ivanovich coming in to the new season, who had also previously been banned for racist comments, and who was agitating for a move himself. My answer would still be yes. With only a 1 in 7 chance that he’d make a leap to being a truly exceptional finisher this season, I would have sold him for an amount of money that looked slightly over the sticker price. (And it’s probably quite a bit worse than 1 in 7, because most “leaps” happen with younger players and Suarez turned 27 in January.) However… The analytics community has learned a lot in the last year, and one of the big things is that the ability to create your own shots is rare. The ability to do so while having at least reasonable shot quality is exceptionally rare. Look at it this way - Andros Townsend had a ton of shots at the start of this season, but they were from an average of 25 yards out and had terrible goal expectation. In fact, he’s had 56 total shots and 1 goal so far this year, a goal which actually came off of a fluke, meant-to-be-a-cross. Anyone who can dribble and plays up front could probably be an Andros Townsend. Suarez wasn’t like that. He did shoot too often from poor angles, but his overall expectation was actually solid. He’s been one of the most prolific shooters in Europe three years running, and he’s a capable passer as well. Expect to see more about Suarez, Sturridge, and Sterling from guys like Colin Trainor and Paul Riley once the season ends, because people are going to want to unpack Liverpool shot locations and figure out what’s going on. Anyway, in light of that information, would I have sold Suarez for 40M+? No. I was ignorant of how rare his skills are, so even without a potential bump in conversion, he was probably worth more in the Cavani range of £55-60M instead of £40M. Now, after having maybe the best (or second best) scoring season in Premier League history? Add another £20M. So there you go. Some squishy math, a prediction/projection that went badly, but a whole heap of useful information learned in the process. Until next time, make sure that anyone selling you snake oil at least wears a smile.