Defense is probably the most important element to focus on in football. It’s important for title winners. (*Glances toward Liverpool* Okay, most title winners.) And it’s really important when trying not to get relegated. Yet our understanding of defense, or even the various ways we track it statistically, is awful. We have almost nothing to go by when evaluating team play except goals and shots conceded. Do tackles matter? Do interceptions? Clearances? Blocks? There’s research going on in these areas, but needless to say, this has been bugging me for a while and I’m not happy with the breadth of the data we currently evaluate. Today I want to simply introduce a couple of additional defensive metrics we should be examining at the team level. This is not rocket science stuff – it’s basic info that up to this point most people have not had access to. Tomorrow I’ll start layering in some additional contextual info, plus adding some historic data, and maybe at some point we can draw conclusions. For now, just check it out and see what you think. (Note: all of this assumes that I sliced and diced the data correctly. That may be a large assumption. I don’t have any real baselines to compare to, but these mostly pass the eyeball test.) Opponent Passing Percentage So we track how well teams pass the ball, but for whatever reason, the inverse information is not available anywhere. If passing and possession are part of attack and game control, then preventing your opponents from doing the same should also be important. Here is the EPL table for opponent passing percentage through April 21st. 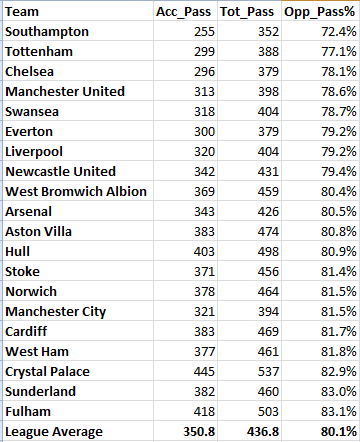 So this table looks at accurate opposition passes, total opposition passes, and the percentage, all on a per game average basis. Seven of the bottom eight teams have been relegation candidates at one point this season. The other team in that bottom eight… are small favorites to win the league. Ooookay. What about if we look at this same metric in Germany?
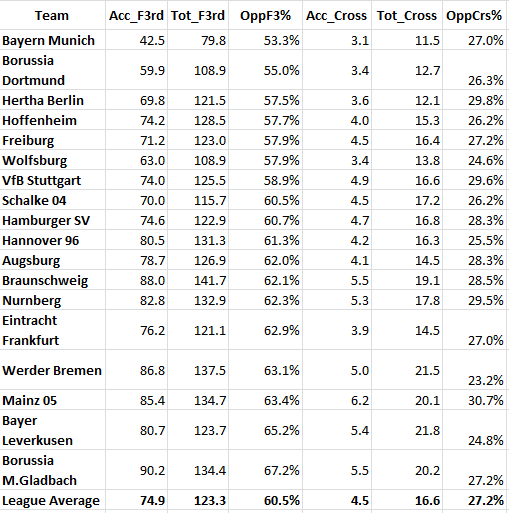
 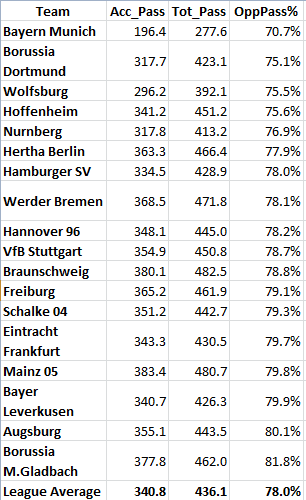 The top 3 teams here have either clinched a Champions League spot or are battling for the final one. But the bottom 4 are battling for European slots as well. Hrm… How about Spain?
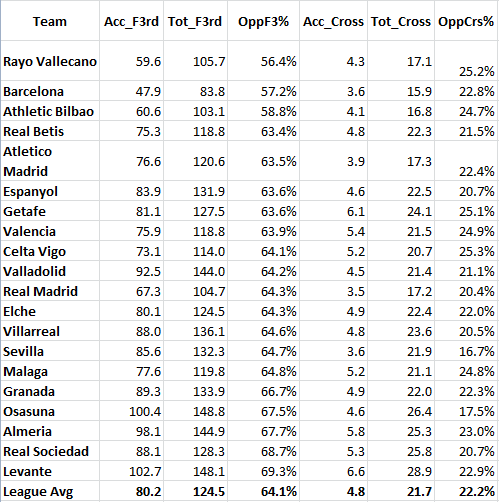
 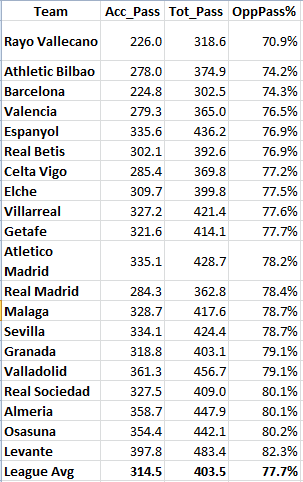 Rayo, Bilbao, and Barcelona all have pretty hefty deviations from the mean in the positive direction, but beyond that I don’t see much to draw on. Right now we don't know how much this correlates to other defensive metrics like goals and shots allowed. It may be that this tells you more about style of defense, and which teams employ a regular press, but it's something for people to explore in the future. Opponent Final Third Accuracy Obviously what happens in the final third is the most important bit defensively, but different teams employ different tactical schemes to try and prevent their opponents from being effective. Does that show through in these stats?
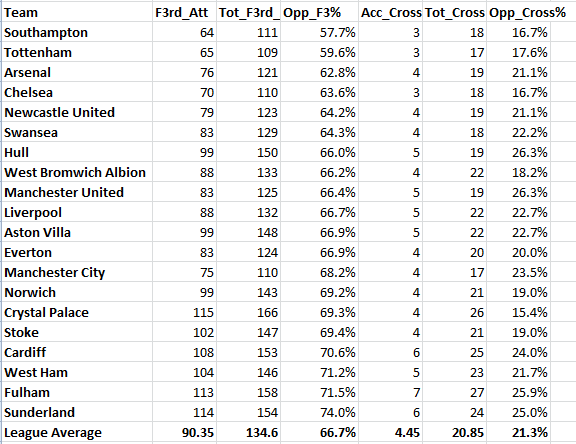
 Anyway, expect to see more about this type of stuff from us (and hopefully others) in the future.
Month: April 2014
Passing Impact and David Silva

Overview
David Silva’s nasty looking ankle injury is a demoralizing loss for Manchester City. Although City will not have the Spaniard down the stretch of their Premiership title pursuit, world football (and City) fans will take some consolation in the fact that the injury is not as severe as it initially appeared. While reviewing his season, Silva's excellence across a number of passing statistical categories is striking. It brought to mind a challenge I received from Matt Tomaszewicz aka The Shin Guardian to try and derive an over-arching metric from a few ubiquitious passing statistics: number of passes, pass completion %, key passes. The following is a (flawed) attempt to both quantify David Silva’s passing impact and meet Matt’s challenge.
Passing Impact
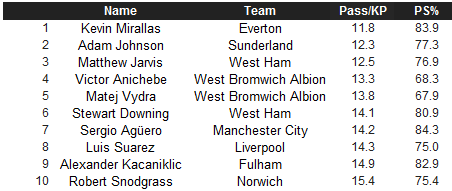
Who is the most impactful passer? The obvious answer is someone whose passes create goals (assist). But assists are so infrequent that really we are looking for passers that create goal scoring opportunities (key passes). Of course, it would also be ideal to have the data for passes that create passes for goal scoring opportunities (secondary key passes), but that data is not publicly available. Also, as has been pointed out by Colin Trainor (and others), being able to assess the quality of the shots the key passes create is very informative, and is notably absent from the key pass metric. Nevertheless, key passes is what we have. Below is the list of the top total key passers in the EPL this season.
This seems a pretty good list. Generally, these are names we associate with being impactful passers. But what about efficiency? Who is creating the most key passes per pass attempted?
Ok, so this list is quite different than the first. But look at the low passing % of some of these players, like Anichebe and Vydra. We have to take incomplete passes into account as well.
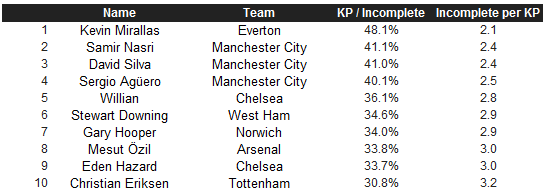
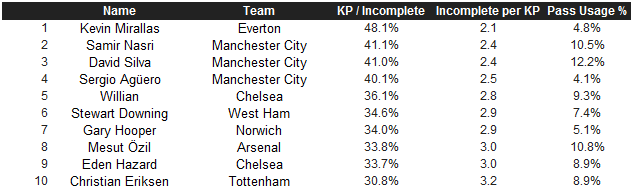
This is probably the best measure of key pass efficiency. I included two versions of the same metric because while I prefer KP/Incomplete %, some might prefer to visualize it the other way around. It should be noted that turnovers or dispossessions are not included in this analysis. Also absent? Pass usage rate. It is one thing for Kevin Mirallas to be incredibly efficient at creating goal scoring opportunities, but as an attacker how often does he see the ball relative to other players? (Note: pass usage rate = player passes attempted / team passes attempted.) This is the same list of the most efficient EPL key passers, but now with their pass usage rate.
So how do we combine the two metrics (efficiency and volume)? I decided to measure each player’s total passing impact relative to an average EPL field player (non-GK).
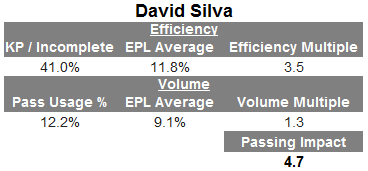
In David Silva’s case, his passing impact while on the field for Manchester City is equivalent to almost five average EPL players. If we exclude defenders and compared Silva to just midfielders and forwards his passing impact would still be equivalent to approximately 3.5 average midfielders or forwards. In short, Silva’s passing impact is equivalent to almost an entire midfield of an average EPL team. Here is the list of the top 10 players.
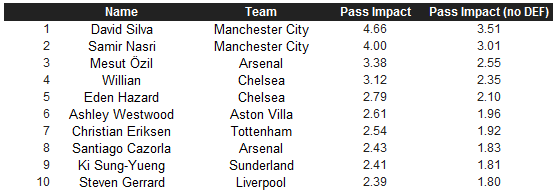
There are obviously a lot of flaws in this analysis, chief amongst them the reliance on key passes as a primary indicator of passing impact. Therefore, it is no coincidence that a majority of this list are creative attacking midfielders. Then again, if one were to create a “goal impact” rating, that list would primarily be populated by strikers. No matter the statistical inputs, it is self-evident that David Silva is having an exceptional season and City, despite having the number two player on the list in Nasri, will no doubt miss his passing genius.
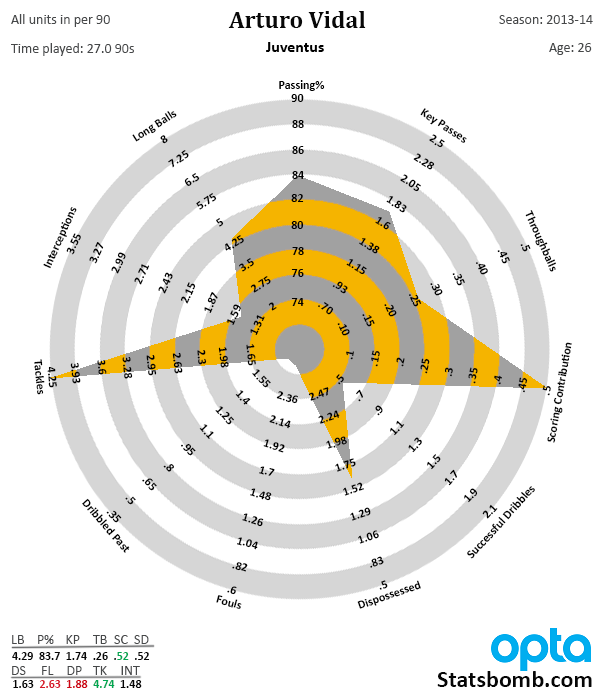
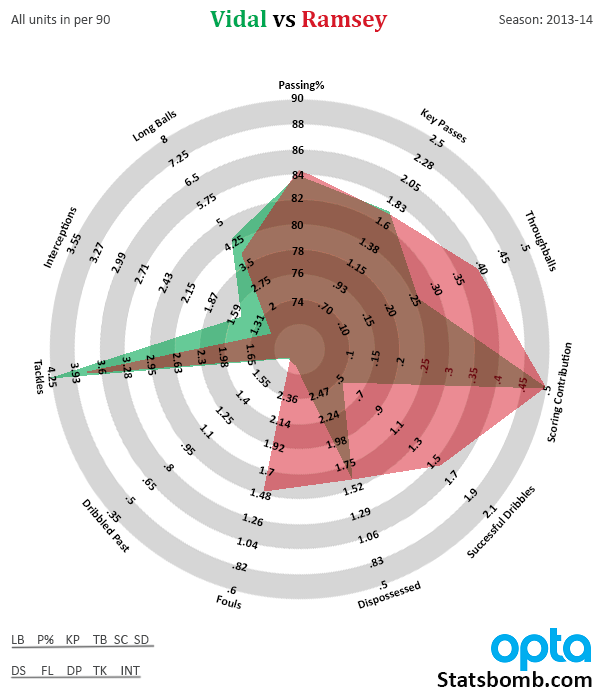
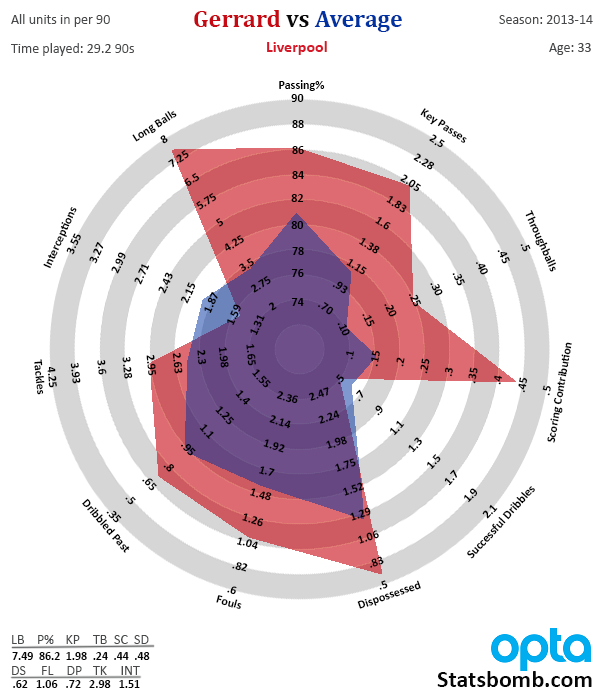
Visualizing Midfielders - Steven Gerrard, Aaron Ramsey, Arturo Vidal, and Andrea Pirlo
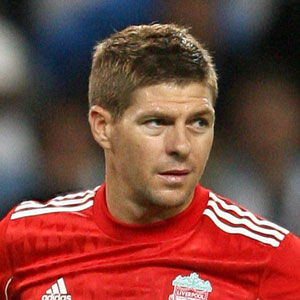
Last week I talked about the revamped radar for attacking midfielders and forwards. Today I’m going to introduce the new central and defensive midfielder template and talk about some things I’ve learned from doing the visualizations. Let’s start with a real-world example of old vs new. This is what Steven Gerrard looked like on the old radar. 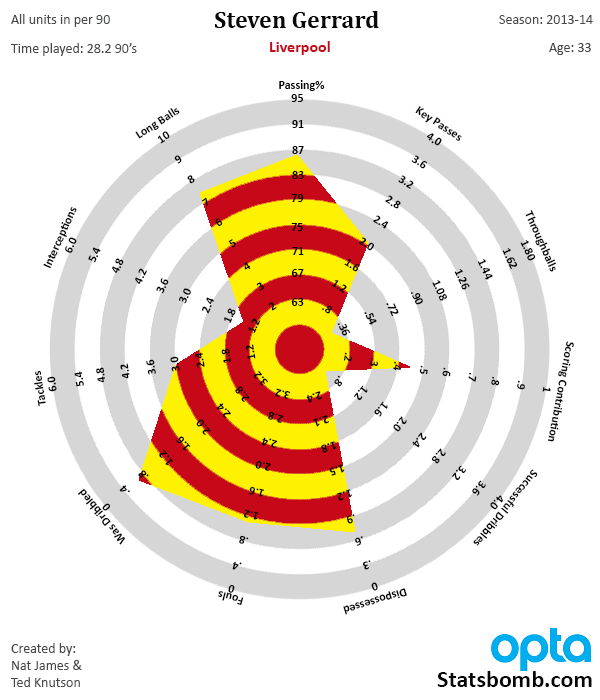 And this is what he looks like on the new version.
  So what changed? First of all, any player hitting a boundary on the outside of the radar has produced a season ranking in the top 5% of all players for that stat at that position, based on production of all players in the big 5 European leagues from 2009-2014 on a per90 basis. This is very, very good. Like, saaaay, Andrea Pirlo.
 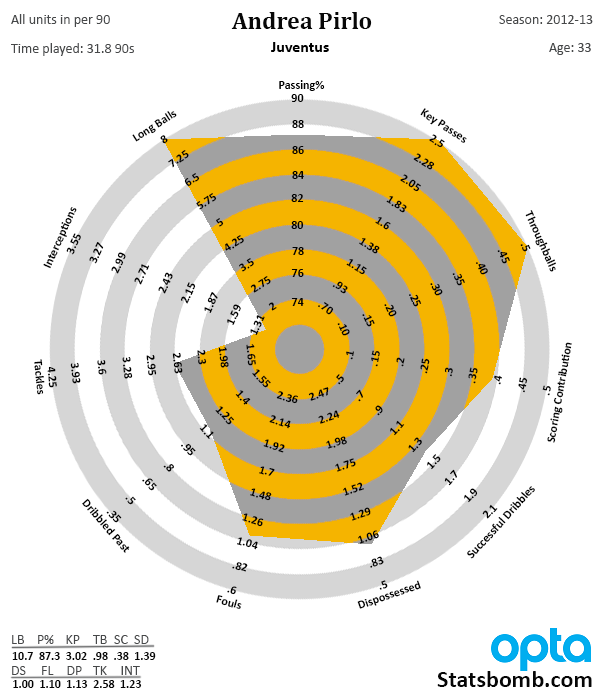 From the sublime to the not so good, we have the other side of this change. Any player hitting the dot in the center of the circle produced a season that ranks in the bottom 5% in that category for that season. All of that space in the circle itself is the two standard deviations from the mean. This should make it a bit more statistically rigorous and meaningful, and it also makes average look a lot less awful than it did on the old versions. Speaking of average, this is what statistical production looks like for your average “midfielder”.
 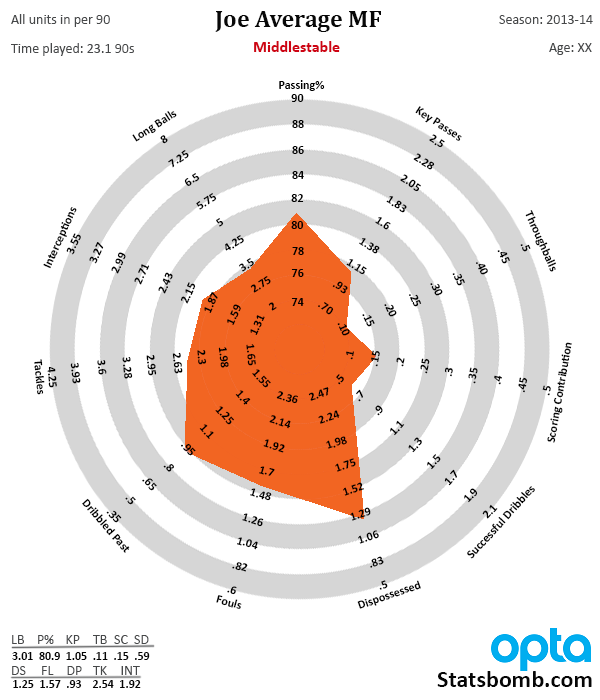 I found this slightly surprising, as your average midfielder looks like a mediocre DM. What that tells us is that most midfielders across the big leagues perform defensive duties and act as recyclers, but don’t have a big impact on the offensive end. That leaves the bulk of the scoring work to be done by forwards and attacking mids. Now this is what a player who scored in the 75th percentile in all stats would look like.
 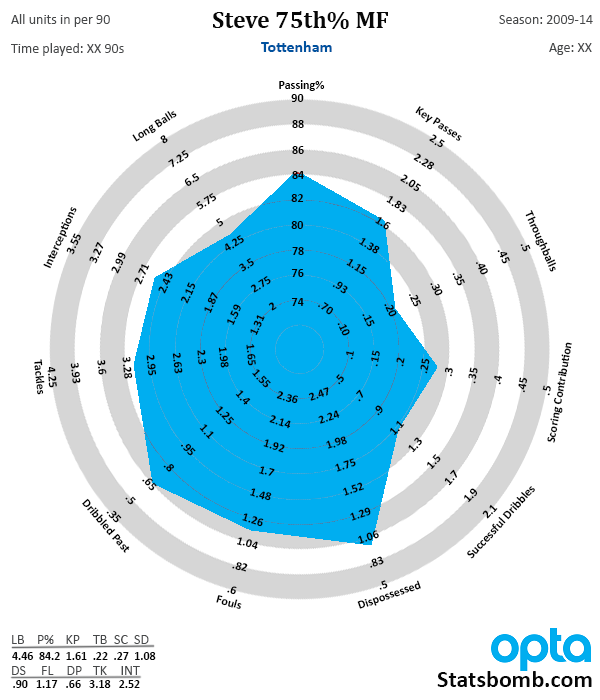 We’re getting quite a bit more offensively here, as key passes are over 1.6 per 90, scoring contribution is over a goal or assist every 4 matches, and you have some dribbling as well. However, it still doesn’t push out to the halfway point in the circles. What this means is that top 25% of all midfielders contribute a ton on offense, and drag the whole population toward the boundary with them. Translation: There aren’t nearly as many midfielders who have high contributions on the offensive end, and thus they are more considerably more valuable than you might expect. A player that has good contributions in both attack and defense and plays midfield? Enormously valuable. Meanwhile, good attacking mids are actually fairly easy to pick out and not that uncommon. (A reason why I thought buying Juan Mata for £37M in January was insane.) Keep this in mind when you see people making midfielder recommendations and attaching prices to them this summer. True midfielders, including deep-lying playmakers, that add to the attack should bring big money on the transfer market. Other things I learned while revamping this include.
- Tackles and dribbled past are likely inversely correlated. This creates what I call the sting ray effect (you can see it in the Ramsey and Vidal radars below), where by making a lot of tackles, you also put yourself in position where you probably get dribbled past a bunch in the process.Follow-up question because of this: Are high numbers of tackles and fouls also correlated? I don’t know yet. Additional follow-up question: Do extreme performances in tackles make it impossible to have a high number of interceptions as well? Is that true for DMs or only box-to-box players?
- This one goes more with the Forward radar, but dribbles and dispossessions are also probably inversely correlated, especially at the boundaries. The more you dribble, even successfully, the more likely you are to also be dispossessed compared to the general population. There’s a usage rate issue that deserves looking at, but there’s tons more stuff to explore here.
If you want to know more about what other changes I have put in place, scroll to the bottom for a change log. If you want to see a bunch of big-name player radars and comparisons, stay right here. Radar Love 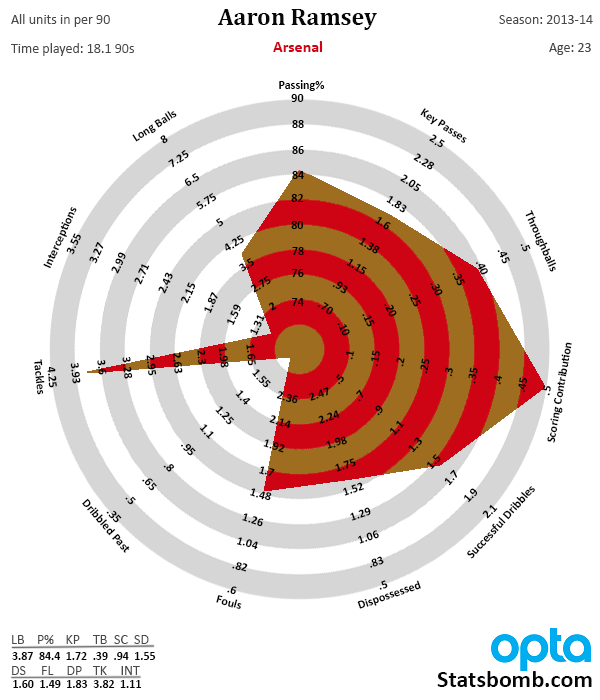
 CM Radar Change Log
- Redid all axes with 5%/95% cutoffs
- Added Age: XX for the season
- Added gridlines in the bottom right corner so that you can look up the actual stats produced for that season. I did this because you lose informational acuity for Top 5/Bot5% seasons and I wanted a way to track it. When I have time, I will also highlight top 5 in green and bot 5 in red. If I forget to change the stats in that section, they will probably be Aaron Ramsey’s from 13-14, since he’s the first plot I did on the new template.
- Turned all text on the bottom half of the radar right side up.
Question: Why didn’t you make each ring represent a percentage of the distribution? Essentially, why isn’t the average player a perfect circle at the 50% mark? Answer: Because I felt that doing so would make it less intuitive to read for non-stats people. Additionally, I discovered that by doing so, you lose the distribution point I made above regarding attacking stats and midfielders. To me, Question: How are these created? Answer: I grab the data from a MySQL database that has Opta stats, and then plot the radars and fill in additional information by hand in Photoshop. At some point I would like to get the creation of these automated, but my programming knowledge is not there yet and I really don’t want to decrease the quality of presentation. I’m sure there will be other iterations of these in the future, and I’m currently working on fullback radars as well. As with almost all graphical presentations of data, there are issues with these, but I feel like they are improving as we learn more about the stats and the sport itself. Baby steps.
New Radars, Better Rigor plus The Average Player
Back in January, I introduced player radar charts, which I felt provided an interesting way to view player statistics.
I received a ton of feedback on them, some of which was valid, and some of which just disagreed with design decisions I had made along the way. They were also wildly popular. There's just something about seeing player stats as a shape that makes an impression. This is especially true when comparing two or three players at once, and a number of people inside the football industry also said good things about them.
Those first designs underwent some minor modifications, those most important being that I split them into attacking midfielder/forward charts and then general midfield charts. After I broke them out and modified an axis placement or two, I moved on to other things while popping out a few new radars each week.
However, despite the fact that I stopped working on them, I knew they weren’t perfect (they likely never will be), but also that I would come back to them. One of the big requests I received was to know what the average player looked like. One of the small, but more bothersome design complaints was that I had included all of the potential player performances in the chart, and had not cut it down into percentiles or standard deviations or whatever.
Both of these were related to the same issue, which was that I hadn’t plotted the distributions of all the stats across the player population yet. The reason for this is that I wasn’t particularly happy with my position filter, and also that it would take more time than I had at that point. I wanted to find a way that had a high level of informational fidelity (meaning I didn’t want to produce percentiles), but which also put the radars on better footing with relation to academic rigor.
Cut to today, where I have greater familiarity with the data I’m working with and also a little bit better knowledge of Photoshop to rebuild the templates and you get this.
So this is the average attacking midfielder or forward (I’m calling him Joe) on the new template. This template has boundaries that cut off at the 5% and 95% marks of the player population for those positions. So basically the radar chart itself covers stats that are two standard deviations from the mean.
If a player is hitting the boundary on the outside of the chart, they have produced a season in the Top 5% of players for that stat. If a player has a stat hitting the center dot in the chart, they are producing in the bottom 5% of all players in that stat. Simples. (Okay, it is if you understand the princples. Probably.)
As you can see from Mr. Average above, the average player stands out a lot more than he would have in the old chart, and the data points hit around where you would expect them to, even if they aren’t perfectly symmetrical.
But what happens if we look at a player who is definitely NOT average on the new chart?
Great players now cover even more space than they did before. The tradeoff is that you lose the exact information of the season they produced (which I may start to include at the bottom in small tables at the bottom – I haven’t fully explored that option yet), but comparing players now becomes more sensible and it’s easy to just know that if a player hits a boundary, they are in the Top 5% instead of “this is the greatest single season ever in the database for that stat,” which is what it was before.
Going forward, I may make the Joe Average shape a very faint transparency layer in all single-player radars for comparison. This one is dialled up a bit, but here’s what Messi looks like when compared to an average forward or AM.
Anyway, the radars now look different and I’m hoping this format will be locked for at least a while going forward. I’ll also produce a new central midfield radar in the next couple of weeks and finish work on the fullback radar, all in the same vein.
If you like them, great. Please tell your friends, etc. If you hated them before because they weren’t properly statty enough, maybe you will like these more. And if you just hate them period, that’s okay too – not everything we do on the site is for you. Hopefully you like other stuff we produce here more.
Cheers, TK
PostScript Devin Pleuler asked me to put together a comparison of Steve 75th Percentile vs Joe Average.
Into the Mixer: The Top 70 Scorers in Europe This Season + The Lion of Selhurst Park
Welcome to my new, (probably) weekly column. I’ve been looking for a way to dump football and stats thoughts into a weekly piece for a while, but didn’t have a name or a particular theme. Everyone who writes for StatsBomb has some reticence about throwing up smaller blog pieces, as there’s a perception it might harm the perceived quality of the work. My thought was that you just need to label these things as blogs/thought dumps/whatever, and you’ll a) definitely end up with more content and b) hopefully end up with more happy readers. So here we are. Today – and most days in this column – will be a potpourri of stuff I’ve been thinking about, working on, or whatever. They won’t generally be extensive, finalized pieces. Instead expect some written explanation around recent radars I’ve produced, updated thoughts on season or stats storylines, or just random shit I didn’t know where to put. The Kingmaker I noticed this past weekend just how many teams currently in “races” of one sort or another Crystal Palace play in the run-in. I dubbed him the kingmaker, and then @Chairlord requested a photoshop of Pulis as Tywin Lannister. I contacted the incredibly talented @BreakfastPercy about the idea, and this was born.  Tywin’s titles are fairly long, so I’ve kind of combined and shortened them into calling Pulis “The Lion of Selhurst Park” and for this season in particular: The Kingmaker. His first act in bending the final positions of Premier League powers to his will came with the defeat of Chelsea at Selhurst Park itself. He followed that by destroying the Welsh in Cardiff and probably sealing their doom. Next came an even more improbable act than the Chelsea slaying, as the Kingmaker travelled to Goodison Park and rode home with Roberto Martinez’s head on a pike. This took Everton from nearly coinflip odds to finish fourth and pushed them deep into long shot territory. The only question is where will the conquests stop? Pulis has a chance to swing the odds of three more contenders one way or another before the campaign ends. The first opportunity comes when Manchester City visit Selhurst, looking to recover from their disastrous draw against Sunderland. Next come title favorurites Liverpool, also looking to leave Selhurst with their title hopes and dreams in tact. And finally, on the last day of the season, mighty Palace travel to Craven Cottage, where they could potentially play a huge role in determining the fate of Fulham and their imperious dictator, Felix Magath. Back at the beginning of January, I looked into the predictive model crystal ball and said there was no way Palace were being relegated. Palace fans who read this were incredulous. I also apologized for all the mean things I might have said about Pulis over the years. I have learned my lesson – Pulis is actually a good manager, capable of bringing defensive stability to even the most disorganized of sides. Since he joined Palace, they have been a top half of the table team, something that even the most ardent of Pulis supporters would not have predicted. The comparison to the master planner from Game of Thrones above is just a bit of fun, but Crystal Palace are wreaking havoc on a surprising number of fates in the run-in this season. And almost unbelievably, Tony Pulis is at the heart of all of it. Scoring Contributions in Europe Those of you who have been reading my work for a while know that I value goals scored and assists similarly. To me an assist is simply a goal that resulted from a pass. We tend to step back from goals and assists to things like shots, shots on target, and key passes when looking for real predictive work in player analytics, but scoring is still damned interesting. Scoring Contribution in my radar charts is a combination of non-penalty goals per 90 and assists per 90. I view this as a more complete way of looking at offensive contribution than just taking goals or assists. Obviously there are times when you just want to look at one or the other, but when evaluating overall impact, I like the combo platter. (Note: there’s also something to be said for drawing penalties and counting them as .75 of an assist, but I don’t have that data handy yet, so can't test its incorporation.) Anyway, for your viewing pleasure, I have compiled the top 15 players in Scoring Contribution in each of the big 5 leagues below. Okay, Top 15 except for in France, where I cut it to the top 10. France has lower goalscoring overall, seemingly less talent outside the top two teams, and even has fewer basic actions per game than any other big league around. Why? We don’t know. It’s just weird. Apologies ahead of time – I forgot to round off the figures in Excel before taking the screen caps. Le mew, le sigh.
 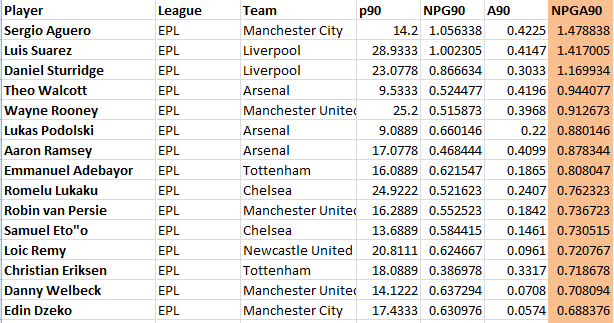 The EPL listing is pretty cool. You have the expected top 3 who everyone knows have been tearing it up, followed by Theo Walcott, Rooney, PODOLSKI, and Ramsey. Poldi may not run much, but he has a knack of being in the right place in the right time, and when he shoots it unleashes Thor’s Hammer from his boot. Good luck stopping that as a keeper. Further along, you get more usual suspects like Adebayor, Lukaku, RVP, and the ageless Samuel Eto’o. (Is he 32? 37? The same age as Joseph Minala? Nobody knows.) The tail end of the Top 15 starts to get strange again. Remy is expected, and Eriksen seems to get better and better, but Welbeck and Dzeko are the ones rounding out the top 15. I expected Negredo to be the other City striker to pop up there, and Welbeck appears to be maturing nicely for Manchester United. Oh yeah, and Carlton Fucking Cole is 16th on the list so uh…
 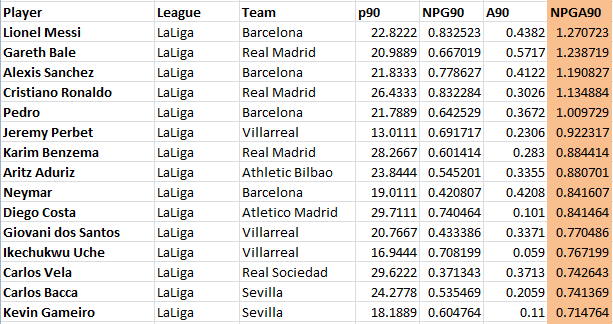 Messi is once again first, overcoming his injury issues to put up yet another great season (despite getting bashed in the last couple of weeks for apparently not doing enough). The second place on this list isn’t Ronaldo though… it’s Gareth Bale. And Alexis Sanchez is in third. Damned impressive. The sixth spot delivers the first non-Barcelona or Madrid player, and surprisingly, it’s not Diego Costa, it’s Jeremy Perbet. Sadly, he’s 29, so not exactly a “hot prospect.” Standing even more prominently in that category is 33-year-old Aritz Aduriz of Bilbao. He’s been great though, and one of the forces driving them back into a Champions League spot. For teams scouting Spain for scoring prospects, Carlos Vela is probably the best name lower down the list, but all indications from recent transfer windows indicate he has no interest whatsoever in moving away from Spain.
 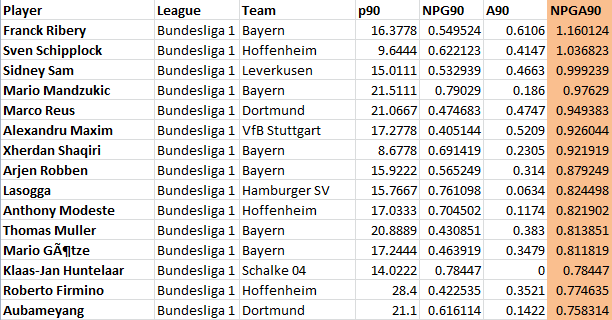 Ribery, blah blah… wait. The Hell. Is Sven Schipplock? Apparently he’s a 25 year-old German super sub for the nuclear-powered scoring rate of Hoffenheim. There have been 4.3 goals scored per game in Hoffenheim matches this season. That’s insane. So you have the excellently-named Schipplock getting two different scoring boosts versus a normal player. The first boost comes from the fact that he’s appeared as a sub sixteen times this season, and as Colin Trainor showed a couple of months ago, playing as a sub boosts your scoring rate. Additionally, he’s surrounded by good players like Firmino, Volland, and Salihovic for a team that plays a gung ho style of football. Even so, that scoring rate is monstrous. Someone might want to take a flier on Sven next season and see what he can do as more than just a sub. Or steal him away and keep him in the same role in the Premier League. Just rename him Ole Gunnar Schipplock, and the fans will know exactly what to expect. After master Sven, you have Sidney Sam, now aged 26, and currently of Bayer Leverkusen but moving to Schalke this summer as part of a… wait for it… 2.5M euro deal sealed this winter. The guy with the third best scoring contribution in the Bundesliga was bought for EPL chump change. After that you have Mandzu and Reus, both of whom are definitely staying put this summer. Reus allegedly has a release clause that activates next season, and can do it all, including having an interesting even scoring split between goals and assists. Then you get to some intriguing names. The first is Stuttgart’s Maxim, who is only 23 and profiles really well as an attacking midfielder ready to make the leap. You also have Bayern second string player Xherdan Shaqiri, who has bulked up a ton over the last two seasons and is still only 22. Someone in the Premier League should at least check and see if he wants more playing time, especially since Bayern just re-signed Robben and Ribery to new contracts. Lasogga is on loan to Hamburg (from Hertha Berlin), and is a battering ram type player who is somehow averaging nearly 4.5 shots per90, with 53% accuracy. He’s also only 22, and coming into the last year of his contract. It will be interesting to see where he ends up in the next 12 months. Modeste is another name flying below the radar, and he’s simply an efficient, no fuss forward. He doesn’t dribble much, doesn’t have a lot of key passes, but he never gets his shot blocked and he scored well. Rounding out the Bundes top 15 are names everybody knows, followed by Brazilian wunderkind Roberto Firmino, and Dortmund’s steal from last summer, Pierre-Emerick Aubameyang.
 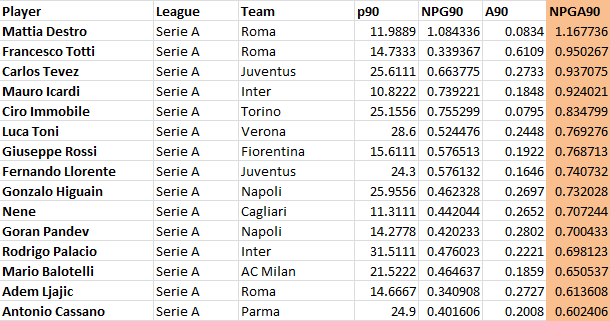 Um… Destro is destroying that league. In fact, he has the highest NPG90 rate in Europe. Yes, even higher than Messi, Suarez, Aguero, Ronaldo, Sturridge… everyone. He’s also doing it in a league that is notoriously stingy toward goalscorers. He only has about 12 full 90’s played and is probably unlikely to keep up that rate over a more substantial part of the season, but those numbers at age 23 are fantastic. Next comes Francesco Totti. Wait, let me start over. Next comes 37-year-old Francesco Totti, currently second in the whole of Serie A in Scoring Contribution. Italy seems to be the type of league where older players can excel even well past what leagues like the Premier League generally allow, but let’s not kid ourselves here – Totti is a special case even there. What a master. After Totti comes the rejuvenated Carlos Tevez, Icardi (21), Immobile (24), and um… Luca Toni? Toni is 36. Like I was saying…
 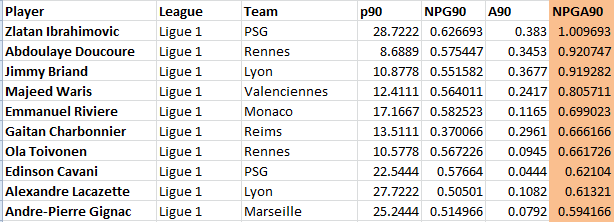 Part of me feels like the less said about Ligue 1, the better, but Arsenal and Newcastle have to shop somewhere, and there are a few interesting names on the list. If I were scouting for a team, I’d take a very close look at Waris, and Lacazette, while Riviere is a young player who is blossoming at Monaco this year. It will be interesting to see if he continues to get playing time, or gets nudged out of the way by bigger names (and probably a new manager) in the next transfer window. Let's be honest, though... at this point in its history, buying players from Ligue 1 is the equivalent of getting most of your clothes from Primark.
Podcast 14 - Title Races in EPL and La Liga, Who gets 4th + the PL Toilet Bowl
What's the Most Important Stat to Convert Skeptics of Analytics?
 This is a really good question and one that I find myself thinking about quite a bit as we at StatsBomb start interacting more with media and potentially with football clubs. For the most part, I think the answer depends on the audience. In the last week, I have seen NPG90 (non-penalty goals per 90) used all over the damned place, including in a Paolo Bandini piece in The Guardian and Gabriel Marcotti either on ESPN or in the Wall Street Journal. This was definitely not happening a year ago. Smart journos know that this type of adjusted rate stat tells you a lot more about “useful” goal scoring than simply looking at who has the most goals in a league, and it’s gaining traction in the mainstream. The owner of Squawka tweeted a leading goalscorer chart for the Premier League yesterday and a wave of derision followed after it. Not because people don't like stats, but because it gave the same weight to penalties as to other goals. The world is changing fairly quickly on this at least. I also like the key pass stat, since it adds a lot more information about which players are dangerous passers that are setting teammates up for shots versus those that are merely involved in the game. However, I think that particular stat is just a touch too abstract for popular acceptance right now. Europeans are barely aware of assists – moving one step beyond that into “passes that create shots” is probably a step too far. At the team level, I think we’ll see ExpG (Expected Goals) take off like a rocket as teams become more analytically aware. The reason for this is because it creates clear points of actionable data for managers, players, and Directors of Football to talk about. Everyone involved in football knows there is a lot of luck in the game, but having metrics that try to cut through the luck and look at what actually happened in a match is extremely useful. This is already happening with some teams in hockey. There was a story from Mirtle I read last week about coaches coming to the analysts immediately after the match to check on their PGS (probable goals scored) stats so that they could then have an objective point of reference to talk to the team and media after the game. Everyone involved in football should be evaluating via process more than via outcome, and I think you will see that happen more and more in the medium term. None of the ExpG models are perfect yet, but they will become more precise in time, and as more data becomes available. In the meantime, what we have now is far better than nothing, or even what the world had access to a year ago. With regard to conversion of fans, a lot of it comes down to comfort levels with numbers, and some of that involves simply seeing numbers used to compare players and teams on a regular basis. Fantasy football certainly seems to help with this (and I have been told by many FF fanatics that our site is SUPER helpful with picking their teams, despite the fact that none of us play), but so too does seeing useful stats appear regularly on Sky coverage and on BBC. (It helps that some of the same guys helping in the background on those shows are also fans of our site.) People who do analytics in other sports seem to win the vast majority of their battles, and the media pieces written about basketball and hockey are completely unlike anything you would have seen 10-20 years ago. Football is tiptoeing in this direction, but this is probably the first year that is the case. At some point, literacy with stats will be a requirement for most intelligent sports writing, in America and in Europe as well. Fast forward a decade from now, and baby steps that we're taking in football analytics will probably seem perfectly normal stuff to talk about with a broader audience. In the meantime, tell your friends when you see stuff you like, and keep clicking and interacting with the writers that use stats to cheer them on. Almost none of these guys get paid, and they tend to operate on caffeine and kudos alone.
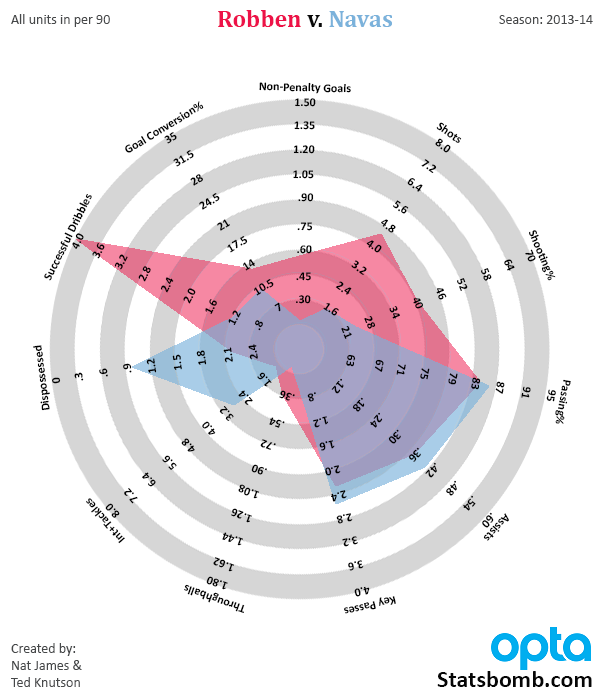
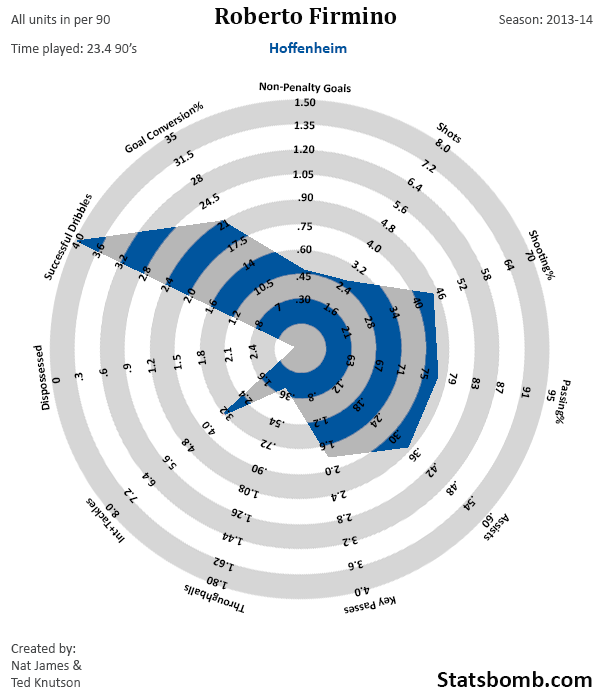
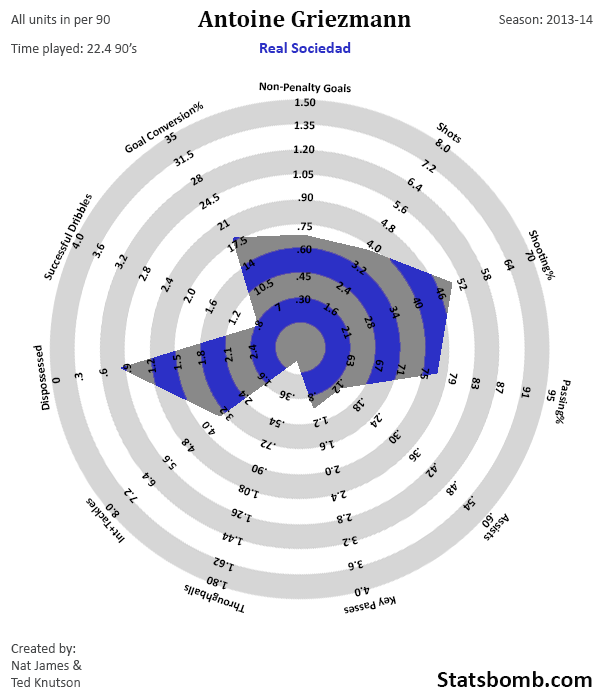
Radar Love: Robben, Reus, Sanchez, Navas, Firmino, Griezmann
It had been a while since I produced any radars, but this week I've been fixing that. However, instead of just leaving them to be quickly forgotten on Twitter, I've started to use a post to dump recent radars into. This week, at reader behest, I did a number of wide forwards. There isn't much written analysis here, but hopefully the pictures kind of speak for themselves. 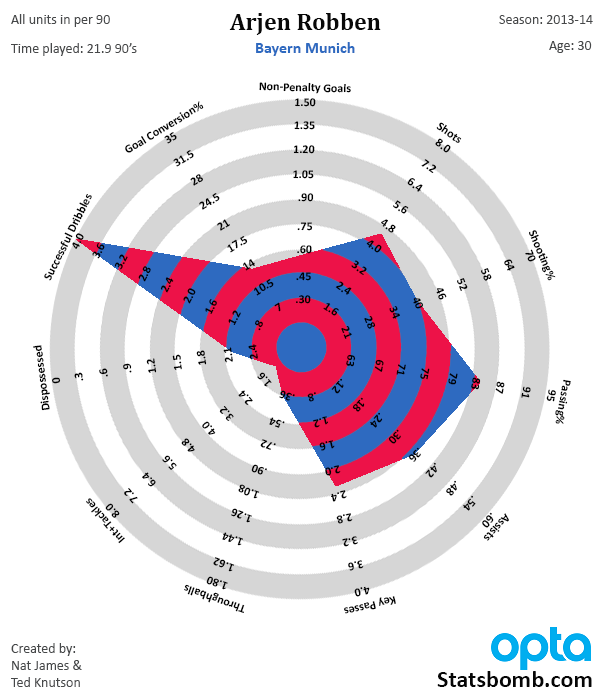
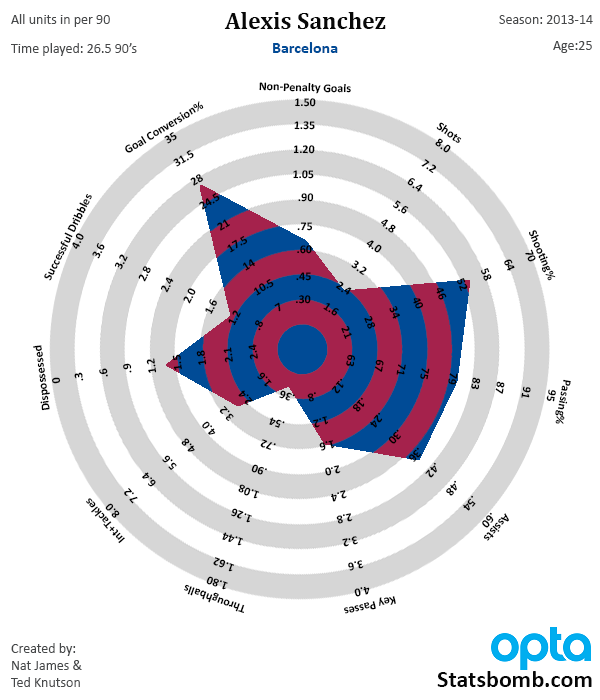
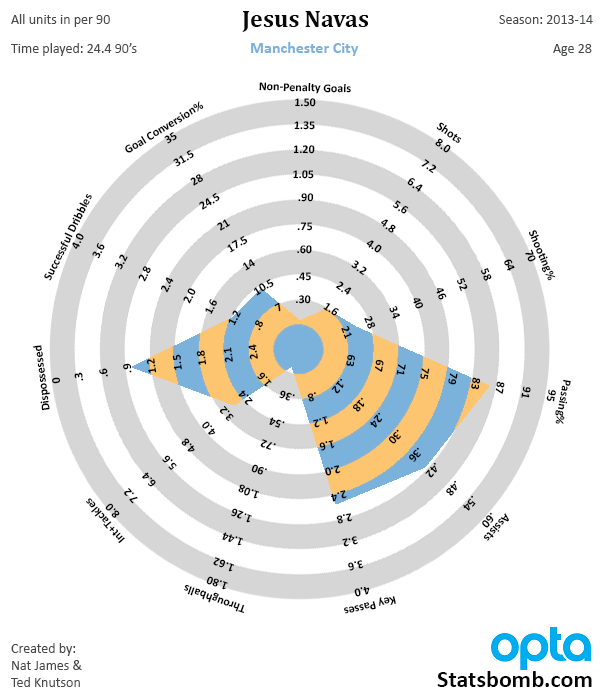
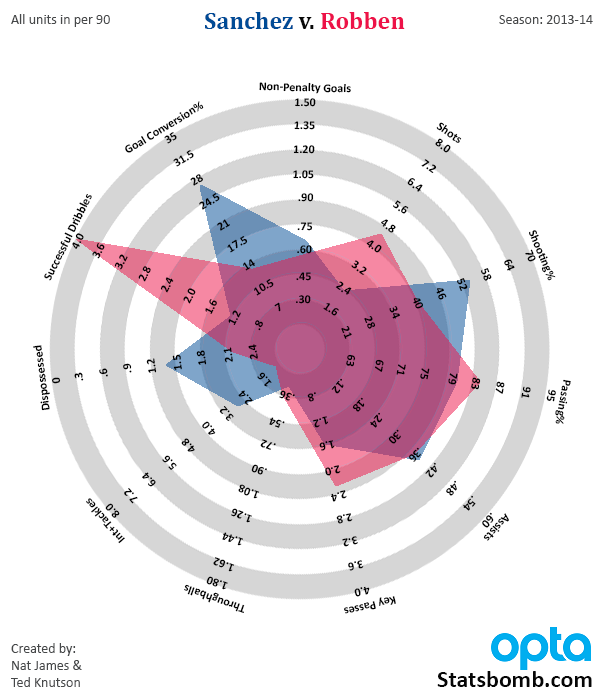
 The short analysis of these players would read: Even at age 30, Arjen Robben is a monster. Shot monster, dribble monster, and excellent key pass numbers as well. He's basically unplayable, especially with Ribery, more creative but a slightly lesser scorer, on the other side. Also note, Sanchez is very, very good. He doesn't have the dribbling numbers that Robben does, and his conversion is probably boosted by the Barcelona system, but he is excellent and has been since his Udinese days.
Managerial Changes and the Perception of Form

Fourteen managers have been sacked during the last and current season of the Premier League. Almost every time we're left wondering if they deserved it based on their team's performance and if their successor did, or will do, significantly better.
After sacking Chris Hughton, Norwich's David McNally was quoted saying: "We are sad to see Chris go, but our form generally, and away from home, has been poor and this is a results business". A simple, honest statement at first glance, but it raises a few questions:
- Is he implying that 'form' and 'results' are the same thing?
- If he isn't, was Hughton let go due to poor form, poor results, or both?
- Isn't it his job as a chief executive to decide whether it's a 'results business' or not? Doesn't he know that results can be misleading, or does he merely use results to justify a decision based on something else?
Now I'm not the ultimate judge of a manager's performance and I don't intend to be. Form, either in terms of results or in terms of the underlying performance, is in the eye of the beholder. It's a matter of perception. This perception of form is what I'm interested in. Here are three important points about how we perceive form:
- There is a temporal dimension. One match occurs after the other, which automatically causes us to perceive a trend - even if there is none (i.e. the trend may not have any predictive value beyond the long term average).
- It's about relative performance/results. A loss may not be judged as harshly if it happens away against a good team, but do we correct for the strength of the opposition enough in our perception?
- And of course there's the difference between results and the underlying performance (good or bad luck), as far as we can measure it.
I while ago I experimented with something I called 'form charts' (article in Dutch). The idea is that they are a graphical representation of a team's attacking and defensive performance relative to the difficulty of the match, over time. In this article I present a slightly improved version.
How it works
Team A plays a match against Team B and Team A gets an attacking 'score' by comparing their offensive output* (adjusted for home advantage) with the offensive output of all other teams in the league against that same opponent (Team B). We know Team B's average amount of offensive output conceded, as well as the standard deviation. The number of standard deviations above or below the mean is Team A's attacking score.
Along the same lines we can calculate a defensive score by comparing the offensive output conceded by Team A with the average offensive output produced by Team B and it's standard deviation.
*The offensive 'output' can be defined as goals, shots, expected goals or anything like that. For example:
- Norwich scored 2 goals at home against Everton.
- A correction for home advantage means this really only counts as 1.74 goals.
- Everton concede an average of 0.98 goals, with variation of 0.62
- Norwich's attacking score is (1.74-0.98)/√(0.62) = 0.97, almost 1 standard deviation above average
For their defensive score we calculate:
- Goals conceded corrected for home advantage: 2.3
- Average goals scored by Everton: 1.63
- Variation of goals scored by Everton: 0.37
- (1.63 - 2.3)/√(0.37) = -1.1
We can simply add the offensive and defensive score to get an aggregate score of -0.13. This is what I view as the 'perceived result'.
If we do the same thing but with ExpG instead of goals we get a metric of 'perceived performance' instead.
This graph shows the (goal-based) attacking and defensive results over the course of Norwich's season (catchy title huh?).
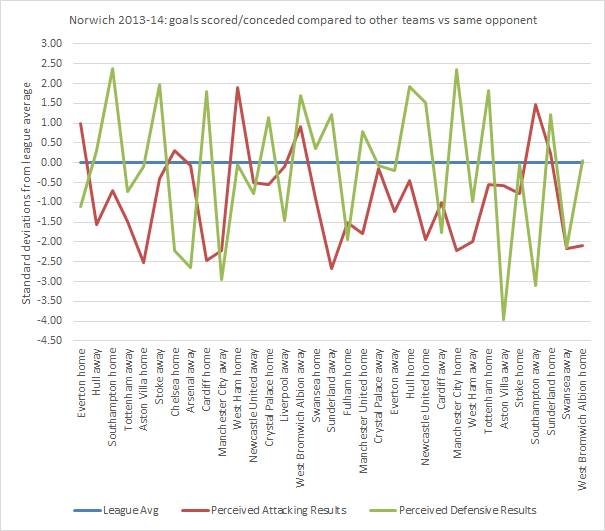
As you can see the values are all over the place. It quickly becomes clear that looking at individual matches isn't very useful and that it only works as a moving average of, say, five matches. This makes sense because a team is not usually judged on the basis of one match. If we're talking about form, we are indeed talking about the perception of a handful of consecutive matches. Exactly what this graph shows:
Norwich was in a bit of a slump when Hughton was fired, especially defensively. That's the temporal dimension I was talking about right there. How about the other two points then?
- To see the difference between perceived results and perceived performance we can simply use the difference between goals and expected goals.
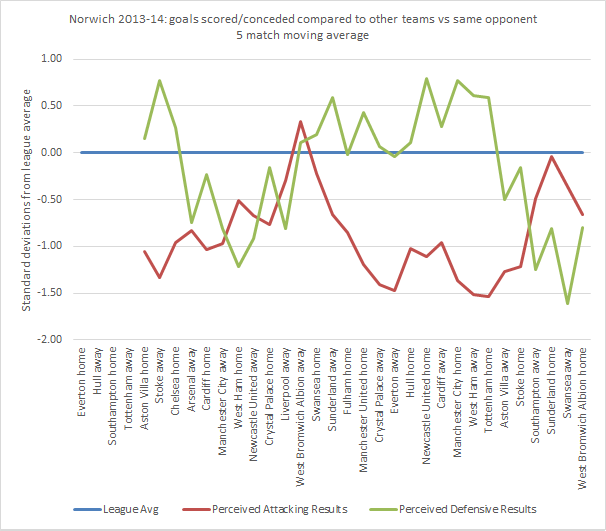
- To see the influence of the difficulty of the schedule we can calculate the form graph but remove the correction for home advantage and instead of comparing to the average and standard deviation of a specific opponent, we compare with the league average and the average standard deviation. This way we can illustrate all three points with one graph, because all three metrics fit on the same scale (using the aggregate of attack and defence):
Note that most of the time results with or without correction for difficulty don't deviate that much because difficulty tends to even out over five matches. Some particularly hard or easy stretches can be seen though. The 7-0 away at City and the 5-1 in Liverpool stand out. This graph also indicates that there was more of a downward trend in performance than there was in results, so that might have been the real reason for McNally.
Here's Fulham as another example. The end of Jol's reign shouldn't have been a surprise to anyone, but sacking Meulensteen seemed like a strange decision. Magath certainly hasn't done any better so far.
Before I shower you with more graphs, let's move on to some conclusions after looking at all 14 sackings. I have tried to measure to what extend the three problems with perception of form were present at the time of sacking in each case.
- "Bad luck" - Results score in last 5 minus performance score in last 5 (to what extend were results worse than the performance would suggest)
- "Temporary slump" - Performance in last 5 minus performance in last 20 matches.
- "Underestimation" - Results not adjusted for difficulty in the last 5 minus adjusted results in last 5 (to what extend did the difficulty of the schedule make the situation look worse)
The lower the number, the worse it makes the manager look:
| Club | Manager | Bad luck | Temporary slump | Underestimation |
| Cardiff | Mackay | -0.54 | 0.04 | -0.25 |
| Chelsea | Di Matteo | 0.38 | 0.10 | -1.21 |
| Fulham | Jol | -0.94 | -0.51 | -0.47 |
| Fulham | Meulensteen | -0.48 | -0.58 | -0.81 |
| Manchester City | Mancini | -1.09 | -0.25 | 0.94 |
| Norwich | Hughton | -0.30 | -0.38 | 0.31 |
| QPR | Hughes | -0.36 | -0.49 | 0.48 |
| Reading | McDermott | 0.22 | -1.25 | 0.52 |
| Southampton | Adkins | 0.85 | 0.57 | -0.94 |
| Sunderland | O'Neill | -0.61 | -0.48 | 0.51 |
| Sunderland | Di Canio | -1.61 | 0.64 | 0.06 |
| Swansea | Laudrup | 0.63 | 0.02 | 0.25 |
| Tottenham | Villas-Boas | -1.34 | -0.97 | -1.07 |
| West Brom | Clarke | -2.13 | 0.36 | 0.24 |
| Average | -0.52 | -0.23 | -0.10 |
The "bad luck"-effect is the strongest. In 10 out of 14 cases it was present, and on average it makes these managers look half a standard deviation worse than they really are. The "temporary slump"-effect is also at play, but it's less obvious. Based on this data I couldn't say for certain that underestimation is much of a problem.
In the introduction I left open the question whether a trend in performance has predictive value beyond the long term average. In other words: is a temporary slump really temporary? Based on the last two seasons of the Premier League, I can say with some certainty that looking at the last 5 matches to predict the performance in the next match is no better than looking at the last 20 matches. The difference between the performance score in the last 5 matches and the next match is on average 1.24 and the difference between the last 20 and the next is on average 1.17.
Graphs, graphs, graphs
Poor André Villas-Boas...
A change of manager didn't have much effect on performance in Cardiff.
Sunderland never looked good during the last few seasons, but Di Canio was particularly bad (click for big):

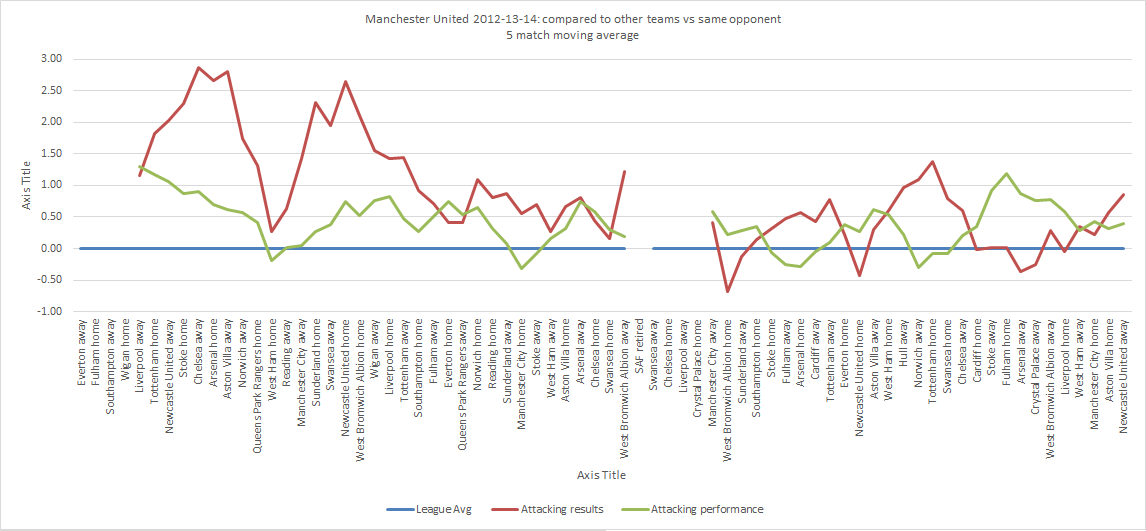
This one shows only the attacking score of Manchester United. The difference in results between this season and the last are very clear. The difference in performance not so much.
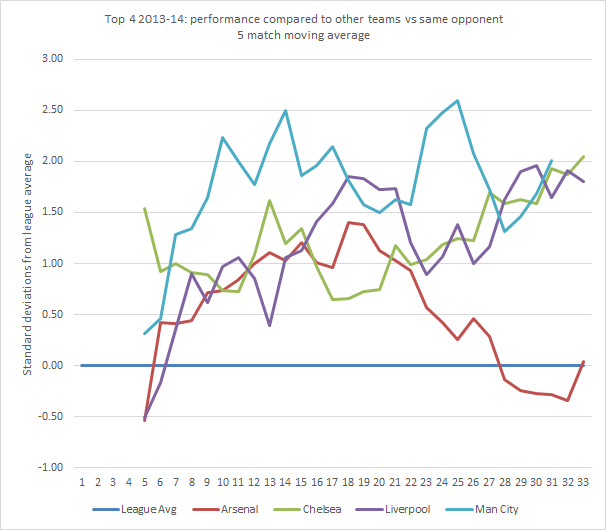
As a bonus, here's the current top 4. Or should I say top 3...
Final note: I didn't read Ben's take on Sacked Managers, Luck & Underlying Numbers before writing this. His approach is somewhat different, but it's definitely a recommended read.
Why Sturridge may be more important to Liverpool than Suarez and Arsenal's problems
On the face of it, asking if Daniel Sturridge is more important to Liverpool football club than Luis Suarez appears a pretty silly question.
How could any other Liverpool player be deemed more important than the brilliant Uruguayan who has bagged 29 goals, 11 assists and looks destined to be crowned as the best player in the Premier League this season?
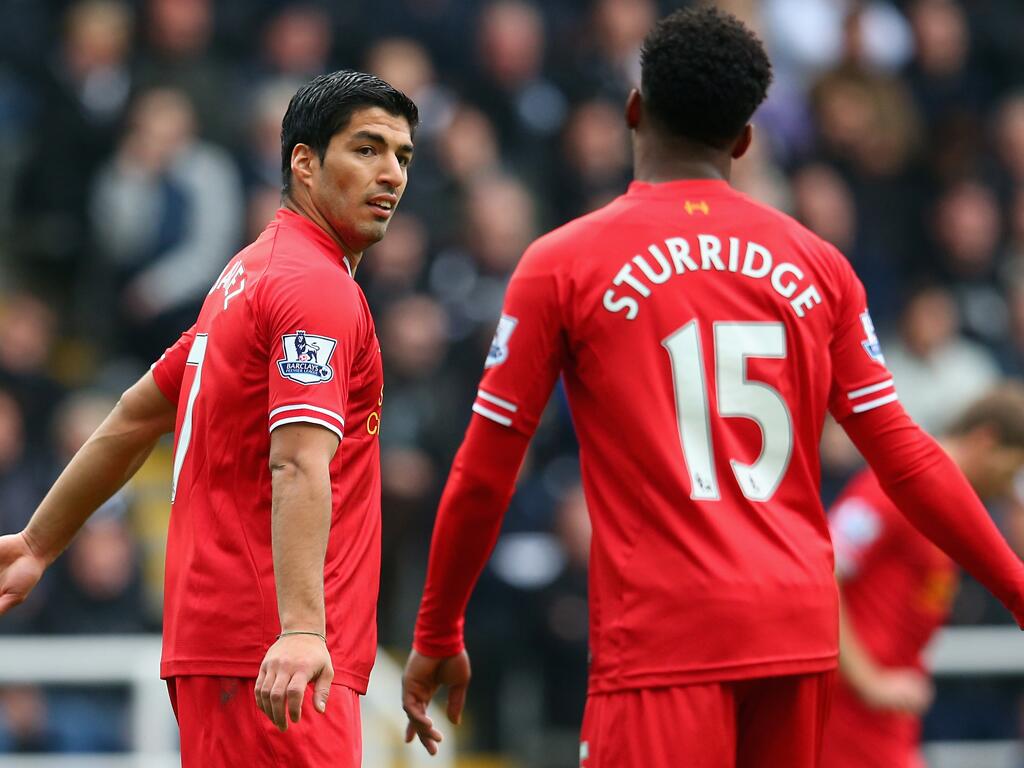
Everyone knows that Sturridge has been an integral part of their excellent relationship, and his 20 Premier League goals and 7 assists is a tremendous return in its own right. These 27 goal involvements from his 2,127 Premier League minutes represent a very healthy figure of 1.14 goals and assists per 90 minutes played. However, this value still falls short of Suarez’s impressive output of 1.35 goals and assists per90.
Aguero
Incidentally, the only player in the Premier League to have a higher combined non-penalty goal and assist figure than the twin Liverpool attackers is Sergio Aguero who has posted 1.43 goals and assists per90. We can envisage the drop off in performance Liverpool would suffer if they were without either Suarez or Sturridge. That is effectively the hand that Man City has been dealt this season as Aguero has only been able to start 15 league games due to his continual injury problems. It is my personal opinion that had Aguero played as many minutes as either half of the SAS combination that the title run in wouldn’t be anywhere near as nail-biting as it currently is. But I digress.
Why Sturridge?
So on what basis can I suggest that Sturridge is more important to Liverpool's chances of winning the Premier League title than Suarez? Very simply, the Englishman has been involved (defined as scoring or assisting) in a higher number of important goals than his pal. Did you know that of Suarez’s 29 league goals this season, only 1 has been scored when Liverpool were behind? The goal in question was his first goal in the victory over Cardiff on 22nd March. According to my calculations this solitary goal is the total return from Suarez playing 358 minutes this season when Liverpool have been trailing in a game.
On the other hand, Sturridge has been instrumental in lifting Liverpool by their bootstraps when required. He has scored 5 goals this season when Liverpool have been behind, and all of those have come from his just 256 losing pitch minutes.
I understand that these examples are from a relatively low number of minutes and concentrate solely on goals, so I have broadened my analysis and looked at a combined attacking output of goals and assists across the different Game States. The viz below shows the combined non-penalty goals and assists per 90 minutes for each of the 3 Game States (losing, tieing and leading) for games played upto and including Sunday 6th April. I have included 34 players which cover all players that have a combined non-penalty goal and assist (NPG&A) total of at least 10 goals this season.
2013-14 EPL NPG&A per90 Per GameState
Flat Track Bully?
Whisper it quietly, but the information in the above image suggests that Suarez may be something of a Flat Track Bully. If Liverpool were to fall behind to Man City this Sunday, recent history would suggest that Daniel Sturridge is much more likely to be the catalyst for bringing Liverpool back into the game than Suarez is. Sturridge's 2.10 NPG&A per90 when Liverpool is losing is remarkable, and puts Suarez’s combined goal contribution of just 0.5 NPG&A from the Game State firmly in the shade.
We know that Suarez has been involved in 40 NPG&As this season, and we can now see that he is excellent at boosting his total output when Liverpool are already leading. His 1.75 NPG&A per90 is, by some margin, the best in the league. I want to be clear that I am not belittling Suarez’s excellent personal tally this season. He has shown sublime skills on countless occasions and he has been a joy to watch but the point of this article is to make people aware that he has produced proportionally more of his output when Liverpool are already in the ascendancy in games.
Perhaps this might be because he is at his best against a high line with the opposing team putting more emphasis on attack. His speed, both of feet and thought, ensures that he is excellent at converting and creating such goal opportunities. When the game is tighter and Liverpool are searching for an equaliser why is it that his NPG&A output is less than virtually all the other top strikers in the Premier League? It is possible that it's just the samall sample size at work here but his NPG&A per90 figure is not what you would expect to see from a player that is running away with the Golden Boot trophy.
Arsenal’s problems
One other noticeable pattern in the 2013/14 viz is just how toothless Arsenal are when they have been behind in a game. Giroud, Ramsey and Ozil all have extremely low NPG&A per90 values when Arsenal have been behind. The data would suggest that the current Arsenal team is lacking game changers; someone with the ability to mix things up or to provide a spark when the opposition invariably pack the defence and frustrate the Gunners. At this point it’s worth noting that Theo Walcott has been a huge miss for Arsenal. With only a combined output of 9 NPG&As this season he didn’t make the above table but he has posted a very impressive 1.99 NPG&A per90 from the limited minutes that he has played this season. On this measure, he stands head and shoulders above his Arsenal teammates.
Over the last 2 seasons Arsenal has taken an average of 59 minutes to score a goal when they have been behind. The only one of the other “Big 7” teams that has taken longer on average to score when behind in a game during the last 2 seasons is Spurs at 64 minutes. These numbers compare unfavourably with Man United (38), Man City (40), Chelsea (43), Everton (45) and Liverpool (49).
Once again, I’m conscious of drawing conclusions from a very small dataset but this data does seem to support the notion that Arsenal have to do something different this Summer if they wish to challenge for the title next season. Arsenal need someone that can stand up and be counted – they appear thin on the ground at the Emirates right now.
The supposed redemption of Danny Welbeck
Danny Welbeck’s stats suggested that he has improved as a player this season, however this data shows that a significant portion of his NPG&A output has originated from times when Man United have been in the lead this season. His output at losing and tied Game States still leaves a lot to be desired, and if he were a racehorse perhaps he would earn a Timeform squiggle for being unreliable when the final effort was required.
2012/13 EPL Season
As stated above, I was concerned at the relatively low minutes that some of the players were on the field due to splitting all the data (both goals and assists and minutes played by Game State), so I replicated my analysis for last season – the 2012/13 Premier League. This time I included all players that had contributed at least 13 NPG&As.
The Sturridge / Suarez data for last season is revealing as it is a pretty close replica of the current season, and reinforces the suggestion that Suarez’s output when Liverpool needs a goal falls short of Daniel Sturridge’s.
I wonder will people begin to speak of the possibility that Suarez, for all his brilliance, has his output significantly improved by the fact that he is most effective when his team are in the lead and that if Liverpool need a goal that Daniel Sturridge appears to be more likely to be involved.
Man United
As noted by many commentators, including in a recent post by Omar Chauduri, Man United excelled last season at recovering quickly from falling behind in games. During the 2012/13 United took an average of just 23 minutes to score a goal when trailing and the above viz captures this phenomenon with the very high NPG&A per90 values posted by Rooney and van Persie when Man United were behind (red bars).
The above analysis is only a snapshot of what can be attempted when we look at actions by players across a range of GameStates. As is the case with virtually all the analysis that is currently being carried out in football we have to work with relatively small datasets but I would hope that with another few seasons under our belt we will be able to draw some conclusions around the repeatability (or lack of) of players' actions across the different GameStates. It does seem intuitive that some players will have a greater sense of responsibility than others or the mental fortitude that sees them willing to take the initiative when others would shrink into the backkground. This type of analysis should assist us in arriving at such judgements in the near future.
April Mailbag – Profiling Pastore, Scouting Lukaku Replacements, and Should Spurs Tank?

It’s monthly mailbag time! I now get enough good questions each time I throw out a request, that this column has gone monthly, and I still can’t get to all the good questions (and this time I had to break the whole thing into two parts). So you guys keep up the good work and I'll try not to sound stupid while answering the questions you peppered me with.  Javier Pastore was one of the hottest prospects in Europe in the summer of 2011. He’d just come off a season at Palermo where he posted 11 goals and 5 assists and helping lead the club to the Europa League. PSG stumped up nearly 40 million Euros to bring him to Paris, but since that time, reviews on his performances have been mixed. I have to admit, I’ve never looked at Pastore’s stats in detail. For me, he’s sort of connected to Alexis Sanchez as young players who lit up Serie A, and then moved to big clubs for big fees. I looked at Alexis’ stats briefly about six weeks ago, and he’s incredible. Pastore is… well, you’ll see. So this is Pastore in his last year at Palermo.
 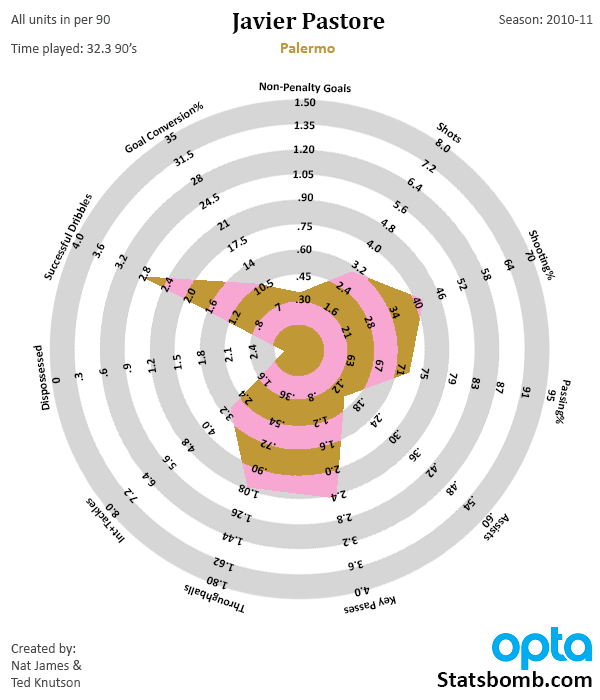 These numbers are very good for a second striker or attacking mid, and those key pass and throughball stats are actually elite. And here’s the five-year comparison of his time at Palermo and PSG.
 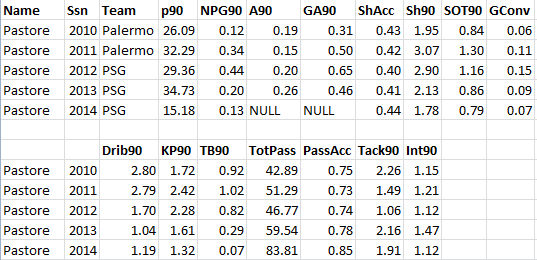 So to answer the first question of was Pastore good in Palermo, the answer is: absolutely. He was 20 and 21 years old when he produced those stats, which is exceptional. The complication comes when you look at what position he played. According to @11Tegen11, At Palermo they were running a 4-3-2-1 and Pastore was one of the 2 behind the striker. To me, this feels a bit like a David Silva type floating position, where he can go wide when play warrants, and has a ton of freedom to be involved in the attack. Here's his heatmap from that season (courtesy of Albert Lacarda of Tru Media and ESPN Stats and Info), which shows that he was indeed all over the place.
  That said, a straight two behind a forward is a fairly unusual tactical setup in the modern age, and it’s likely not where he has played at PSG. Has Pastore been good at PSG? Well, he was certainly good his first season when he posted a G+A90 (Goals + Assists per 90) of .65 and he wasn’t a primary scoring option. Dribbles fell by about 1 per game, but the key pass numbers stayed high, as did the throughballs (also known as the type of passes most likely to lead to a goal). The next season is more up in the air, as the scoring contribution was only .46, but he was doing a ton of work defensively, posting the highest I+T90 numbers of his career. This year? WhoScored lists him mostly as playing a central midfielder, so the reason why his numbers look nothing like they did before is because… he’s playing a totally different position. I've mentioned it before, but it bears repeating. If you buy a player based on stats and performance at one position, and then change the position they play, you can't expect to see the same production. The important question now is: Can Pastore still be great? On the plus side, he’s pretty young. Pastore turns 25 this summer and is just coming into his prime. If a team wanted to take him and play him as an inside-out attacking midfielder or a full number 10, I think they could get a ton of value, provided they paid a reasonable price. He’s obviously very talented, can dribble, has great technique, and is an elite attacking passer when put in the right position. Obviously you don’t want to pay 40M for him like PSG did, but his contract is up in 2016, and PSG might be willing to let someone take his wages off their hands for half that amount. I would be very happy if he was on the left side of the Arsenal attack, and he and Mesut Ozil were running regular overlaps. Put Walcott and a forward with actual speed on the other side of the Arsenal attack, and you’d have a team capable of scoring with the best of them. You know… unlike this year’s Arsenal which is still TENTH IN THE LEAGUE IN SHOTS PER GAME. Ahem.
  Back at the start of the season, I criticized Everton’s recruiting when basically everyone else in the world was singing their praises. The reason I did so is that the cost for the Lukaku and Barry loans was publically reported as costing the club £10M in fees and wages, which is a fairly ludicrous sum for a club of Everton’s size (only £80M in total turnover) to pay for a one-year rental. Buying kids, coaching them up, moving them on at a sizeable profit, I could understand. Renting a veteran like Barry, 32 years old at the time, for 6.5M, I could not. If they’d gotten Barry for half wages of say 3M plus Lukaku for the same, then I probably would have shrugged and wished them luck. I also hated the signing of Arouna Kone at a rumoured 6M plus wages, but instead of evaluating that particular one, we get to play the “he blew out his ACL card” and go no further. My judgment was that Martinez and co were taking a fairly sizeable gamble that would only pay off if they recouped the revenue by qualifying for the Champions League this season. Paying for Barry cost Everton the chance to sign a few younger talents now that could pay off handsomely in the future. Leveraging future success for current success is normal, especially in football, but I tend to think it is a losing proposition the bulk of the time. Aaaaanyway, Everton are currently in the mix for fourth right now. Granted, they are still underdogs to get there due to the strength of teams they still have to face, but there’s a chance. Has this changed my opinion at all? In a word: no. My opinion was based on process and not on outcome, so the fact that they could reach a positive return on their gamble doesn’t change the fact that - in my opinion – it was a negative EV wager. However, if they do get there, I have also promised to publically congratulate them on their success, and especially on the fact that they recruited Roberto Martinez, who has been even better than everyone expected. That also won’t stop me from thinking this type of thing is a stupid move the next time some club does it, which will assuredly happen again. It’s possible that loaning veterans to fill roles that you can’t recruit for is a reasonable strategy for teams to employ. However, price – and that means the entire cost of the deal, not just the sticker price on a transfer - always matters.
  Another Everton question… I sense a theme. Technically this question is sneaking ahead of the research I usually do in May, but because it’s an easy lookup, we’ll tackle at least a small part of this today. The answer to this one is that replacing Lukaku might be impossible for Everton’s budget. In essence, you’d need to find a young player who is scoring at a rate that would be in the Top 40 in Europe, can maintain that in the Premier League, and who they could buy for no more than say £15M. Tricky business. Not one to be daunted by seemingly impossible tasks, I attacked ye olde database (filled with Opta stats from the big European leagues for the last season), and here are the names I found that could be candidates.
 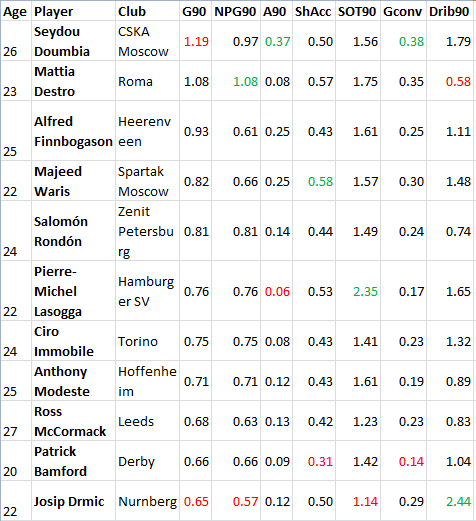 So we have a list of 11 players that are all in useful age ranges. The ones at the outskirts like Doumbia or McCormack are there because they have crazy production. Doumbia’s is boosted by nuts conversion numbers, but he’s got good assist stats to back it up. McCormack is the Championship workhorse that is stuck in the madhouse at Leeds and could be available for a discount. He probably should have been brought to the Premier League a few seasons ago, but that type of transfer rarely seems to happen these days. After that I tried to focus on younger players that could potentially be available. Destro has blown up at Roma and would cost too much now, as would Immobile. Finnbo plays in the Eredivisie, so you’re dealing with “scored well in the Dutch league, but…” translation issues. Buyer beware. Rondon is a young superstar that was
 kidnapped from Malaga and whisked away transferred to Russia a couple of seasons ago, but has carried on scoring well in Russia, which is another league that gets Buyer Beware stamps regarding attacking transfers. In my opinion, none of those are very interesting for our purposes, despite the fact that they pass the stats filter. The other names on the list are definite contenders. Lasogga is on loan at Hamburg and will be coming into the final year of his contract. He’s a battering ram player who is a bit like Lukaku, has the highest shots on target per 90 of the lot, and could come cheap(ish). Modeste is a player I thought should probably have been bought last season by certain PL clubs, but he’s been doing well at Hoffenheim, who appear to have completely eschewed any semblance of defense during their Bundesliga season. If either of these can be had at 7-10M euros, they would probably be worthwhile. However, the really interesting names in that list are Drmic, Waris, and Patrick Bamford. Drmic I wrote about last week as an Arsenal target. He’s supposedly got a relegation clause in his contract that would make him available for anywhere between 2.5M to 8M euros (no one actually knows), and he’s definitely a talent. The same goes for Waris, who is owned by CSKA Moscow, but on loan at Valenciennes right now, and his stats are from Ligue 1. His goalscoring is also fuelled by a high conversion rate, but he’s only 22, and everything else there looks interesting. I’d definitely have scouts take a closer look. Finally, you have what I consider to be the most likely scenario – Patrick Bamford. Why? Because Bamford is tall, athletic, and scoring at a great rate in the Championship despite a mediocre conversion percentage at only 20 years old. That age plus those stats… Bamford could be amazing in 3-4 years time. Like Lukaku, he’s also owned by Chelsea, and one suspects that they would be willing to loan Bamford to Everton’s finishing school for a season on the cheap, which falls in line with Everton’s financial planning. The problem with this scenario is that unlike Lukaku, Bamford is actually an attacking midfielder and not a true forward, (which also helps explain his conversion percentage: wide = harder). However, Everton might need to replace Delofeu if Barce take him back, or they could run Bamford on one side, Delo on another, and Mirallas through the middle as a false nine. And these names are just for the Euro leagues I have data for. There are probably plenty of potential stars out there who are playing in smaller leagues, or who didn’t meet the games played threshold to show up in the search. It’s not impossible to find forwards with the potential to put up good numbers who could also be had at a discount. You just need to know what stats matter in finding them to know where to start your search.  Yes, yes they would. For those Europeans who are not familiar with the concept of tanking, it's defined as intentionally losing games soas to finish lower in the table. American teams do this because they don't have relegation, and the worse your record is, the better the odds that you get a top pick in the collegiate draft. It's done mostly in the NBA, but the NFL has some issues with this as well. Unless you magically get transported to the late knockout stages completely healthy, playing in the Europa League creates an injury production line that can seriously hamper performance in domestic league and cup competitions. This is all while providing very little financial boon, and in some cases, considerable additional travel stress. Thus, I hate the Europa League as it currently exists, and I particularly hate when clubs actually play their good players away from home during the group stages. The only way you can get away with this is if you have a huge squad like Manchester United do, which is something Spurs do not have. Objectively, if I were running Spurs, I would absolutely make certain we did not win enough matches to qualify for another go round in Europe’s second finest league. That said, Spurs are dealing with a lot of weird incentives. First you have really grumpy fans who are irritated at the manager merry-go-round. They also seem irritated by the production of their Gareth Bale replacement crop, and they seem generally irritated by Levy’s bald head. My gut instinct is that the real source of their anger is the fact that they are Spurs fans in the first place, but I don’t have any data on that. Also on the weird incentives list is that fact that Uncle Tim Sherwood would clearly like to manage again some day, despite the fact that his team and tactical selections often look as if his personal motto is #YOMO. To potentially get a ride on the manager-go-round again, he needs to win games, not lose them. 59 points, a goal difference of 0, and miniscule production from their £30M and £28M signings. AVB quits/gets fired, Spurs can’t find a reasonable replacement, and Tim Sherwood takes over for the rest of the year. And they are STILL ahead of Manchester United in the table. This Spurs season is just weird. Speaking of…
  I covered this briefly last week when I tabbed Pochettino as the best possible replacement. The fact of the matter is, there are plenty of fine candidates out there beyond Louis Van Gaal that I think could produce good results. I like Ajax’s Frank de Boer, who has won four straight titles at Ajax and should certainly be ready for new challenges. I like any of the German trio of Weinzierl (at Augsburg), Tuchel (Mainz), or Thomas Schaaf (who used to do great things with Werder Bremen). I even don’t mind the concept of Luciano Spalletti, who has done fairly impressive things with Roma and Zenit in the past, and generally favors a 4-2-3-1, which is probably the system Spurs personnel fit best in. At the end of the day, there are plenty of good options that are slightly less scary than van Gaal in terms of the personality vs. crazy factor, and all of them are better options than Sherwood. If van Gaal bolts for Manchester United or somewhere similarly high profile, it ain’t no thang. Check back tomorrow for part 2, which will include a player break down of Joao Moutinho, some thoughts about the English Championship, and some fullback scouting for teams in the Premier League.
The Most Unpredictable League In The World?
Just How Unpredictable Is The English Premier League?
With just over a month remaining in the 2013/14 season there is still all to play for in the Premier League. The league title, European qualification and the relegation battle all look like going right down to the wire. Many commentators are calling this “the most unpredictable season ever” and we often hear the Premier League referred to as “the most unpredictable league in the World”.
Never being one to take a commentator’s word for something I wanted to discover if this is really the case.
Just how ‘unpredictable’ is the Premier League?
What do we even mean by ‘unpredictable’? Can we measure it?
Furthermore, is there an ideal level of ‘unpredictability’ or ‘competitiveness’ for a league?
How Can We Measure Unpredictability?
Fortunately there are companies for whom it is their job to accurately predict sporting events – bookmakers. The Football Data website records match statistics and pre-match bookmaker odds for thousands of football matches across Europe every season.
How Accurate Are Bookmaker Predictions?
The website Kaggle runs competitions for predictive modelling of many scenarios including sporting events. Recently they ran a competition to predict the outcomes of US College Basketball matches during March Madness. Kaggle evaluated entries using the Binomial Deviance method and I will use the same scoring system here. Hopefully this isn't as complicated as it sounds. 'Binomial' just describes the way matches are evaluated on a scale from 0 to 1 (1 for a home win, 0 for an away win) and 'deviance' just means we will measure by how much our predicted outcome deviates from the actual match outcome.
The difference between the forecast outcome and the actual outcome is measured in terms of the log-loss between the two. The smaller the log-loss the more accurate the predictions are considered to be. The idea here is that a very confident prediction that is incorrect is ‘punished’ more than a less confident pick would be. This is perhaps best shown with an example:
Example: Liverpool vs Tottenham Hotspur (30th March 2014)
Liverpool were strongly favoured to win this match. The average bookmaker odds were:
Home Win - 1.45 Draw - 4.65 Away Win - 6.76
Bookmakers odds represent the percentage chance each game is expected to end in a home win, draw or away win so can be easily converted to the 0 to 1 scale (a drawn match is scored as 0.50). The expected 'score' for this match from the bookmakers odds is therefore:
Expected 'match score': 0.757 [Please see comments section below for a full explanation of this calculation]
Liverpool did win as expected (actual 'match score' of 1.000) so the resultant log-loss was small: 0.278
If the match had been drawn ('match score' 0.500) the log-loss would have been larger: 0.847
If Spurs had pulled off a shock win ('match score' 0.000) the log-loss would have been very large: 1.416
How (In)Accurate Are Bookmaker Forecasts?
Now we have a method for evaluating predictions we can produce the following chart:
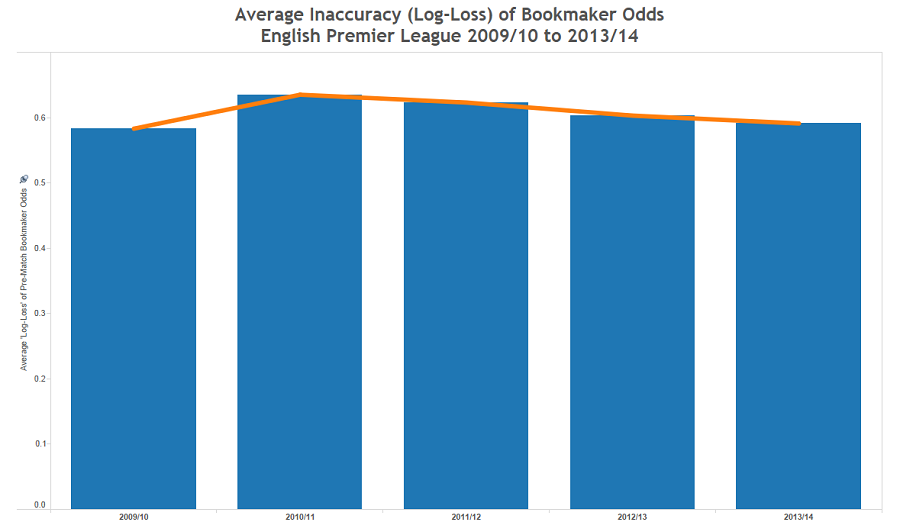
[All data correct up to and including 1st April 2014]
This chart shows the average per match log-loss of pre-match bookmaker odds for the last 5 seasons of the EPL (remember the smaller the number the more accurate the predictions). It actually seems that the ‘predictability’ of the Premier League has remained pretty consistent of this period.
If anything, this season has actually been the 2nd ‘easiest’ to predict in the last five years.
Further details are below:
2013/14 = 0.591 per match Biggest Upset: Man Utd 1-2 West Brom (1.724 log-loss)
2012/13 = 0.603 per match Biggest Upset: Chelsea 0-1 QPR (1.945)
2011/12 = 0.623 per match Biggest Upset: Man Utd 2-3 Blackburn (2.290)
2010/11 = 0.635 per match Biggest Upset: Arsenal 2-3 West Brom (1.948)
2009/10 = 0.583 per match Biggest Upset: Tottenham 0-1 Wolves (1.770)
What is Happening Here?
Technically our scoring system is a measure of how 'inaccurate' the bookmaker predictions are. The smallest log-loss scores result from very confident predictions that prove to be correct (i.e heavy favourites that go on to win their matches). Although the 13/14 title race remains unpredictable, in reality there have actually been very few genuine ‘upsets’ this season. The top teams have all been very consistent and have largely beaten the teams they are expected to. The biggest upsets have been Manchester United losing at home to West Brom (log-loss 1.724), Everton losing at home to Sunderland (1.588) and Chelsea losing away at Crystal Palace (1.525).
Towards the end of the recent Liverpool against Sunderland match the Sky Sports co-commentator Alan Smith described Sunderland’s pretty disappointing (and ultimately unsuccessful) second half comeback as something along the lines of “What makes this league so great”.
Is this really the ideal level of unpredictability for a league?
How Does The Premier League Compare To Other Leagues?
This table represents the same measure for the current 13/14 season for every league that is covered by Football Data (again, the smaller the number the more ‘predictable’ the league).
[All data correct up to and including 1st April 2014]
This table suggests that the Premier League is actually one of the more ‘predictable’ leagues around Europe? What might be causing this?
Is it possible that it is actually easier for bookmakers to set odds on some leagues than it is on others? It is certainly possible that there is some truth in this. Several of the leagues with the most accurate odds are also those that are the most covered in the media (EPL, Serie A, La Liga) and have the most information available. In contrast, I don't think there aren’t too many odds compilers who specialise in the Scottish lower leagues. Does this mean we should all start betting on the Bundesliga Two? I won't be rushing to do so just yet. I think any differences here are still very small and that this method should rather be considered as an interesting way to highlight differences in the competitive shape and balance of competitions.
For many of the leagues studied there appears to be an inverse relationship between how predictable the matches are and how competitive the league is. For example the leagues with the lowest average log loss include the SPL and Scottish Division One where Celtic and Rangers have already clinched the respective titles with a month to spare. The most predictable league is the Greek Superleague which has been won by the same team for the last 4 seasons. This method is still the best we have for evaluating competition ‘predictability’.
If we consider this a useful measure of predictability then it is surely also a useful measure of the ‘competitiveness’ of a competition.
Why might the Premier League have a lower score than the Bundesliga? Although Bayern Munich has romped clear in Germany, below them the league has been very competitive. As mentioned, in the Premier League the top 4 teams have all been consistently excellent (the top 5 have only 4 home defeats between them all season). The title races remains open but it is widely accepted that it will probably be decided by the two games Liverpool play against Manchester City and Chelsea.
Does this mean commentators should be more careful what they describe as unpredictable? For the EPL it seems fair to say the title race is unpredictable but in general it is not actually one of the more unpredictable leagues.
Is the Premier League actually not competitive enough?
Is There An Ideal Level Of Predictability For A League?
The question of how competitive we might want the league to be is an important one and has implications for a wide range of decisions, in particular with regard to revenue distribution from the leagues lucrative media contracts. Many of the leagues that we have seen to be the most ‘predictable’ are also those that have very uneven financial structures. In contrast, the major US sports leagues such as the NFL and MLB openly engineer greater competition through the use of salary caps and draft systems.
Yet is it really desirable to have a league where ‘anyone can beat anyone’? Does this mean every team is as good as each other? Or does this just mean every team is as bad as each other?
Before we get too excited and start speculating about revenue redistribution it is important to remember that the best Premier League clubs are also those that represent English football in UEFA competitions such as the Champions League. This is not a consideration for any of the major US sports as they do not have to compete with other leagues overseas. This season only 2 English teams have made the quarter finals and neither are favourites to progress. Interestingly, the favourites to win the Champions League (Bayern Munich, Barcelona, Real Madrid, PSG) are all sides who compete is seemingly lop-sided domestic competitions (see above).
Is there an optimal balance to be sought between the competitiveness of a league competition and the opportunity it affords its best teams to build squads to rival the best in Europe?
Conclusions
I admit my premise was a little facetious – I do not actually think the EPL is too predictable and actually think this has been the most interesting Premier League season for a long time. I am sure plenty of football fans in other leagues are envious of such a close finish in prospect. Also, I noted that only two of our sides are in the quarter finals but Manchester City and Arsenal didn’t exactly disgrace themselves – coming up against the 2 best sides in Europe and some unfortunate refereeing decisions.
Yet I do think there are some important issues to look at in terms of what it actually means to have a competitive league. Should competitiveness be ‘engineered’? What if this is to be at the expense of the performance of our sides in Europe? If this season is representative of the future then I think the current balance between the league and European performance is about right but this doesn’t mean we should be complacent.
And it definitely doesn't mean the Premier League is ‘the most unpredictable league in the world’.