The Future of Football

You know the part in The Big Short where Michael Burry (Christian Bale) is sitting there at his desk, explaining to an irate investor that the housing market is guaranteed to crash, it’s just that no one knows it yet? And the fact that it has never crashed in modern times has nothing to do with his certainty that this future crash is now inevitable?

I feel that way about stats and data in football.

I believe with utter certainty that stats and data will play a huge role in the future of the sport. This is despite knowing that my certitude makes me sound like a bit of a loon to parties that approach this subject with some skepticism.

Today I’m going to explain why I carry this certainty about the future, but it requires the audience to shed one big misconception most people seem to carry about the game.

Football is not unique and unrelated to other sports.

Football actually bears reasonable similarities to basketball and both forms of hockey, such that certain ways of analyzing those sports are easily adaptable to football. And this goes beyond stats – German coaches have long consulted with elite field hockey coaches about defensive tactics, and Pep Guardiola includes legendary water polo player Manuel Estiarte in his coaching staff. Even now, researchers like Luke Bornn are taking what they learned applying spatial statistics to SportVU data in the NBA and seeing what they can learn from football's tracking data.

Yes, football has its own idiosyncrasies and you need to understand the game at a high level to get the most out of your analysis. No one intelligent disputes that. But the fact that we've seen massive revolutions in how other sports are analysed that have lead to changes in how the sports are also played means we should expect a revolution to hit football in the future as well.

Chasing Perfection

I have been reading Andy Glockner’s book recently, which catalogs and explains the NBA’s analytics evolution, and it continually amazes me how much it parallels a movement still in its infancy in football.

There is way more money involved in [the league] today than even ten years ago, and teams have to work harder and harder to find and maintain competitive edges. How they are doing so varies wildly from team to team, and heavily involves state-of-the-art technology to try to move ever closer to solving an impossibly complex and nuanced sport.

Is that quote about basketball or football? The NBA or the English Premier League? It could be either, right? Except in the Premier League there are bushels full of competitive edges sitting in easy reach of anyone who knows where to look.

Another thing I believe for certain is they won’t stay that way for long. Spending money now to obtain the low hanging fruit and discover new ones also gives a team a head start in what will assuredly be a brain race at some point down the road, and more importantly, will likely yield huge dividends in terms of points, money, and potential titles now.

That’s the thing that I think the analytics movement in football may have gotten wrong through absolutely no fault of anyone involved. The stats guys developing new ideas and doing the work often think of it as, “how do we apply stats to football to learn new things?”

That’s technically correct. However, it misses the major point.

The real goal for the analytics movement in any sport should be: how do we discover and deliver new competitive edges?

Stats and data are a very useful tool in doing that, but it’s a big tool box.

Another thing Glockner highlights in an early chapter is this piece by Chris Ballard discussing the new stats movement in the NBA, circa 2005. What amazes me is not that most of the names mentioned are still quite prominent in NBA front offices, but instead how bloody young they are.

Sam Presti is 29. Sam Hinkie is 27. Celtics “Senior Vice President for Operations” Daryl Morey is… 31.

Anyway, Glockner’s book is excellent, especially if you read it with an eye that it may be foretelling the future of a football analytics movement that has yet to start across most of Europe.

Statheads Are The Best Free Agent Bargain in Baseball

FiveThirtyEight is a mixed bag, but their sports stuff is still generally pretty good. This piece, which examines the expansion of “numbers-savvy front-office staffers over time” is excellent.

“Although the analytical gold rush began before the period we examined, hiring has accelerated at an almost exponential rate over the last few years.”

One of the main takeaways from the article is that baseball teams are spending more and more on stats dorks because they provide a dramatically bigger boost to win totals on a per dollar basis than many free agent signings. Part of that is because baseball's player market has become more efficient over the years thanks to improved use of stats, but a bigger part comes down to basic economics.

They estimate a five-man analytics team costs about $350,000 per year, which still lags behind the minimum salary for a single player.

The takeaway: It paid to invest in analytics early. Teams with at least one analyst in 2009 outperformed their expected winning percentage by 44 percentage points over the 2012-14 period, relative to teams who didn’t — an enormous effect, equivalent to more than seven extra wins per season. 

Even the minimum estimate of two extra wins per year would represent a return roughly 30 times as efficient as spending the same amount on the free-agent market.

One more thing that really struck me out of that piece and that I feel is hugely applicable to football.

Although the big-budget Boston Red Sox were also one of the first teams to demonstrate that an analytics department could help win a World Series, a number of low-payroll, small-market teams — including not only the Moneyball A’s, but also the Rays, Indians, Padres and Pirates — were among the first to form quantitative departments and develop systems to house and display statistical data. It made sense: The more pressing a team’s financial imperative to stretch every dollar and wring out every win, the more likely it was to try a new approach.

How can teams compete with the traditional giants beyond just spending more money?

  • Apply the marginal gains.
  • Make consistently better decisions than other teams.
  • Play more efficient football.
  • Recruit better coaches.
  • Recruit better players.
  • Make fewer mistakes in the transfer market.

Find. The. Edges!

Baseball and Basketball are hugely different sports. In fact, they are more different from each other than basketball is from football. And yet in both of these areas we have seen teams dramatically ramp up spending to get smarter faster than the competition.

Why? Because it helps them win more.

This WILL happen in football.

The only questions are how long it takes before it happens in scale across not just England, but European football as a whole, and which teams will lead the charge and reap the rewards as early adopters.

--TK
mixedknuts@gmail.com

StatsBomb Podcast: April 2016

The end is almost nigh, and it's time to celebrate the wonder of Leicester! It's another edition of the StatsBomb podcast featuring James Yorke (@jair1970) and Benjamin Pugsley (@benjaminpugsley). [soundcloud url="https://api.soundcloud.com/tracks/261188279" params="color=ff5500&auto_play=false&hide_related=false&show_comments=true&show_user=true&show_reposts=false" width="100%" height="166" iframe="true" /] Downloadable on the soundcloud link and also available on iTunes, subscribe HERE And if you enjoy, we'd love it if you shared it. Thanks!

Improving Soccer's Version Of The Bill James Pythagorean

The soccer Pythagorean probably never had enough life in the first place for it to be considered dead but its torpid state was given a little rattle last week when Soccermetrics put up a post evaluating EPL teams by their Pythagorean points expectations to date.

For those not familiar, the Pythagorean Win Expectation was developed by Bill James while working as a night watchman at a bean cannery. That's not a joke. James himself is more or less the reason Liverpool fans have the term 'Moneyball' to misuse. Anyway, he found that a baseball team's win percentage was equal to:

pythag

The exponent has since been adjusted to 1.8 but the formula tracks remarkably well with actual results. Similar formulas have since been developed for basketball and football (to avoid confusion, I'll stick with the American convention where 'football' is 'soccer' and 'football' is 'football').

How is it useful?

If you're a baseball GM at the All-Star Break (roughly midway through the season) and you're wondering wether to start moving players and dumping salaries, or if you should instead go add another bat to make a run at the playoffs, simply calculating your team's Pythagorean win probability is a strong indicator of how much the team can expect to win (or lose) before even making any personnel decisions.

There is room for legitimate debate on its usefulness in soccer with it's 38 game schedule—MLB has 162 games, the NBA has 82—but even in the NFL where there are only 16 games, it is still useful predicting year-on-year performances.

As Football Outsiders noted: "[NFL] teams that win a minimum of one full game more than their Pythagorean projection tend to regress the following year; teams that win a minimum of one full game less than their Pythagoerean projection tend to improve the following year."

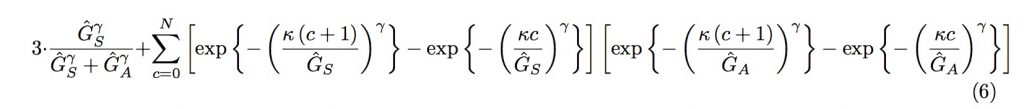
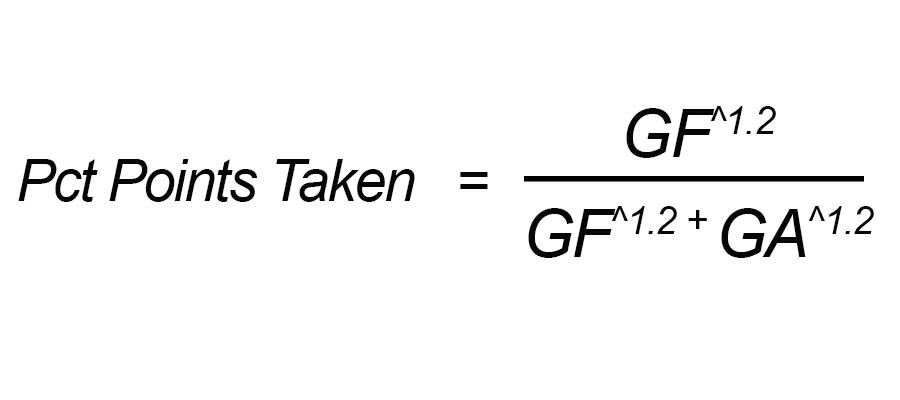
So even for smaller game-per-seasons sports where you might not get reliable and meaningful results until the season is over, it can still be a useful tool in evaluating something like, "Should we fire Roberto Martinez?" But soccer's attempts to fit win expectation into a similar formula to have been a little less tidy. There are examples here, here and here, the latter being the Soccermetric version, derived by Howard Hamilton. The formula itself is below.

It's not anything a casual fan would use.

hamilton

In one of his posts Hamilton goes so far as to claim that a more conventional Pythagorean for soccer simply isn't possible. Even some attempts that are decidedly simpler generally abandon the thing that probably gave James the impetus to name it the 'Pythagorean' in the first place—that every term had the same exponent (2 in his formulation).

That's not just a nice aesthetic characteristic.

There's a bit in that formulation which conforms to basic intuition about sports. Specifically, that if a team scores as many points as it gives up over the course of the season, it will likely end up winning as many games as it loses. For now just think about a binary win-loss game, like basketball or baseball.

There's no tying in baseball. That .500 winning percentage is built into James' formula. If Runs Scored (RS) is equal to Runs Allowed (RA), and we have a uniform exponent, then without even plugging any numbers in you can see that it's x/2x, which is .500. Even among the "simpler" models linked above, best-fitting soccer Pythagoreans end up having three unique exponents. That looks something like this ('goalsaway' should almost certainly be 'goalsagainst'):

eastwood

That's Martin Eastwood's formula. Let me be clear: I have used this formula in the past and it generally gives totally acceptable results. But think about a weird situation where a team scores, oh, exactly 19 goals and gives up exactly 19 goals. They win half of their games—freakishly having 19 1-0 and 0-1 results—to collect the maximum number of points possible, 57.

By the Eastwood Pythagorean, Team 19-19 projects to pick up 69.0 points. Sure, that's an outlier of a season in a couple of ways but something something Leicester. Point is, that's a non-trivial 12-point miss on what we'd think should be the most easily predictable outcome (on average). That and there is no chance of remembering 1.22777, 1.072388 and 1.27248 if you're working on the back of a napkin.

So we want a Pythagorean that's easy to use, easy to remember and we would like for it to fit a the basic intuition about scoring and results. Oh, and we want it to accurately measure the thing we're trying to measure: which teams over- or underperformed. Really we just want something that looks like the original. Baseball has one, basketball has one, even other football has one. Why can't soccer? It can. Mostly.

There are two tricks we first have to use. The first isn't really a trick. It's more of the obvious response to the fact that there are draws in soccer. And because of that, winning percentages are much lower in soccer than baseball or basketball. So instead, we set up to predict the percentage of points taken from the max available. Again, this is a pretty self-evident and not-at-all-original workaround. The other attempted James-like soccer Pythagoreans I came across also did this.

The second trick is a little less obvious.

We have to pretend time stopped somewhere around 1994. While England was an early adopter of awarding 3 points for a win in the early 80s, it wasn't until its usage in the 1994 World Cup that the rest of the world finally decided to play along. By 1995 it was pretty much the standard everywhere.

Prior to that though, teams received two points for a win and one for a draw. If we reconfigure the league tables to look like something from the 80s we can build a single exponent Pythagorean that quickly satisfies our third condition (fitting intuition).

Now if a team scores as many goals as it gives up, it'll probably pick up half of the total points available. (2*W + 1*D)/2* Number of Matches = Percentage of Points Taken = GF^c/GF^c + GA^c It's the Jamesian Pythagorean, even if we don't yet have an exponent (or even know if we can get one; spoiler: we can). If GF = GA, again we end up with x/2x and our equation predicts we'll pick up half the total points available. Under the old 2-points method, there were 76 max points available. Say you scored 50 and gave up 50.

Maybe something bizarre happens and you drew all 38; or you won 10, lost 10 and drew 18; or won 15, lost 15 and draw 8. As long as you win and lose the number of games (you necessarily have to draw the rest), you'll pick up 38 points. Half the max total. As for the other requirements. Yeah, it's pretty simple. Once you do the math you get an exponent of 1.2 (this is very much in line with others' results). So our Soccer Pythagorean is:

myPythag

Again, this assumes that wins are still worth just 2 points. How well does it work? Pretty well. Using the 2010-2011 through 2014-2015 tables from La Liga, Serie A and the EPL (I skipped the Bundesliga so that we had uniform 38-game leagues in the sample), we're off by 2.74 points.

That's root mean squared error, which, if you're not familiar is just what it reads as. So, take the predicted percentage of points (the results of our Pythagorean above), multiply that by the total points available (76).

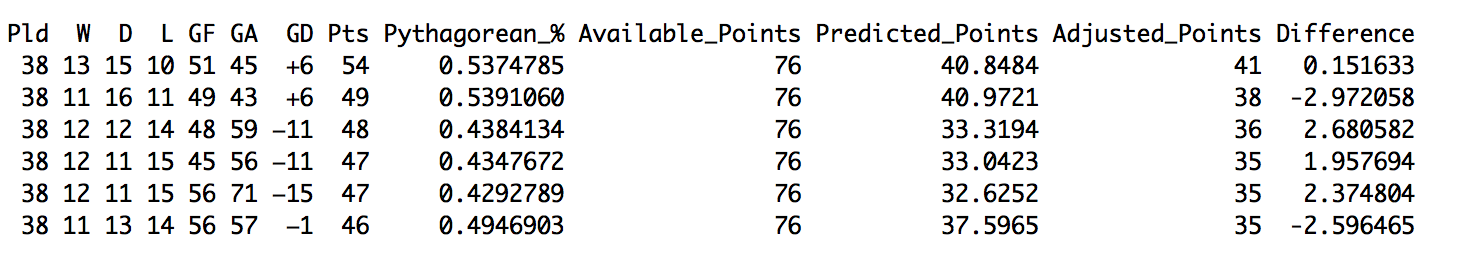
That gives us the predicted total points for a team's season. Now take the difference between the predicted points and the actual points (the ones teams collected in real games). That gives us 300 predictions and measures of how far off we were from those predictions. Here's what that looks like in some raw R output.

sample_error

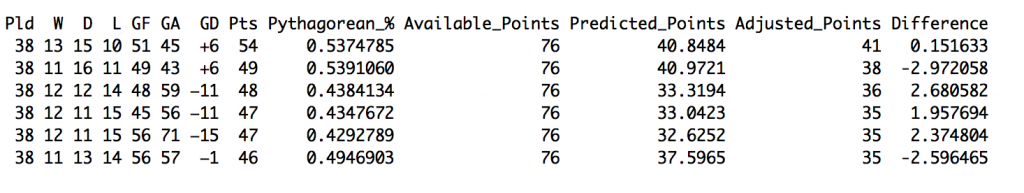
The 'Pythagorean_%' column is what we calculate from the above formula. 'Available_Points' are the old school max available points (2 * 38 = 76). Multiply those together to get our 'Predicted_Points'. 'Adjusted_Points' are what we get when we take actual, real world points and convert them to 2-point wins (or Pts - W). Subtract 'Adjusted_Points' from 'Predicted_Points' and you get the 'Difference', or your errors. For RMSE, work backwards; grab all your errors, square them, take the mean, then take the square root of that mean. That's where the 2.74 comes from. Going back to Hamilton's model he says that the RMSE for his soccer Pythagorean ends up somewhere between 4 and 5 (although for the single season he does on that page he gets 3.81; for the one from last week it's 4.5). Eastwood does 10 seasons, all of the EPL, and gets 4.08.

Another way to look at it is that in our 300 seasons, for 90 of them our prediction is within +/- a single point. So we're doing much better, right? Well, even though the formula 'works' with a 76-point season, time actually moves forward pretty relentlessly and current, actual seasons are 114-point seasons. That leaves us with two problems. First, we're going to have to figure out how to map the 76-point season to the 114-point season.

That almost certainly will increase our errors. Not even almost, it does.

Second we're going to lose some of the elegance that makes pretending time stopped so delightful in ways that has nothing to do with aging. Take the first problem first. Say a team accumulated six points in the 2-point world. They could do that by winning three games, by winning two games and drawing two, or by winning one and drawing four. In the 3-point world those translate to nine, eight and seven points respectively.

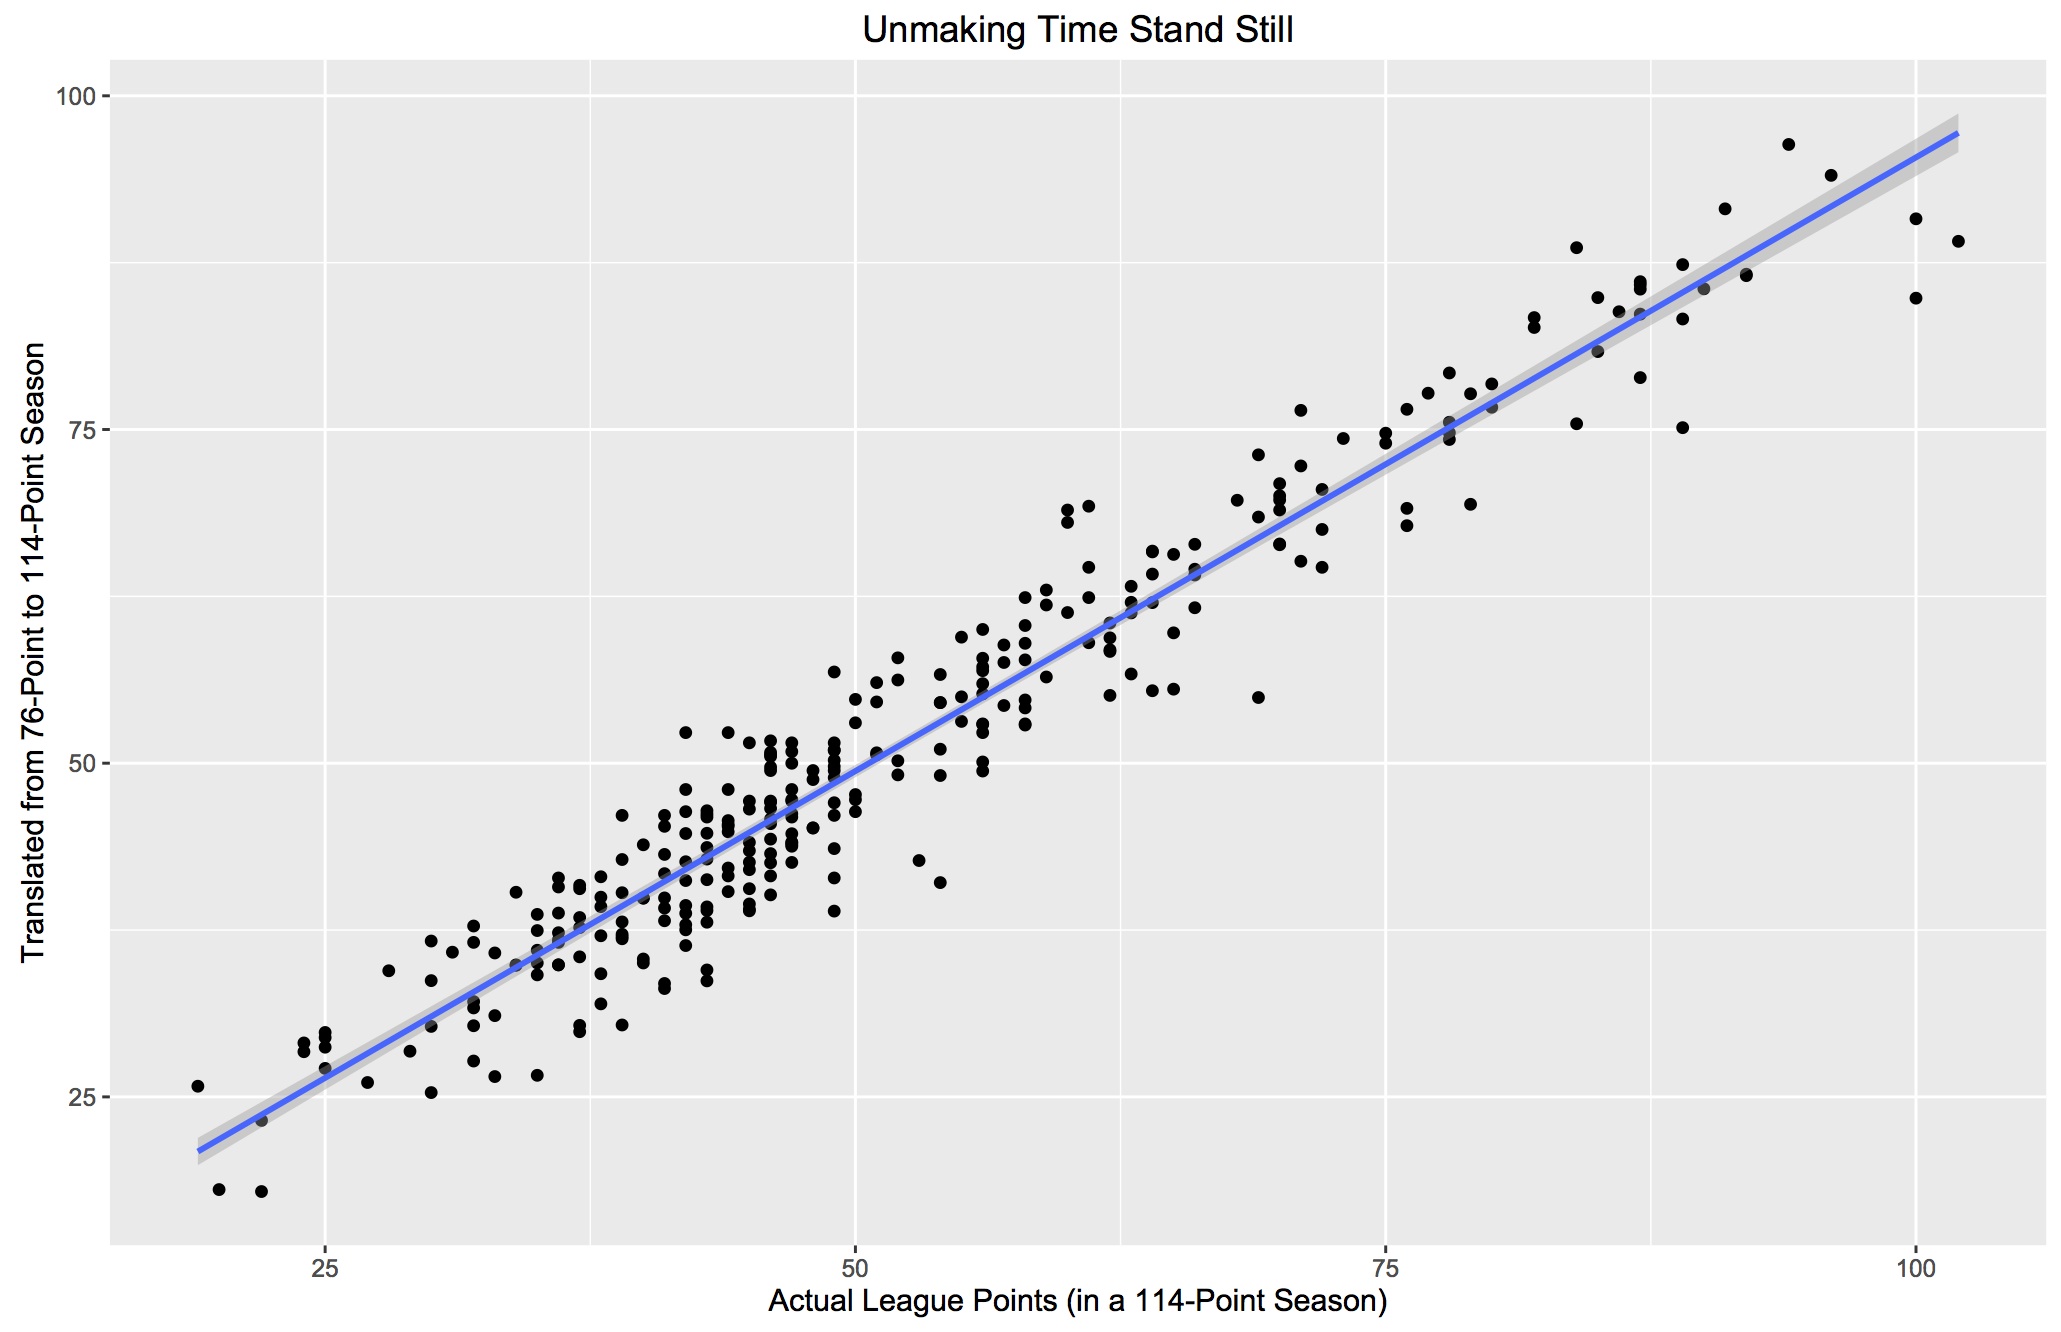
There is no way to perfectly translate from one to the other. But it's close. Just an ordinary least squares regression gives us a good formula for translating from the past to the present.

convert_points

This is what our actual 300 team seasons look like compared to their values converted from 76-point seasons to 114-point seasons (our R-squared here is .992 but because this is derived from our sample, it's not immutable and a larger set might give us something slightly different).

regression

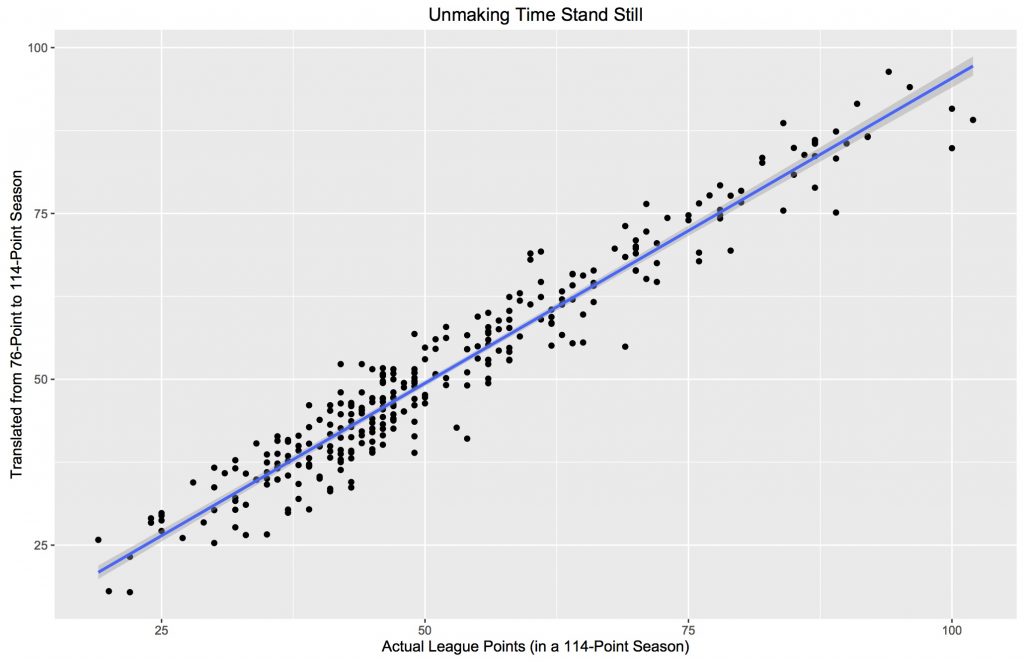
Now after we transform our predictions to conform to the passage of time, we get a RMSE of 4.35, which is not terrible.

It's not great but 61 of all our predictions (just over 20%) are still within +/- one point. We're not entirely done, though. There's a way to take a James-like Pythagorean and convert it to a linear formula. You can read the paper here, but it involves a Taylor series and taking derivatives and some math you probably don't want to deal with.

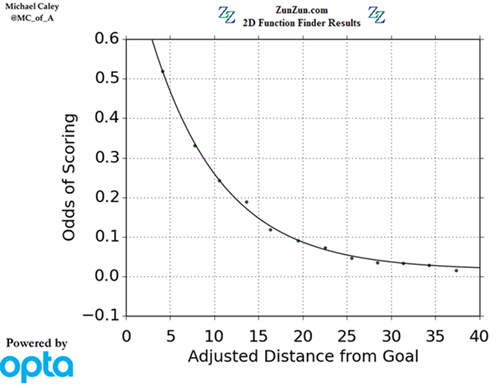
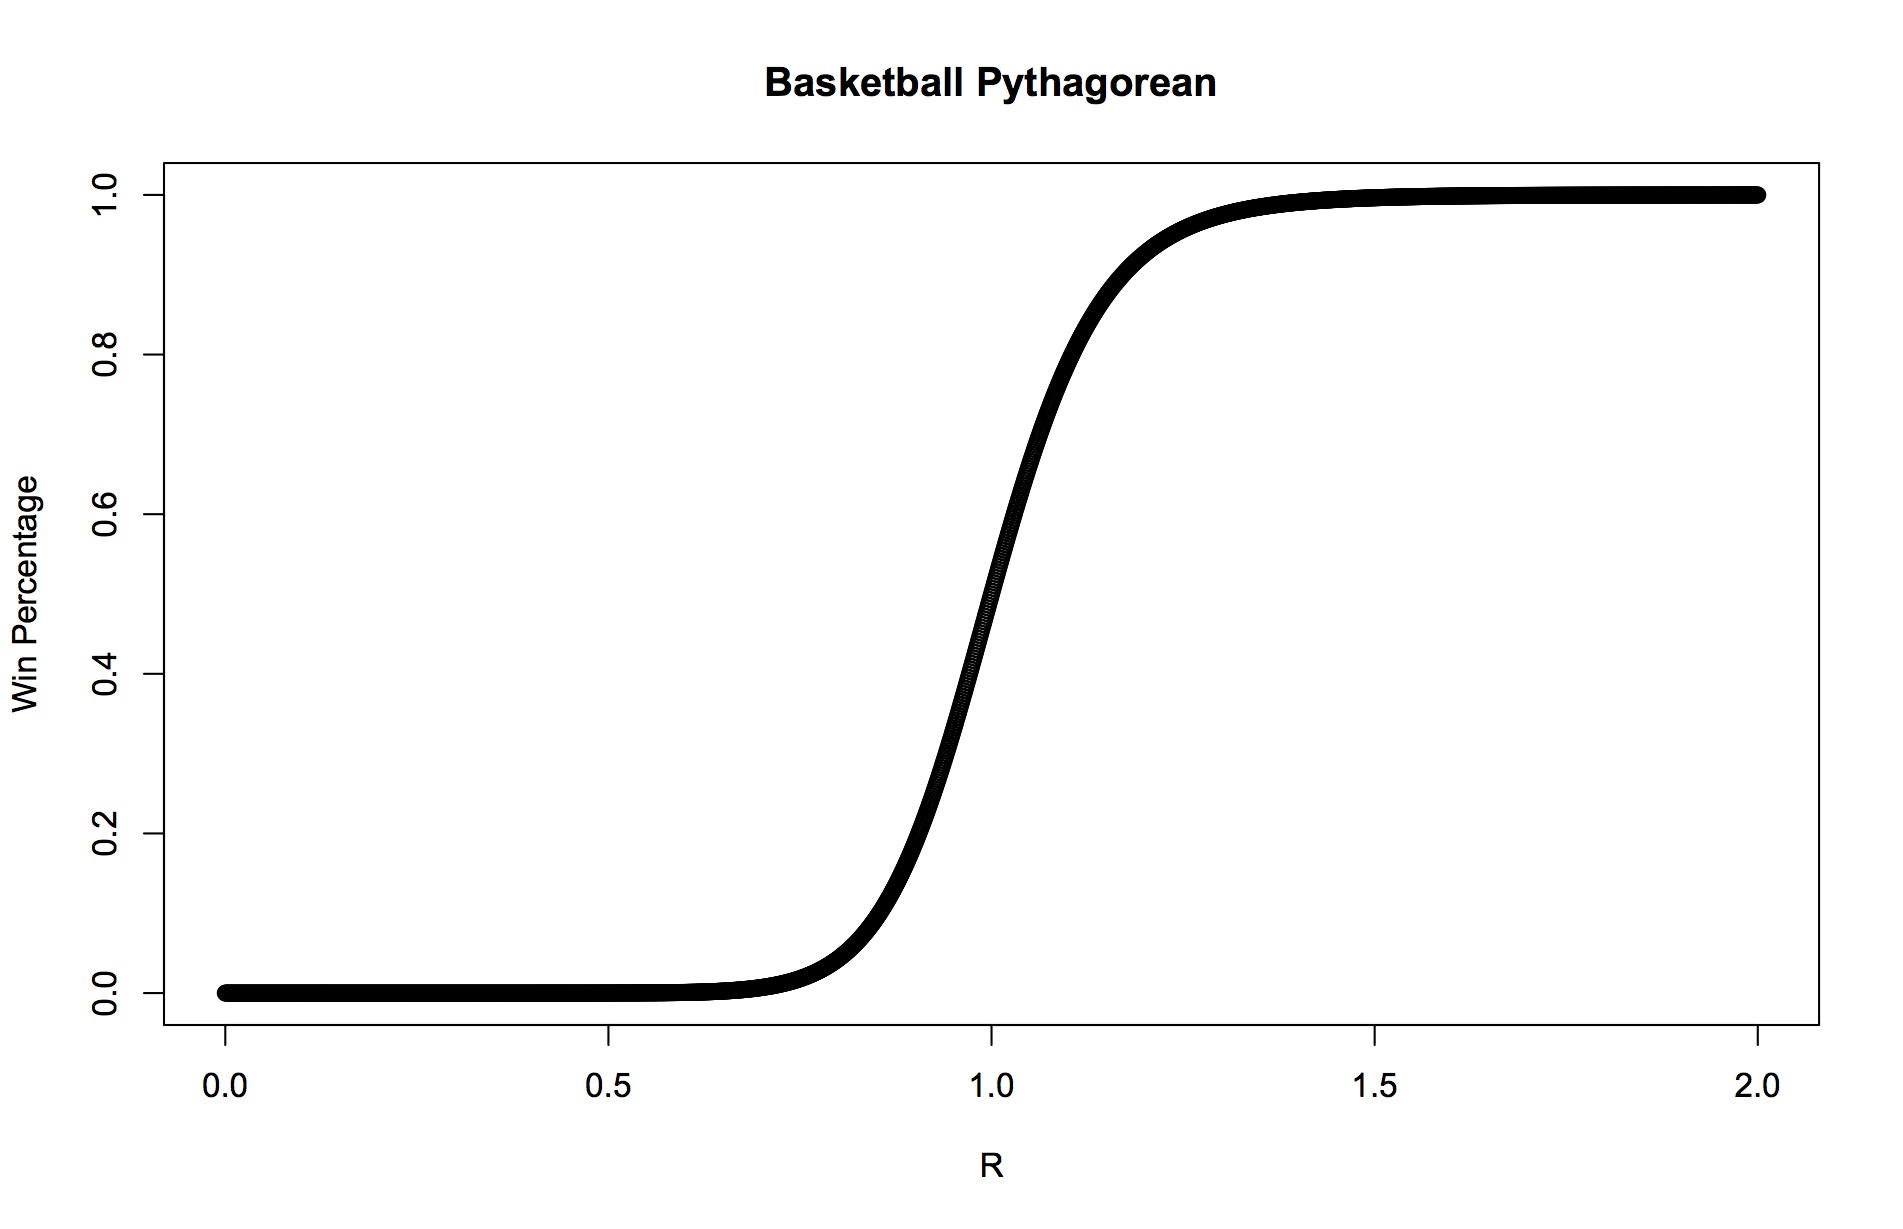
Putting aside all the calculus you've forgotten, there's an easy visual explanation to show why we can approximate something so non-linear with just a straight line. This works better with basketball, where the Pythagorean exponent is 13.9. The plot below is of the win percentage as a ratio of PF and PA.

basketball

The best teams in basketball outscore the mean by about 110% and the worst teams underscore it at 90%. So the ratios are actually narrow around 1. If you notice, the curve is pretty close to a straight line over that range. After you ignore all the math in the paper linked above and just scroll to the bottom you find the linear approximation to the

James Pythagorean is: linear_approx

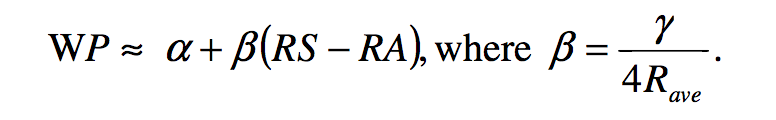
Again, we have to turn our two tricks. We use percentage of total points taken instead of win percentage. And we pretend that wins are still worth two points. Gamma is our Jamesian exponent (1.2), and Rave is our average runs, which makes no sense in soccer. They don't score runs, they score goals. Use the average goals scored in a season across all teams.

We still have to update to 3-point totals, but because we're running one linear formula, then dumping the results into another linear formula, we can just perform a little substitution and combine them to get a single linear formula. Once you do that, voila (GD is our goal difference, if that's not obvious): soccer_approx

Pretty cool, and simple and nice and it's based on a win being 3-points. It does have one huge caveat1. It's kind of meaningless until the season is over. Just look at it. Say you play your first game of the season and win it 1-0. That formula says you'll have about 53 points. You'll actually have three. Hell just from last week to this week in the EPL, the RMSE across all 20 teams dropped from well over 8 (admittedly terrible) to a little over 7 (thanks, Stoke, for not even bothering... twice!). This season is weird, though. Fortunately, just eyeballing the GD, points and remaining schedules, a few of the biggest errors have a decent chance of coming way more in line with their predicted points. Except Everton. The Gods are using Everton for their own amusement.

Overall the fit on completed seasons isn't too bad. Our RMSE is 4.7. Not great. Not terrible, but we're not really doing substantially worse than any of the other options (although our mean absolute error, which doesn't punish you quite so much for the large misses on the ends, is just 3.57). Of our 300 team seasons in the sample, 92 are +/- 1 point; so about 30% of the time our predictions are within a single point of a team's actual points. Also, we are neither over or under-predicting as 152 of our errors, almost exactly half, are above zero. For a 38-game season (less than half the NBA, and not even a quarter of an MLB season) that seems surprisingly decent.

Moreover, it turns out it's almost entirely Spain's fault we're not fitting better (and probably measurably so). Here are our eight worst misses by over-prediction: Barcelona, Barcelona, Real Madrid, Real Madrid, Manchester City, Siena (?), Barcelona, Real Madrid. With a smaller coefficient (13.9 vs. 1.2), the soccer line is approximately linear over a wider range than in our basketball illustration above, but not one wide enough to accommodate scoring 110 goals and giving up just 21 with any precision. Stupid Barca. On the other end, the worst under-predictions are almost entirely one man's fault: Paco Jemez. I love just everything about Jemez and Rayo, except for what his attacking philosophy does to this model.

If you think it's better to lose 9-1 than to stop attacking at 4-0 and minimize the GD damage, you're going to engineer anomalous point totals relative to goal differences. And of the five biggest misses, Rayo is responsible for three of them. Math doesn't like heretics. So the idea that we can't do a simple soccer Pythagorean, I'm going to go ahead and disagree with that one. You can make a decent single-exponent Jamesian Pythagorean for soccer with acceptable results. You do have to cheat and make some bad assumptions about space time, but even after correcting for that, we're in the same neighborhood error-wise as things that are far more complicated.

Moreover, we can reduce our two-step Pythagorean to a single, one-step linear approximation. With nothing more than a team's goal difference, you can do better than a back-of-the-envelope job finding if a team under- or over-performed. That's kinda cool. Admittedly, if you're just typing a single line of code into a stats app, then calling any of the other, more complicated functions is in some sense no more or less arduous than what we've done here.

And if you really want to shave off that extra .5 of RMSE, then knock yourself out. But I've got almost no chance of recalling some of the other formula off the top of my head or being able to derive them in a pinch. But our simplest formula? It's very, very close to: (2/3 * GD) + 52. I can commit that to memory easily. And even if I forget it, as long as I can remember 1.2, I can rebuild it in just a couple of minutes. I'm probably biased (read: definitely), but something I can easily access is slightly more useful, even if it's still not totally elegant. @bertinbertin 1

Okay, maybe the caveat is a little less huge. Danny Page suggests the following, making me feel incredibly stupid for not thinking of it. The tweet is here. But the meat of it is: "Regarding the huge caveat what if you included games played? (0.677(GD)+52.39)*(GP/38)" I hadn't. And doing so, quickly brings results more in line with, well, all the other results. There is also a spreadsheet with his results here.

Doing One Thing Well: Standout Stats for Champions and Europa League Semifinalists

sevilla-europa-league_10y9rvz0c4ikt1q1rw8ig5ziay I can watch a team for weeks without processing much until I know something more specific to look for. I'm not a guy who can watch 15 minutes and determine everything a team is trying and able to do. That's why I nose around in the stats like a old man reaching for his contacts. When I do find one of interest, that often makes watching games clearer and more enjoyable.  Gladbach of recent vintage never made much sense to me until I found out no one in Europe was better at completing passes in the mess around the opposition goal. Then suddenly their entire style of play was easier to pick out and the beauty of Raffael more fully appreciated. Ingolstadt were just another ugly mid-table side until I saw their opposition passing numbers and now enjoy watching their team-wide pressure, Torino a side I would never watch until I saw stats showing how uniquely they pass in their own half, Rayo just a hipster name on a page until I saw their ridiculous high-press, soft-belly defensive numbers, etc, etc. Often times a single number can illuminate an entire team and make me watch in a new way. With 8 teams remaining in European competition and all in action this week, I found something each was near the top of Europe in to help explain their season and to provide a focus to watch the next two weeks. We start with the Europa League...   Europa League Villarreal-Liverpool   Snip20160424_133 No one forces opponents to play out to the wings more than Villarreal. It's not a one year fluke either, last year they led Europe by an even greater margin. At this point we can say that this is at the core of manager Marcelino’s philosophy on how to play. He wants to force teams to the more controllable, less dangerous parts of the pitch where he gets a free extra defender in the sideline. It’s Schmidt-ball in their own half (Leverkusen funnel the ball to the sidelines when teams are building up and then crank up then swarm in the restricted space). Snip20160425_15   It’s worked beautifully this season as Villarreal have a 6-point edge on Athletic Bilbao in the race for Champions League and their defense to thank. Only Atletico and Barcelona have allowed fewer than Villarreal’s 31 goals conceded. courtesy of Managing Madrid's blog.   This sets up a fascinating battle as Liverpool (and Klopp in recent years) play to the center more than almost every other team in England (and Dortmund did). Alberto Moreno might have even more space than normal ranging up the wing, can he make something of it without leaving an opening for Villarreal?   Liverpool   Snip20160425_16 There is tons more on Liverpool here but for now I'll point out how stingy they have been since Klopp took over. Only Bayern and 2 Italian teams in Juve and Lazio have been less generous with dangerous completions allowed (and Italian teams in general see fewer across the board). Villarreal will probably not see more than a handful of dangerous chances (they are outside the top 10 in time spent in front of goal in Spain and dead last in shots), so they will need to take advantage via a Bakambu goal or a Liverpool individual mistake. With at least one of Skrtel, Lucas and Toure seemingly sure to start Liverpool fans can surely rest easy.   Sevilla vs Shakhtar   Snip20160425_139Snip20160425_137 It’s the shot quality derby as 2 of the teams who have led the way in Europe as far as avoiding those derided outside the box pot shots will match up. In both the Champions and Europa League, Sevilla and Shakhtar have been right at the top. Skenderbeu fans, I'm sorry but your team sullied the storied name of the Europa League with their performance this season, read this and try again. In La Liga, Sevilla are #1 again, with a similarly low rate. Many stat-heads should enjoy the decision making on display in this tie, though I'm semi-ambivalent for the most part about long bombs. Variables like pressure, passing options, angle, and ball movement are so quickly changing and influence a possession so much that I find it difficult to think most 5% shots with some non-negligible chance of a rebound/corner are disastrous. Plenty of times your possession is just out of options or the best other one is a difficult pass to someone way on the wing hoping they can play in a cross and ending it with a 6% chance at a goal is optimal.   With nothing else much to add here, I’d like to call attention to the season Metalurg Zaporihzia had in the Ukrainian Premier League. They were outscored 50-7 while nabbing 3 points (all from draws) from their first 16 games. They’ve since forfeited their last 7 due to the club declaring bankruptcy and at this point, it’s going to be tough to climb out of the relegation places. Aston Villa fans, it could be worse. Snip20160425_18       Champions League Atletico Madrid v Bayern Munich Snip20160425_11   Bayern stop you by refusing you entry into their danger area, not by limiting danger when the line is broken. The high line compresses play and forces long passes often born out of desperation. Those long desperate balls are mostly harmlessly intercepted by Bayern, but when you actually get through, the chances of a shot are higher against Bayern then anyone else. This has been true for the entire Pep-era. Bayern have a larger “lead” in this stat year after year than any other team in any other stat I’ve compiled. If you get a man with the ball in a dangerous area against a Pep side, he will likely be alone (so without the thought of passing options to improve the attack) and the defense is likely to be stretched to where a shot looks quite enticing. Atletico will likely look to recreate their Barca plan by generating just a few situations where they can get a man with the ball closing in on goal. If they create that situation vs Bayern, they are more likely to get a shot off than vs any other team. And yes, I realize this isn't exactly doing something "well" but it's a hard article to write a title for, ok?   Atletico Snip20160424_135   Only Juventus nears Atletico when it comes to making opponents struggle with the ball to advance to dangerous areas. It takes on average 114 completions for the opposition to get one in the high-danger zone right around goal. We saw how this worked to perfection against Barcelona in the 2nd leg: Snip20160425_13 A lot of blue all over the pitch except for the most crucial areas.   It figures Simeone will set his team up that way again against a semi-sputtering Bayern. There is plenty more about Atleti's defensive set-up here.       Real Madrid-Manchester City Snip20160425_9   Way on the right is not where you usually find teams with Real Madrid's budget but here we are. Only Koln, Everton, and a few Italian teams are softer to play against than a team in the UCL semifinals. Aston Villa and Sunderland are just to the left of them for crying out loud. Such a glaring flaw hasn’t gone unnoticed of course, and in some pockets of the stats-heavy internet it’s probably led to Real Madrid being underrated. I’m even feeding into that here, the temptation to point out bizarre stats like this generally outweighs another boring stat about Ronaldo averaging 8 shots or something insane. Madrid play sloppily, provide minimal resistance to the opposition and basically perform like a quickly-thrown together all-star team. These are often taken to mean they can’t compete with the best, but clearly they can. Tons of ugly flaws can be covered up by the Monster of Shot Volume, which Real Madrid can control to an extent unmatched across Europe.   Man City Snip20160425_3   It’s become somewhat fashionable to highlight Leicester’s direct long ball style as an adjustment that has fueled their rise to the top of the table but I’m of the opinion that their mix is something special like grandma’s meatloaf. You’re not exactly sure how such a generally disagreeable mix of ingredients turned out to taste amazing, but you aren't going to waste your time trying to replicate it to almost assuredly disappointing results. If you want to please your guests, don’t serve them meatloaf, buy them Popeye’s Chicken, and if you want to be a great attacking team, don’t try to copy Leicester's long balls, get enough people forward so you can create intricate interplays and overloads. Man City, Barcelona, and Arsenal will likely have great offenses again next season as they have the bare-bones right.   If City can get ahold of the ball, there don't seem to be many obstacles in their way to racking up a large amounts of chances in this tie. Real Madrid allow the shortest average pass distance in the danger zone in Spain along with the 2nd-highest completion% allowed in the league. City are up near Arsenal miles ahead of #3 in England when it comes to completion% for in the danger zone. Put all that together with the Monsters of Shot Volume on the other side and this tie has the potential to be one of the best to watch for action-loving neutrals ever. If you are trying to win over a basketball fan to soccer, make sure you tune in with them to City-Real Madrid.   Enjoy the games!

West Ham, Teams Phoning It In And How Are Villa And Leicester Alike?

bilic3 West Ham West Ham are an ideal team to shred apart post season, with a view to define what happened. Viewed season long, their defence has been secure beyond the evidence shots or expected goals shows us and their attack, by my reckoning, is currently riding it's second wave of the season, and maybe even a third peak. Simple stuff tells stories and they are converting 13% of all their shots and 38% of their shots on target since halfway. That's high, just as it was during the opening weeks of the season, and overall their entire season, much like Leicester's, has been defined by being on the right side of the percentages, where most of the larger clubs have not. Where they can find encouragement, is that their attacking volume has increased as the season has gone on. They rank third for shots and fourth for shots on target in the second half of the season, which represents a big uptick.  There's even a reasonable case to be made that they have been unlucky in recent weeks, just when their shot volumes have started to steer in the right direction and point towards dominance and victories, the goals have started flying in at both ends; their last six matches have all featured four or more goals and they could easily have won more than two of them. That they haven't lost any of them either, once more shows that even when West Ham have found things not going their way, it hasn't bitten them. Let's not get carried away: overall they are still a par shooting team albeit one that experiences a high volume of events–a combined 28.5 shots per game leads the league–so there's a lot going on. Plus, we shouldn't forget the wild autumnal skews at both ends, but i'm far less inclined to predict a huge fall next year than I might have been a couple of months ago. West Ham long term could be something like the real deal, it's just that their volumes have run around 6 months behind their conversions, and it's probably a coin toss as to whether reversion or that wins out going forward. They are somewhat enigmatic.   The Ballad of Villa and Leicester Having just lost their tenth consecutive game, it's fair to say that this season has petered out somewhat for Aston Villa. While only technically relegated last week, their season was doomed to fail a long time ago. Having seen Tim Sherwood oversee a four point haul in his ten games in charge, that Remi Garde took another ten games to secure four more meant it was likely to be curtains at Christmas. So much so that January investment became pointless–especially after heavy summer spending–and the club meandered into a further abyss, where they currently reside. This now irrelevant continued post-Christmas malaise got me wondering about miserable runs and I didn't have to look far to find another: Leicester City in 2014-15 had an autumn to forget and of the 12 games they lost during the first half of the season, at one point lost ten from eleven games. Their "seven points from safety at the end of March" tale has been well told, but it's fascinating to compare Leicester 2014-15 and Aston Villa 2015-16 as a representation of the fine margins that exist. At halfway, Leicester had 13 points and Villa 8, after 25 games the difference only one point; 17 to 16 in favour of Leicester and this is where they diverge: Leicester doubled their points tally in ten games to 34 and Villa lost ten straight. If we look at some shots numbers, their tales are similar. At that same 25 game point  Leicester had a shot on target ratio of 42%, Aston Villa 41%, both bad numbers but broadly in line with what you'd expect for a bottom five or six team. The magic of expected goals paints a similar picture, each team around minus 13 or 14 for the season at that time too. So what's the difference? Aston Villa have been a minimum of seven points from safety since the 29th of November whereas, Leicester were never more than five points back until they hit that seven point deficit during March, so while they faced an uphill struggle and defied the odds, it was very different that Villa's five month long death sentence. As well, Leicester, in the prologue to the best damned sports film you'll ever see, had zero expectations. As Premier League newcomers they therefore had little to lose but their run to safety came as they improved their real goal difference by 9 while expected goals were flat. That +9 goal gain across thirteen games was a massive positive boost, and something that miraculously continued through to this autumn. Both teams could be frustrated that the first half of their seasons provided such little return. Sherwood's tenure, though underwhelming, found no fortune in point-getting and he could reasonably be assumed to have improved that a little had he remained in charge. His team were struggling hugely to find the target (37%) but via expected goals were around five goals behind; over ten games that's huge and while his methods weren't working, some reversion may have been expected. Garde never got his team going at all, merely replicating moderate numbers and carving out no positive skew whatsoever. Flat shot totals and expected goal numbers mirroring reality showed a bad team not doing well before inevitably his tenure was cut short. And that's that. Two teams equally destined to struggle for two thirds of a season before their trajectories took entirely different directions. For Villa, who tried to blend an analytically focused recruitment approach with some "good old Premier League boys", an uncertain future, redundancies and rejection of the modern recruitment structure to which they half committed. For Leicester endorsements and glory: an unlikely title is near. It's a funny old game. Phoning it in A three teams for two slots relegation battle might be keeping it interesting for those involved but has inadvertently caused a log jam of teams that are phoning it in, over and above the usual suspects that exist in the mid-table hinterland. Chelsea are seven points off 8th and Crystal Palace are eight points clear of seventeenth, so eight teams are residing in a place where results no longer really matter. It's not Stoke's fault they have faced Liverpool. Tottenham and Manchester City in consecutive games but to concede four on each occasion seems a little careless. Bournemouth have continued their weak form against the larger clubs with only a win against Villa in the plus column recently. Chelsea, at least finding some finesse with a returning Eden Hazard, have been playing largely at half pace for weeks and Crystal Palace, Everton and Watford have all been dreaming of the Cup. That only leaves Swansea (two big defeats in a week) and West Brom (safe in the 40+ point Pulis zone) from the 9th to 16th placed teams, none of which have much motivation to perform in the league right now. "But these are professionals, that is a strong claim to make." Well, yeah, but if we look at these 8 teams and their last six matches–while recalling that the gap between Swansea in 16th and Sunderland in 17th, so relative safety, prior to these being played was eight points–we find interesting results. During this period, these eight teams played 32 games against teams other than them, so the top eight or bottom four. Three of them beat Aston Villa, Crystal Palace beat Norwich and West Brom beat Manchester United. Yep, they won 5/32 games against the rest of the league.  That's pretty poor for a middle tier and worse still if we exclude Aston Villa who can't even summon a draw at this stage. I can't say if anyone is making good money betting against these teams, draws are likely to hamper that, but nobody is making money backing them to win. That the bottom four found themselves so far adrift from the rest of the league is somewhat unique and has contributed to this mid table malaise, but when Sunderland stoically refuse to be beaten (2-6-2 last ten) or Newcastle put in spirited performances (draws at Man City and Liverpool), that they aren't closer to the lazy lot above them must drive their owners crazy.     _____________   Thanks for reading  

Understanding Football Radars For Mugs and Muggles

What is a radar?

It’s a way of visualizing a large number of stats at one time. In our case, the radars specifically deal with player stats. Some people also call them spider charts or graphs because they can look like they make a spider web.

Why bother creating them? What’s wrong with tables? Or bar charts?

Hrm, let’s deal with the last questions first. There is nothing is wrong with tables of numbers. My brain loves them, and so do many others.

However, you have to admit that tables of numbers are a little boring. Bar charts are better, but they kind of fall apart when trying to compare many attributes at the same time. Radars allow exactly that.

Why bother creating them? That one is complicated. Why bother making infographics or doing data visualization at all? The answer is probably at least a book long, but the quick response is because people like to look at stats presented in this way far more than they like to look at a set of numbers. Radars invite you to engage with them. They create shapes that brains want to process. People have real reactions, and once you get used to what they display and how they display it, you can interpret them much faster than if you had to do the exact same analysis with a table of numbers.

Many of the shapes created correspond to “types” of players, at least when it comes to statistical output. Pacey, dribbling winger. Deeplying playmaker. Shot monster center forward. Starfish of futility.

There’s a lot more methodology chat in the various articles I have written about on StatsBomb, but I need to explain one very quick thing before I move on to player type shapes and examples.

Radar boundaries represent the top 5% and bottom 5% of all statistical production by players in that position across 5 leagues (EPL, Bundesliga, La Liga, Serie A, and Ligue 1) and 5 seasons of data.  In stat-y terms, the cut-offs are at two standard deviations of statistical production.

In non-stat-y terms, Lionel Messi made EVERYONE look terrible. I know, that doesn’t sound that bad because it’s true, but trust me, the newer way the templates are constructed is better.

Messi_2013_vs-JoeAverage1

The design for these was taken from Ramimo's 2013 NBA All-Star poster. I thought it would be really interesting to apply this to football, and then through testing, became irritated by what Messi made everyone else look like if I just used pure stats output. That's when I added the standard deviations idea, and started playing with different positional templates.

QUICK NOTES:

  • The only thing these represent is statistical output.
  • If you put players in different systems, it may change their output.
  • If you put them in different positions, it almost certainly WILL change their output.
  • Age will also change statistical output.
  • In short, these are a tool to help evaluate players. Like any tool, they have strengths and weaknesses. In general, I have found it much easier to evaluate players WITH this information than without it.

Explaining Bits and Bobs

per_90

This means that all the non-percentage stats in this are normalized for 90 minutes played. The reason you do this is to correct for the fact that some players don’t always play 90 minutes. Players that frequently get subbed on or off will inherently look worse if you look at per game stats than per 90 minutes played.

Age

This is the age the player would be at the end of the season. We will change this soon to season age + birthday.

Non-penalty-goals

Why use non-penalty goals? Because penalties are converted at a 75-78% rate almost regardless of who takes them. They are a different skill to scoring goals that are not penalties (some teams have even had goalkeepers as their lead penalty takers), and so we strip them out of the scoring numbers.

DRAWING penalties is a great skill (and will be added to assist stats over time). Converting penalties is a very common one.

Shooting%

How many shots were on target out of ALL shots that a player has taken. This includes those that were blocked.

Key Passes

Passes that set up a teammate to take a shot. These are highly correlated with assists, which are passes to teammates who score a goal quickly after. (Note: This is the same stat as Chances Created. Somewhere along the way Opta made Key Passes only mean passes that lead to shots that are NOT goals and CC is all. Which is weird.)

Through Balls

Opta definition: a pass splitting the defence for a team-mate to run on to. Why do we care? These types of passes are generally considered the single type of passes most likely to score a goal.

Scoring Contribution

Combined non-penalty goals and assists per 90 minutes.

PAdj

PAdj stands for “possession adjusted” stats. The reason why we do this is because it normalizes defensive stats for opportunity. Think about it this way: If your teammates always have the ball, then you can’t make any defensive actions, and you would look worse in this statistic compared to a Tony Pulis-style team that sits deep and constantly defends.

When adjusted for possession, tackles and interception output becomes moderately correlated with shots conceded and goals against, as opposed to having no correlation without the adjustment. In short, it’s an imperfect adjustment, but much better than not having the adjustment at all.

bottom_left_table

In the bottom left of every radar is the actual statistical output in numbers for each spoke of the radar. Numbers in green are in the Top 5% of output in that stat for the player population and numbers in red are the Bottom 5%.

Forwards + Attacking Midfielder Shapes

Pure Goalscorer

Pure_Goalscorer

Elite Creative passer

Elite_Creative_Passer  

Wide, Dribbling Playmaker

Wide_Dribbling_Playmaker

All Around Super Forward

All_Around_Fwd

Starfish of Futility

starfish_of_futility

Bowtie of Sadness

Josmer_Volmy Altidore_2014-15

Central and Defensive Midfielders

Pure DM

Pure_DM  

Heavy Attacking CM

Attacking_CM  

Deep-lying Playmaker

Deeplying_Playmaker_CM  

General All Around CM

All_Around_CM

Fullbacks

Defensive

Defensive_Fullback

Attacking

Attacking_FB

All Around

Daniel_Carvajal_2013-14

I broke down fullbacks in detail here.

Center Backs

These were developed later, and to be perfectly honest, they are less valid overall than the other positional templates. I knew this ahead of time, but legendary Scotland, Everton, and Rangers player David Weir - who is also a centerback - asked me to take a swipe at creating these and I couldn't say no. They give you a sense of how a centerback plays, but become tricky beyond that.

I do know that Thiago Silva is pretty fantastic, though.

Thiago_Silva_2013-14

--Ted Knutson

mixedknuts@gmail.com

Into The Stats: Around The Premier League...

vardy Home and Away Again There was some chatter around earlier in the season noting the high level of away wins in the league this season. It seems as much as anything the lack of dominant home teams contributed to this perception. So far no team in the league has drawn or lost fewer than six home league games combined meaning no team has won more than eleven home games and no team will exceed thirteen by the end of this year. We are far more used to at least a couple of teams posting formidable home records. Last season three teams won 14 or 15 home games (Chelsea, Manchester City and Manchester United), the season before had City (17 wins), Liverpool (16) and Chelsea (15), 2012-13 had Manchester United (16) and so on. In fact you have to go back to 2001-02 to find a Premier League season with such an egalitarian spread of home wins. That year West Ham placed 7th and matched title winner Arsenal's 12-4-3 home record (the positional difference was explained by Arsenal's 14-5-0 away record compared to West Ham's 3-4-12). Overall it is an uncommon situation for one or more of the larger teams to fail to dominate the opposition on their own patch Overall home wins have exceeded away wins, as you might expect, but only after a temporary early season skew moved towards the latter. This fooled a few into thinking that a home advantage had disappeared (the numbers bottomed out around Christmas) and although a super long term trend is moving the gap together, the evidence for home field advantage is strong and consistent and remains. Currently, and long after this storyline has faded from view,  the score is 132 home wins (40%) to 108 away wins (~32%) with 9o draws (~28%). This pegs home to away at 55 : 45. Looking at this season, this advantage endures as we bounce merrily through the numbers.

  • Goals H:A ~54:46
  • Shots H:A ~55:45
  • Shots on target H:A ~54:46

Also, home teams complete more passes: ~78% to 76%, and have more of the ball:~52% to 48%. What is relevant here is that the shots advantage persisted throughout, and it was more a case of a temporary skew in conversion feeding into the slew of away wins to create a perception that an advantage had softened. These biases continue to be reflected at team level. At home compared to away, this season every single team in the league has better shot rates (however you slice them) and every team bar Leicester has better shot on target rates.  With regard possession and passing percentages, only Tottenham exceed their home totals away from White Hart Lane. There is comfort at home and it's reflected in the numbers. Weekly wonderings about Leicester Leicester have happily thrown the traditional "How to Succeed" playbook out of the window and lead the league despite moderate shot totals (-21 shots, +31 shots on target), a league worst passing percentage (68.4%), bottom three possession numbers (43.1%) and we saw a reconfirmation this week of the fact that their likely 5000/1 league success would be the largest individual odds defied in the history of sport. That's pretty cool and means the chances of aliens arriving to join in the celebrations now seems a whole lot more likely while Elvis might show up and ask if they named the King Power Stadium after him. Parts of the wider media are also starting to notice the statistical oddities that encompass Leicester too, from bookmakers to newspapers, we've seen a good deal of comment on these issues. Indeed it's pleasing that there are larger organisations reaching out and looking for these stories, they're valuable and informative. Back out here where the most of the good content lives, in a wide ranging analysis, Constantin Eckner pulled it all together with a pretty definitive tactical shift over at Spielverlagerung and Michael Bertin investigated their insanely low opposition conversion rates. He calculated a value for the chance that Leicester would concede so few goals since the halfway point; it's around a 1 in 300 chance. This reflects some wider truth, for when we find unlikely success, it's not entirely surprising that we also find other large odds occurrences taking place.  What odds the season long total lack of injuries? What odds finding Vardy and Mahrez and them elevating to this level peaking alongside each other? What odds the huge plus column full of penalties? What odds it all comes together at once? We know that: it's 5000/1. So next season if your club decides to give up the ball and play directly, on balance, it's more likely that they will end up like the many clubs that have tried and failed with the style before, scrapping for their Premier League lives. Some have made a comparison with Atletico Madrid and the formulation and execution of different to usual systems. We have far more evidence that Diego Simeone has built something sustainable, his teams have put up solid shooting numbers during the nearly four full seasons he has been in charge of after taking control midway through the 2011-12 campaign. Their defensive solidity is borne of shot suppression and has shown to continue despite personnel changes and is altogether different from the good but not great Leicester numbers. Indeed while reliant on the attacking talents and goals of Antoine Griezmann or Diego Costa and Radamel Falcao before him, that Atletico have been able to compete over multiple seasons in multiple competitions reflects that they are not purely reliant on talent alone; the system is strong, as their heroic resistance of Barcelona testified. One suspects that the removal of any of Leicester's talismanic trio of Jamie Vardy, Riyad Mahrez or N'Golo Kante would hugely impact the effectiveness of their attack; something that has already faded to a degree. Of course, the West Ham game finally found a heady mix of misfortune for Leicester. Vardy deserved his second booking, but would most referees call that? Maybe not. Most referees probably wouldn't give a penalty for pushing in the box, but they possibly would if they'd just doled out a warning. These things can go both ways, as the last ditch penalty showed, and finally a few went against Leicester but they finally conceded the goals to go alongside the volume of opposition's shots and Tottenham, for a day at least, spy a gap in Leicester's armour.  This result and even the format of its arrival were overdue but the warning remains, celebrate Leicester,  but unless they blow their summer budget on Cristiano Ronaldo or Zlatan Ibrahimovic, somewhere along the line, the talent gap will be exposed and they will refind their level. This isn't a football revolution. Second Half Stories Most analysts would agree that a league season is an insufficient volume of games to apply sufficient rigour to many analyses but in a short term world, trends can be noted over far smaller samples. Indeed the back end of last season offered small clues to the trajectory of this season's mystery teams, Chelsea and Leicester. Too small to predict their eventual destination, but enough to be able to reflect that there were signs that everyone entirely disregarded in favour of broader takes. This being so, there must be some value in at least noting movement in trends between the two halves of the season. Not everything is shifting narrative powered by the natural oscillation of lucky or "unmeasured" factors. Here's a handful of the likely contending types:

  • Chelsea haven't improved overall. Now seemingly on holiday and operating like a try out team for some of their younger players, their shots numbers haven't moved since the half way point. Guus Hiddink may have brought a safe hand and an early run of decent results, but taken as a whole this entire season leaves them no higher than they deserve. Predictions of a big year next season are likely to be thin on the ground.
  • Liverpool have a positive skew on their front end for the first time since the back end of 2013-14, 41% of shots on target since game twenty  have turned into goals. How high is that? Well, that's Leicester early season hot, pretty smokin'. The other thing that resembles that season is the opposition conversion: far too generous at 39%. High event stuff, shots, goals and fun. That they needed a seven goal thriller to edge out Dortmund is entirely in character with their whole second half of this season. I'm pretty positive that Klopp can at least bring a little order to proceedings next year, but for now it's harum-scarum stuff with little sign of let-up. The Merseyside Derby against this Everton incarnation has the makings of madness.
  • Tottenham's shot numbers are significantly better in the second half of the season. They have been a 20 shot to 10 team all through this stretch and the on target numbers are loopy (7.5 to 2.7). They've improved throughout the year and project extremely favourably going forward, all the while without skewing off their conversions, likely a function of their propensity for long range shooting but nonetheless, married to defensive solidity, hard to criticise.
  • Arsenal are a 53% shots team in 2016, which goes some way to understanding that while the autumnal incarnation of the team was good but unlucky, the winter to spring edition is underwhelming. Their squad has been fit enough through most of February and March to make a run at things and you would normally expect a top four contender to be about 5-7% ahead of this rate.While we know their shot profile has evolved into a pro-inside box method, it feels like they've sacrificed volume somewhere along the way. Whether the underperformance in expected goals is a blip that will right itself over time remains to be seen, but for now, perched typically at the arse-end of the top four, it hasn't paid off.
  • Manchester United have been a 45% shots team in 2016 and still average under 11 shots per game. It is a fantastic achievement to find a team in 5th place with borderline relegation shooting numbers. Credit to van Gaal. The victory over Aston Villa once more enthralled the faithful.

That'll do for now. We'll find some more next week. ________________________ Thanks for reading!    

Merging Football Stats and Coaching - The FIFA Skills Pitch

As you may have noticed from my last update, I have spent a lot of time thinking about how to apply what we learn from studying football stats. How do you take academic knowledge and make it practical? What feedback do we get from talking to players and coaches about how to better apply these ideas in the future? What simply does not work? I cannot stress enough that the world is just getting started in this area. What we understand and think is correct now may dramatically change over the next 20 years, but you do the best with what you have. Progress is a bumpy road. What follows is a goofy idea I was fooling around with some time ago related to developing player skills in ways that are intuitive, especially to younger players. The concept here is that coaches could introduce this, and coach a couple of brief sessions on proper usage and technique, and then players could then use this as part of their free development time to help improve skills. Confession: It might be dumb for reasons I have never thought about but many of the coaches out there have. Here's the rub...  that's fine! Experimenting with concepts and ideas is one of the most important things new people can add to the game. Plenty of potentially bright ideas won't work out for [reasons], but many of those interim steps might be required for something truly brilliant. The other thing I am fairly certain teams do not do enough of is learn from their training information and data. Game data only takes you so far. Being able to objectively evaluate your own players based on training drills from the first team right down through the academy is a hugely valuable resource that can't be replicated in any other way. The ideas below were me poking around with developing an environment where that became fairly natural. Anyway, here you go... the FIFA Skills Pitch You know the FIFA skill drills that help teach you how to perform certain drills in the game? Let’s adapt those and use them for objective performance and skill tracking. The concept is to create a pitch with different areas designated to different types of skill drills. At regular intervals, coaches/analysts track player performance in the various skills and update the skill leaderboards. Game data only generates a very small sample of information about certain important skills. Example: In order to find out who the best shooters in the world are, it can take from 3-5 seasons of data to tease out whether a player is good versus lucky with regard to shooting skill. For skills like long shots, free kick taking, or corner taking it could potentially take even longer to discover this information. However, by starting to track data in training for skills we care about, we can rapidly overcome the small sample size problem and learn in a matter of months what it might take years of game data to discover. We can also tailor player roles better to personnel who actually have the skills we want. And finally we can start to track player improvement in these areas objectively. The objectives here are as follows:

  • Increase player development by posting a clearly defined way to evaluate their skills and development
  • Better evaluate our own players by creating data driven metrics that teach us more about player skills than we would learn from small sample sizes of game data.
  • Post regular leader boards with player rankings across all levels, so that players are incentivized to compete and improve.
  • Eliminate on-pitch arguments about who gets to take free kicks or corners or penalties or whatever (Note: This actually happens!). Point to the data, and that person takes it. Want to take more free kicks yourself? Get to the top of the leader board. This should help foster an environment of continued skill work and improvement at all team levels.
  • Increase player buy-in by creating skill “games” directly related to one of the world’s favourite player past times – playing the FIFA video game.
  • Decay data over time so that players can move up or down the leader board by showing continuous improvement.

If this pitch gets a high amount of use, you might consider developing it on turf, because the free kick and corner locations especially will get chewed to bits. Free Kick Skill Location How?  For free kicks, pick 5 spots on the pitch (Example: central, 22 yds, Right 20, Left 20, Right 26, Left 26). Free_Kick_Targets_Goal_Frame Add two 1-yard wide targets from top to bottom of the goal on each side (make sure they are color coded different colors, since it makes it easier to remember and for the brain to process) plus elevated wall simulations. 2 times a week, have any potential free kick takers take 2 shots each from those locations and track the data. (The fitness guys cannot POSSIBLY complain about 10 total extra free kicks, right?) (Note: Remember to randomize the locations they take kicks from so that they mimic game situations as much as possible. You never get to take a FK from the exact same spot twice in a row in a match.) If you want to maintain the ability for guys to keep practicing and move up and down the leader board (and the on-pitch FK taker roster) then have data expire after a certain amount of time for leaderboard purposes or weight the newer data as more important than the old. Also look into mixing in actual team practice with keepers and walls and tracking that at a less frequent interval to mimic in-game situations. One of the things we might learn here is that certain guys are just better at converting from certain locations and we can use that for in-game decisions. Crossing and Corner Takers Skill Location Do something similar to the free kicks except for corners. Set up elevated targets (or rubbish bins, if you want) at the different locations and heights you want your corners to land in and track the performances twice a week from each side. fifa_skills_crossing (This is a really vanilla example from the game itself, but there's a lot that can be done here depending on what is durable and practical.) Obviously there is some subjectivity to the evaluations - this guy hits it harder, or flatter on corners or whatever - but now coaches have actionable information on player skills, and the analysis team has more info to help evaluate the ability and importance of players in the team. [REDACTED STUFF ABOUT SET PIECES] Penalty Kicks Use the same targets as the free kicks except add a large target centrally as well (Insert important game theory point about slow central penalties here). Alternatively, you can literally just recreate the target setup from the video game. fifa_skills_penalty Dribble Slaloms One left and one right, exiting into the very top of the penalty box. From there you get 2 options

  • Dribble through the slalom and shoot to one of the traditional targets
  • Dribble through the slalom and set up a key pass to a number of very narrow target passing areas (say 1.5 balls wide?). Goes along with the concept of making sure all attacking players keep their heads up and are aware of passes to teammates in the box at all times. (Note: Is there a way that we can vary which targets are read as open vs covered?)
  • When available, you can use players and defenders here for more realistic simulations.

Variation: Something like this for wide players:

Can Southampton Become A Force In The Premier League?

1787532-37747931-2560-1440 In a more normal Premier League season, the wider media would probably be spending more time rehashing the same clichés they've used for Southampton over the past couple of years. They're hanging around the top eight having survived another summer of key departures (Morgan Schneiderlin and Nathaniel Clyne) and there's no real signs of danger as they're once again above average in controlling shot numbers for and against. Perhaps the quality of attacking football hasn't quite been to the standard of the previous two seasons but it's still been satisfactory. Their goal difference is fine enough at +11 and in a year of chaos and turbulence, Southampton are being their steady selves. And yet there's a good argument to be made that this iteration is the worst one we've seen since 2012-13. Let's start with the good: Southampton are still a good defensive side. They're conceding the 8th least shots in the league, 5th least shots on target. Some expected goal models rank Southampton's defense highly while others don't. Whichever one you roll with, the overall picture has been solid though not stellar. A rolling chart of Southampton's shots conceded from Koeman's entire tenure is that these last few games have been some of the worst. Soton A Southampton A2 Perhaps this is the consequence of constant retooling while rival Premier League teams snatch up members of their defensive core? In midfield, Jordy Clasie has had his share of injuries this season and that's helped expose more of Victor Wanyama's flaws as a defensive midfielder. On the plus side, Fraser Forster has been a really good shot stopper and a good goalkeeper can mask some flaws. Paul Riley's shot model rates Forster as one of the best shot stoppers in the catalogue. There's some conflicting data surrounding how his technique of saving shots isn't too beneficial but to this point, Southampton have a good keeper and he's certainly been a massive upgrade over Artur Boruc. So Southampton are still good defensively even though it's not quite to the standards of last season. If we transition to the attacking side, it's also broadly fine. 54 goals was their tally the last two seasons and they're on pace this season for 48-49. They're in the top 8-9 in generating shots, and expected goals have them ranked in the 4th-8th range as well. Even though their shooting percentage is below the league average, it isn't demonstrably behind. Looking at the types of shots being taken though and it reveals a dirty secret: Southampton like to cross the ball a ton.

DZ Cross
Data Courtesy of @MC_of_A
In comparison to clubs like Arsenal or Tottenham who value efficiency, Southampton are death by 1000 cuts. Crossing the ball on the whole isn't an inherent evil that it sometimes is made out to be. Unwrap it more and there are different types of crosses. The type of aimless crosses we think of, like the ones seen in that famous Man United v Fulham match during the Moyes tenure, are by far the least advantageous because they're against a team in a set defensive position. Cutbacks or even low crosses in a non structured environment are often much more advantageous because of their location, something Barcelona and Bayern Munich seem to complete in abundance. Here's why Southampton's penchant for crossing can be so annoying though: they can be effective in other ways. You wouldn't necessarily think of Southampton as a direct counter attacking side but they are. They rank very highly in metrics that describe counter attacking tendencies https://twitter.com/MC_of_A/status/715749185509789697 If we attach expected value with these attacks, it rates them even higher https://twitter.com/WillTGM/status/717295885546352641 Taking a look at their passing data and it also tells us that Southampton are slightly above average in controlling final third territory
Pass Ratio
Data courtesy of Objective Football
There are a considerable amount of redeeming qualities about how Southampton play, which makes their tendency to lump the ball up to their target men all the more frustrating. This isn't a one season mirage though because they've crossed the ball a lot since coming into the league and it makes some sense seeing as three of their strikers have been Charlie Austin, Graziano Pelle and Rickie Lambert; a trio that is capable with the ball at their feet but also they are natural target man who like crosses fed in. That being said there should be a Plan B or C when you've already attempted 22 crosses in the game and it's gone virtually nowhere. For the reputation that they've previously garnered for playing attractive football, this year's Southampton have been more prone to a pragmatic style than the champagne stuff. One of the weird things about Southampton's season has again been the use of their attacking midfielder Dusan Tadic. Despite the cold streak he went on in the 2nd half and how he seemed to waiver in and out of favour, last season was a good debut for Tadic in England. For half of Adam Lallana's transfer fee, they got a more productive playmaker. It's been weird this time around too. Fundamentally, nothing has really changed when he's played. He still plays primarily on the left side and his production is still up there with some of his peers. but he still hasn't played as much as he should. I compared Tadic's minutes to other prominent playmakers in the Premier League season and a couple of things that stuck out were the amount of minutes he's played as a sub and the disparity in total minutes: Mins The only reason why his minutes are comparable to De Bruyne and Silva is both City players have had extended injury layoffs, while Tadic hasn't. The sub minutes can be taken one of two ways. On the one hand, there are clear benefits both contextually and statistically to coming on as a sub. Perhaps someone on Southampton is telling this to Ronald Koeman and he's been using this more than other teams to beat up on tired defenses. On the other hand and this is the side I lean towards, Dusan Tadic is probably their best attacking player, and at the very least in the top 2-3. When it comes to his specific role as a playmaker, there's no one on the squad that comes close to touching him and even with the dalliances to a back three, that shouldn't mean that you can't find room for Tadic to play in it most of the time. Surely it would make more sense if he was playing 60 minutes and coming off for 30 than the other way round?  Regardless Koeman has been reluctant to field Tadic and Mane together and it has impacted on their ability to shine. In the wider context of being a team still relatively new to the league, this has been another successful season for Southampton. Another top 8-10 finish means even the club can continue to be fairly profitable while paying off whatever remaining debts are still with them. Perhaps the slightly frustrating thing if you were a fan is that this club isn't far off from another genuine top 4 challenge. They flirted with 4th place under Mauricio Pochettino in 2013-14 until around December and then the year after with a new squad, they went one step further and were sniffing the CL until late winter when a weird shooting stretch ultimately led to their demise. Ever since coming to the Premier League, they've been one of the best teams when it comes to conjuring a defensive structure. Whether it be the relentless style of pressing under Pochettino or the more subdued structure under Koeman, it's clear that to this point, they can identify talent, recruit them and plug them into whatever system they favour. Pundits keep talking about how the league is going to be tougher at the top next season, and some of it is probably true. While he may take time to incorporate all his ideas, Pep Guardiola still has a strong base to work with at Manchester City  and it probably means they'll be better. Liverpool have been frustrating in their own way but they have the makings of a really good side if they can have a relatively smart summer. In contrast, Manchester United have been expensively mediocre for three seasons straight and there's little evidence that they'll suddenly fix things up. Chelsea are staring at a possible total reconstruction and if that happens I'm skeptical that they can suddenly bounce back into being a dominant side. And then there's Leicester who will have a tough time finishing top 4 again next year unless they keep riding their luck or quietly morph into a genuine contender again. It's going to be tougher next season but I'd be wary of automatically thinking the Premier League will return to the static league that it was pre-2012. Southampton have vacillated between being an average and pretty good side since their return to the Premier League in 2012. This iteration would be on the lower end of the scale but it'll probably at very worst finish 10th. Are we approaching a point though where they might have to start becoming a bit more ambitious with their transfer recruitment? This doesn't mean that they start spending money like drunken sailors because that's antithetical to what they've accomplished through in house development and scouting, but it probably would mean taking a bit more risks on young and dynamic attacking talent. To illustrate that, here's a list of attacking players Southampton have bought since 2012 and their transfer fee according to Transfermarkt.

Gaston Ramirez £11.40M
Jay Rodriguez £6.49M
Emmanuel Mayuka £3.00M
Danny Osvaldo £11.33M
Saido Mane £11.25M
Shane Long £10.50M
Graziano Pelle £8.25M
Dusan Tadic £10.5M
Juanmi £5.25M
Charlie Austin £3.90M

This list isn't an outright disaster. To borrow baseball lingo, getting Mane and Tadic would represent hitting on doubles, Pelle/Austin/Rodriguez/Long are singles. But on the whole it's an uninspiring return and it has as many disasters (Ramirez, Osvaldo) as it does solid successes (Mane, Tadic). For a team that wants to take it to the next level, this won't cut it. There's a huge amount of young attacking talent that's probably within Southampton's price range. We can even highlight a few right now.

  • Sofiane Boufal: Before the rise of our lord and savior Ousmane Dembele, this was the next big thing in Ligue 1 and was at one point being billed as the next Eden Hazard (The good Hazard, not the caricature we're currently seeing). A wonderful dribbler who sometimes plays like he's going 1v11, chance creation output is still very solid despite being on an okay Lille side and he's got speed to burn. His rumored asking price is somewhere in the ballpark of £16-18M and with three seasons of huge PL TV revenue in the bank,  Southampton should be able to afford that. Boufal would provide the type of spontaneity and potential star talent that a club like Southampton are crying out for.
  • Vincent Janssen: Huge shot monster in a league that's admittedly very shot happy. There's always the obligatory note about how Eredivisie imports coming to England are hit or miss. Considering that Southampton already have two senior strikers on the wages they're currently at, you could argue that they don't quite need Janssen yet but Austin/Pelle are getting older plus Pelle's contract expires in 2017 and Janssen is more different as a striker in comparison:http://www.youtube.com/watch?v=5i-4h9vmIJQ
  • Hakem Ziyech: If you've browsed around soccer analytics twitter, you'll probably have heard of this man. Contributing 8 shots per 90 and 0.94 goal contribution per 90 rate which is insane though not unprecedented. For reference, Memphis Depay in his last season with PSV contributed 7.8 shots per 90 with a 0.95 goal contribution per 90. I'm slightly concerned that 64% of his shots are coming from outside the box but that could be smoothed out over time plus players like Eriksen and Payet serve as templates for primarily outside shooting playmakers to be very impactful in England. Also could be a replacement for Tadic since he's turning 28 in November
  • Nathan Redmond: Southampton don't have a lot of speed in their attacking players and Redmond would provide an ample amount of it. He's already been profiled on this site previously. His shot numbers have gone down since then but it's still at an all right rate especially since he plays for a low event team in Norwich with minimal talent around him. He probably could be had on an affordable deal and he's still only 22.

Those are just four players that would broadly fit. There are numerous other ones like Timer Werner, Domenico Berardi and Piotr Zielenski that you would like to think Southampton's black box has targeted. Perhaps none of them will be a home run transfer but if you can hit on a couple of more doubles and have a side of 4 or 5 quality attacking players of relatively the same age, there's not much more you can ask from a club with Southampton's budget, which of course is on the increase. Before this season, the road map to improbably challenging for the top 4 in the Premier League looked a lot like Southampton. Now that honor has been bestowed upon Leicester. Southampton have arguably built a more sustainable structure than Leicester and I don't think that they are that far away from being a damn good team. We've already talked about how good their defense has been and the offense could be enhanced by bringing in 2- or 3 players who bring a little bit of spontaneity and variation to the club. It might help if Koeman didn't have such a love affair for hard working players like Steven Davis and Shane Long but c'est la vie. If Koeman can soften up a bit, find more options in attack, get some positive variance on his team's side, then that's the recipe for a transcendent season. They are probably as well placed as any of the mid tier teams are to kick on again in 2016-17. Southampton can fly and have flown for some time, but will they ever soar?

CONTEST: Design a Movie Poster for Knutson's Presentation

Hi. I am giving a presentation at Science and Football on May 1st entitled The Death of Traditional Scouting. I am looking for a big splash image for the presentation in the style of a movie poster. My current thinking is something like an old Godzilla/Giant Robot disaster movie, but you people are awesomely creative, so if you think of something better, do eet! Prize: £25 Amazon gift certificate. All entries should be submitted to mixedknuts@gmail.com no later than Saturday April 16th, 2016. Please only submit finished entries and not works in progress or my email and head will asplode. I will then choose the winner and the top 5, and include them in a post on the site here. I will also plug your work whenever I use the image. All the best, --TK

PDO in Football/Soccer Is Stupid - Please Stop Using It

Some of you clicked on this just to ask, "WTF is PDO?" Which is fine - we take all kinds here.

The seeming acronym doesn't stand for anything - it was the online handle of Brian King who created the stat in hockey. The definition of the metric PDO is listed below but Wikipedia actually has a page for hockey analytics, so if you want to know more click here.

PDO – Uhhhh…

I’m just going to copy the definition from James Grayson.

PDO is the sum of a teams shooting percentage (goals/shots on target) and its save percentage (saves/shots on target against). It treats each shot as having an equal chance of being scored – regardless of location, the shooter, or the identity or position of the ‘keeper and any defenders. Despite this obvious shortcoming it regresses heavily towards the mean – meaning that it has a large luck component. In fact, over the course of a Premiership season, the distance a teams PDO is from 1000 is ~60% luck.

Now you may have seen an occasional tweet from me expressing displeasure with the use of this particular metric, but I've never actually sat down to detail why I think it's dumb. Today I will do that.

Reason 1) It's Theoretically Flawed

Why? Because it treats all shots as equal.

Here's a clue: All shots in football are NOT equal.

Not close. Look at it visually.

This is from one of many pieces by Michael Caley discussing expected goals metrics and it clearly shows all shots are not equal based on distance alone.

caley_exp_g_chart

Then you add in the whole headers are a lot harder than shots with feet thing that Colin Trainor did way back when and POOF there goes your theory and your metric, and we haven't even gotten to all the other factors that impact a shot's probability of being a goal.

It's kind of sort of fine in hockey I guess because shotqualityomgwtfbbq, but it's just fantastically dumb to use anything that makes this assumption in football.

If you need an image in your head to help explain all of this in personal terms, picture yourself with a football on a football pitch facing a goalkeeper. You take 20 on target shots at the goal from 20 yards out in the center of the pitch.

You also take 20 on target shots at the goal from 6 yards out in the center of the pitch. Which one of those scenarios is going to yield more goals?

Reason 2) It Combines Attacking and Defensive Conversion As If They Are Remotely Related They aren't. Teams technically have infinite choices in how they attack and how they defend. They don't have to be related at all. Therefore, why would we treat them as if they were?

You can have a normal, straightforward average attack and a league leading defense. Or you can have an attack that consistently creates insane chances and pairs it with a defense that gives up exactly the same.

Or you can... well, anything.

The point is that by combining the two separate phases of play into one metric, you miss out on the signal.

"Hey, this team is overperforming PDO!"

Okay, why?

THIS IS ALWAYS THE NEXT QUESTION, and if it is always the next question, then maybe you can - I DUNNO - treat the two phases separately and immediately jump ahead a step.

"This team is giving up far fewer goals than expected in defense."

Aha, now you have my interest. Tell me more.

"This team brought in an attacking assistant coach in the summer to try and boost the number of goals scored..."

Excellent, let's analyze that.

Wait... no team would actually do that in the current football landscape, but if they DID then this would be a very good thing to analyse.

Reason 3) Every Team Does Not Completely Regress

This is a fundamental nerd point, but the fact of the matter is that every team's PDO does not completely regress toward zero, even across multiple seasons.

Why?

BECAUSE ALL SHOTS ARE NOT EQUAL!

There are systemic reasons why some teams allow far worse chances season after season than others. If a team's defensive structure is such that the average shot distance it allows is from 20 yards instead of 15, your goalkeeper has more reaction time on average to make saves, there are likely more men between the ball and the goal, and the team is almost certainly going to post a better save percentage.

Or if you are a crazy high pressing team that tends to keep the number of opposing shots low, but the trade-off is that when someone beats your press they get awesome chances right on top of your goal, then your save percentage numbers are also going to look weird and are unlikely to regress to anything approaching average.

The same applies for elite attacking systems. Some head coaches have an attack that consistently creates better chances than average, which means their shots are more likely to go in the goal, and the team is more likely to post abnormal PDO numbers that have very good reasons to stay that way. And all of this is before we even touch the impact of super elite or sub-par players with regard to skill. One reason why it may look like teams revert to the mean over the course of many years is because manager or head coach tenures last between 12-15 months on average.

Start tracking these things by head coach tenure (or tracking head coach performance across different teams) and it yields a lot more clarity. A weird PDO by a team might be random variation, but there's a decent chance it isn't and for reasons you care about. Other ways of analyzing team performance would be a lot more insightful and should be examined first instead of simply assigning outliers to the random variation dustbin.

Conclusion

Regardless of its common usage in hockey, PDO is theoretically flawed in football and people need to stop using it. Yes, I know there may be data reasons why some analysts continue to use PDO, but as explained above, we should try to find a way past this at the earliest possible opportunity. Do something smarter that better relates directly to the sport you are analyzing. The good news here is that there is now a giant open space just waiting for a clever person to tell the world what they should be using in place of PDO, and that person could be you!