Month: December 2014
Under Pardew: Could Newcastle do better?
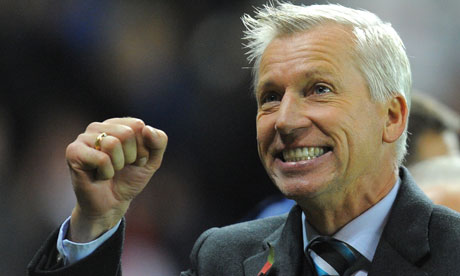
Under Pardew On joining Newcastle in December 2010, Alan Pardew brought Premier League experience but a mixed overall background & his appointment, possibly tinged with a nepotistic element, was met with a degree of scepticism from fans & media alike. His record since has been varied: the relative success of 5th place in 2011-12 was followed by a dalliance with the relegation places the following year. Last season was very much partitioned into two halves, prior to Christmas, perfectly good, post Christmas, horrifically bad and the bi-polar nature of Newcastle's results have been a hallmark throughout.
Alan Pardew is the current nominated Manager of the Month but is he an effective custodian or could they reasonably expect more? In this article I hope to represent some issues i've identified with his tenure & his prior record & show that the blueprint for better results isn't far from the surface. It's possible that a different approach could extract just that bit more & turn Newcastle into a team alongside Everton & Tottenham as regular European contenders, a status they enjoyed in the late 90s & mid-00s.
West Ham & Charlton
It's informative to look at Pardew's early Premiership career to show hallmarks that would resurface later at Newcastle. Specifically, he presided over a season in 2005-06 at West Ham in which they vastly overachieved against their underlying numbers. They finished 9th and their goal and shot rankings were as follows:
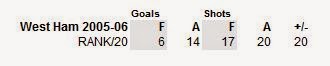
As a crude measure, we can see that their shooting performance was utterly dismal, more akin to a relegation threatened side than one in the top half. The reason Pardew's team was able to achieve a high standing was purely down to a very high conversion rate of around 15%; this drove their 6th ranked goals total (c.1.4 goals per game) & masked deficiencies in the performances. The opposition conversion rate came in at around 11% (again c.1.4 goals per game) which is about one percentage point over average, a theme that will repeat as we go on. The following season was slightly different: the shooting numbers remained almost identically bad but the goals dried up. The conversion rate plummeted to 6%, the goals to 0.6 per game and 'Pardew was criticised after seeing West Ham through their worst run of defeats in over 70 years.' A points average that had dropped from 1.44 PG to 0.82 was a stark reflection of how badly the team's form had suffered. He was gone a fortnight before Christmas. Quickly rehired by relegation threatened Charlton, he replicated the awful shots totals from his West Ham tenure & failed to save them from the drop. His points average of 1.15 was a par score for a finish of about 14th or 15th, but from a base of being firmly entrenched in the drop zone, it was too great a task to recover. And until the events of December 2010, that was the last we saw of Alan Pardew, Premier League Manager.
Newcastle
Pardew's first season was contentious & not merely for the circumstances in which he secured the job. The popular Chris Hughton was ousted despite claiming some notable scalps & whilst Pardew was unfortunate to lose Andy Carroll in his first transfer window, he was unable to improve results. We can see this here, in particular the points per game:
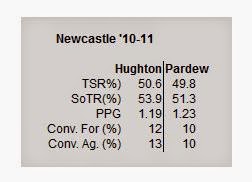
2011-12 was Pardew's golden year & secured him an unprecedented 8-year contract. Whilst he received the plaudits for an excellent 5th place finish, it was a strange year in which he presided over the worst shots totals of his tenure both for and against but found the only good save% he's had & his team dominated on conversion rates:
Where 2011-12 was good, what followed in 2012-13 and 2013-14 was often comparatively and relentlessly bad. Immediately following that 5th place finish, the team spent most of the following year far too close to the relegation positions having been hampered by injuries and a European schedule. A 16th place finish was a vivid contrast. Some of the underlying numbers for this year, and the following year, in which the period post Christmas after the sale of Yohan Cabaye was described as “a total collapse”, compare awfully when matched up to the rest of the league.
Stats such as these: (rankings based on 'Enlightened Era' rankings 2009-14, 100 teams)
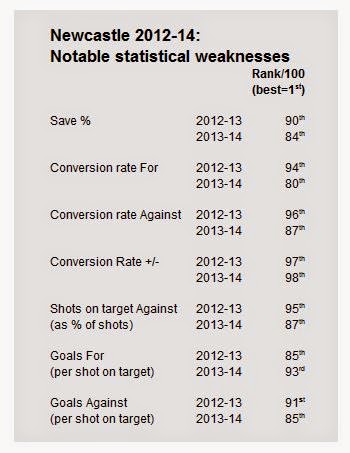
Similar to the miserable run that predated his sacking at West Ham, the run of form in early 2014 was bad to a degree of historical significance. In their final 20 games, Newcastle failed to score in 13 & lost 15. Pardew was also seen to hurl profanities at Manuel Pelligrini & motioned to headbutt Hull's David Meyler.
2014-15
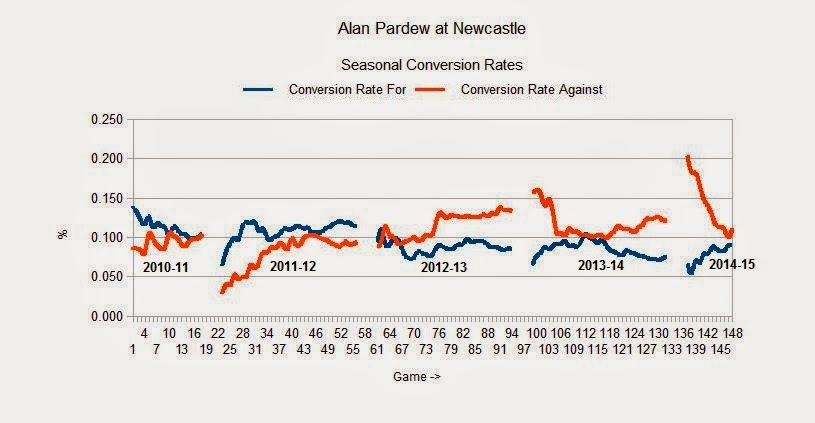
It took 8 games before Newcastle recorded their first victory of the 2014-15 season. Having broken that run they embarked on a 5 game winning streak that culminated in their famed 2-1 victory over Chelsea. More recent results have been mixed & include losing a home derby to Sunderland & being annihilated by Arsenal. Alan Pardew's most recent monthly managerial award has been, in the tradition of the award, something of a poisoned chalice. Their underlying statistics have been quite good, especially when compared to former years, but some typical problems remain; their +/- conversion rate remains firmly in the red and the long term trend is undeniable:
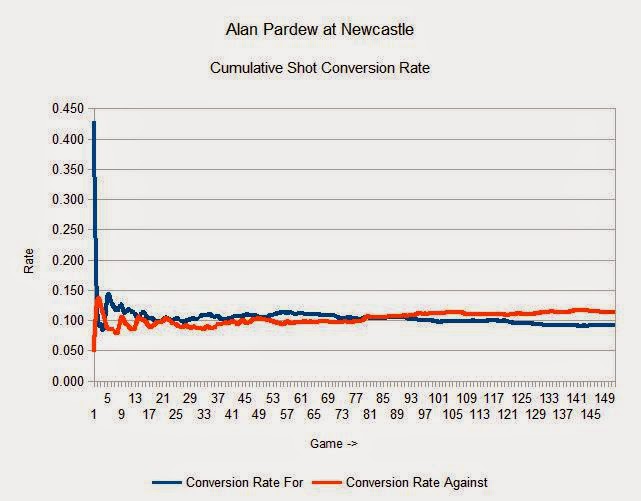
This underperformance in conversion stems back over two and a half years & has been a major driver in their underwhelming results in that same period. If we look at this table, simply achieving a league average conversion rate for/against (c.10% to all shots) since the start of 2012-13 could have been worth a swing of 56 goals.

It's not as if Newcastle have had poor strikers in this period. Whilst De Jong was a failure, Ba and Remy were both decent enough for Chelsea to subsequently buy them and Cisse has been a fascinating case of streaky conversion form. Some weeks ago Newcastle beat QPR 1-0 with a goal from Sissoko & that positive result lightly represented a wider truth: a career 8% shooter scored once in a game that Newcastle recorded 1 goal from 14 shots: 7%. Under par.
Could another manager remedy this?

'...we walk towards the stadium entrance slowly. Still immaculately attired & as grey-haired as ever, he looks every bit the urbane retired gentleman. Except of course he's not, he's the manager of this football club & he has been for half a lifetime, the longest unbroken tenure in a top flight job since Arsene Wenger retired back in 2027. The awards have stacked up over time; that 2011-12 Manager of the Year double win, a smattering of Manager of the Month nods & he's been shortlisted for the BBC North East Sports Award two or three times. 'King of the 4 game streak' they call him and he's proud of his record. He's not been relegated in over 35 years & has managed top half finishes on a number of occasions. Cup quarter-finals have been commonplace and the stadium now bears his name. A 60ft portrait adorns the space over the entrance and you're left in no doubt, this is now Pardew's town. He's candid and peppers the conversation with light humour but you're never in doubt that he's in charge. Did he imagine he'd be a Premier League manager for all these years? 'I was always confident in my ability,' he says, 'so the first 8 year contract made sense & when it was clear we'd always do enough to tick over, it was great that it rolled on in perpetuity. It's cast iron too, so they'll have to carry me out of here! But sure, I'm a football man; always have been, always will be & Mike has been good to me. The portrait was his idea & I thought it a good one. Winning the fans over has been difficult but we've got Stevie Ameobi back from Madrid, if his knees hold up we've got ourselves a player, so that gives us a lift & hopefully they'll stop bringing the banners this year.' '...............'
And so...
It has been well documented that Newcastle United have become a club that is highly conscious of the bottom line & over time recruitment has focused on less obvious players from smaller markets. It is against this backdrop that Pardew has worked & some aspects of his tenure have been successful. However, in a business where a good coach can extract maybe only a small percentage of improvement from his squad, he has provably come up short. The rolling points average is shown here:
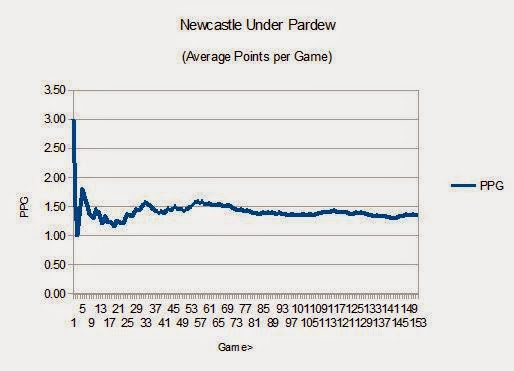
Alan Pardew has survived multiple bad runs & good form has become a minority situation for Newcastle over the last 3 years. Underlying statistics have shown few signs of improvement since the start of 2012-13 and continue to incorporate elements of underperformance. The most probable outcome is that this will be another season of general mediocrity punctuated by occasional lapses into poor form. For Newcastle to become a team that has similar aspirations to Everton or Tottenham or any other team that regularly finds itself challenging for the minor European positions, changes may need to be made. Otherwise, 8 years could seem a very long time.
MUFC vs Liverpool Positional Tracker
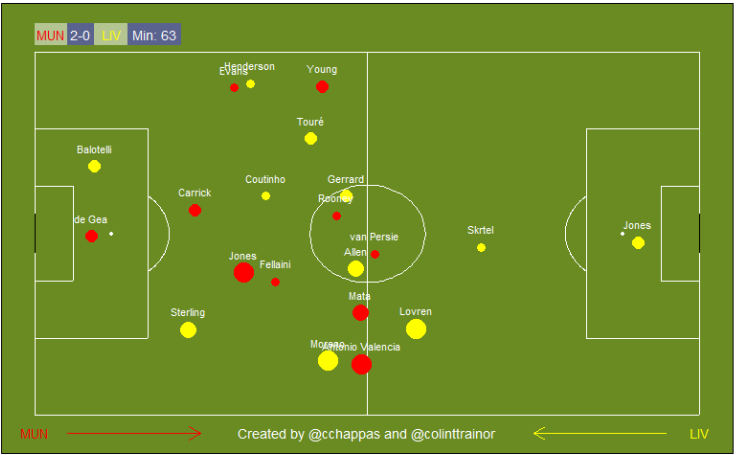
Man United 3 vs 0 Liverpool Here is our visualization that shows the smoothed positions of players around the time as indicated. As we don't have access to detailed tracking data we have tried to be as smart as we can with the "on-the-ball" data collected by Opta; we think we've made a decent attempt at trying to understand the flow of the game and the general positional trends of the players within the game. We know it's not perfect, but we'd need full tracking data to ensure that we have the exact positions of every player correct at all times. In the absence of full tracking data, hopefully people will find these visualizations helpful. Click to open viz in a larger window. A couple of my thoughts:
- Game was exceptionally compressed in the middle third during opening half hour
- Moreno totally neglected his defensive positioning during the first half. He is shown as further forward than Coutinho during nearly all of the first half
- In the second half Fellaini dropped right back to offer additional protection to United's defence
Why Alex Ferguson Doesn't Care About Your ExpG Models (PART TWO)
In part one of this piece, I said that Alex Ferguson’s 2012/13 Man United team drastically overachieved their expected goals total and I showed where almost all of the extra goals came from (in and around the edge of the six-yard box). In part two, I’m going to explain how United posted such an underwhelming shots profile despite being a dominant team.
Strangely enough, it all starts with Theo Walcott…
The ‘Walcott Effect’
At some point after the 2011/12 Premier League season, Paul Riley posted a piece in his blog about Theo Walcott’s crossing. In it, he described how rarely Walcott’s crosses found their target.
Here’s Riley,
“It takes [Walcott] nearly two games to put in an accurate cross. He crossed the ball 134 times last year. Only 18 (EIGHTEEN) of them found a teammate.”
But (more Riley),
“When you look closer at Walcott’s accurate crosses the only way to describe them is ‘devastating’. 8[1] of the 18 crosses have been assists.”
It’s counterintuitive: less shots, more goals.
Now you could chalk that down to fluke, or to some otherworldly finishing performance by the other Arsenal players[2], but Riley doesn’t buy it. He thinks that when Walcott’s good at ‘putting it on a plate’ for his teammates. He shows how 6 of the 8 Walcott cross-assists come deep inside the opposition box, and makes is easy to imagine how Walcott’s crosses are easier to finish than the deliveries of the ‘into the mixer’ crowd.
He’s convincing because it jibes with what you see when you watch football. Getting into the opposition box with the ball at feet is the scariest thing a wide player can do. That’s what makes the Theo Walcotts, the Angel di Marias, and of course, the Cristiano Ronaldos of this world so good. When they do that, everything goes to shit; goalies stay pinned to their lines, defenders abandon their assignments, and the whole time, they’re all too terrified to make a tackle.
Buuutttttt… But it makes it harder to cross the ball. Put yourself in Theo’s shoes. You’ve left your man for dead, you’re in the box with the ball at your feet. It’s nice that you’ve pulled all these players out of position, away from the men they’re supposed to be marking, but it means they’re coming for you! They’re blocking your shot, they’re clogging up your passing lanes, not to mention that unless you place your delivery within inches of your striker’s foot or noggin, he’s not going to be able to react fast enough to direct the ball towards goal.
That said, if you can manage to thread the eye of the needle, if that cross finds its way to a teammate, almost any shot on target is going to be a goal.
When you’re reading the stats, that looks like less shots, more goals.
Maybe you can see where I’m going with this…
Heating Up
Look at the wide players on that 2012/13 United team; Patrice Evra, Rafael, Nani, Antonio Valencia. There’s no messing about with ‘central wingers’ or ‘inverted fullbacks’, those are true-footed players with dribbling skills and real speed.
You like overlapping runs? Eat your heart out.
Those Walcott-esque crosses are the type of deliveries this 2012/13 Man United attack was designed to create.
Don’t believe me? Take a look.
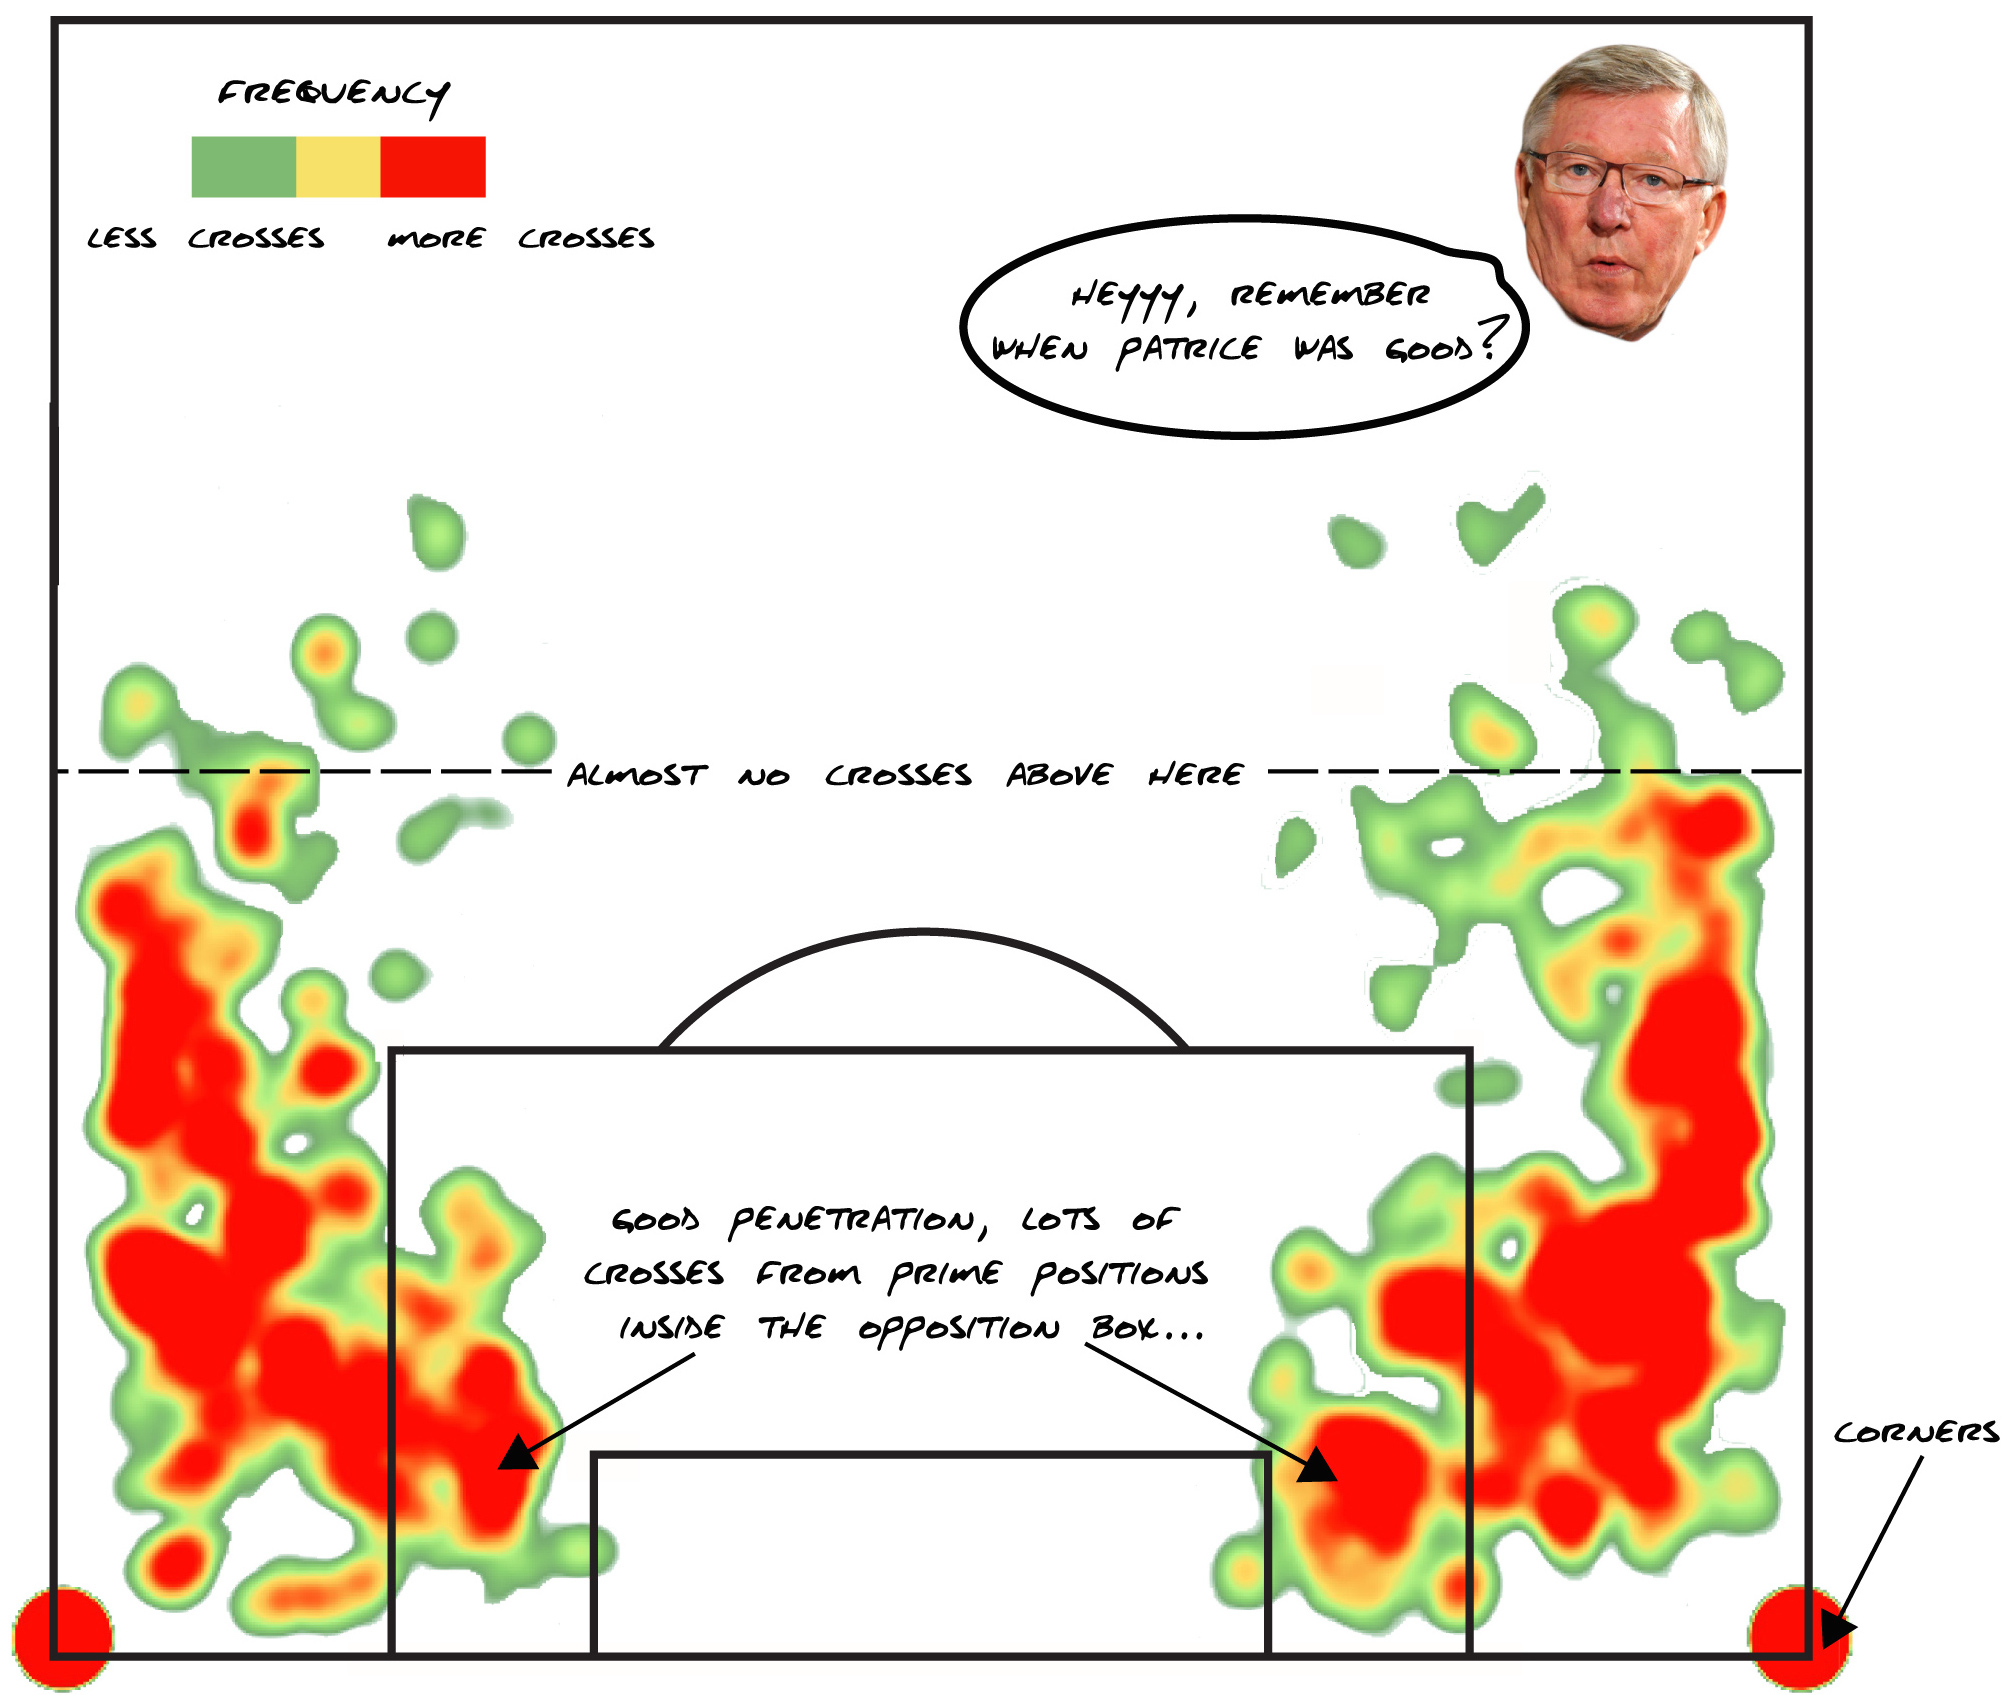
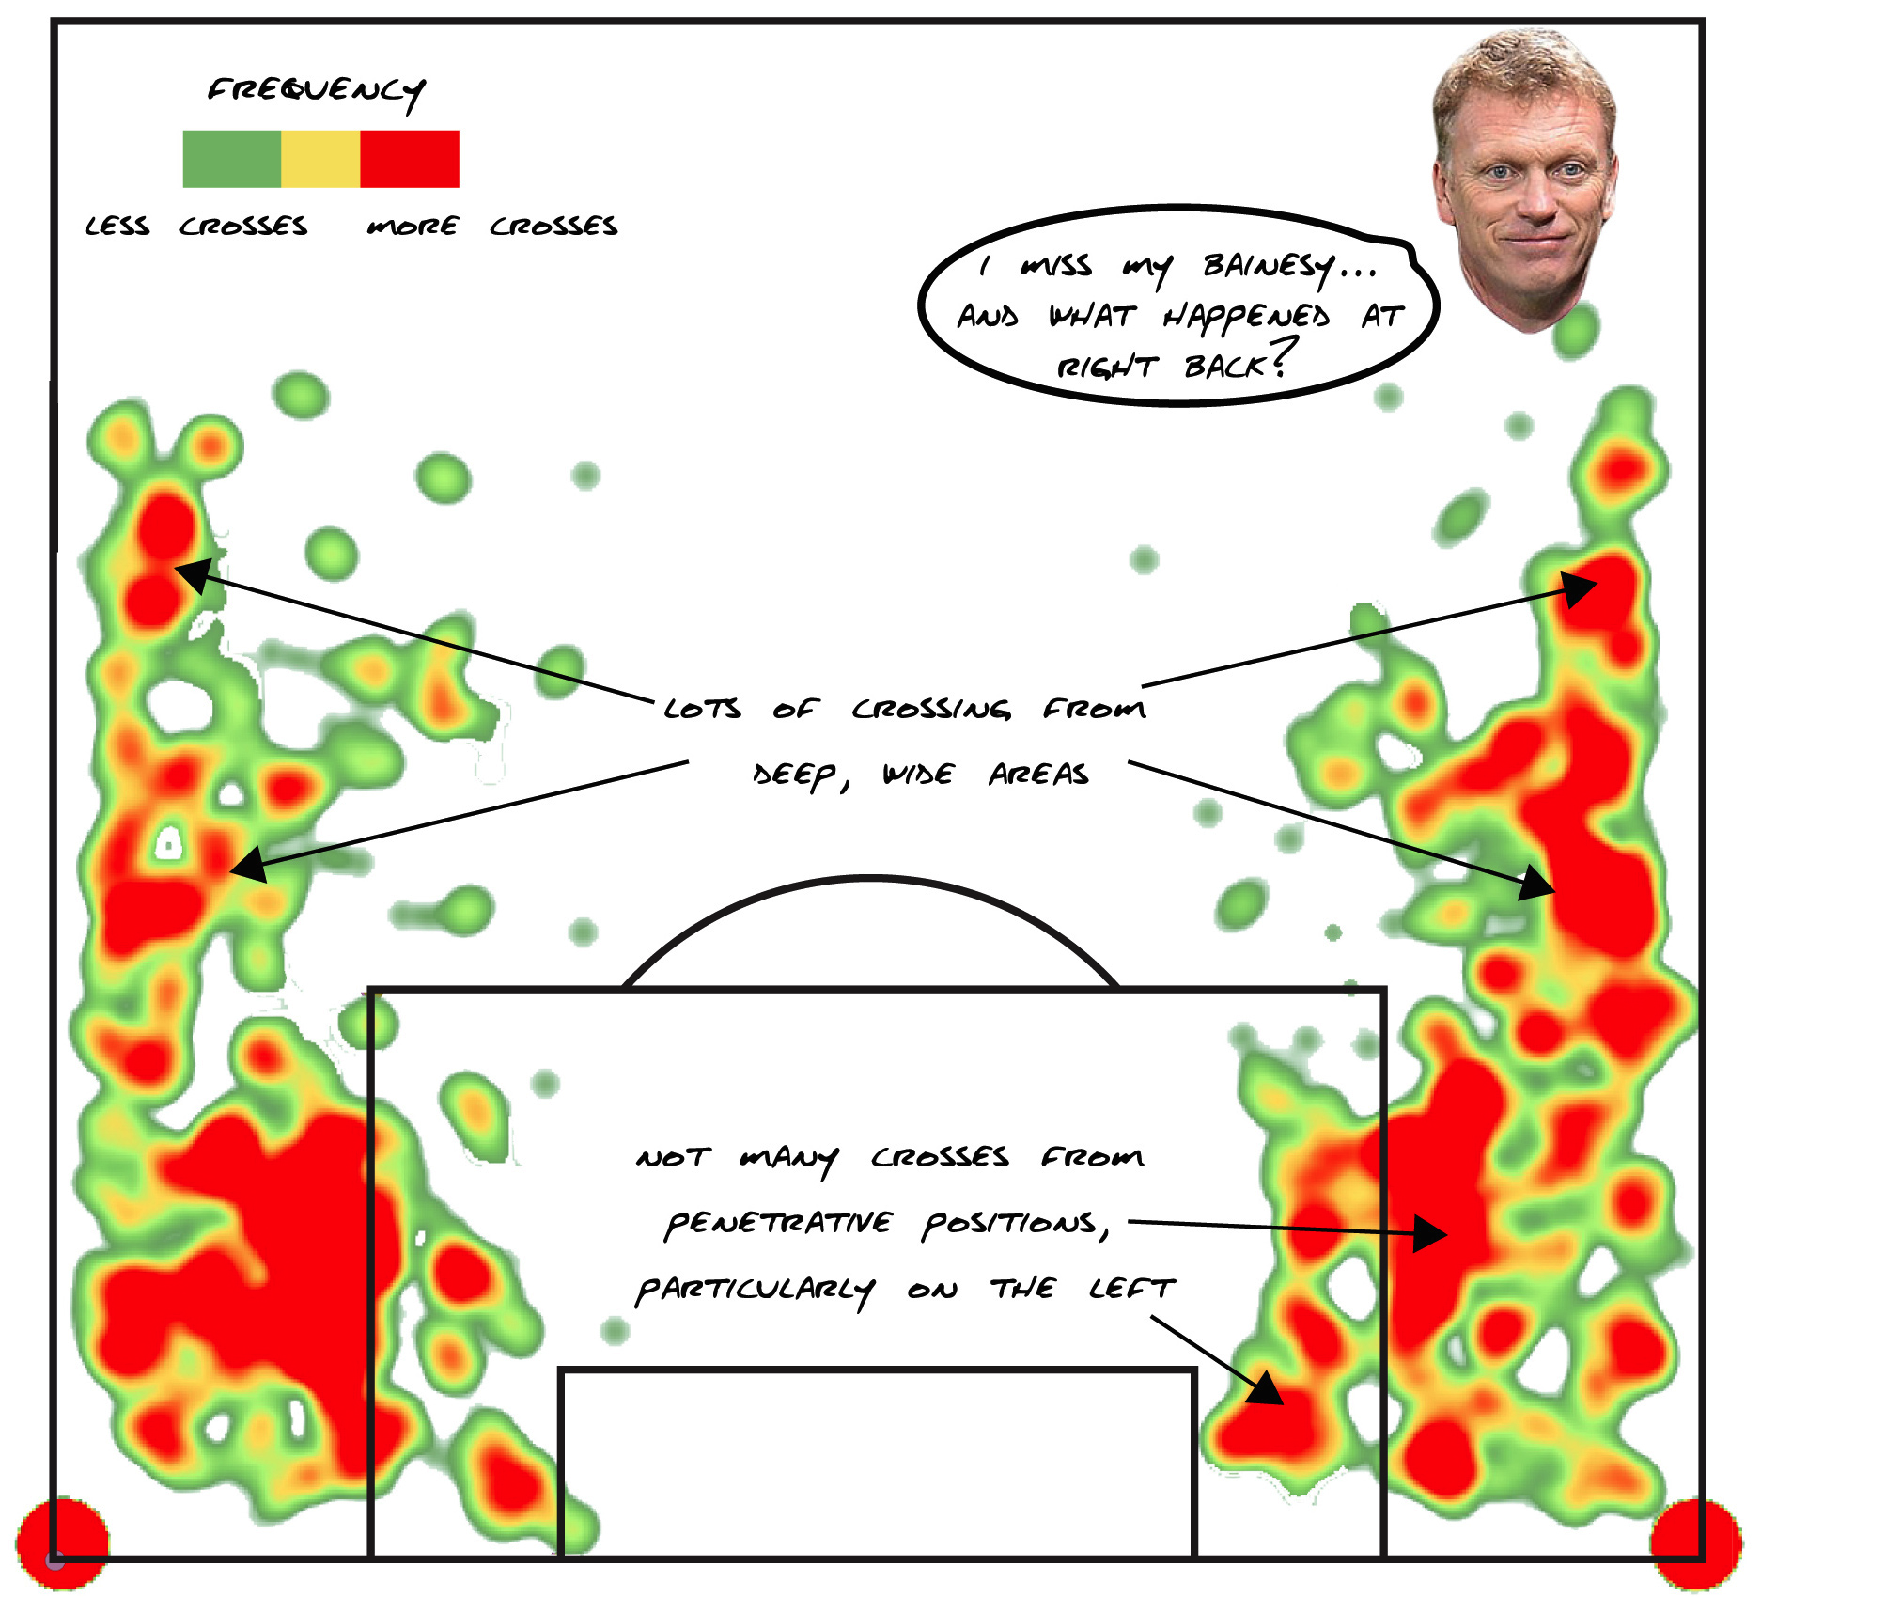
That’s a heat map of all the crosses United took in the 2012/13 season (actually I’m missing data from a couple of games, but you get the idea). The second, just for comparison’s sake, is a heat map of the crosses United took when David Moyes was in charge. The difference is stark, Ned Stark.
Both 2012/13 and 2013/14 United based their attacking philosophy around crossing. Under Fergie, United actually crossed the ball (~25 per game under Fergie vs. ~24 per game under Moyes).
It just didn’t feel like that.
‘Moyes’ men’ lobbed in a lot of crosses from deeper positions, and even when they got closer in, they rarely penetrated the opposition box. On the other hand, ‘Fergie’s buoys’ passed up on the lottery balls and frequently crossed from position deep inside enemy territory. I’m not putting that all on Moyes; Evra was on the wrong side of the aging curve; Rafael was in and out of the lineup with injury. But some it’s his fault; he tinkered constantly; he played guys like Phil Jones and Chris Smalling at fullback… But that’s a different discussion.
Why Fergie’s 2012/13 United Team Fucks Up Your ExpG Models
Phantoms. That’s what I’m calling them anyway. Goal-scoring opportunities that never have the chance to be registered in shot-based ExpG models, because they never turn into shots. These crosses are difficult to complete. It’s hard to pass through a thicket of defenders, and on the finishing side, it’s hard to react fast enough to get shot off. But make no mistake, even the ones that don’t make it to feet are (non-negligible) chances to score.
If you fail to take them into account, if you don’t include them in your expected goals models, you will be underestimating teams that use these tactics. Team like Alex Ferguson’s 2012/13 Man United.
Other Factors
The ‘Walcott Effect’ is not the only reason why 2012/13 United deceive ExpG models, but this article is already too long, and those other factors have been intelligently covered elsewhere. But briefly…
Robin Van Persie is Very Good at Scoring Goals
Robin Van Persie is an underrated passer, an intelligent runner, and has perfect balance and technique. He’s very good in any type of offense, but he was the perfect finisher for this ‘drive and kick’ style offense.
Robin Van Persie is Great at Taking Set Pieces
Possibly the one thing Van Persie does better than finishing is taking set-pieces. In case watching Arsenal struggle flounder on set-pieces over the last few seasons wasn’t enough, this is Mike L. Goodman writing for Grantland:
“Last season (2012/13), in the attacking third when van Persie was on the field, he was responsible for 49.8 percent of all free kicks taken by United.”
And that for a side which overachieved its ExpG values from set-pieces by a pretty ludicrous margin.
Winning Penalties and Scoring Own Goals Can Be a Skill
There’s a good deal of luck that goes into getting these freebies, but you have to think that a team which specialises in putting the ball at the feet of quick-footed dribblers who attack the box (and whip in balls from the byline) has a good chance of getting a few of both each season.
The 2012/13 Man United vintage was not lucky, it was a dominant team that had the title race sewn up by April. Fergie’s ‘buoys’ were well trained at set pieces and they had an elite finisher in Robin Van Persie. But that extra ‘oomph’ in conversion rate? That was the result of phantoms: goal-scoring opportunities that don’t show up as shots. It’s not sorcery, it’s not special sauce, it’s not some kind of cosmic imbalance. It’s just what a ‘drive and kick’ offense looks like on a football pitch.
[1] Riley actually says 6 of 18, but then goes on to talk about 8 cross-assists, so I think it’s 8 of 18. [2]
After all, he was playing with Robin Van Persie that year.

Southampton v MUFC Player Positional Tracker
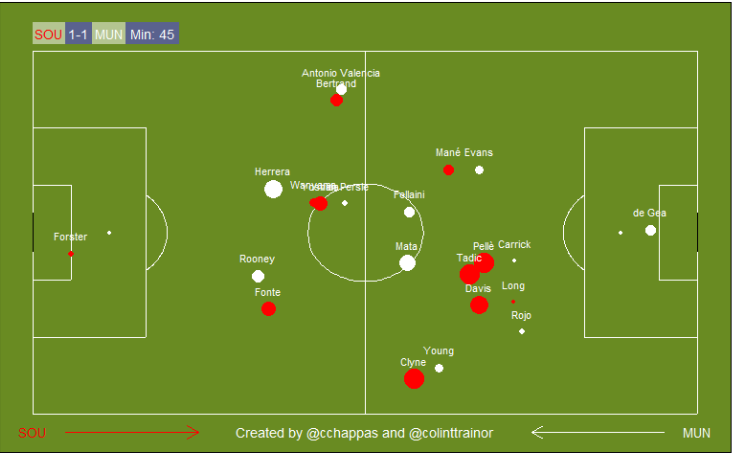
Southampton 1 vs 2 Man United Here is our visualization that shows the smoothed positions of players around the time as indicated. As we don't have access to detailed tracking data we have tried to be as smart as we can with the "on-the-ball" data collected by Opta; we think we've made a decent attempt at trying to understand the flow of the game and the general positional trends of the players within the game. We know it's not perfect, but we'd need full tracking data to ensure that we have the exact positions of every player correct at all times. In the absence of full tracking data, hopefully people will find these visualizations helpful. Click to open viz in a larger window. 
Newcastle v Chelsea - Player Positional Tracker
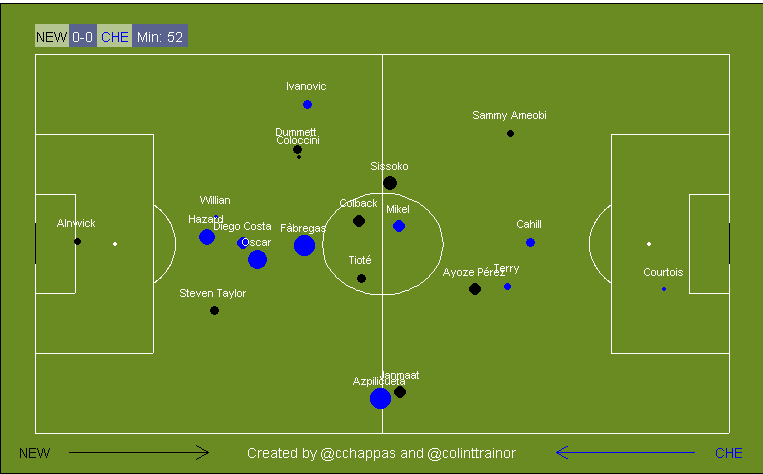
Newcastle 2 vs 1 Chelsea
Here is our visualisation that shows the smoothed positions of players around the time as indicated.
As we don't have access to detailed tracking data we have tried to be as smart as we can with the "on-the-ball" data collected by Opta; we think we've made a decent attempt at trying to understand the flow of the game and the general positional trends of the players within the game. We know it's not perfect, but we'd need full tracking data to ensure that we have the exact positions of every player correct at all times. In the absence of full tracking data, hopefully people will find these visualisations helpful.
I don't have much time this morning (which has been the case for the last month or so) so I am only pointing out a couple of very noticeable features from my watching of the PPT below.
- In the early stages, Newcastle were quite agressive with Ameobi and Dummet playing high up the left wing. Was this deliberate to keep Ivanovic in check?
- Newcastle had a decent spell of possession half way through the first half, with Sissoko especially involved during this time
- I was surprised at the absolute lack of width displayed by Chelsea; it was virtually non-existent in the opening hour. At times Chelsea had 5 players in the central attacking part of the pitch; Willian, Hazard, Oscar, Diego Costa and Fabregas
Anyway, let me in the comments know what else you see, and you can click the image below to open in a larger window.
Alex Ferguson Doesn't Care About Your Expected Goals Models
The Past is a Foreign Country; That’s Why It’s So Easy to Critique
When the facts have seeped out, when you’ve had time to think things through, it's all so obvious: Germany had the best, deepest squad in the tournament; Luis Suarez can make any manager look like a genius; and "c'mon, you never realised he was on 'roids?".
Haha! Totally joking about that last one... Totally. #GTL.
But some things defy explanation, they just sit there as you examine them, laughing back. Some things are like Manchester United’s final season under Alex Ferguson.
Okay, maybe I’m overstating it a little, but that 2012/13 season is a puzzle.
United cruised to the title, closing things out at Villa Park with a couple games to spare. RVP, Shrek and the Buoys clubbed together to score 82 goals in 38 games, gifting Alex Ferguson his 13th and final Premier League title.
So far, so good.
What's odd is that United posted the stats profile of a good, but certainly not great, team. Total Shot Ratio (TSR), usually a pretty good indicator of quality, ranked United in 8th place for the 12/13 season, sandwiched between Southampton and Newcastle. On its own that's not a game-changer, after all, TSR would have put Spurs atop the league that same season. But even Expected Goals (ExpG) models, which take into account more complex shot data like distance from goal and where the pass prior to the shot was played from were are flummoxed by how this version of United so drastically outperformed expectations.
Whatever Remains, However Improbable, Must Be the Truth?
That, apparently, is the opinion of Dan Altman.
"I computed the probabilities for the 2012-13 season... For Manchester United, the difference between expected goals and actual goals was sixteen. Without those sixteen goals, Manchester United probably would have finished fifth instead of first."
That's a quote from Altman's latest piece in the New Yorker on the same topic, in which he uses his bespoke shots model to break down exactly how United overachieved offensively.
His conclusion? Multi-dimensional luck (more or less)[1].
Luck on penalties and own goals. Luck on free-kicks and corners. And then some more luck converting chances in open play. He says that if you ran the season back in his shots model, United would be extraordinarily unlikely to score such a high number of goals again. In which case, the team probably wouldn’t have won the title, in which case, Alex Ferguson might not have been quite so quick to retire, in which case the world would be short a great wordsmith, (and Davey Moyes wouldn’t be aging in dog years).
Altman’s points are pretty convincing, especially in the light of how much United have struggled since then, but even he admits that the odds of this level of over-performance are pretty fracking long.
Which is why there might be a different answer. I’m not saying he’s wrong, but I think there’s an explanation that demands shorter odds.
Just In Case, Here’s What We’re Looking At
Usually, when I'm looking for an answer, it helps to take things down from the abstract clouds of ExpG models and put them into a form that’s more easy to understand.
Here’s Man United’s shot chart from the 2012/13 season.
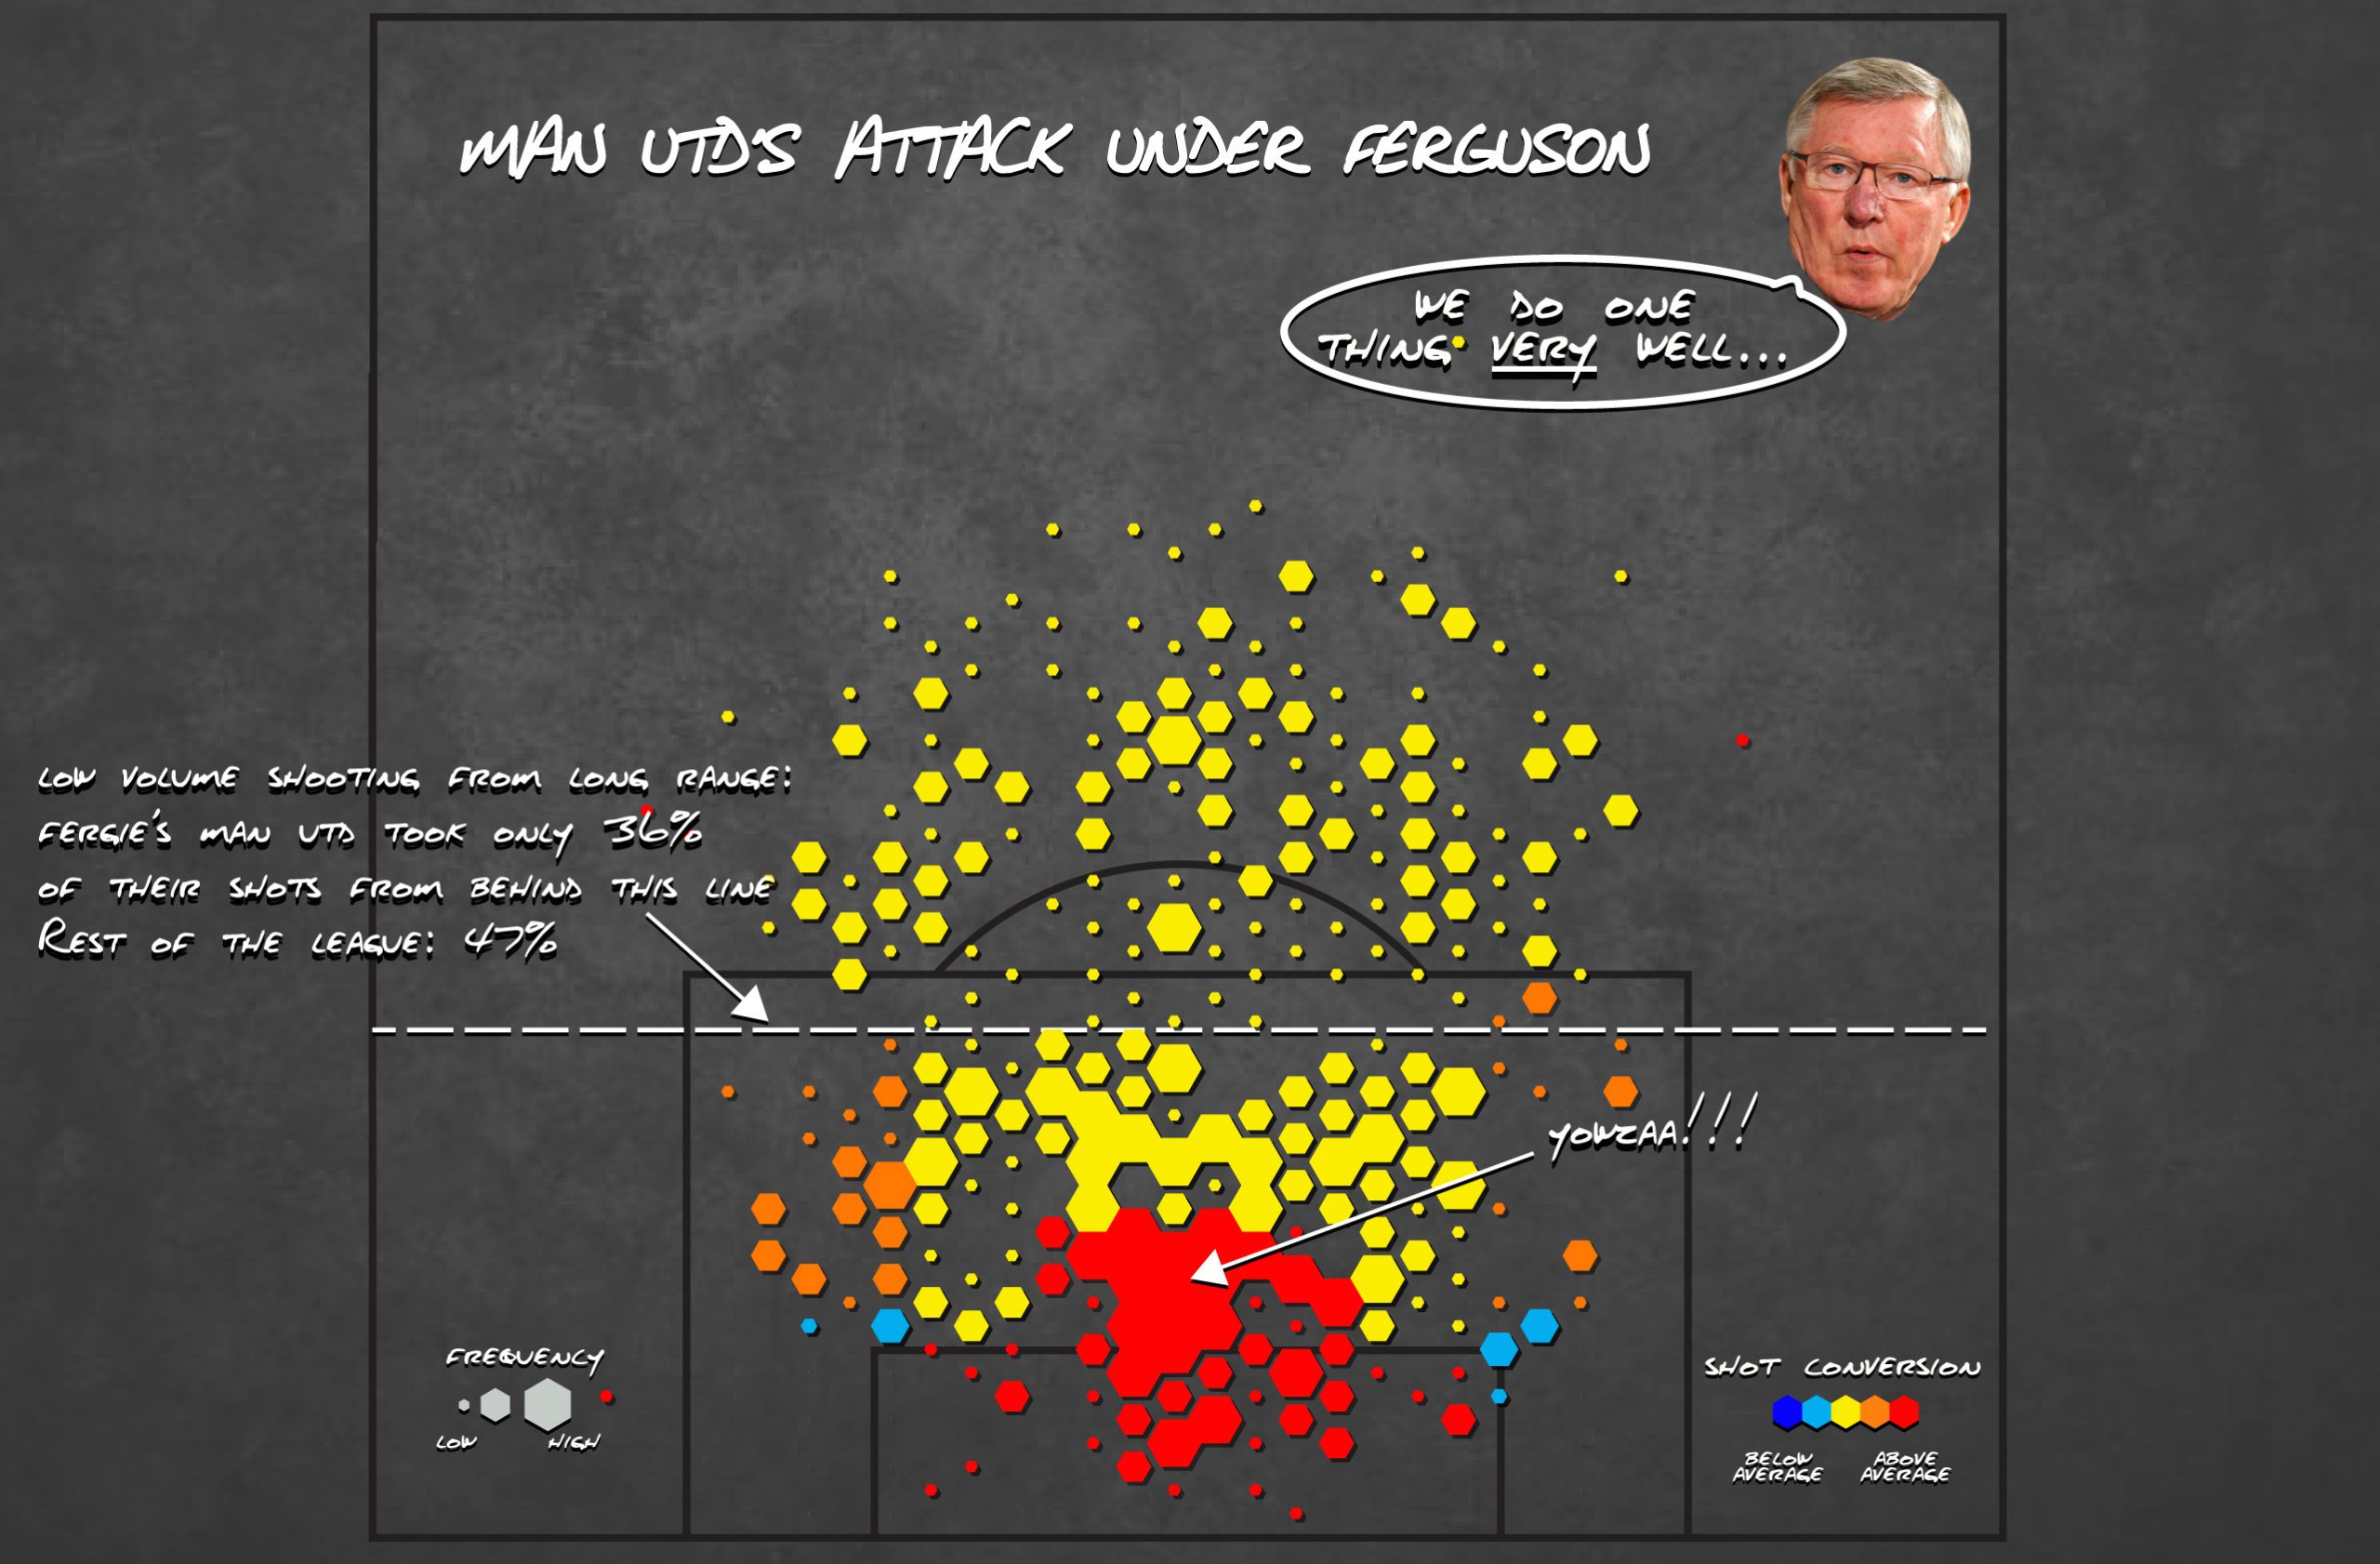
One thing is probably going to stick out to you - that big red clump with the YOWZA!!! annotation (or maybe you're a data hipster, in which case you're probably into the five light-blue hexs). When Altman says Man United overachieved their expected goal output, this is why. In Fergie’s last season, Man United took the juiciest shots in the game (close to and directly in front of goal) and squeezed, and squeezed, and squeezed some more. The shots in that bright red area were converted at roughly 13% above what you would expect the average Joe (Allen) to do with the same opportunities. By my calculations, based on the number of shots, that's worth somewhere between 17-18 goals over the course of the season.
(I swear I'm not making this up...)
Now, Marco Van Basten’s one hell of goal-scorer, but a) He retired in 1995, and b) He never played for United. Robin Van Persie did, but he's just one (non-superhuman) dude, and he didn’t take ALL of those shots…
At any rate, other than that one scorching zone, United are surprisingly average finishers – a couple points stronger on the wings, but nothing to write home about[2].
Hmmm…
You have to say, it doesn’t look completely random. It’s not like United are lights out from a bunch of unconnected areas. This is a team that is PHENOMENAL at scoring in one area.
Why? Well if you want answers this morning, you’re shit out of luck. I’m tired and I’m looking forward to the latest episode of Serial.
Tune in for part two tomorrow.
[1] I’m shortchanging Altman a little bit here. He also talks about things like RVP's finishing quality, but you can read it yourself, ‘cause, you know, the Internet.
[2] Interestingly, this version of United doesn’t shoot a lot from distance, which probably goes some way to explaining the low TSR numbers, if not the ExpG anomolies.