Although my statistical based model has been a fan of Liverpool for most of the season, I've gone on record the last couple of weeks to state that I think the market (and probably the wider public) are now over estimating the chances of Liverpool winning the league. What is the Market saying? Right now, the Betfair Premier League outright market looks like this: 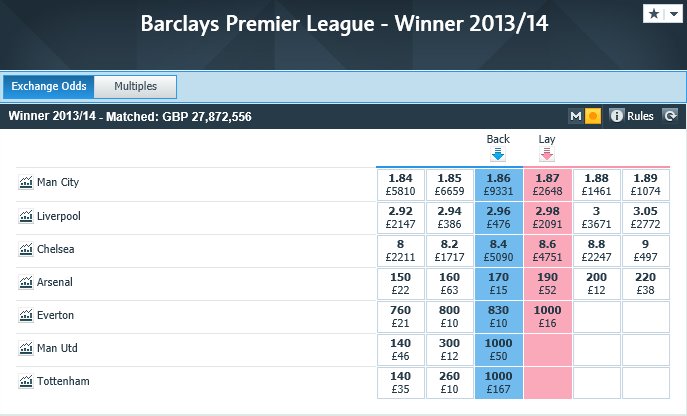 For those that aren't familar or comfortable with betting odds, the above Betfair market suggest that the chances of winning the league are as follows: Man City 54% Liverpool 34% Chelsea 12% How do I view the Title race? Looking at the predictions generated by my stats based betting model which have been ran through 10,000 simulations my current probabilities are:
 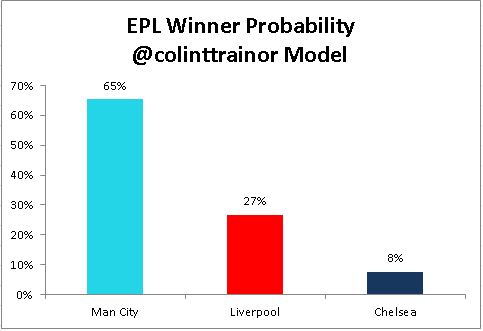 Someone asked me on Twitter why I was so bullish on City, and correspondingly why I was giving Liverpool less of a chance of winning the league than most others. I've had a look at the engine of my model and it looks like there are two main reasons for this: 1 - I rate City as marginally the better team; and 2 - City have 5 of their remaining games at Home. They are an impressive team at home, and given the quality (or lack of) of the opposition that they will face at home it wouldn't be unreasonable to think that City will win all 5 of those games. Of course, I am aware of the fact that the title is in Liverpool's hands and if they win all of their remaining games then they will most definitely have been deserving winners, but as a gambler I work on probabilities - and I see Liverpool winning the league just slightly more often than once in every 4 runnings of the 2013/14 Premier League. Predictor Anyway, that's enough about what I think. So who do you think will win the league? For those who would like to make a logical estimate of who should win the league I am attaching a small Excel spreadsheet in this zipped file: EPLPredictor (It is probably best to choose "Save As" when the dialogue box opens.) The file is easy to use, all the remaining league fixtures for Liverpool and Man City are listed. All you need to do is enter your estimate of the Home and Draw probabilities for the remaining games and the sheet will do the rest. Hopefully the act of inputting your probabilities and seeing your predicted final league table based on the expected league points will let you see the size of the task that Liverpool have ahead of themselves if they are to win their very first Premier League crown. It is possible, but I believe there is just a 1 in 4 chance of 2013/14 being the season that this occurs in.
Month: March 2014
Transfer Quick Hit: Josip Drmic

I was writing a broader Premier League piece this morning, when the Drmic to Arsenal rumor again flashed up on Twitter. Since most people have probably never heard of him (including me as of February or so), I figured I’d give a brief profile and opinion. Age: 21 Position: Forward/AM (Right) Nationality: Swiss Current Team: Nurnberg 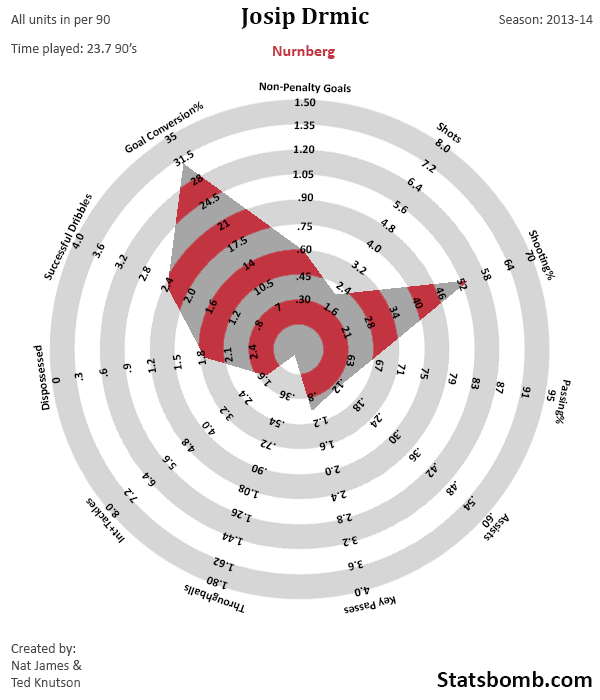 The Good Stuff Alright, ignore the goals information for a second, because that needs some context. The stuff Drmic is doing really well right now is getting shots on target and dribbling the ball. He’s also scoring at an excellent rate - .60 non-penalty goals per 90. However… A lot of that scoring is fuelled by a crazy conversion percentage that’s over 30 right now. No one sustains that over a full season. Not ever. On the other hand, his scoring rate at that age (just 21) in that league (the Bundesliga) is a big deal. Watching footage, it’s hard not to like him. He’s got decent pace, seems really clever in and around the box, and his shot locations are excellent. He’s also finished about half his goals with his left foot and half with his right, which is another good sign, and finally, he’s had less than 10% of his shots blocked. He’s also pretty good at starting wide right and then coming in to get off good shots, not unlike Arsenal’s current favourite right wide forward, Theo Walcott. For some reason, RWF is one of the hardest spots to fill, so having a two-footer than can score goals as a backup option seems like a good plan. The Not So Good Stuff That passing percentage is a pretty serious frown, especially since I expected it to have a heavy skew toward headers, and according to Squawka, it doesn’t. For forwards who aren’t heading the ball that often, you really want that number to be in the mid 70’s.
 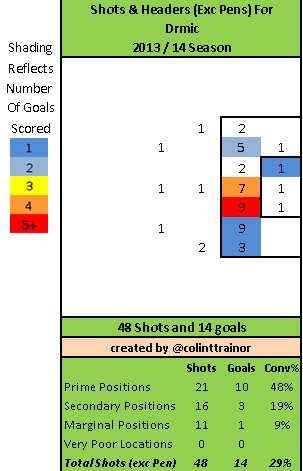 “He makes Luis Suarez look like Oliver Giroud!” – Colin Trainor Now we come to the uncomfortable truth. Colin whipped up the shot chart in his magic database and before this weekend found that Drmic had 15 goals from about 6.5 expected. As noted above, that conversion percentage is ridiculous and unsustainable over the long term. Would he even be on the radar if he were converting at an average rate? Even “high” conversion rates are not likely to be sustained year over year, so this is a bit of a red flag. Additionally, he’s not a shot monster (right now). He’s doing alright at getting his own shots (2.2 per 90), but it’s not like he’s up there with Ronaldo, Bale, or Suarez and just wrecking teams by himself. On the other hand, that could happen if he moves to a better team – Nurnberg are current relegation candidates. Verdict I like him if and only if, someone purchases him as a bargain buy (say £8-10M). .60 NPG90 at age 21 in the Bundesliga is a really strong indicator of current and future potential. However, he’s not a shot monster (under 2.5 per90), his passing percentage is just plain rough, and we probably wouldn’t even be talking about him if he weren’t boasting that crazy conversion rate right now. On the other hand, his rate at his current age, his current ability to dribble, and the fact that he will likely get better when surrounded by better teammates all work in his favour. It might not be Arsenal, but assuming Drmic’s relegation release gets activated, someone is likely to get an excellent young player at a pretty good price. Peep the touch at the 30 second mark below for pure filth. [youtube id="bNlC6-pdF-E" width="633" height="356"]
Six Points From 1st but Have Arsenal Gotten Worse?

Simple question: Have Arsenal progressed this year? Are they better than they were last year? To answer these questions I am going to post 4 graphs which that will get us part, if not all, the way there. So, we compare certain metrics from the 12/13 season to the 13/14 season, using league data only (incentives).
TSR/Shots Share%/Corsi/Whatever

These charts show Arsenal's rolling share of the shots taken throughout their fixture lists. Arsenal were recording a higher percentage share of the shots in 12/13 than they currently are in 13/14. This is not a good thing.
Some folk may point to shot quality/locations but there's usually a reason that teams take less shots and/or concede more shots and, usually, those reasons aren't positive.
Shots On Target Ratio

A bit noisier, but a few things stand out: This time last year once the horrendous injury list had eased Arsenal went on a season saving run of form to finish 4th ahead of the Tottenham. A part of that form was due to an improvement down the strecth in Arsenal's SoTR which picks up from game 23 or so and finished a fraction shy of 60%.
This season (13/14) Arsenal's SoTR was pretty good, if not elite, for the first 22 or so games before nosediving. Injury lists play their part, as do quality of opposition issues. Still, it appears that Arsenal won't be able to equal last years ~59% SoTR number. Arsenal's 13/14 number is currently at 55.3%.
Goal%
Goal% = Goals for/Total Goals(goals for+goals against)

Goal% is driven by a teams shots and target ratio and its PDO number. Arsenal's 12/13 number consistently improved from around the 10 or 11 game mark - driven by SoTR (above) and an improving PDO.
Arsenal's 13/14 Goal% was driven by good, not great, SoTR and a super high PDO that was at 110 or higher for 21 of the 31 weeks of the season so far. League average PDO is 100. Teams who spend a high amount of minutes in leading positions will post PDO's north of 100.
We can see that Arsenal's 13/14 Goal% has cooled off and this is due to SoTR cooling off by a few percentage points and a gradual cooling of PDO.
Points%
Arsenal's shots and shots on target numbers may not have convinced everyone that there is real year on year decline and that's ok. Maybe goal% didn't convince anyone either! How about we look at points% then?
Points% = points/total points available

This graph is super cool in a scary kinda way. We can see that Arsenal showed amazing improvement in the second half of 12/13 (SoTR, PDO improved). Arsenal's 13/14 season looks like it is going the other way. Decline, decay, injury-hit squad unable to cope with a tough sked, tactics or whatever. It is a frightening graph.
Whichever we slice the information it doesn't look good:
- Arsenal have a significantly lower TSR year on year.
- After a good start to the season in SoTR (easy sked?) Arsenal's number has cooled in recent weeks and is now worse than 12/13's SoTR number.
- Goal%, driven by a high PDO and some good SoTR numbers has cooled and now sits below 12/13's number after the exact same number of games.
- 13/14 Points% remains the only stat that is currently better than 12/13, but with a poor TSR, declining SoTR and PDO numbers Arsenal's 13/14 Goal% may come dangerously close to touching 12/13's number.
In short: Context is important, inuries to key talent, lack of striker and wing options may have handicapped Arsenal's ability to post better underlying numbers. The question is by how much have those issues handicapped Arsenal? We don't know. Arsenal may well surpass last seasons points total but they may well do so having posted poorer shots and shots on target numbers. People may point to shots quality (and some score effects) and say "who cares if they are shooting less but shooting better" and you know what, maybe they're right, but for me I would rather a team posts high percentages of the shots and shots on target share whilst still trying to take the very best quality of shot that they can.
10 Points: Liverpool's Title Charge, Southampton's Season, Save% & Home/Away Form

1) Goal Of The Week #1: Wayne Rooney
OK, we'll ignore that the 'keeper stumbles around like a 3am drunk outside a kebab house and instead focus on Rooney's wonder hit from just inside the West Ham half.
2) Slowdive (Southampton)
What's happened to Southampton these days?A late loss away to Tottenham isn't the trigger to start a debate on Southampton's season that's for sure. But do you recall Southampton's hot start to the season and talk of a European push on the back of their defensive solidity? Yeah, well then this happened:
Southampton were cruising along at 'top 4' pace for the first 11 games and then the wins dried up. So what went wrong?
Not much wrong here. TSR has improved slightly to ~59% and SoTR has cooled to ~57%. Both numbers are pretty darn good. Still, we haven't found what went wrong, maybe we need to look instead at what went right for Southampton in those first 10 or 11 games.
This is Southampton's rolling points per game, rolling PDO and rolling save%. See the early season spikes?
Southampton were cruising at 2 ppg for the first 11 games off the back of some good shots numbers (gr. 2) but more likely is that Southampton's excellent points haul for the first 11 games was a mirage. A mirage built upon an unsustainable PDO (112.1 at game 11). That PDO was mainly driven by a bananas high Save%. Neither save% or PDO are particularly stable or repeatable metrics.
Southampton haven't done much wrong this season. The club has some excellent players, they play nice football, post excellent shots numbers but their Save%, once so kind and supposely tactics driven, has crashed. A change in tactics, L&*$, injuries, or a drastic, almost unheard of, change from where opponents shoot from could all be causes.
Linking save% to a cooling off of Southampton's points per game number is a quick and dirty analysis. Some may say overly facile, but it fits and right now, without talking about any of that bullshit like chemistry, or belief or confidence, the beautifully crashing arc of Southampton's save% may well be the the single biggest contributor to Southampton's failure to maintain early season ppg pace.
3) Premier League Save%
Speaking of Save% (goals against/shots on target against) let's look at each teams save% and visualize just how it regresses over the course of the season.
Notice the early season "noise" and then the gradual tightening of the pack. Southampton's save%, the league's best at game 11, was held up as evidence of an excellent defensive system. Southampton's save% is now the worst in the league.
Personally, I wouldn't put too much stock in save% as an evaluator of defensive performance.
4) Teams Get Wrecked. Don't worry about it.
Man City 5-0 Fulham Chelsea 6-0 Arsenal Cardiff 3-6 Liverpool Aston Villa 1-4 Stoke. Three of these results are born of similar circumastances, the other is not. Man City, Chelsea and Liverpool are likely the three best teams in the league this season and, occasionlly, these teams wil wreck their opposition. They have the firepower, the systems and the individual personnel to run up the score if the opposition is weak or having a really bad day (Arsenal). Aston Villa vs Stoke is a horrible result if you are a Villa fan, but games like this will happen with a young team who spends tons of money on players who are so bad that they pay those players to stay away from the football club. Villa are fine, and so is Lambert, probably. Patience neeeded. As for the other teams blown out this weekend and all across the previous game weeks by the big 3, shit happens. If you are unfortunate enough to play these hugely talented teams when they are hot, then good luck trying to hold back the tide. City have wrecked teams better than Fulham (Tottenham x2, Arsenal, Nnited, Newcastle, Norwich). Liverpool seem to wreck everyone and Chelsea have the talent, if not always the desire, to run up the score. Arsenal fans will be embarrassed by that 6-0 but it shouldn't lead to a mass wringing of hands and pulling out of one's hair. Arsenal were terrible, Chelsea were awesome. Next up for Arsenal is Swansea. Arsenal will likely win. Blowout's are embarrassing but they usually aren't a genuine indicator of the gap in talent between two sides. Nor should blowouts be a lightning rod for all the supposed ills that a club has. Most blowouts are a caused by hot shooting/bad defensive plays, terrible player decisions, heads dropping. Some of these things can be fixed in time for the next fixture. As Arsenal will demonstrate on Tuesday.
5) Wish Fulfillment
Liverpool could be just 8 short, cup tie-like games from one of the most unlikely title wins in PL history. 28 points off of top spot last year, Liverpool are on course (using ppg) to record ~82 points and that my friends is some turnaround. Reasons for such improvement in no particular order so as not to anger the (sometimes) sensitive section of Liverpool fans: Suarez, Rodgers tactics, L*$^, Sturridge, counter attacking philosophy, score effects, improvement of Henderson and Sterling, Gerrard at DM. Add all these up, plus plenty more, and you get a perfect storm of skill and circumstances that have helped smash Liverpool through all pre-season expectations and onwards toward the PL title. Can Liverpool win it? Well, my opinion has changed over the last few months August Top 4 would be an amazing achievement. September Liverpool's underlying numbers are poor and down YonY. No top 4. October Suarez returns and apes Papiss Cisse and everything he hits goes in (allow me the odd creative exaggeration!) November Mixed bag. December The crushing of the weaklings begins. Top 4 is likely on. January Liverpool carry on winning, the top 4 is a real possibility now. February top 4 cemented. Could they win the title? March Holy shit! Liverpool may win this thing, but likely won't. Now, we have just two months left in the season, Liverpool are just 4 points off the top (and with a game in hand) and with home fixtures against the two titans of the PL to come. It is a real, if slightly exaggerated, possibility that Liverpool may win the title. You know what, I have a problem with the usage of the word "exaggerated" in that previous sentence. I can think of reasons why Liverpool can win the title but not many reasons why Liverpool cannot win the title. Why can't Liverpool win this thing? Is it because we don't see Liverpool as an established power with a recent history of top 4 qualification behind them? Is it because Rodgers isn't a big name? Is it because Liverpool concede too many goals or that SaS are seemingly going to run forever hot? Yes, Liverpool may have had some of the conversion percentages run their way this year but Liverpool are also posting some amazing stats in terms of share of the shots on target at close, tied and overall. Maybe Liverpool will win this thing, and if they do they deserve credit in the places where it is due. We have all summer to pick at those other, weak places where Liverpool's "l*$^" held firm (shots locations against, scoring%, SaS conversion%.) This section was just an excuse to post this song...
6) Points Per Position
Really simple idea this one: If we take each position in the table and divide that teams points by the number of games played we can create a points per game (PPG) number for each position. What I have then done is place each positions PPG number and placed it against the ten year PPG average for that league position. So how does 1st place in 13/14 shape up vs the 10 year PL average for 1st place? 17th to 10 year average for 17th?
Man City (3rd) and Tottenham (5th) look of out of place in the PPG curve. The bottom 11 teams, as a group, are underperforming against the 10 year average. The top 9 teams are overperforming.
I wouldn't think about this year over/under performance too much. It may or may not be a quriky season. There may also be some levelling out of the over/under performance, but right now, with just 8 or 9 games left, I'd doubt it.
7) Home & Away Form
I could present a table listing each teams win/loss record and points won on the road, but that's too easy found in various places online. Instead, I am going to present home/away tables using each teams TSR (share of the shots), SoTR (share of the shots on target), Goal% (share of the goals) and PDO. If a teams Goal% is significantly higher than their SoTR then the difference is shooting percentages for and against. Home
| Home | TSR | SoTR | Goal% | PDO |
|---|---|---|---|---|
| Arsenal | 60.2 | 64.2 | 78.8 | 115.3 |
| Aston Villa | 50.6 | 47.6 | 40.9 | 90.5 |
| Cardiff | 42.3 | 39.0 | 38.3 | 99.1 |
| Chelsea | 68.1 | 68.8 | 81.3 | 117.7 |
| Palace | 47.8 | 50.4 | 41.9 | 91.3 |
| Everton | 58.6 | 64.1 | 69.0 | 106.0 |
| Fulham | 46.6 | 48.4 | 36.7 | 85.1 |
| Hull | 51.2 | 51.6 | 54.3 | 103.0 |
| Liverpool | 64.3 | 69.3 | 77.8 | 113.0 |
| Man City | 68.0 | 67.8 | 84.2 | 128.2 |
| Man United | 61.0 | 60.8 | 54.5 | 92.7 |
| Newcastle | 61.0 | 60.7 | 50.0 | 87.3 |
| Norwich | 52.8 | 53.3 | 55.6 | 102.0 |
| Southampton | 64.1 | 62.5 | 54.3 | 86.7 |
| Stoke | 48.2 | 50.4 | 58.3 | 109.9 |
| Sunderland | 46.3 | 38.8 | 38.2 | 99.3 |
| Swansea | 54.9 | 56.1 | 53.1 | 95.5 |
| Tottenham | 59.1 | 54.2 | 47.5 | 92.5 |
| West Brom | 54.6 | 50.4 | 45.7 | 94.1 |
| West Ham | 42.8 | 42.5 | 47.6 | 106.5 |
| LEAGUE AVERAGE | 55.1 | 55.4 | 56.3 | 101.1 |
Man City are crazy good (~85% of the goals) and have benefited from a PDO so high it may as well be orbiting the Earth. The actual top 4 post the 4 highest PDO's, some of this is due to things like systems, talent, score effects. Away
| Away | TSR | SoTR | Goal% | PDO |
|---|---|---|---|---|
| Arsenal | 47.4 | 49.4 | 50.0 | 100.8 |
| Aston Villa | 43.5 | 46.8 | 48.4 | 101.7 |
| Cardiff | 33.9 | 30.5 | 21.6 | 88.1 |
| Chelsea | 56.4 | 62.9 | 62.2 | 99.1 |
| Palace | 42.1 | 38.1 | 22.2 | 84.6 |
| Everton | 51.4 | 48.2 | 45.2 | 96.6 |
| Fulham | 27.6 | 24.6 | 23.5 | 98.3 |
| Hull | 39.9 | 38.9 | 38.2 | 99.1 |
| Liverpool | 49.7 | 56.1 | 60.6 | 107.4 |
| Man City | 59.9 | 61.1 | 60.9 | 99.6 |
| Man United | 46.9 | 49.3 | 61.2 | 116.0 |
| Newcastle | 51.0 | 50.0 | 47.5 | 97.3 |
| Norwich | 38.0 | 37.5 | 23.4 | 81.4 |
| Southampton | 54.2 | 52.3 | 51.3 | 98.8 |
| Stoke | 36.7 | 36.4 | 33.3 | 96.0 |
| Sunderland | 39.1 | 36.4 | 36.1 | 99.7 |
| Swansea | 51.2 | 45.6 | 37.8 | 90.7 |
| Tottenham | 56.3 | 54.8 | 52.5 | 97.2 |
| West Brom | 46.0 | 42.2 | 39.5 | 96.5 |
| West Ham | 33.3 | 30.9 | 40.0 | 110.4 |
| 44.9 | 44.5 | 43.7 | 98.90 |
United post a crazy PDO on the road which has powered them to posting the second best away Goal% in the league. Cardiff, Palace, Norwich, Fulham and Stoke get absolutely crushed by Goal% when on the road. Talent and tactics I guess.
8) Quick Hits
@Jair1970 wrote a roundup of his own. Go read it. Richard Whittall also has his roundup here. This new blog (only in Italian) is pretty good. Use Translate (Link). Go follow him/her too. Steve Sidwell did this in the dying minutes of the Man City v Fulham game.....this is a back pass with a slow moving ball.
I tried to make a gif of this sequence but it would not process. I think that was the machine's way of telling me that this sequence was just too awful to looped and watched for infinity. Video link is here.
9)Tuesday Previews
Newcastle v Everton I quite like Newcastle this season, they post pretty good shots numbers, they have some talent and they've been a touch unlucky at home when we compare the share of the shots they have recorded compared to the share of the goals. As always, PDO fills the gap between shots% and goals% and Newcastle's home PDO is terrible. Everton are posting slightly above average numbers on the road, injuries are starting to ease, only 4 wins away from home all season. Anyone for a score draw? Manchester United v Manchester City Manchester City are really good. Manchester United under David Moyes are not so good. That's the narrative going into this game, a game which Man City are expected to win, and probably win handily. I'm not so sure, call me a pessimist, or a mentally scarred Man City fan but I think this game might be quite close. Aguero and Dzeko (illness) may not play, RvP is missing for Man United. If City decide to play 3 in midfield and let the big beasts, Fernandinho and Toure, roam and destroy then it could get out of hand. Narrow Man City victory. A draw wouldn't shock me. I hate pessimism! Arsenal v Swansea Arsenal luuurrve teams who post middling or below average shots numbers. Arsenal tend to beat said teams with alarming consistency. Swansea are a bang average shot team overall and seem to be drifting towards another safe and unexciting end to the season. Expect Arsenal to vanquish the visitors after the usual 45 to 60 minutes of false parity. Arsenal ganar
10) Goal Of The Week #2: Yaya Toure/Alexander Tettey
Spoilt for choice this week!
The Spanish Inquisition - Roberto Soldado
Once the last ball of the season has been kicked and a few hundred Premier League footballers have flown off to exotic locations to rest their battered feet, I'd like to think club staff get themselves round the table for a season debrief. They'd discuss what went right, want went wrong and what went........Mmmkay. Come May, this process might take a little while longer at Spurs than it would at other clubs. The league position isn't a disaster by any stretch, but player trades on the whole haven't worked out. Sooner or later, the guys at the table (after a long time sidestepping it) would stumble upon what was maybe the crowning turd in the transfer water-pipe. Before the season started, Colin Trainor, voiced concern about the transfer of Roberto Soldado here. Taking penalties away, Soldado has scored 2 league goals this season compared to 19 last. I'm going to try and build on Colin's work by asking the kind of simple questions I'd be asking if I was sat down at that table, discussing the reasons why its all gone paella-shaped. Is Soldado taking less shots? This season he's taking 2.7 shots per 90 mins. Last season he was taking 3.1 shots per 90 mins. That's an extra 15 shots per season if all minutes were played out. He's taken 52 shots this season compared to 100 last. None of this explains the huge difference in goals we've seen. How many shots is he getting on target? Is he getting into the same areas to take them? It's nice to visualise this one. The deeper the red on the graphic below, the bigger the volume of shots on target from that zone:
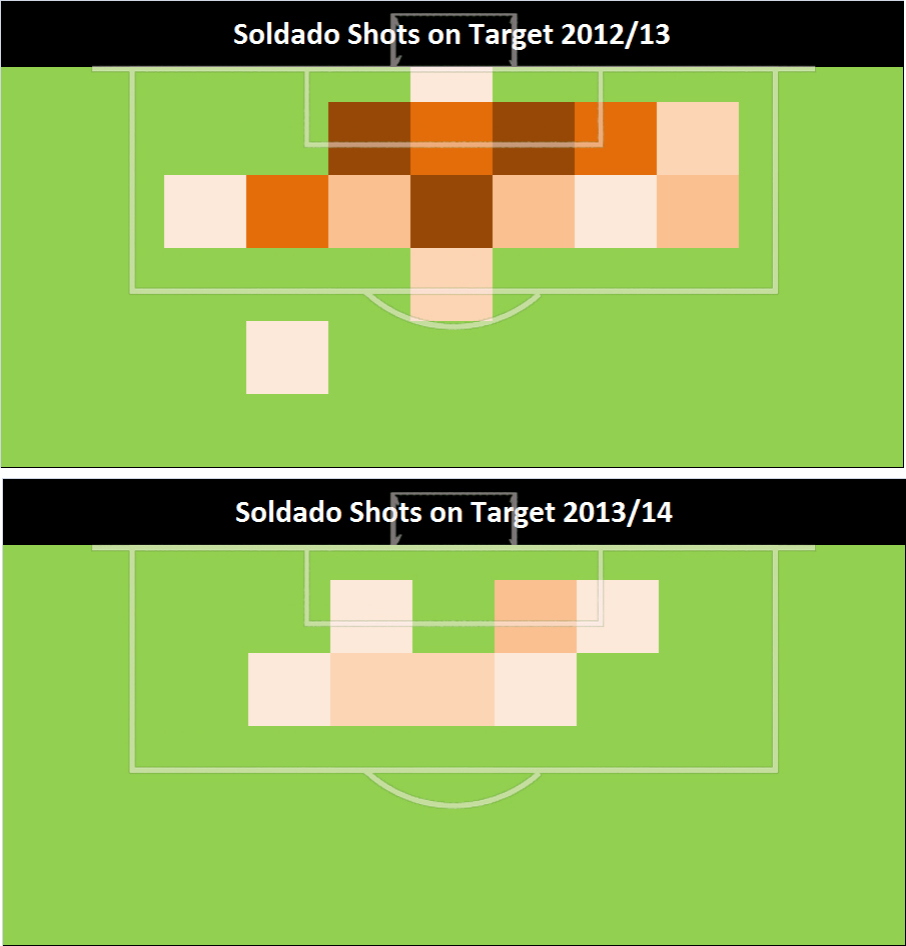
The graphic quite clearly demonstrates part of the problem. Same areas, but a drastic reduction in volume. Soldado is a penalty box striker, pure and simple.
So how did Valencia 2012/13 compare to Spurs 2012/13? Was it a complete style mismatch when they bought him?
The graphic below shows the volume and type of chance the two sides made in the penalty area last season.
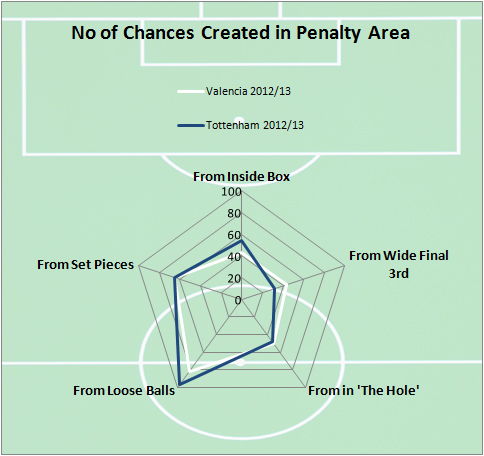
I didn't see much of Valencia last season. I'm not sure what I was expecting to find but it wasn't this. The two teams were almost identical in this regard.
Ok, so what about Valencia 2012/13 versus Spurs 2013/14? Have Spurs done something different?
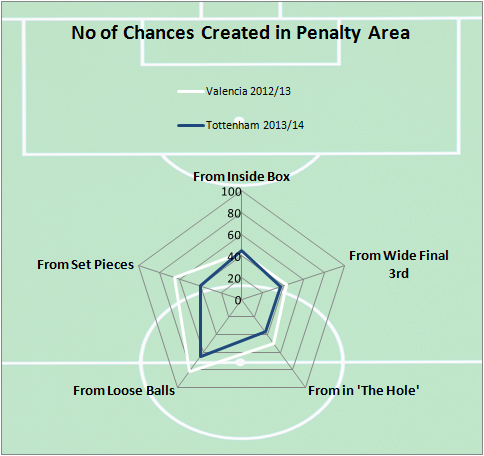
Once again Spurs are well on track to at least equal Valencia in every department bar set piece deliveries.
So if he's getting in a similar amount of shots per 90 as he was before, he's just not putting them on target as much, right?
Right. Roberto's gone from getting 43% of his open play shots on target last season, to just 23% this season. It's a whopping drop but it's fairly common as you can see in this cracking piece by @willtgm. Will's work suggests that this drop is nearly as likely to be luck or other factors influencing play as much as it's down to the skill of the individual involved.
Those other factors. The teams as a whole might have been similar in style and volume, but maybe Soldado himself isn't getting on to the same type of chance as last season?
This is what that looks like:
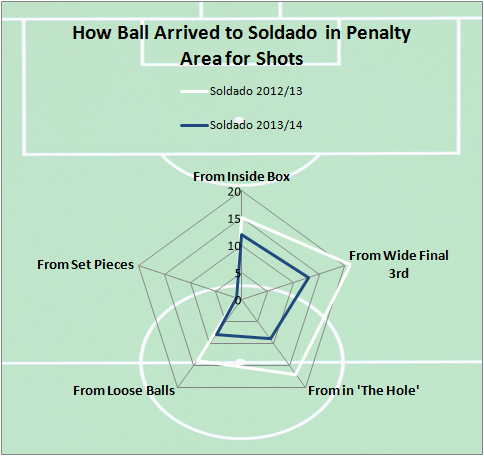 This is pretty much bang on identical too if you take minutes played into account. There's a small drop of passes played into him from in the hole. However, as he didn't score from any of these last season, it's difficult to say it's a problem. The only thing is, this is how both his open play goals for Spurs have come about. Does it take less shots on average to score in La Liga? It does, but the differences aren't significant. Definitely not significant to explain the Soldado puzzle. Might that say something about defensive pressure on the ball? It might, but the data for this isn't publicly available. The video of Soldado's goals is here: http://www.youtube.com/watch?v=Xj-XhTAmvag Looks like a mix here. On some occasions there's time and space to finish and on some occasions it's a tight spot with good movement and finishing on show. The way Spurs played under AVB (high press, hemming opponents in their half) might look a little different to this. Spurs didn't build quickly and as a consequence opposition defences were fairly set. However, under Tim Sherwood things are different and it still hasn't happened for Soldado.
How would the average shooter in the Premier League do with the same volume and type of chances that Soldado's had this season?
My expected goals model suggests 4 goals should have been scored in open play with the shots on target he's had. That would be the benchmark. The Spaniard is therefore only 2 goals behind where he should be. Simulating these shot situations thousands of times over means we can put a measure on how good or bad that performance might actually be.

We can expect a Soldado-esque performance just over 10% of the time. Considering there's only a 20% chance you'll actually get the benchmark performance of 4 goals, Soldado's efforts might not sound so bad. However, the reality is we're looking at an 83% probability that your benchmark shooter would outperform him.
None of this is really explaining it. Has he just been unlucky?
I'll be honest. it's not a term I like very much. When it comes to what happens in football, everyone has a reason for everything. However, when it comes to goalscoring, the longer I delve into the numbers the less reason I'm finding for stuff that happens. My studies into goalscoring so far suggest that even the 'best' strikers in the Premier League come back to mean over time. Is this simply what Soldado is doing? Here's his rolling performance starting from his last season with Valencia until now (this is far back as the publicly available data goes):
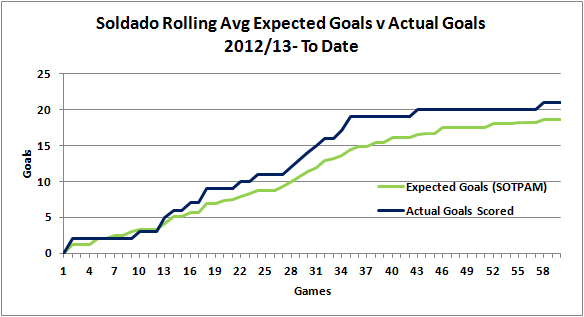
Looks like a case of him regressing back to where he should be to me. Will's work on shots on target (linked above) is fairly important. Next season Soldado might just start getting shots on target again and probably getting goals. The staff at the club could no doubt start watching hours and hours of footage and maybe put their finger on the reasons why. I'm sure something could be found and they'd be happy with the explanation. Increasingly, my explanations around goal scoring sound a lot like: sometimes shit happens.
Some nice analytics could probably tip the odds slightly in your favour over time. You should stop looking for certainties - they don't exist. No one wants to hear that message. But if someone like me can get to grips with it, so can you.
Podcast 13: Liverpool's Tactics, Suarez's Form, Moyes's Future & Some CL Talk
Statsbomb Podcast Episode 13. Ben Pugsley and Mike Goodman discuss last weeks big Premier League fixtures, Liverpool's tactical quirks, Suarez's conversion %. We also talk some Champions League odds, Manchester United's present and David Moyes's future.
Thinking About Finishing Skill

Apparently it’s “finishing skill” season. The debate happens every year, more or less, usually precipitated by an incredible run of goals by somebody or other.
This year, obviously it’s Luis Suarez who has spurred the discussion (including some particularly long and heated ones between me and @SimonGleave…sorry everybody).
In general the debate boils down to three specific questions: What is finishing skill? Does it exist at all? Even if it does exist, does it matter? So, let’s wade into the murk shall we.
Defining the terms of this discussion is actually a pretty tricky enterprise. Arguments generally start over a player’s conversion percentage, or goals vs. expected goals ratio, and devolve fairly quickly, often times into people talking at cross purposes.
So, let’s look at two possible definitions on opposite sides of the spectrum. What if we defined “finishing ability” as the simplest most basic moment of ball hitting foot and ball flying into the net (or into row z).
If we define it that way, it means we are controlling for absolutely everything else on the football field. When we deal in expected goals, we’ve already started this process, since that involves controlling for shot location, shot type, probably pass type, and some other things depending on the model (an important note, the vast majority of a shot’s chances of going in the net are due to its distance from the net, everything else that we’re talking about here is much much less important when it comes to impacting a shot’s chance of succeeding. I’ll come back to this point later).
We can go beyond that though, at least in this theoretical world I’m operating in. We could control for dominant foot, we could control for what part of the foot the shot was taken with, we could control for whether the player was on or off balance, the speed with which the ball was moving when struck, the speed with which the player was moving when he struck the ball, etc. etc. You guys can all come up with your own examples. So, controlling for all of those other factors leaves us with a narrow definition of finishing skill. That’s fine, and given that definition it makes sense that perhaps there would be little to no difference between players, especially between players playing the forward position at an elite level. But now let’s go back to the initial question.
If a player is shooting well above, or below average levels after accounting for shot location can we simply say it’s down to natural variation because players all have the same finishing skill? There’s a little bit of a problem here because we have a whole set of skills which we both aren’t including in our definition of “finishing skills” but which also aren’t accounted for by any models which we’re using. So, by asserting that it’s simple variation because players all have the same finishing skill, we’re either asserting that those skills don’t impact shooting results at all, or we’re asserting that their impact on shooting outcomes is dwarfed by the random variation that arises from the very act of kicking. Is that true? I don’t know.
But I do know that the more narrowly we define finishing skill the harder the argument is to make that the fact that it’s constant (if it is) among players is the reason for variance in performance. I’m just simply not comfortable writing off a whole set of variables we know nothing about and assuming they are unimportant to outcomes without proof.
Okay, but what if we defined “finishing skill” more broadly. Instead of trying to zero down to that exact moment of foot to ball, what if we just loosely defined finishing skill as, “the ability to score more goals than an expected goal model would predict.”
Well for starters, thanks to @MCofA we do have some evidence that in very very large samples some players can outperform expected goals. So, it’s there, but it’s very very hard to do and equally hard to spot.
But, just like with the narrower definition, it’s worth saying explicitly what this means. What we’re saying is that taking into account all of these, let’s call them sub-skills, that go into finishing and players still more or less show no ability to improve. Why is that? Well, one possibility is that all of these sub-skills are as random as narrowly defined finishing skill.
Saying that though, is basically saying that every attacking player is exactly the same and differences are due solely to randomness.
Subjectively I’m not comfortable with the implications of that argument, since it would mean things like Arjen Robben’s left foot is as good as as Cristiano Ronaldo’s or Zlatan Ibrahimovic and Olivier Giroud both hit the ball with the same velocity, and differences are solely down to randomness. Again, it’s a defensible position because we don’t have the data that conclusively proves these differences yet, but it’s not territory I’d be willing to stake out.
Rather, I’d say, these sub-skills vary greatly in terms of both a player’s ability to control them, and their ultimate importance in finishing. Some things will be well within a player’s control and some will largely vary due to luck. And then on top of that a player’s decision making layers in the frequency with which various skills come into play (how often does player X shoot with his weak foot, as opposed to how good is that weak foot when he shoots).
Put all that together and you have an equation with so many variables that it’s next to impossible to be good enough at enough stuff to actually move the finishing needle. This isn’t exactly news. It’s just another way of saying, finishing involves a diverse skill set, is really hard and has lots of luck involved. Pretty much the same as it ever was. All of which is fine and good, but leaves the third question unanswered.
Does any of this matter? At best, finishing skill when we define it loosely is really difficult to spot, and we can’t see it in players season to season, so it doesn’t really matter much for scouting, so why bother writing this many words about it at all? I mean who cares if Johnny Soccerboy only scores farpost curlers with his weaker foot at 4% and Clive Footielad does it at 14%. Remember, shot conversion overwhelmingly depends on location, this stuff is exceedingly small potatoes by comparison. It doesn’t impact things enough to make a difference.
Working with our two definitions of finishing skill we can look at it this way. Define it narrowly and we can ignore it. Players may have uniform skill, but that skill is fairly minor when it comes to examining all the things that go into shooting (this is a point I’d certainly be willing to change my mind on if data proved otherwise) or it encompasses lots of factors. In that case, when we define finishing skill as an amalgamation of all of these factors, we can see differences. Those differences, however, lie in how players finish, not in how often.
That’s important, because it allows us to understand that the way players shoot can differ, even if the end conversion percentage doesn’t much. It gives us a number of options for further examining football, shooting, and team construction. Perhaps the most severe limitation right now is that the differences in the level of finishing, even when accounting for location, are so small compared to the number of shots players take in a season that it is impossible to differentiate between a player who might finish at 13% (location adjusted) and one who finishes at 17%.
There’s not disagreement on which player you want on your team, just that it’s impossible to look through all the variance to definitively find those players. But, what if instead of looking at players we could look at various skill-sets and see if they reliably over large samples provided better adjusted finishing rates. A cross sport example to make my point: a defensive specialist in basketball is often times a detriment to have on the court, but a defensive specialist who can also shoot a three-point shot from the corner is worth his weight in gold. Skill combinations.
Examining which possible combinations are reliably above average and then either recruiting to them, or developing players in them is a possible way to envision teams getting beyond the sample size barrier. From an analytics standpoint not dismissing finishing skill is hugely important. That’s because the ways in which a player shoots, what he may or may not be good at, how he decides to balance his varying shooting options partially define the set of shots he takes.
And when we talk about defining the set of shots a player takes, we are now moving beyond the realm of goals, and to the realm of expected goals. It’s easy to see how on one side of the coin shot selection defines conversion percentages, and so counts as part of what we consider finishing skills, but it also plays a huge part in establishing expected goals. Obviously a shot not taken has no ExpG value, and equally obviously what shots a player takes are defined by a number of factors, all of which could also be filed under finishing skill. I vehemently believe that understanding the specifics of how and when players shoot is important.
Given how complicated a sport football is, and how rare goal scoring events are in general, we’d never know decisively just by looking at outputs if players managed to increase their conversion percentages, or even teams for that matter. That doesn’t mean that those margins aren’t important, and it certainly doesn’t mean that they don’t exist. It simply means that to find them we may need to start systematically looking at inputs instead.
And it’s those inputs which make up finishing skill. It seems like to insist on finishing being completely luck you have to take one of two stances.
One define it so narrowly that you then leave yourself lots of work to do to prove that variance from finishing skill impacts statistics at all (as opposed to variance from other factors relating to shooting), or if you define it more broadly, insist that differences between player shooting events, both how often they score, and the specifics of the shots they take, are a result of pure variance, an insistence that both shot result and shot type are due to variance. There’s so much we don’t know about the sport. It seems a shame to dismiss a whole area of study, just because it isn’t clearly reflected in the data we currently track. Who knows what we might find.
Part Two: Has Britain Got Talent? Is A Lack Of Data Holding Back British Football Clubs?
In Part One Oliver Page looked at what statistical data is available to domestic clubs outside of the Premier League and how clubs might be able to use this to increase their efficiency in the transfer market. In Part Two he investigates further the transfer market (under?)performance of these leagues and whether a way forward can be identified. Compare The Market: Is The Transfer Market Efficient?
How do domestic divisions perform in the transfer market in comparison to other leagues around Europe and the World?
In part one I wrote about the value of using statistical player comparisons to make better informed transfer decisions. Similarly, I want to use league comparisons to look more closely at the apparent decline in transfer market performance of domestic divisions outside of the Premier League. Comparing anything across different leagues can obviously be problematic as inherent differences exist in the relative standard of those leagues. If player A has performed well in his league and player B has done the same in a different league can we really compare them? If league A generated £x million transfer revenue what does that mean? Is it just a reflection of the quality of that league? To attempt to address this I conducted on on-line survey asking users to rate the relative strengths of 25 different leagues from across the world. The methodology is inspired by this article by Jay Ulfelder which also explains the scoring system. A sample of the current scores (as of March 10, 2014) are as follows:
- England - Premier League (95 out of 100)
- Germany - Bundesliga (91)
- Spain - Primera Division (87)
- Italy - Serie A (84)
- Netherlands - Eredivisie (70)
- Russia - Premier League (61)
- England - Championship (50)
- Scotland - Premier League (25)
- England - League One (23)
- England - League Two (6)
These results are based on 1,251 votes so far and the full results can be see here. Obviously league standards can fluctuate over time (e.g. Glasgow Rangers demotion has weakened the SPL) but to my eye the ratings appear reasonable and are considered a useful tool for comparison. I took a selection of these world leagues and plotted their 'ratings score' against their respective transfer revenues for the last 8 seasons. Please note from here on I am combining pairs of seasons (e.g. 2006/07 and 2007/08 combined) as otherwise a single transfer in one season can sometimes distort results. Of particular interest was the comparison between the 06/07 & 07/08 period and the 12/13 & 13/14 period which can be seen below along with the full table of results. 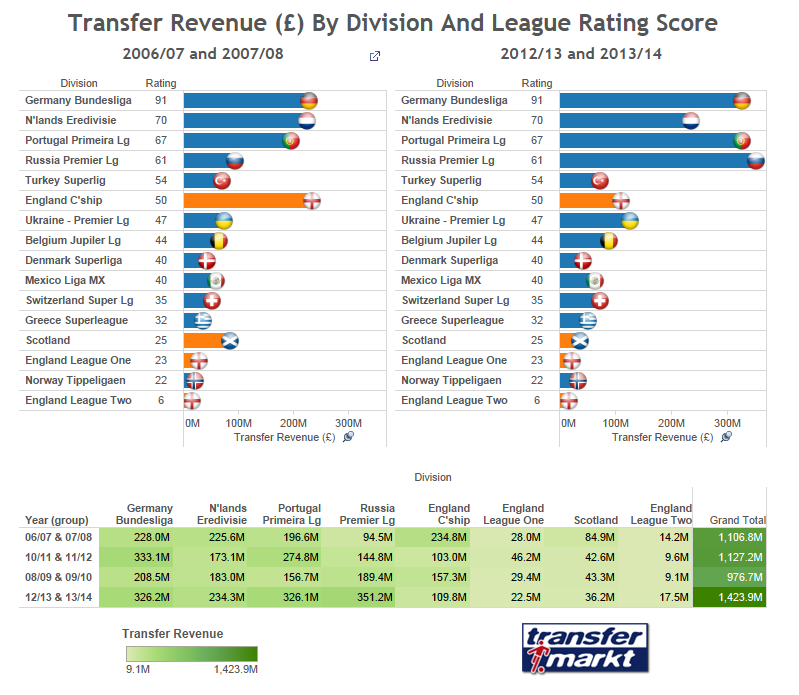 [see notes at end of article for further details of methodology]
From 06/07 to 07/08 the English Championship generated more transfer revenue than the German Bundesliga.
For the period 06/07 to 07/08 both the Championship and SPL were generating considerably more revenue from player sales than many leagues of a similar, and even higher, rating. Since then however, they have both been overtaken by the 'better leagues' and caught up by many of the 'worse' leagues. There may be lots of different factors at play here (e.g. the most recent Russian Premier League revenue is skewed by the collapse of Anzhi Makhachkala) but the most recent chart does show evidence of a growing relationship between transfer revenue and rating score.
Worryingly for these leagues, the data suggests that the Championship and Scottish Premier League were actually OVERPERFORMING in the transfer market in previous years. Have they now just found their 'true level'?
It is also interesting to note, however, that a number of these leagues that have shown an increase in revenue are also those that have built strong relationships with data providers. In Part One we saw how the level of detail with which data companies such as Opta, Wyscout and Prozone cover competitions can vary from league to league. For example, the Bundesliga, Eredivisie and Russian Premier League have all had the full-detail level of Opta data available for at least 4 full seasons now. For the Championship this data only became available during 2013/14 and for the SPL, League One and League Two it remains unavailable.
Obviously we should be careful to draw sweeping conclusions – correlation does not imply causation – but it is difficult not to be intrigued by the possible existence of this additional relationship.
Where Do Championship Clubs sell players to? The data we have seen so far only shows total transfer revenue and a league could generate revenue just from buying and selling in-division and between its own members. Focusing now on the English Championship, where do its clubs sell their players to the most? In particular, what changed between the 06/07 to 07/08 period and the 12/13 to 13/14 period? 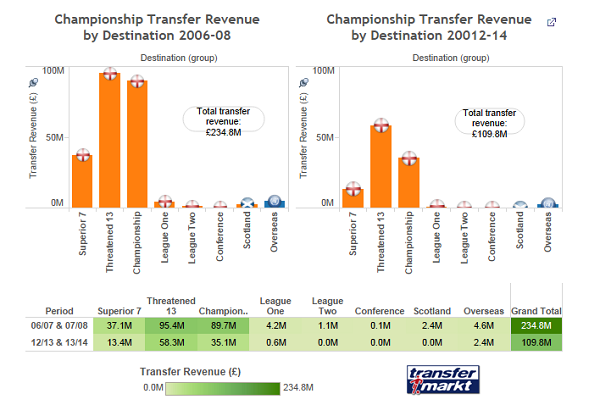 [For an explanation of Superior 7 and Threatened 13 see this article by Infostrada Sports' Head of Analysis Simon Gleave] Firstly, Championship clubs appear to have next to no market for their players outside of the top two English divisions. The majority of transfer revenue has always been generated by sales to either teams in the Threatened 13 or the Championship. Interestingly, a similar pattern exists in terms of where Championship clubs buy players from too. For example, for the period 06/07 and 07/08, Championship transfer expenditure was £203.8M. £76.5M of this went on players from the Championship and £45.1M went on players from the Threatened 13.
Historically the Championship and Threatened 13 clubs have been locked in a cycle of selling and buying players the same players to and from each other.
All three of the Championship's main ‘customers’ are declining however. For example, sales within division are down from £89.7M to £35.1M and sales to Threatened 13 clubs are down from £95.4M to £58.3M.
Is this due to lack of data to evaluate Championship players? Is the data available but just not being used for recruitment purposes?
Or, is it the more worrying scenario that the data is available, it is being used for recruitment, and top clubs are just choosing to eschew an overpriced and overrated market?
Where Do Premier League Clubs Now Buy Players From? Championship transfer revenue is down but the Premier League recently signed another record broadcasting rights deal and is continuing to spend as much as ever. Where is this Premier League money now going? Again, I will focus here on the changes between 2006-08 and 2012-14. 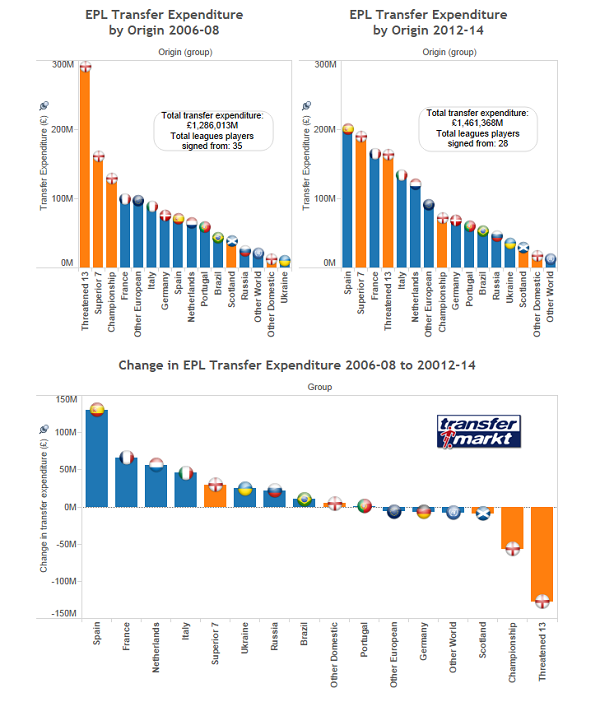 As we have already seen, the historically inefficient domestic ‘loop market’ between the Threatened 13 and the Championship has been greatly reduced in value. The leagues that are the greatest beneficiaries of this include Spain, France, Netherlands and Italy.
This cannot just be dismissed as the inevitable consequence of Bosman – this ruling celebrates its 19th birthday this year. In 2012-14 Premier League clubs actually signed players from LESS different overseas leagues than in 2006-08.
It appears that there could be a trend towards Premier League clubs concentrating recruitment on certain specific leagues around Europe and the World. Several factors could be causing this. Firstly, the leagues which have seen the largest increases are also those grouped in or around the top of the world league ranking seen earlier. Empowered by the new television deal, even Premier League clubs outside the Superior 7 can now shop for players in these leagues. For example, a club like Southampton can now buy players from a club like AS Roma. Secondly, the most successful international side of recent years is Spain, and the most revered club side in world football is FC Barcelona. The unique style of football with which these teams have achieved their success has inevitably led in part to some Premier League clubs trying to replicate this style and to increase their signings from the Spanish domestic leagues.
But it is also interesting to note again that the leagues which have seen the largest increases are also those who have been amongst the first to adopt detailed statistical coverage.
Are we witnessing a more data-driven approach to recruitment making the transfer market more efficient?
Championship clubs currently have next to no market for their “goods” outside of the UK and the Superior 7 are increasingly willing and able to find a more efficient market overseas. There is also evidence of this trend making its way down the ladder to Threatened 13 and Championship clubs. For example Newcastle now makes most of its signings from French Ligue One.
Are clubs simply concluding that domestic leagues offer poor value? That is, a high cost player of a quality that, even if you can measure and benchmark it, is inferior?
If the data shortage is a concern for young footballers’ attempts to get scouted, it is of even greater concern to the football clubs who have previously relied on revenue from an inefficient transfer market to survive.
Unknown Unknowns
"Analytics isn't about making your decisions 100% correct, but about moving from 48% to 52%"
(Paraag Marathe, President San Francisco 49ers)
The above quote is my favourite from the recent Sloan Sports Analytics Conference. Without wishing to go over all of the recent pro- versus anti- statistics in sports arguments I think it is worth remembering that nobody is saying that statistical analysis in the be-all and end-all and the answer to all clubs problems. What I believe it can offer is a way to add context to decision making that would otherwise be made on the basis of such things as instinct or experience. Perhaps it can tell you how a midfielder's attributes compare to similar players elsewhere around Europe? Or perhaps it can provide you with an objective way to draw up a short-list of young talents outside of your own division.
My background is in sports betting where everyone understands that a shift from 48% to 52% could be the difference between winning and losing in the long run. Unfortunately such long term and probabilistic thinking is rarely a luxury afforded to football clubs. Football, and indeed sport in general, is a game of opinions and almost everyone has one. Go to a stadium, watch a match in the pub or follow the game on Twitter and almost everyone has a opinion and everyone is an expert.
I do not know if this is a trait unique to sports but it isn't often you hear someone admit 'You know what I am not sure about that' or 'I haven't really seen that player play much actually'. When looking at the results for my on-line quiz it was noticeable how few responses were given as 'I don't know' or 'I don't know enough about that to vote'. It often seems people within sport are afraid to admit they don't know something. So here goes...
I have basically watched sport for a living for the past 8 years but will happily admit there is a LOT that I still do not know about it.
There, I said it. One way I like to help to get more information to help me make decisions and form opinions is to use statistics.
"Sports analytics doesn't take the fun out of sports, it mostly takes the dumb out of sports"
(paraphrasing Edward Tufte, Sloan Sports Analytics Conference 2014)
My version of the above quote would be something like 'it mostly takes the bravado out of sports'.
What Is The Way Forward? As we saw in Part One, we may not know for sure exactly what the situation is ‘on the ground’ - clubs and data companies are secretive - but we do have increasing evidence of a trend towards analytical recruitment in football. Data analytics is not 'taking over' but it is an invaluable tool for assisting in decision making processes. The top clubs are doing it and before long everyone else will follow.
It is no longer a choice of whether or not to embrace statistical analytics but WHEN and HOW.
Teams outside of the Superior 7 need to recognise that they operate in a world market now and can no longer rely on the domestic market for transfer revenue. They will need to become more analytically ‘savvy’ and use every new technique at their disposal to compete in this increasingly competitive market.
But who will pay for it?
It is understandably difficult to know details of the funding for data collection and analysis. We do not really know who the largest clients of data companies are (professional clubs? the media? bookmakers?) or how much it costs to provide and get access to all the most detailed data but it is something not every club can afford. Why is it so expensive?
To listen to some speak they would have you believe the data companies are the evil gatekeepers holding all the data for themselves in their ivory towers and charging a kings ransom to anyone and everyone for the privilege to use it.
Yet I have seen first-hand the intensive process Opta undertakes to fully code just a single game - I am sure similar processes exist at Prozone - and obviously data companies cannot provide this service for free. My understanding of the current system is that clubs are responsible for their own relationships with data providers – they are individual clients and have to pay for the breadth and depth of service that meets their own needs. This ad-hoc system is in contrast to how much of the same information is provided in the major American sports. For example the NBA recently agreed a deal to install optical tracking cameras at every team and also to make the data available to the public. In soccer, the MLS has a league-wide relationship with Opta which has been considered a great success both on and off the pitch. A hot topic in UK football at present is the perceived poor performance of our national teams and the relatively limited opportunities given to young British players at Premier League clubs. The Football Association are currently commissioning their own investigation into this and only this week the Times newspaper is running a series entitled The Good of the Game.
What would happen if a governing body such as the FA, SFA or Football League decided to invest in data analytics for the benefit of every club?
I do not know what the cost of this might be - this could be an impractical non-starter - but investment does not have to be purely financial. If clubs’ own analysts do not have the time or skills to deal with the newly available ‘big data’ then could this work be centralised and centrally funded? I am sure there are lots of people with the necessary skills out there who are only too willing to help as this article makes clear. If statistics and video coverage makes it way to all of the domestic leagues will we necessarily see a recovery in transfer revenue in those leagues? We do not know. Will it just confirm the suspicion that clubs have been overpaying for players in these divisions for years? Possibly.
Only time will tell but if you are a club and you don’t adapt to these new market conditions your future could be difficult.
Or if not, and you are a young player at one of those clubs, it might be time to check you have a valid passport.
NOTES [Note 1: TransferMarkt historic values for transfer fees are inflated to reflect current market prices. At present I have not received a response from them to confirm the exact method for doing this. It is assumed that this is consistent across world leagues] [Note 2: To account for the demotion of Glasgow Rangers in 2012 the combined revenue from all Scottish divisions is included throughout] [Note 3: Sales by promoted and relegated clubs are counted for the division they were playing in the previous season. E.g. Wigan sold James McCarthy to Everton when they were a officially a Championship club (summer 2013) but because Wigan was relegated the previous season this is counted as a Premier League to Premier League transfer (i.e. it is assumed Everton made the signing on the basis of his performances in the Premier League the previous season). At the other end, Dwight Gayle’s transfer from Peterborough to Crystal Palace is considered Championship to Premier League despite Peterborough’s relegation to League One.]
Has Britain Got Talent? Is A Lack Of Data Holding Back British Football Clubs?
In the first of a two-part series Oliver Page investigates what data and analysis services are available to British clubs, how they are currently utilising them for recruitment, and what effect this might be having on the UK transfer market.
“Economic efficiency is likely to be greatest when information is comprehensive, accurate and cheaply available.”
(The Economist, A-Z of Economics, online 2014)
At the OptaPro Analytics Forum a recurring question was “For which leagues is it possible to reproduce the work being discussed?” Almost all of the presentations utilised data from the Opta f24 data feed for the English Premier League. This data includes descriptions of every on-ball action and corresponding x-y coordinates to determine location around the pitch (as seen on websites such as Squawka and Statszone). My personal interest has always been greatest in domestic football outside of the Premier League so I was disappointed to learn that Opta do not currently provide this level of data for the Scottish Premier League or English League One and League Two. The only data that is available is 'headline stats' such as goals scored and assists.The full detail dataset for the English Championship only became available midway through the current 2013/14 season.
My dream of becoming the lower league Billy Beane is temporarily on hold.
More importantly however, this raises the question whether or not clubs are able to scout and compare players in these divisions as accurately as elsewhere?
What effect is this lack of data having on the recruitment of players at clubs playing in these ‘black hole’ divisions?
What Exactly Is The Problem? The website Transfermarkt keeps a comprehensive record of every major transfer and its value. Historic values are adjusted to reflect current market prices [see note 1 at end of article]. The chart and table below show transfer revenue generated by the English Championship, League One, League Two and Scottish Leagues over the previous 8 seasons. 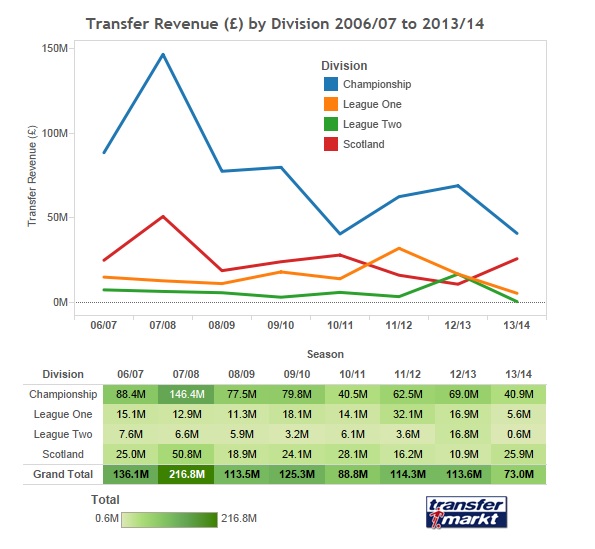 [see notes 2 & 3 for further notes on methodology] We can see that transfer revenue generated by these divisions peaked in the 2007/08 season, after which the general trend has been one of steady decline. Scottish leagues did see an increase in 13/14 although this is almost entirely due to sales by Celtic alone. The 07/08 peak coincided with the start of a lucrative new broadcasting rights deal for the Premier League. The EPL recently signed another record rights deal meaning there is now more money than ever in the top division, yet this time it has not been matched by a similar boom in domestic transfers.
For these 4 divisions 2013/14 represents the lowest combined total transfer revenue since 2004/05.
Why does this matter? Recruitment is often only considered in terms of teams trying to sign players, yet for all but a minority of clubs their ability to sell players efficiently is equally crucial to their financial performance. Clubs outside the English Premier League are concerned about the current financial climate and the potential impact of new Financial Fair Play rules. Some are even worried enough to be considering legal action. Infostrada Sports' Head of Analysis Simon Gleave recently coined the terms Superior 7 and Threatened 13 to describe the two-tier structure that is often said to exist within the Premier League. The increasingly powerful Superior 7 teams are considered to be Manchester United, Manchester City, Arsenal, Chelsea, Liverpool, Tottenham and Everton.
This current 2013/14 season, there has not been a single permanent signing by a ‘Superior 7’ club of a player who played the previous season in the Championship, League One, League Two or the Scottish Premier League.
There’s Plenty Of Fish In The Sea
“…99% of player recruitment is who you don’t buy.”
(Mike Forde, former Director of Football Operations at Chelsea FC)
The 1995 Bosman ruling and the collective economic power of the top European clubs means there is now a vast pool of footballers from across the world to be evaluated every transfer window. There is only a small fraction of the world’s footballers that can be considered 'off the market'. Michael Calvin’s book 'The Nowhere Men' describes how many clubs are finding that traditional scouting methods alone no longer meet their recruitment needs. One way clubs can improve their recruitment process is through detailed analysis of players’ statistical performance. An increasing number of teams are now using statistics to objectively compare players they may wish to sign. Statistical analysis can also help them to assign reasonable transfer values to potential targets.
There has been much criticism of ‘meaningless stats’ and their potential lack of context recently, however full and thorough analysis done well can actually ADD context to decision making.
Go Compare Example 1 – Goal Scorers Just knowing how many goals a striker scores does not necessarily tell us how good a finisher he is. For example, what is the quality of the chances he is being presented with by his teammates? Colin Trainor is leading much of the work in this area.
Was it really not possible to produce chance quality analyses for these goal scorers?


Gary Hooper (63 goals in 3 seasons in the SPL) Jordan Rhodes (70 goals in 3 seasons in L1)
Example 2 – Goal Keepers: Paul Riley uses shot location information for the purpose of rating goalkeeper performance.
How can teams objectively evaluate goalkeeper performance without full data coverage in these leagues?


Fraser Forster (14 goals conceded in 28 SPL games) Wayne Hennessey (£3m signing from League One)
Example 3 - Midfielders: Some of the most criticised statistics in football are those related to passing (otherwise known as the Leon Britton effect). Marek Kwiatowski’s work attempts to address this by comparing the passing (field position, length angle and volume) of central midfielders.
If we know that two players are attempting similar types of passes each game then suddenly a stat such as pass completion percentage does become meaningful.

Liam Bridcutt (121 Championship appearances 2010 to 2014)
Is it merely a coincidence that a Championship midfielder known primarily for his passing was only signed for a Premier League team by one of his former managers?
How many other young players in these leagues might be going unnoticed because of a lack of data coverage?
Even when players are noticed, are Premier League clubs increasingly reluctant to ‘pull the trigger’ on these signings?


Will Hughes (18, Derby County) Thomas Ince (only on loan at Crystal Palace)
How is Data Actually Being Used by Clubs? I wanted to find out more about what data is available and how clubs are actually using it ‘on the ground’. I spoke to several representatives from football clubs at all levels and also direct to data companies. Opta has been producing their full level f24 data for the Premier League for 12 seasons. Full details of which leagues they cover can be seen here but highlights include:
- Germany Bundesliga (9 seasons)
- Italy Serie A (9 seasons)
- Spain La Liga (8 seasons)
- France Ligue One (8 seasons)
- UEFA Champions League (8 seasons)
- Russian Premier League (5 seasons)
- Dutch Eredivisie (4 seasons)
- Portuguese Primeira Liga (4 seasons – 75% coverage)
Leagues that have been added for the 2013/14 season include the Championship, Brazilian Serie A and Argentinian Primera. The level of coverage is expanding every year but, as mentioned earlier, there is not currently the level of demand to cover League One, League Two and Scotland in this detail. Opta is not the only data company however and pure number-crunching is not the only modern technique available. For example data can be now be used in conjunction with tailor-made video analysis via services such as Opta’s VideoHub Elite and Wyscout. One of the first companies in this field was Prozone who now provide both video and data services to over 300 professional clubs worldwide.
The combined use of statistical analysis with worldwide video scouting can be considered together as the modern developments in football player recruitment.
How many clubs are fully embracing these new developments? At what levels are these methods most prevalent? Is it even possible to use these methods the further down the league structure you go? Every club representative I spoke to was interested in the potential impact of incorporating a more data-driven approach to the transfer market. However they also all spoke of the fact that, when it comes to recruitment at least, these techniques are currently in their infancy e.g. “Most teams do minimal stats and rely on traditional scouting and manager input. Only a few teams do what I would call proper statistical analysis of potential transfers”. From this correspondence it seemed initially that the data is not currently available outside the EPL. For example, “I see the work that appears on StatsBomb and it’s very interesting, however I could not replicate it in terms of the League as I don’t have the data to do so” and “From what I know of this XY data is simply not available - I would very much doubt it is even collected by the clubs themselves.” However, when I spoke to representatives from Prozone I was informed that a lot of this data is being recorded. Opta is really the only company to make any data available publicly via the media whereas Prozone and Wyscout’s business models focus on the professional game and provide more bespoke services tailored to the needs of individual clubs as clients.
The reality is that some clubs have access to data that the public and other clubs do not.
Prozone records what they term technical data of 2,500 on-ball events per match. They currently record this for all of the Premier League and Championship and much of League One. Paul Boanas, Senior Account Manager, told me “We work with 23 of the 24 Championship clubs and 10 of the clubs in League One…they all get every touch of the ball in their games, with the vast majority of championship clubs having access to all touches of the ball for all 552 games in their division”. In the Championship this coverage has been in place since 2007 and for League One the last 4 to 5 years. Having increased in coverage over the past 10 years Prozone now provide this level of service 25 leagues worldwide. In addition, all Premier League clubs, 17 Championship clubs and 2 League One clubs now have a fixed-position camera system in place to record player movements!
This presents the even more interesting scenario that the data is out there but it is just not yet being fully utilised by all but a small minority of clubs.
What could be causing this dichotomy? One reason is simply the cost and practicalities of fully using data analytics at a professional football club. The data may be available, but as one person told me “At best a lot of these clubs have 1 full time analyst who is covering everything at first team level” and “Unfortunately football is a business…clubs will feel reluctant to pay for services that they do not appreciate as yet.” Also, much of the focus is understandably placed on analysing one’s own team’s performance (post-match and physical analysis) and also preparing for forthcoming opponents (pre-match). One analyst told me “Things like shot locations for example, I can do this for my club as I have access to each game, but I don’t know how it compares to the rest of the league.” I know from my own experience preparing for the OptaPro Forum that it can take a lot of time and programming skill to get these vast datasets into something approaching a workable format for analysis. The week-to-week practicalities of the football schedule unfortunately do not allow for this kind of time investment.
It is for exactly this reason that Colin Trainor this week put forward an offer of assistance to clubs from all of us at Statsbomb.
Ultimately we cannot be sure exactly what data individual clubs have available and how they are using it – clubs are secretive and if they find a competitive edge will want to hold it for as long as possible. What is clear, however, is that data companies are expanding their coverage all the time and certain clubs are the early adopters embracing new analytic methods. Although not exclusively, this innovation appears to be starting with some of the richest clubs (e.g. Manchester City, Chelsea, Liverpool) but the inevitable trend is that it will feed their way down the football food chain.
What effect might this trend have on teams further down the league ladder? Has this process already started? And can we already see its impact?
In Part Two I will look at how the developing use of data analysis might be impacting the domestic transfer market. Why has transfer revenue outside of the Premier League reduced? How do domestic leagues compare to similar standard leagues worldwide? Where do Premier League clubs now buy their players from and is the transfer market becoming more efficient?
NOTES [Note 1: TransferMarkt historic values for transfer fees are inflated to reflect current market prices. At present I have not received a response from them to confirm the exact method for doing this. It is assumed that this is consistent across world leagues] [Note 2: To account for the demotion of Glasgow Rangers in 2012 the combined revenue from all Scottish divisions is included throughout] [Note 3: Sales by promoted and relegated clubs are counted for the division they were playing in the previous season. E.g. Wigan sold James McCarthy to Everton when they were a officially a Championship club (summer 2013) but because Wigan was relegated the previous season this is counted as a Premier League to Premier League transfer (i.e. it is assumed Everton made the signing on the basis of his performances in the Premier League the previous season). At the other end, Dwight Gayle’s transfer from Peterborough to Crystal Palace is considered Championship to Premier League despite Peterborough’s relegation to League One.]
Distributions of Central Midfield Stats

Part 1: distributions of goalscoring stats.
In the second instalment of my Distributions series (for book & movie rights, contact me on the address below) I look at central midfielders. Considerable versatility is required in this position, and so I will look at a larger number of stats than usual, six in total: passing accuracy, key passes, tackles, interceptions, and resistance to opponent's dribbles and to dispossessions. The choice is arbitrary, and linked to the exclusion from the dataset of #10s, i.e. the advanced central playmakers. Perhaps I'll treat them separately in a next article; for now I didn't want them to dull the distributions of the defensive stats.
The dataset includes all central midfielders from the five big leagues since 2009/10. Different seasons are treated separately, so a player active since 2009/10 contributed five records to the dataset (the current season is included). To be included, the player had to spend at least 900 minutes on the pitch over the course of the season. As was the case with the previous piece, this one contains little actual analysis, that is clever things one does with one's dataset. I realise this makes them a bit dry, but we here at StatsBomb think they are important, in that they are perhaps the first published benchmark for players' statistical output. Like so:
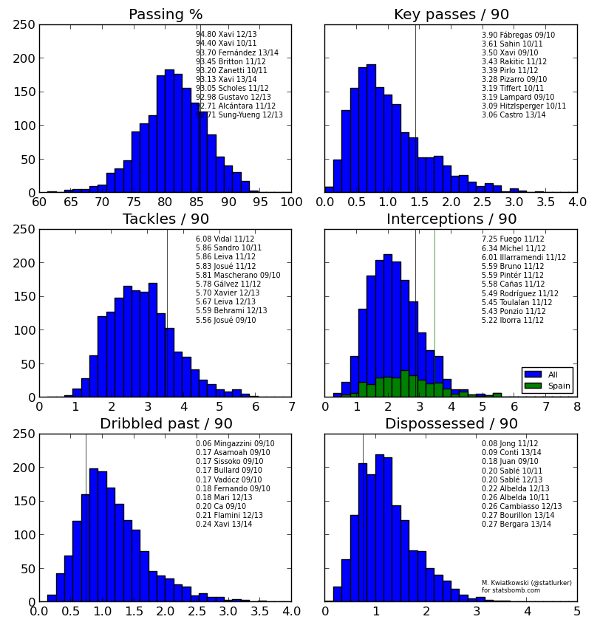
The vertical line in each histogram marks the 80th percentile, that is the value of the stat beyond which a player outperforms 80% of the field. For each category I have also listed the 10 best player-seasons in the dataset. The reason why I plotted Spain-based players' interceptions separately is that we suspect that the interception stat is inflated, likely erroneously, for the 2010/11 and (especially) 2011/12 seasons of La Liga.
One question this graph immediately suggested to me was: how strong are the trade-offs between these six facets of midfield play? Unless you are Arturo Vidal, you're probably not an elite key passer and an elite tackler, and even Vidal doesn't rank towards the top in, for example, avoiding dispossessions (rather abject 2.53 per90 in 2011/12). So how close to the perfect central midfielder can you get, and who would you resemble? A quick way is to take the relative performance in all six categories (i.e. what % of the field does worse), and average that. The resulting histogram with the list of top 30 performers is below. Note that I didn't correct for the Spanish interception bias, so the 2010/11 and 2011/12 La Liga players had a bit of an upper hand. As an Arsenal fan, I'm delighted to see Mikel Arteta, my favourite player, in the second position. As an analyst, I'm compelled to remind you that the choice of the six stats was arbitrary in the first place, and averaging percentiles assumes all six stats are of equal importance.
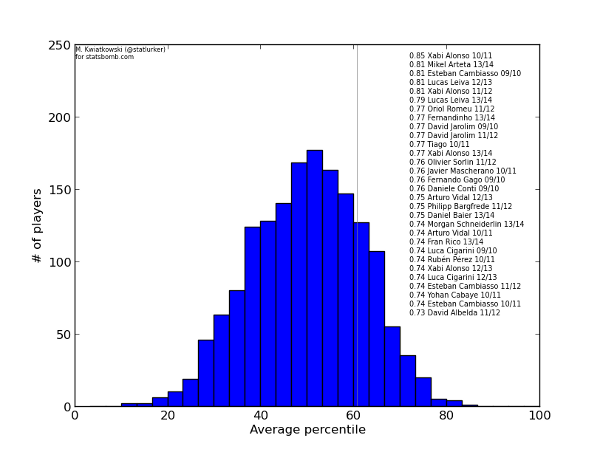
Somewhat related: comparing central midfielders.
Data collected by Opta.
Offer of analytical assistance for football clubs

This is a little different from anything else we have put up on Statsbomb. It’s not an analytical article, but instead is an announcement that may be of interest to those involved with professional football clubs.
I was lucky to be able to present at the OptaPro Forum held in London last month, and this event’s uniqueness included the fact was that it was one of the first events that brought together football clubs and the amateur analyst community. I would like to advance this concept offering the services of the Statsbomb analytical staff to football clubs.
We at Statsbomb are busy people with real jobs and families, but we have a willingness to supply our “expertise” and analytical minds to forward thinking and innovative clubs who are willing to see the value in analytics.
Why are we doing this?
The reason I and most of the other writers here at Statsbomb, started writing is that we like being able to interrogate data to see what answers it holds. We have a special interest in going beyond the final result to try to understand whether teams and managers achieved the results that they deserved, and why exactly some teams perform better than others. It would be great to be able to combine those and other achievements, with helping to influence behaviours at a club. We know that's a very lofty aim, but it's something that we would like to work toward.
The Q&A session following my presentation at the OptaPro forum event included an exchange where it was pointed out by a club that it can be difficult to see how some of our work can be applied to real life football clubs. My response was that clubs should talk to us more so we can better understand their requirements. This offer should help in this regard. It has also been suggested that amateur analysts have not been proactive in attempting to contact clubs. Let that not be suggested ever again!
I don’t expect that this approach will suit every club, but what is there to lose? How often do people offer their services and expertise without demanding a payment? That is exactly what we are doing here.
Who would we be willing to help?
I anticipate that the clubs we would work with initially would be those that subscribe to, or have access to, detailed data from Opta or other data providers, but don’t have the time or the specific resources to be able to interrogate the data and answer all the questions that they would like to. We understand that there are many instances where the never-ending cycle of game preparation, opposition scouting, video editing and team debriefing doesn't allow the analysis team at a club even the time to think of the questions they would like to ask.
What kind of things could we help with?
- Perhaps you have some scouting requirements for possible future transfers, or would like to understand how a team tends to attack.
- In the unlikely event that you read this as an owner or a director of a club, perhaps you would like some thoughts on the performances of a manager that goes beyond the final scores.
- Maybe you want to analyse various attacking options to see if there are any small additional edges that can be gained – an example of this is my OptaPro analysis (here).
- Maybe you feel like you are not getting the rub of the green with your results, but want a more objective look at whether that is actually the case?
- Maybe you would like your organization to know general best practices for data analysis relating to football, but also want experts who can explain this stuff in simple, understandable language.
We could go on all day listing possible areas to help with, but hopefully clubs will have some of their own questions that they feel could be hugely important, but just haven't been able to answer yet. Just in case anyone had any doubts, we aren't suggesting that the use of analytics should replace the game watching and tasks already being carried out by clubs. Instead it should supplement the "traditional" analysis by being able to quickly reduce large amounts of data and help focus on what really matters.
How do we move this forward?
If anyone involved with a professional club is interested in pursuing this idea, then just drop me an email on gutties@hotmail.com and we can discuss the specific details to see if it’s likely to be a runner. Our writers have busy schedules, but as you can see from the site, that rarely stops us from spending a great deal of time analyzing football in detail.
At this stage, I would like to think we have shown that we are responsible individuals and in that regard I can assure you that any emails we receive shall remain confidential.
Let's see if this is another step towards bridging the gap between football clubs and amateur, but capable, analysts.
:Colin