 A measure of how far Tottenham have progressed off the pitch can be gathered from the gentle closing of the January transfer window down at White Hart Lane. Back in the days of Harry Redknapp and before, the transfer window was a time to do business as a queue of unwanted stars were shipped out on loan or dug their heels in and stayed while talk of Daniel Levy’s wheelbarrow of cash being shoved around Europe deep into the night kept fans on tenterhooks, hoping that a huge bid for a striker would land and February would be a new dawn for the club. The signing of Ryan Nelson and Louis Saha on the last day of January 2012 put paid to the latter dreams and alongside Redknapp’s flagrant coveting of the England job, contributed to killing off a promising bid at the top of the table. Since then expectations have tempered to the extent that not only were Tottenham fans expecting no new recruits this January, there was no possibility of a string of departing loans for high earning ne’er-do-wells. If we were to forgive last summer’s transfers, this type of player barely exists within Tottenham’s squad largely thanks to Mauricio Pochettino’s zero tolerance policy and his focus on “the group”. Only Tom Carroll departed, with another decent fee pocketed for an academy graduate and deadline day looks to be a non-event with Pochettino estimating the chances of business at "0.1%" Stability This stability is the bedrock of why Tottenham are in a position to challenge for the top four slots while retaining half an eye on the long term. The prior expectation of losing star men to sunnier climes and rejigging their team every summer--as became common before Pochettino--is largely consigned to history. A slew of long term deals for star men at the very least means that Tottenham remain in control of the destiny of their players, at least while the collective achievement of the team maintains its current level. The new stadium is well in progress and players haven’t been shy about expressing a desire to play there. Delivery of that project is a minimum of 18 months away. The plan for all this could possibly be traced all the way back to Juande Ramos. His tenure quickly turned sour, but the recruitment of a successful and feted continental coach with a view to building long term prosperity has echoed ever since. Redknapp arrived as a rescuer, then lucked into the rise of Gareth Bale, Luka Modric and a talismanic run from Rafael van der Vaart to hold his position across three and a half seasons. His departure did not come as a result of failure--for all that he should have made more of his last season, he still managed a fourth place finish--but Daniel Levy’s retained desire to hire a coach capable of building a long term legacy. Andre Villas Boas started brightly and was initially powered by Gareth Bale going supernova, but the backdrop was never solid, with Emmanuel Adebayor the emblem of squad disharmony, Tim Sherwood lurking in the background and a tiered squad that only sporadically bought into his methods. His first season was also undermined by the loss of Modric and the second the loss of Bale. Tim Sherwood was a mess and never looked capable of doing anything but holding the fort until the strategy could be rebooted, which it was with Pochettino’s arrival. And this is where it changed for the club finally pulled together with the purseholders supporting Pochettino’s black and white vision towards player retention. Players were either part of the system or discarded, with reputation or earning power irrelevant and status earned on merit. Consistency Across this peak of Tottenham’s Premier League life--a run that now consists of seven seasons of top six finishes including three top four slots--the club has finished with a ten point spread of points, with Villas Boas’ agonising 2012-13 fifth place the highest (72 points) and Redknapp’s 2010-11 fifth place (62 points) the least. Pochettino has landed fairly squarely in between these with 64 and 70 point finishes and a quick analysis of the quality of the teams across this period is broadly reflective of the outcomes. Tottenham have regularly been a dominant shooting team but the 12 month cartharsis of restabilising post Sherwood and then allowing Pochettino to rebalance the whole squad saw a slump in underlying metrics. The subsequent 18 months, started at the beginning of 2015-16 and of which we are now at the tail end, have seen remarkable consistency from Pochettino’s men. They are a relentless pressing unit, super fit, stacked full of strong players and well able to squeeze and dominate two thirds of the league at will. Metrics support the view that this team is sufficiently strong to break past 72 points, something they should have managed last season but for the obvious emotional toll that hit as soon as their title challenge mathematically ended. The current status of the team also bodes well. Somehow the dying embers of Villas Boas and Sherwood put the team on 43 points at this stage in 2013-14 but Redknapp’s final voyage in 2011-12 leads the way at the 22 game mark, with 46 points from a 14-4-4 record, the same as Tottenham have accrued this season. That Redknapp then oversaw a 6-5-5 finish was enough to mean his departure lacked mourners, and it is hard to see this team capitulating in such a manner. Twenty seven points from sixteen games would take the team past the 72 point mark and if we look at blocks of sixteen games, the lowest Tottenham have picked up since the start of 2015-16 has been 25 points with an average of 31.5. If Pochettino can just keep the ship on course, a finish in the high seventies is well within the team’s capabilities and would finally allow the obvious off pitch progress to be tangibly felt in terms of league performance. That’s not to presume Tottenham are immune to a slump as key injuries can always hit, but the reliability in which they have been able to dispatch the lesser teams in the league has improved and they have negotiated this far with players such as Harry Kane, Erik Lamela, Toby Alderweireld and now Jan Vertonghen missing chunks of time. An autumn three game run of draws against West Brom, Bournemouth and Leicester are the only league results that can be regarded as genuinely disappointing this season and while results against rivals have been typically mixed, that’s something that can be said of all the contending sides. Transfers So we reach the end of the transfer window with a vastly different outlook to years gone by. There is no great urgency to retool and the squad looks deep enough to be able to work solidly towards its ambitions, for all that the Europa League and FA Cup will probably be used as little more than outlets for squad men. Even the long term lack of back up at striker was addressed in the summer with the signing of Vincent Janssen, and despite his troubles, few fans are actively looking to replace him at such an early juncture and his mere existence is a step a head of "just Harry Kane" as a strike force. If there are concerns about the direction the club is moving in, the structure of any transfer committee appears uneasy. Paul Mitchell continues to work his leave and the late summer transfers of Georges-Kevin N’Koudou and Moussa Sissoko looked like headscratchers at the time (with little or no statistical basis to either of them), and the lack of impact made by both players implies that Tottenham may need to apply greater care to their recruitment in future. Talk of Wilfried Zaha is hopefully wide of the mark as his apparently improved contributions for a struggling Crystal Palace carry a huge red flag based on little change in his shooting or creative numbers year on year, implying he’s running on little more than a warm streak of form. Also, if we are to be critical of the team's style this year given Janssen’s difficulties in acquiring chances this season and a reduction in Kane’s shooting numbers at least in the opening months of the season, to note that Zaha has only created three chances for his centre forward, Christian Benteke all season is a stern warning not to blow another £30m on a visually impressive but functionally ordinary player in the summer. The squad is well equipped with blunt tools and a shade more nous and deviousness would not go amiss. One summer of duff signings can be survived, another one could be costly and it is to be hoped that Daniel Levy has a strategy to succeed once more in the market. Recruitment of a director of football may well be necessary with Levy likely to be occupied by the stadium project in the near future. Arguably the best signing Tottenham made in recent years was a January transfer. The purchase of Dele Alli received nearly no fanfare and he stayed at Milton Keynes Dons for the rest of the 2014-15 season before linking up that summer. A high profile player or a large fee may excite the fan base and Sky Sports News and plenty of good fortune is needed to find, recruit and nurture top talent ahead of rivals. With further Champions League qualification distinctly possible, it is to be hoped that a silent January is followed by a smart and decisive summer, with underwhelming 27 year old midfielders fresh from relegation firmly off the list.
Month: January 2017
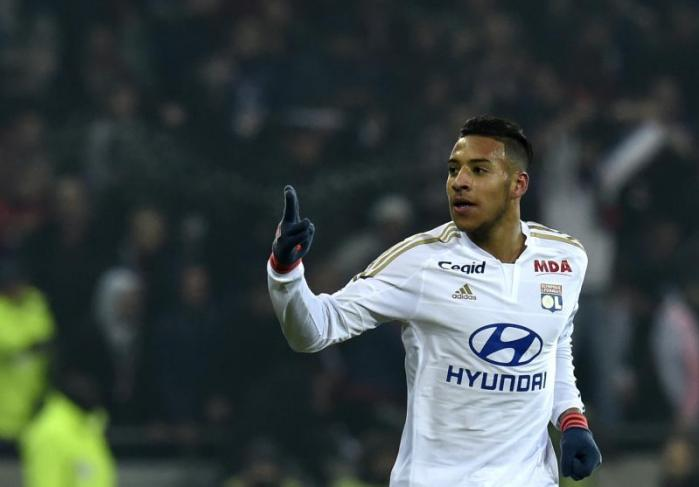
Identifying Ligue 1's Next Big Breakout Talents #1: Corentin Tolisso
It’s been a weird season for Lyon. They were tipped by some to be Ligue 1’s only challenger for PSG behind a well stocked attack full of youngsters and prime age talents. That hasn’t been the case and their season has been full of stops and starts, involving injuries and drastically changing formations. For every good performance, they have had (particularly earlier in the season), there have been equally confounding ones. Despite a statistical resume that should have them comfortably in the top three, they’re currently eight points behind PSG for 3rd place (with a game in hand) and there’s a real chance Lyon will lose out on a coveted Champions League spot.
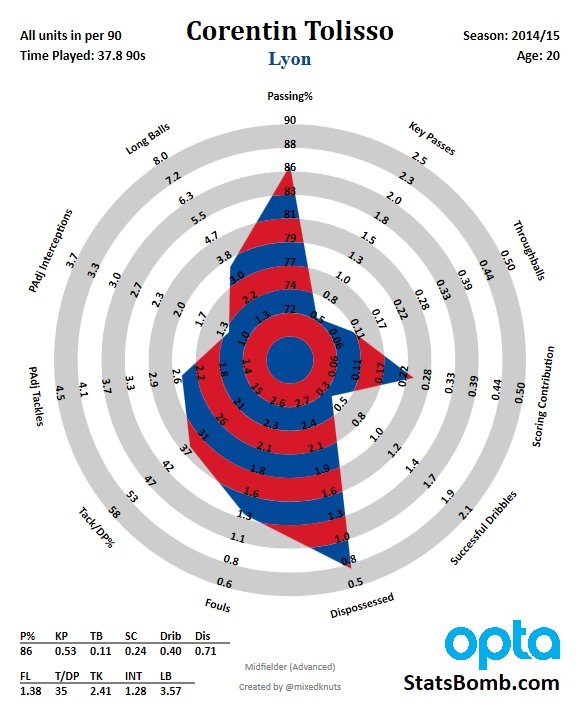
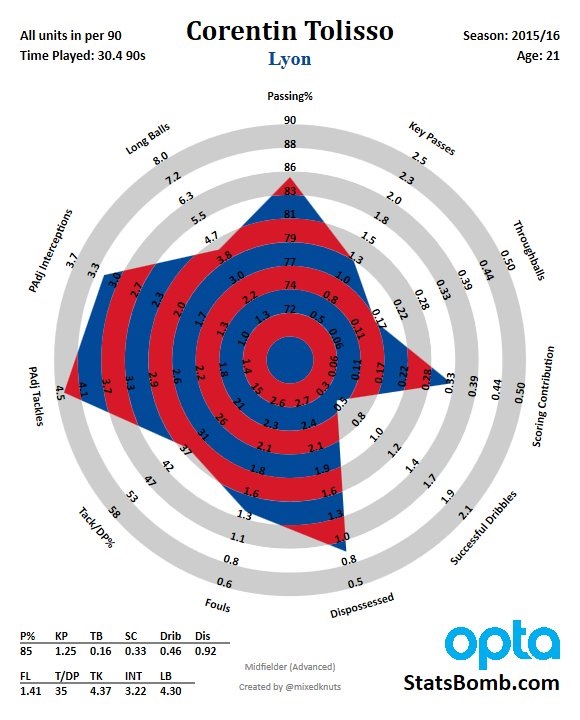
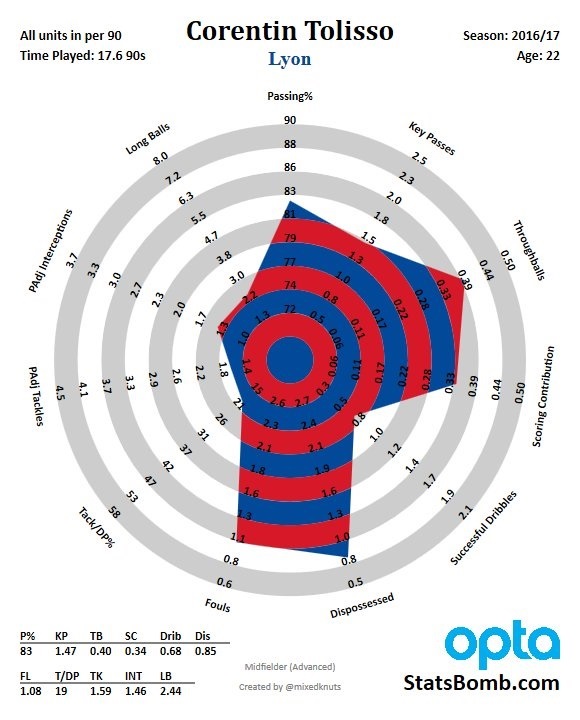
Not everything has been a disappointment with Lyon though, and perhaps the biggest bright spot is their burgeoning young midfielder Corentin Tolisso. Truth be told I’ve been an admirer of his talents for a while now and what’s been fascinating has been his emergence as a creative midfielder. All his expected goal (and assisted) rates have been on the rise and that’s mirrored his rise in scoring contribution.
If you asked me why a team should consider buying this guy during the summer transfer window, this would be my response
It’s literally everything you would want in a modern central midfielder right? The ability to cover passing lanes and anticipate an interception opportunity, being able to accomplish it while controlling the ball smoothly and in one motion pick out an extremely high value opportunity for a poacher like Alexandre Lacazette. There are a lot of other things to like about Tolisso but his ability to make this type of pass is notable.
Besides his throughball passing, the next great trait of Tolisso’s game can be seen in his flexibility, particularly in the minutes that he’s logged at more advanced positions. His overall shot volume this season has increased and that’s allowed him to be a bigger threat going forward. With the mobility he possesses, and his ability to play a variety of attacking passes, he can get into spaces to try and feed his strikers.
All things being equal, I’m not totally convinced you can play him in advanced positions for long durations of the season. As a midfielder one of the things he loves to do is to drop very deep to receive the ball, and even while playing as a number ten of second striker, he continued this habit. Some of it was probably due to how bad buildup was for Lyon during their stretch of matches when they played with a back three/five, as a lot of times the ball wasn’t progressing unless Tolisso dropped deep to become something resembling an outlet (It is a testament to his abilities that even when things look unstable, he can create shooting opportunities).
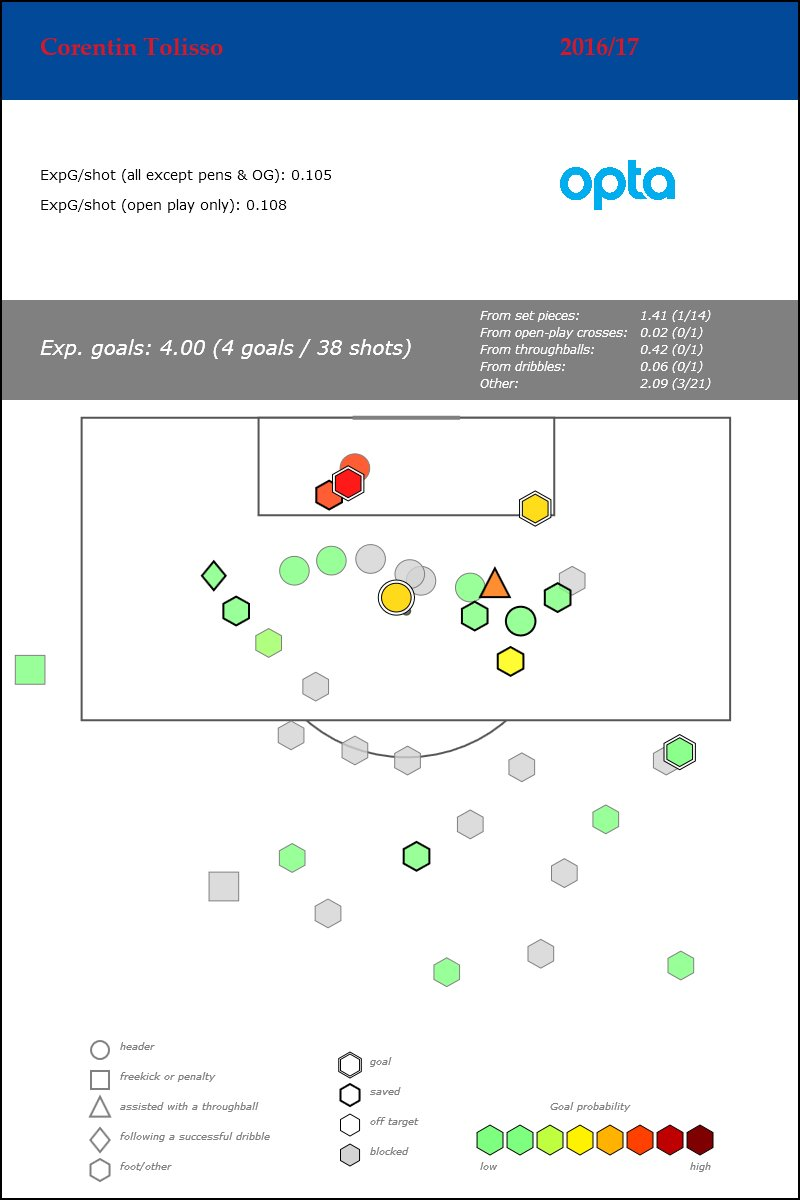
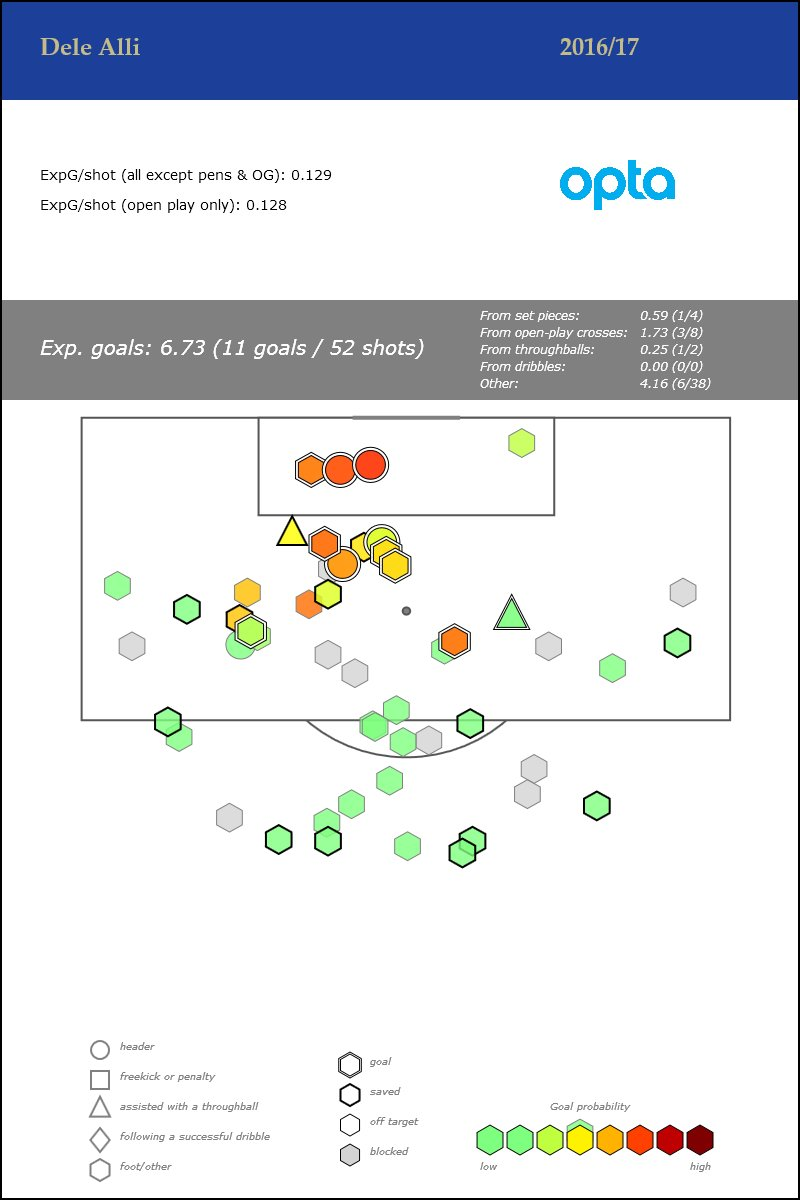
One potential theory is with the steady rise in his shot numbers, a team could sign him and create an attacking structure where Tolisso would make more off-ball runs to get into shooting opportunities. An obvious comparison would be Dele Alli. No Tolisso doesn’t have the same penchant for nutmegging every living organism on the pitch, but they both do share the ability to pop up within 20 yards of goal and present themselves as a shooting threat. Now Alli is a considerably more polished version, his dribbling abilities are markedly greater and he’s perfected the “sprint your ass off-ball to get on the end of a header” routine, but if you squint hard enough, there is a little bit of merit to this
Push comes to shove, Tolisso’s best position for now is as a central midfielder with some license to roam. He’s grown up with having ball playing responsibilities and the threat of the home-run ball from deep is too good a tool to pass up in comparison to his shot taking abilities. There’s also the little things he does deeper in midfield that could help a team in attack. Like how after Lyon regain possession from something resembling a counterpressing action, he’ll look for a quick transition pass to get his team progressing into dangerous areas.
Having strong buildup structure more times than not is helpful in developing waves of good attacks. Having good structure allows teams to space out the pitch to where they can constantly have a man advantage in dangerous areas. You’ll see this with Tolisso quite a bit where he’ll migrate into areas to help his teammates turn weird 2v2’s into more conventional 3v2’s. He’s also quite adept at migrating into vacated spaces so he can receive the ball and run to find an open teammate. These are all just little things but all together add up to a player who plays at times as if he’s 27 and not 22.
The one weakness in Tolisso’s game is he just doesn’t have much spark as a dribbler. It’s not a major weakness and he does make up for this with an adept mind for finding space. There’s also this to keep in mind; Ligue 1 isn’t a league known for teams pressing each other as most defensive actions are taken care of on the touchlines. Moving to Germany or to a lesser extent England would change this equation. You could see scenarios where teams would give Tolisso much less space to work with and having to evade an opponent with a quick turn would be more essential to unlock his passing gifts. Does he have the juice to do this constantly? I’m not quite sure, but he’s still very young and under the right coach this could be worked on substantially.
Only 22 years old, Tolisso has the makeup to be a very impacting central midfielder. He’s already displayed the ability to be versatile whether being the Doberman of the three-man midfield or in his current incarnation as an attacking hub within a double pivot. He even managed to hold his head above water in parts of 2014-15 as a right back when injuries forced Lyon’s hand. This season he’s increasingly showing more of an attacking output with a heavier usage under his belt. In a world where teams are becoming more flexible with player positioning, having a midfielder who can play in a variety of positions across the middle at a sufficient level is a useful tool to play with. If we think of teams that could be potential homes for Tolisso next season, Dortmund seems an obvious fit. Firstly, under Thomas Tuchel, the club has become the premium destination for young players to build their game while also Dortmund could use another midfielder with the ability to pass and take some of the ball circulation responsibilities off Julien Weigl.
Reportedly he was the subject of a big Napoli offer over the summer and while it didn’t turn into a move, his form this seaon has been good enought o warrant further interest this summer. Midfielders at a young age who have shown to be as versatile as Tolisso don’t grow on trees, and in this writer’s humble opinion, he’s good enough to be playing for a big Champions League club right now. Lyon currently are on the outside looking in for qualifying into the Champions League, and without it next season it’s hard to believe they would be able to entice him into staying another season when he’s shown enough to suggest he’s ready for a new challenge. A Premier League move would also make sense as his athleticism could translate into a goal scoring central midfielder. Who takes the gamble is hard to predict, but whenever they do it will one with few risks attached.
Memphis Depay: Why it hasn't worked out at Man United

When Memphis Depay signed for Man United in the summer of 2015, he was one of those rare prospects that while unproven, seem certain to succeed. He’d broken through in the Eredivisie the previous season, posting stats impressive enough for Ted Knutson to call him: “One of the best young talents in Europe… I’ve looked at quite a bit of data on young scorers and how they develop – I’d say it’s better than 50% odds that he will sell for £45M at some point later in his career.” In his last year in Holland, he led PSV to the Eredivisie title, and became the first option off the bench for a national team that started Robin Van Persie, Wesley Sneijder and Arjen Robben as its front three. More than a few people called him the “next Cristiano Ronaldo”. Things haven’t worked out. In fact, it’s hard to think of any player whose stock has fallen as dramatically as Depay’s over the last year and a half. Looking back at his enormously successful last season at PSV, is there anything that could have tipped us off to Depay’s struggles at United? Well, one thing that sticks out is his sky-high usage rate. Usage rate is the percentage of a team’s possessions ended, or “used”, by an individual player. Possessions aren’t as easy to define in soccer as they are in basketball, but using detailed event data, you can break a match into a series of distinct possession chains. The last player on each chain is the one that’s “used” the possession. See below: 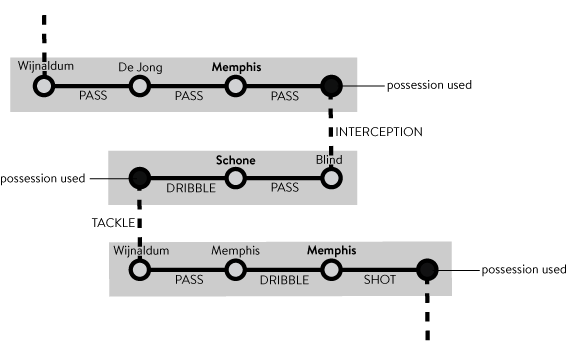 In his last season at PSV, Memphis had a usage rate of just under 19% - the highest in the league. The next highest[1] was Adnane Tighadouini (17%), who played for NAC Breda and was splitting possessions with guys called “Remi Amieux” and “Sepp de Roover”… Depay certainly put up exceptional counting stats in in 2014/15 – 0.85 NPG+A/90 – but they lose some shine if you consider that when he was on the pitch he was using almost 20% of PSV’s possessions. By comparison, his teammate, Georginio Wijnaldum, had a usage rate of 8%, and racked up 0.55 NPG+A/90. Memphis – prolific, yes, but inefficient. And if you dig into the possession data a little more, that argument holds… There are three basic types of attacking possession:
- Set pieces start with corner or a free kick. The most effective type of possession – 2.7% of these end in goals [3].
- Open play possessions are when a team forces an open play turnover and can attack immediately without any stoppages. They’re the most common type of possession. They end in a goal 1.4% of the time.
- Set defence possessions start after stoppages, such as throw-ins or kick-offs. They’re about half as common as open play possessions and also half as effective[4].
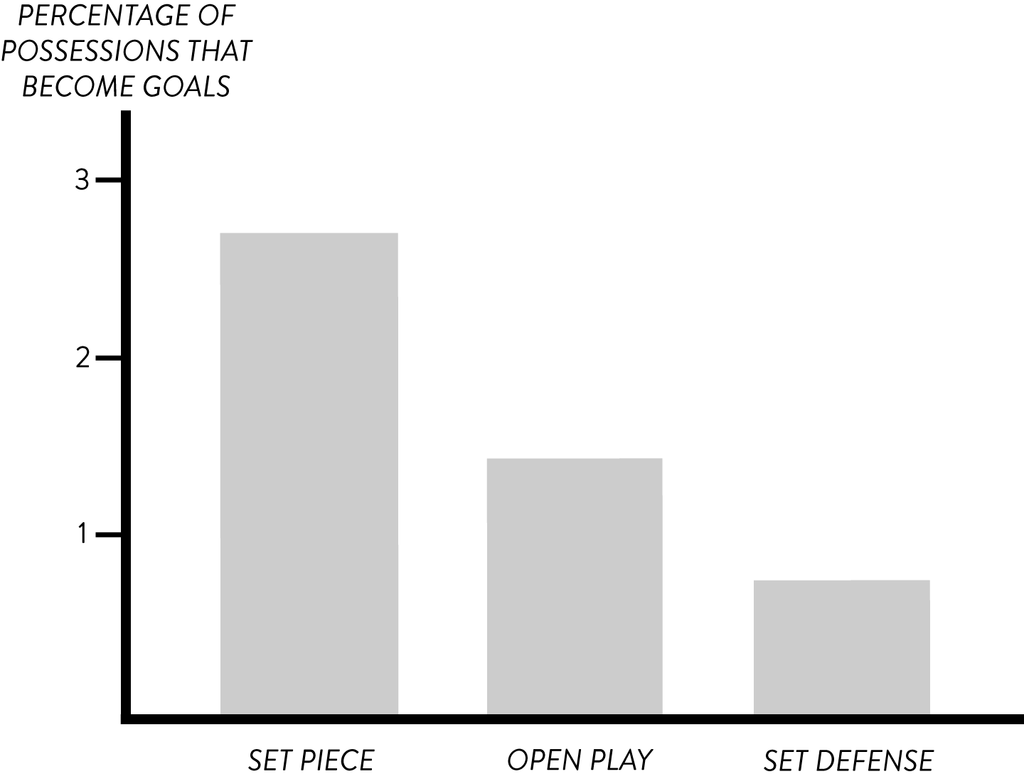 Depay’s usage rate was just above average when it came to the low value “set defence” possessions (13%), but he made up for it by using a greater share of the higher value set piece (23%) and open play (20%) possessions. That’s incredibly high for a wide forward, especially, for one on a counter-attacking team. It was the result of a concerted effort by PSV’s midfield to get him the ball – Depay was the most common pass recipient for each of PSV’s 3 main midfielders, Wijnaldum, Andres Guardado and Adam Maher. When he moved to Man United, it was a different story. The season before, Ashley Young, and Adnan Januzaj split minutes in the left forward position. Different types of players, but all relatively low usage. So substitute a high-usage playmaking hub like Memphis in for the guys just mentioned and what happens? Where do the extra possessions come from? Who is donating to the Depay cause? Um… No one. There are a limited number of possessions to go around. At PSV, Memphis was the star man and preferred option. At Man United, he was splitting possessions with Anthony Martial, Juan Mata and Wayne Rooney, (and even guys like Matteo Darmian and Marouane Felliani soak up more than their own fair share). From day one at Man United, Depay’s usage rate almost halved – 12% on those important open play possessions, compared to 20% the season before. Now, there are other reasons Memphis struggled in the Premier League, but in a very basic, quantifiable way, he’s had less to work with. At PSV, Memphis put up elite numbers at a very young age and looked like an all-world prospect. What those numbers didn’t account for was the massive number of possessions he was using, (particularly when compared to other players his age). Memphis might have been an upgrade over Ashley Young and the rest of the players who filled out Man United’s left forward rotation in 2014/15, but his high-usage brand of football didn’t fit in a team stocked with big name attackers. Depay isn’t the only one who’s run into this problem. Paul Pogba initially struggled to establish himself in United’s attack. It's only since being paired in midfield with the low-usage Ander Herrera and Michael Carrick that his form has improved. Carrick, in particular, is incredibly efficient; when on the pitch he uses just 6% of United’s possessions. And the chief beneficiary is Pogba – in games where Carrick starts, the Frenchman’s usage balloons from 12% to 18%. Just like PSV’s midfield fed the ball to Memphis, Carrick feeds Pogba. The Frenchman is by far Carrick’s most common pass recipient this season. Against Crystal Palace, Carrick completed 21 passes to Pogba! And Pogba created 4 chances, and had 4 shots, 1 goal and 1 assist. United won 2-1. My point is, it's not that these high-usage guys are bad, but they can be hard to fit, and if you want them to succeed, you need to carve out a space for them. The question that follows Memphis to Lyon is where will his possessions come from?
N.B. - here's how I'd answer that: Lyon Usage Rates 2016/17 (over 500 mins)
| NAME | POSITION | USAGE RATE |
| Nicolas NKoulou | Defender | 3 |
| Maxime Gonalons | Midfielder | 6 |
| Mouctar Diakhaby | Defender | 6 |
| Mapou Yanga-Mbiwa | Defender | 6 |
| Sergi Darder | Midfielder | 10 |
| Jeremy Morel | Defender | 11 |
| Jordan Ferri | Midfielder | 11 |
| Mathieu Valbuena | Midfielder | 11 |
| Rafael | Defender | 12 |
| Nabil Fekir | Midfielder | 13 |
| Maxwel Cornet | Forward | 13 |
| Alexandre Lacazette | Forward | 13 |
| Maciej Rybus | Defender | 13 |
| Corentin Tolisso | Midfielder | 15 |
| Rachid Ghezzal | Midfielder | 16 |
Lyon have a solid base of low and mid level usage players to build on. The standout is, of course, Maxime Gonalons, in a Carrickesque role to Corentin Tolisso's Pogba. Tolisso's is high usage, but the problems lie more with the other guys on his end of the table. Maciej Rybus and Maxwel Cornet probably aren't probably aren't giving Lyon enough for what they're taking away, so I'd play them less and Jeremy Morel and Sergi Darder more. Also, Rachid Ghezzal is doing well, but it would probably suit both him and Depay if they didn't play together too much... [1] Among players who played over 1000 minutes [3] 3.3% of the time if you include penalties [4] They become goals 0.8% of the time
Is there a hole in Mesut Özil?
I like Mesut Özil. I’m not interested in dull narratives about disappearing in big games, the guy plays football with an rare appreciation of space, an instinctive understanding of timing and makes it look as if his precision and deftness require no exceptional effort. When elite players possess these abilities, they become revered by aesthetes but can be viewed with suspicion by a hardcore who like to look for blame when results wane; he clearly doesn’t run around as much as they would like, and it's entirely possible that he's "foreign". Arsene Wenger is clearly with me in the former camp, and knew he was acquiring world class talent when spending a then large fee of around £40m in 2013. Of course Özil's chief strength is as a creator: 47 league assists in his three seasons at Real Madrid and a further 33 in his first three years at Arsenal, with 2015-16 seeing him log a total of 19, an impressive total only matched by Kevin De Bruyne’s 2014-15 season at Wolfsburg and surpassed by nobody in the big five leagues this decade.
For such an extravagant talent, Özil has never contributed a goal volume himself to match his creativity. In a career incorporating eight full seasons he hasn’t exceeded nine league goals, or thirteen in all competitions, and that’s something that appears to have frustrated his current manager. Wenger has spent much of the season organising his team with an altered frontline to last season, empowering Alexis Sanchez to move forward, bringing through Alex Iwobi and marginalising Olivier Giroud. Özil has occupied the centre in a typical attacking midfield role but these changes have contributed to an unusual outcome: he has more goals than assists this year (nine to six, all comps). Judging by recent comments from Wenger, he’s in favour of turning his chief creator into a more decisive goalscorer:
“I think what you want of him is to score goals, certainly we all feel there is still a gap between what he can do [and what he delivers on the pitch]. I think he is moving in the right way but with such a talent maybe you are a little bit unjust because you want always more. You feel there is no limitation in his game and so you are always ‘come on, give us more’. You always have the feeling that they can do more. This is not a frustration, it’s a target.”
This seems to miss the obvious benefit of using Özil as the creative force in the team--and others as the finishers.
2015-16, creator par excellence
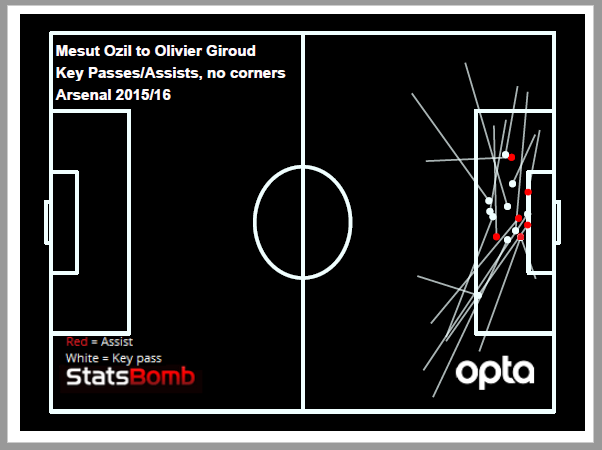
Mesut Özil’s 2015-16 is one of the great creative seasons. Not only did he record 19 assists, but they were derived from 144 chances created, more than any other player in a top five league this decade. This chart is busy and has corners (and three assists) removed for a little clarity:
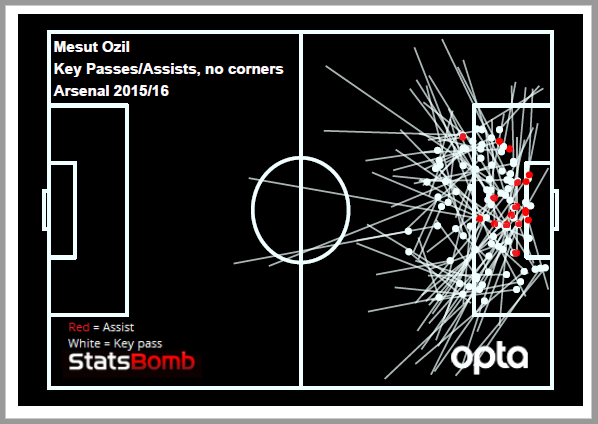
Özil created opportunities from everywhere and a stack in good locations, which bore rich reward. The four chances per game created were worth around half a goal per 90, an expected rate he matched. This is obscenely good. When a player is creating opportunities for his team at this level, any concerns about their personal goal total are secondary, and by a long way.
Mesut Özil’s 2016-17 season is not quite so impressive:
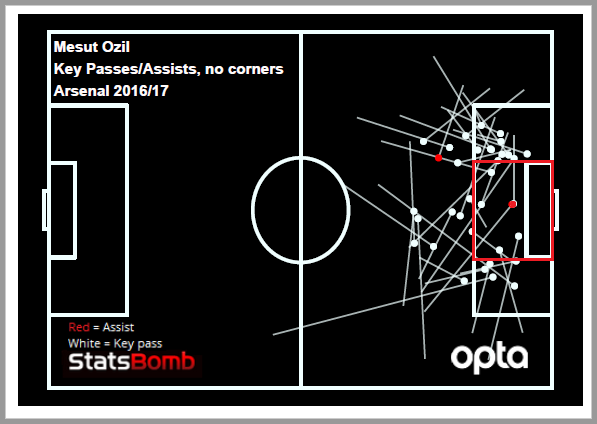
The red rectangle highlights two things. Firstly, this is where players usually score goals from--the red dot indicates Giroud’s Boxing Day header to break the deadlock against West Brom (clues...)--and secondly, for Özil, it’s practically empty. This season he is creating around 2.6 chances per 90, down from around four per 90 last season and also down on his previous two year's rates of a shade over three. And the drop off is almost entirely down to his failure to connect with teammates in good, central positions.
Team contribution
He missed a deal of time in 2013-14 and 2014-15, but if we look at the games he played in, his expected assist rate tracks uncannily with Arsenal’s team expected goal rate across his time at the club:
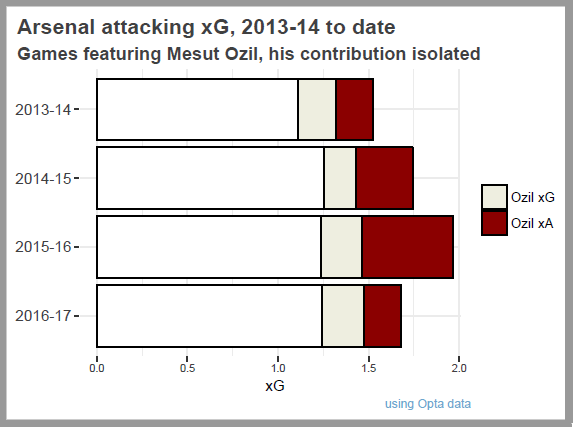
The obvious takeaway here is how Özil’s ability to create chances (xA) has been intrinsically linked to Arsenal’s overall goal expectation. Also worth noting is the consistency in his expected goal rate, which has barely moved, even allowing for Wenger's apparent desire for him to score more frequently but also we’ve posed some questions. Was 2015-16 the outlier or the norm? Can we expect that level of creativity again? Are there a confluence of factors that enabled this extended output?
Özil’s first and third seasons at Real Madrid found him creating around four chances per game--many of which were for Cristiano Ronaldo, who then publicly decried his sale--and that again worked out around half a goal per game, so there’s a clear precedent for Özil to hit these kind of numbers, albeit with one of the world’s great players as a target. Then again, Arsenal are a consistently high ranked team within the Premier League too, so for Özil to be capable of hitting an equivalent to the expected assist rate that he managed before as we saw in 2015-16 was never entirely implausible.
But what are the factors that enabled Özil to hit such a peak? And why has he dropped off so precipitously this season?
Core partnerships in shot creation
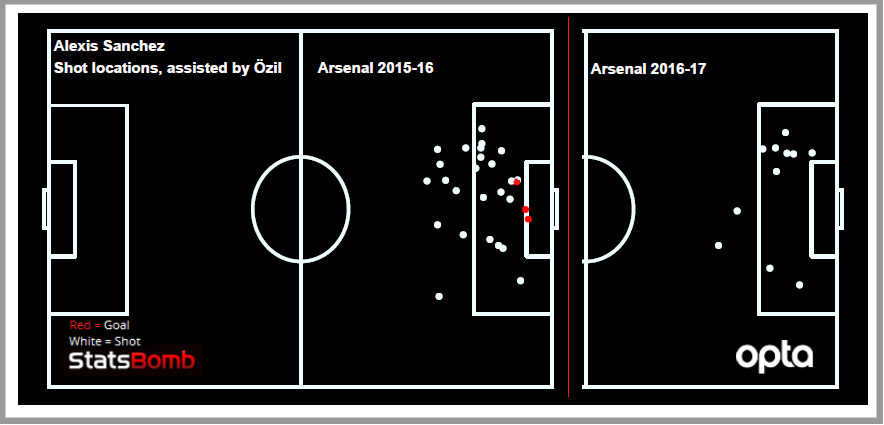
Across his three and half seasons at the club, Özil has reliably teamed up with the same core of players when creating chances. Santi Cazorla, Aaron Ramsey and Olivier Giroud have been part of the squad throughout while Alexis Sanchez came on board in 2014-15 and has generally found the German’s wavelength. The indestructible Chilean missed December 2015, but has otherwise been almost ever present in Arsenal’s first choice line up and has led the combinations with Özil in each of the last three seasons with 13, 26 and 11 so far this year. However, the expected value per shot was significantly higher in 2015-16 to 2016-17 (0.126 per shot compared to 0.077), something that’s easily understood when we look at Sanchez’s shot locations supplied via Özil:
The other three have all spent significant spells out of the side due to injury:
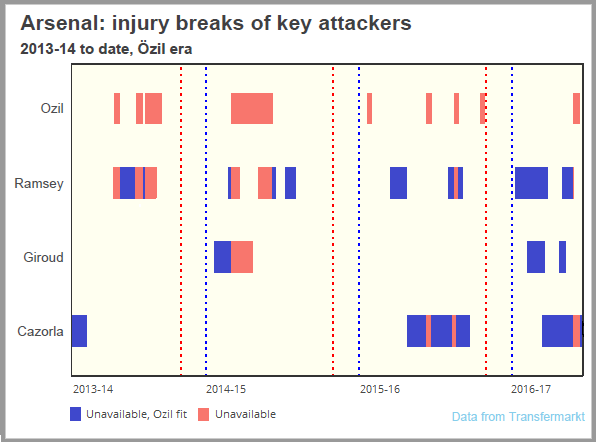
Cazorla’s miserable fortune with injuries have killed his last two seasons, but during 2013-14 and 2014-15, while playing thirty plus games in each, he ranked 1st and 4th for chances received by Özil with 13 and 7, so merits a quick mention here. Despite also missing huge chunks of time, Aaron Ramsey consistently ranks well for receiving key passes with Özil; third on the team in 2013-14 with eleven, second in 2014-15 with ten and during last season, second again with 19. During last season in particular, Ramsey was making the right runs and Özil was finding him:
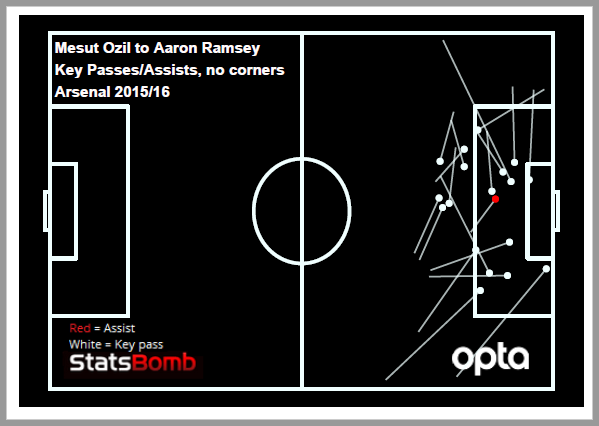
The seven key passes in the central in box zone Ramsey alone received from Özil during 2015-16 matches the volume of chances Özil has laid on in that zone for the entire team this season. That's a stark difference and while the connection with Ramsey created good volume, the quality of the chances Özil built for Giroud in 2015-16 starts to help us understand the prime difference this year:
Largely a mix of free kicks, cutbacks and crosses, the Özil to Giroud combination certainly hit a hot streak (six goals from 17 attempts) but when locations are as close and central as seen here, the chance of a high conversion rate is significantly increased. They're good chances. The duo were also extremely effective in generating chances from corners. Just the one goal but Özil found Giroud with 16 across the whole of 2015-16. Is that a lot? Yes: no one passer to shooter combination achieved a higher total across any big five European season this decade; and it's an extremely useful addition to an attacking armoury.
Sanchez as striker, Giroud benched
With the effectiveness of Özil and Giroud so evident, it might seem odd that Wenger spent much of this season rebuilding his attack around Alexis Sanchez in a central forward role. Giroud’s central threat has been missed and Sanchez offers no direct threat from corners (Özil has found him three times in three and a half years). As shown, Özil has primarily had great success in linking with Ramsey, Giroud and Sanchez and this season the Welshman and Frenchman have a meagre four starts each from the 21 games played. Each of Giroud and Ramsey have spent spells out injured, but Giroud's lack of game time has largely been a strategic choice from Wenger: he has come off the bench ten times, playing an average of 17 minutes per appearance while also missing the squad entirely on three occasions.
Giroud may well be a streaky performer but if we consider that Sanchez’s performances appear to remain of a high standard however he’s used in the team (for all that he is better from the right if asked to play an attacking midfield role), we can deduce that picking a side to also get the best from Özil is a smart strategy. The evidence from the expected goal chart shows that a creatively hot Özil translates into a hot Arsenal. Fortunately for the team, it appears that Wenger may have recently worked this out. Giroud has started and scored in Arsenal’s last five competitive matches and Ramsey is once more fit and has started the last three. The first goal against Swansea was an embodiment of all I've shown, Özil released Ramsey into a dangerous position with a precision throughball, Ramsey fluffed the shot which screwed out to Sanchez, who lobbed the ball onto Özil’s head, his attempt blocked, Giroud finished the rebound. All four of Arsenal’s key men interacting and Özil once again central to it all.
The crux here is that the primary building blocks of Arsenal’s attacking strength during 2015-16 were Özil’s creativity and the interactions of these players with him. There is now a need to focus on an attack involving Ramsey, Özil, Sanchez and Giroud. This means that only one of Alex Iwobi, Lucas Perez, Theo Walcott, Danny Welbeck and Alex Oxlade-Chamberlain are likely to start with Granit Xhaka, Mohamed Elneny or Francis Coquelin (presumably alongside Ramsey) in central midfield. That the club have such a range of alternatives is testament to the underlying strength of a squad fully used to competing on multiple fronts but also regularly having to overcome injury crises.
By any objective measure, Özil and Sanchez are Arsenal's two star attackers and while early in the season it looked superficially as though Arsenal were set up to make them the main focus of their attack, the outputs since have shown that what has worked for Sanchez has stymied Özil. In most seasons, that might not make too much of a difference to Arsenal's inevitable rise into the top four, but this year the margins are thinner. It simply will not pay for Wenger to employ his attackers in a format that does not enable them to produce their best; fifth or six place are entirely possible outcomes for any of the teams chasing Chelsea should they suffer even a brief dip in form. To land there would increase pressure on Wenger and calls for his departure would intensify. Would Sanchez then stay? Would Özil? Arsenal need to keep their destiny in their own hands and add some impetus to their attack, with a blueprint clear enough.
Mesut Özil has had a clear hole in his chance creation this season, and needs his manager to stop worrying about his goalscoring and make the right selection choices to plug it.
________________________
Thanks for reading @jair1970
Player Vectorised Representations: What player lists can we draw up with confidence?
 I love drawing up lists and rankings of players (who doesn’t?) and giving myself a big “confirmation bias” pat on the back when I see players on the list which I like while casually either ignoring as a mistake of the method or updating my bias for the players on the list which I don’t particularly rate highly. However, the very exercise of drawing up lists and rankings can be misleading for the probabilistically-illiterate because it seems to imply set-in-stone certainty about who the best player is, who the second best is, etc.; and this rigid numbering masks the underlying concepts of probability. And yet, drawing up player lists is key for the recruitment workflows of clubs, be it in drafts or transfer windows, or even just to set up a schedule for their scouts. You definitely don’t have to see the rankings as set in stone, but I can imagine clubs would definitely want to have things like 15-men shortlists with 2 or 3 ‘favourite choices’. In this entry I’m going to show you a couple of lists I drew up and how we can go about our list-making with confidence with vectorised representations of players. I drew up lists for this entry using the player passing motif ideas from previous entries. The passing motif methodology produces a vectorised representation of players, which basically means that each player is represented by a vector of numbers. In the passing motif methodology I’ve used so far, the vector representing each player has 45 entries or numbers. The key conceptual bit is that when you have this type of vectorised representation, you can imagine each player as being in a “space” of some sort. To imagine it, suppose that instead of 45 you simply had 3 numbers representing each player, something like age, height and weight. If this was the case, you could imagine each player as being represented by a dot in a 3-dimensional space much like your living room. Some players would be closer to others, some would be farther away. Perhaps all the senior, tall and heavy centre-backs are located around your TV, while the shorter and lighter second strikers are hovering around your dining room table. This is just how I conceptualise the result of the 45-dimensional passing motif methodology. It makes it more abstract to picture, but just as in the 3-dimensional case, there are distances, certain dots closer to each other or concentrated around certain areas, etc. The list I drew up basically took all the players who had at least 18 appearances in last year’s Premier League, and gave them “points” according to how many key passes they made AND how many key passes the players around them made. The closer to a player you are, the more “points” his amount of key passes awards you; the farther away the less. I tried this out in a few ways but that’s the basic idea. The idea is that if you happened to make few key passes in the season but all the players whose motif vector is close to yours made a lot, you should still have a high score. If the information contained in the motif vectorisation is at all useful to recognise players with creative potential, then the best scored players should in a way be the best creative passers in a more profound way than simply looking at the Key Passes Table. The question is precisely, how do we know the vectorisation’s layout of players has anything to do with their “key passing ability” (i.e., players with high ability cluster around certain areas of this “space” and are in general closer to each other)? Let’s look at the list before we begin to answer this question so everybody gets a bit excited before it dawns on them that I’m actually rambling on about some technical stuff.
 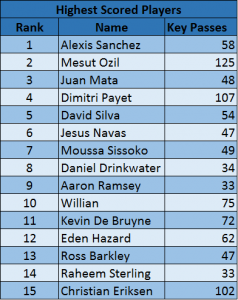 Remark: Notice how this list isn’t strictly correlated with key passes. Drinkwater is better ranked than Eriksen even though the latter had many more key passes. This means that if the list is sound (big if), its picking up on information that wasn’t immediately and explicitly available in the key passes tables. My confirmation bias seems to like that list quite a lot, there are a lot of good names up there. Most readers probably follow the Premier League closely and know that those are all good attacking creative players, arguably the best in the league. Now imagine that instead of the Premier League, we drew up an equivalent list using data from leagues where we didn’t already know the players, and had confidence that just as in the case of the Premier League, we were definitely getting out a list of most of the best players. Should be useful huh? There are also some notable absentees. Coutinho comes to mind as a player which is widely agreed to be amongst the best in the league who isn’t on the list. Why should we trust a list that claims to rank the top 15 creative players in the league but leaves out Coutinho? As I said before, I think of the vectorised representation as encoding the information regarding players’ key passing ability if players who tend to have a higher number of key passes are more or less clustered together as opposed to randomly located mixed with all the other players. If this is a general trend, then we know that there is a relationship between a player’s key passing ability and his location in the 45-dimensional space we are imagining. Even if a player happened to not have many key passes in a season (this can happen just as strikers have goal droughts or perhaps because a player’s teammates don’t make good runs), we should still pick up on this “ability”. What we would need then to justify our faith in the list is some sort of indicator which specified just how “clustered together” players with higher number of key passes are. There are many ways to approach this problem in mathematics. For those readers who have mathematical backgrounds we could try to fit a model and asses the goodness of fit, or apply some sort of multi-dimensional Kolmogorov-Smirnov technique comparing the actual distribution of vectors and key passes with one where the key passes where distributed randomly. However, all these tests are a bit technical and hard to apply in high dimensions, and all in all we really want an indicator more than a model of “Expected Key Passes”. Here’s a simpler validating technique: For each player, take his K (in mi list K=10) closest neighbours and compute the standard deviation of their key passes. Once we’ve done this for every player, we can compute the mean of the standard deviation of key passes in each of these K-player “neighbourhoods” (let’s call it the ‘mean of neighbourhoods’ variation number=MNV’). If in each neighbourhood the players have a relatively similar number of key passes, then the MNV should be comparatively low. The important question is: what do we compare it to in order to know if its low or not? I feel that there are two important numbers to compare this number to. The first would be simulating many (many) scenarios where the key passes are randomly permutated amongst the players and comparing the real MNV number to the average of these simulated cases. The second number would be the minimum MNV of any of the simulated scenarios. If the MNV of our actual vectorised representation is “low” in comparison to these simulated scenarios, then we know that the players’ layout in this imaginary 45-dimensional space clusters the key passers of the ball closer together than random distributions; which in turn would mean that the logic applied to obtain the list has a robust underlying reasoning because a player’s location in the 45-dimensional space should have something to do with his “key passing ability” (I fear I may have lost half the readers by this point…). Here are some results:
 ![]() Of the 100,000 simulations, the lowest MNV was 14.62 while the actual MNV is 11.86. This means that if we randomly assigned the players to a position in the 45-dimensional space 100,000 times, none of those simulations has the key passers clustered together better than our actual passing motif representation. This is quite promising, but even then, I suspected that maybe this is because the method clearly recognises the difference between defensive players and attacking players and attacking players are much more likely to get more key passes; so I repeated the validation using only attacking midfielders, wingers and strikers:
Of the 100,000 simulations, the lowest MNV was 14.62 while the actual MNV is 11.86. This means that if we randomly assigned the players to a position in the 45-dimensional space 100,000 times, none of those simulations has the key passers clustered together better than our actual passing motif representation. This is quite promising, but even then, I suspected that maybe this is because the method clearly recognises the difference between defensive players and attacking players and attacking players are much more likely to get more key passes; so I repeated the validation using only attacking midfielders, wingers and strikers:  The results are less overwhelmingly positive, but even when just looking at attacking players, the actual layout surpasses any random distributions of the players after 100,000 simulations. To appreciate the value of this method and what information this is actually giving us, let’s compare with an equivalent list drawn up using ‘goals’ to award points rather than ‘key passes’ (using only attacking players again for the same reason as before).
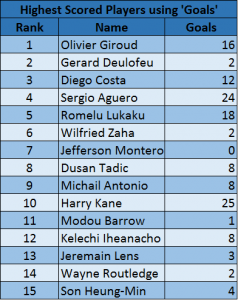
 The MNV numbers are naturally smaller because players score much less goals per season than key passes, so the overall scale of the problem is smaller. We can see that even though the real MNV is smaller than the average of the simulations, its actually relatively large when compared to the minimum MNV obtained through random simulations (notice how important it is to have a frame of reference to know when the number is small and when it is large in each specific context). This means that the position of players and goals in the 45-dimensional space can be clustered together through random simulations considerably better than using the passing motif vectorised representation. As opposed to the ‘key passes’ case, this vectorisation doesn’t encode much information pertaining to “goalscoring capability”. This actually makes sense though since the passing motif methodology is designed using only information from the passing network which doesn’t necessarily contain information regarding finishing. Therefore, the list made using ‘goals’ is much less reliable. Coming back to Coutinho’s absence from the original list, it’s important to understand that I’m not claiming the list as a know-it-all oracle for creative talent and that this talent can be rigidly ordered. What this entry tried to show is that there is solid evidence that a player’s position in the 45-dimensional space determined by the passing motif methodology encodes a good amount of information which determines how many key passes he ought to have given a sort of “passing ability”. That doesn’t mean it encodes all the information. Perhaps the vectorised representation is missing out on what it is that makes Coutinho great. Nevertheless, once we’ve accepted and understood that the list will offer us, I doubt any club could claim that a list like this from different leagues from around the world is of no use to their organisation just because they might miss out on the Serbian League’s Coutinho (sadly, such is the ‘glass half empty’ prejudice that analytics face). Finally, this way of looking at the problem of rating players opens the door to a host of possibilities. When I was doing my bachelor in pure mathematics I was actually more interested in differential geometry and topology courses than statistics courses, which is why I tend to think of data observations as vectors in high-dimensional spaces and think that their positions in those spaces encodes valuable information. This entry began by taking a vectorised representation (passing motifs vectors) and established that if we look at the number of key passes each player made, the players’ vectors’ position in this space seemed to encode this info. On the other hand, it didn’t seem to encode the information pertaining to goalscoring. That isn’t to say it might not encode information regarding other metrics. Expected Assists maybe? It also doesn’t mean that other vector representations don’t encode some of this information better than my own passing motifs representation. It’s a bit of a 3 step thing really: 1. Find a vector representation, 2. Check what sort of information it seems to encode well (especially information that isn’t explicitly available elsewhere), and 3. Find a way to give players a rating using this fact. I hope this way of thinking encourages other analysts out there to try their hand at this sort of work!
What's An Advantage Actually Worth In Football?
 If you happen to own a football team and you employ a General Manager or a Director of Football or some position with similar authority and that person thinks data analysis isn't worth it because it only provides a 55-45% advantage, fire that person. You should probably even do it before lunch. The genesis of my first foray into amateur HR actually comes from something site proprietor Ted Knutson retweeted. https://twitter.com/ianlynam/status/818581172900872192 Admittedly, that tweet is about the other football. The Marathe in question is Paraag Marathe. According to the San Francisco 49ers team website, he's the team's Chief Strategy Officer & Executive VP of Football Operations. This isn't really about Marathe (or his employment status), or Ian Lynam (the original tweeter). It's about the difference between 55 and 45. Obviously, that's a huge advantage. Right? Seems like it. I even replied as much. Thing is, when I did that, I actually had no idea (beyond intuition) about what a 55%/45% mismatch might look like. It turns out—and now we're dealing with the football as the rest of the world knows it—it looks like this.
 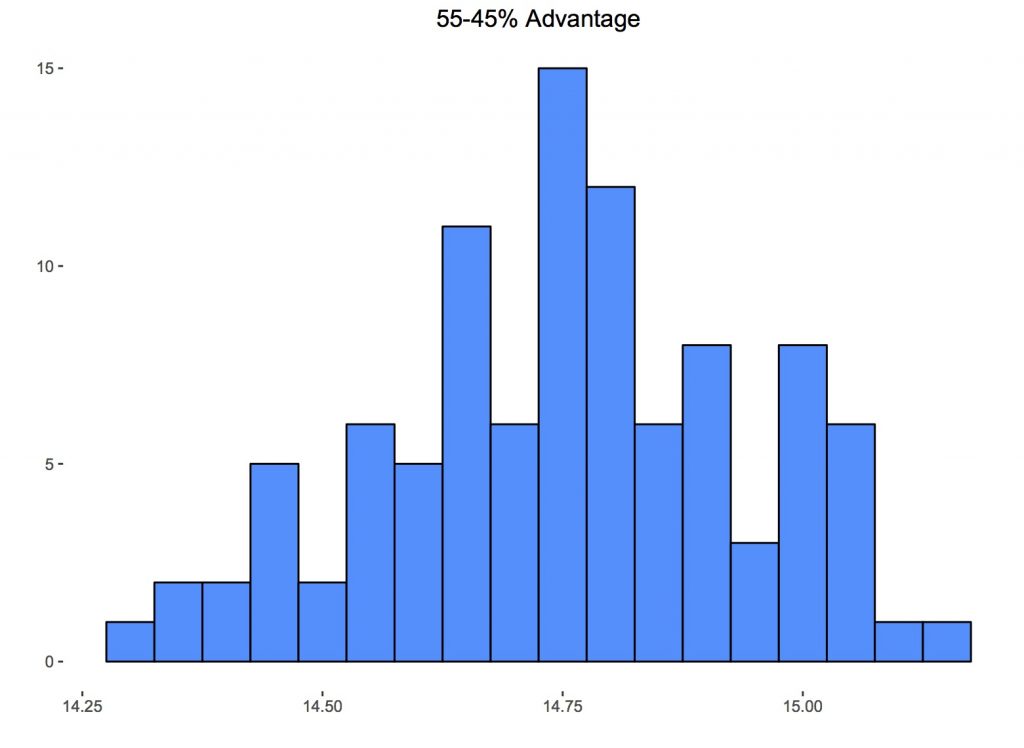 That's 100 different 38-game seasons with a 55/45 match-up sim'ed 10,000 times. So what exactly is that? Let's explain by starting with some assumptions. The first of which is that there are about 2.5 goals scored in a game of football. This isn't so much an assumption as an approximation of what happens in the real world. From this chart here you can see that the top four Euro leagues have all converged to just a tad above 2.5 goals per game. The Dutch don't want to seem to play nice (or defense as the case may be). Let's further assume that we have two evenly matched teams. That means when they play, they split the 2.5 goals per game. Even Steven. But goals in real games are discrete—one goal, two goals, etc.—you can't score a fraction of a goal. You can, however, accumulate 1.25 worth of expected goals1. Now, even though these teams can be equally good, they are almost certainly never identical. They won't 'score' 1.25 expected goals the same way. One team might score like this: 0.148, 0.057, 0.079, 0.007, 0.082, 0.060, 0.098, 0.206, 0.088, 0.219, 0.049, 0.045, 0.021, 0.092 The other like this: 0.324, 0.074, 0.046, 0.018, 0.177, 0.088, 0.219, 0.135, 0.112, 0.020, 0.037 If the teams were equal in identical ways, each would win the same percentage of games. But here they aren't identical. The first team clearly has Phillipe Coutinho on it. If you run 10,000 sims with the above numbers, the first team wins 35.58% of the time and the other 36.02%. By just tweaking the individual shot probabilities we're trying to mimic some of the randomness inherit in the game even between similarly matched teams. 2 That's our starting point—we have two teams with equal total goal probabilities3. Next we do an expected value calculation for points based on the outcome. Numerically that's: (3 * .3558) + (1 * .2840) = 1.3514 points (3 * .3602) + (1 * .2840) = 1.3646 points Here the first team gets 0.0132 fewer points out of this game. That's practically nothing. Do it 38 times; that's one season. Do one hundred seasons and you get this:
 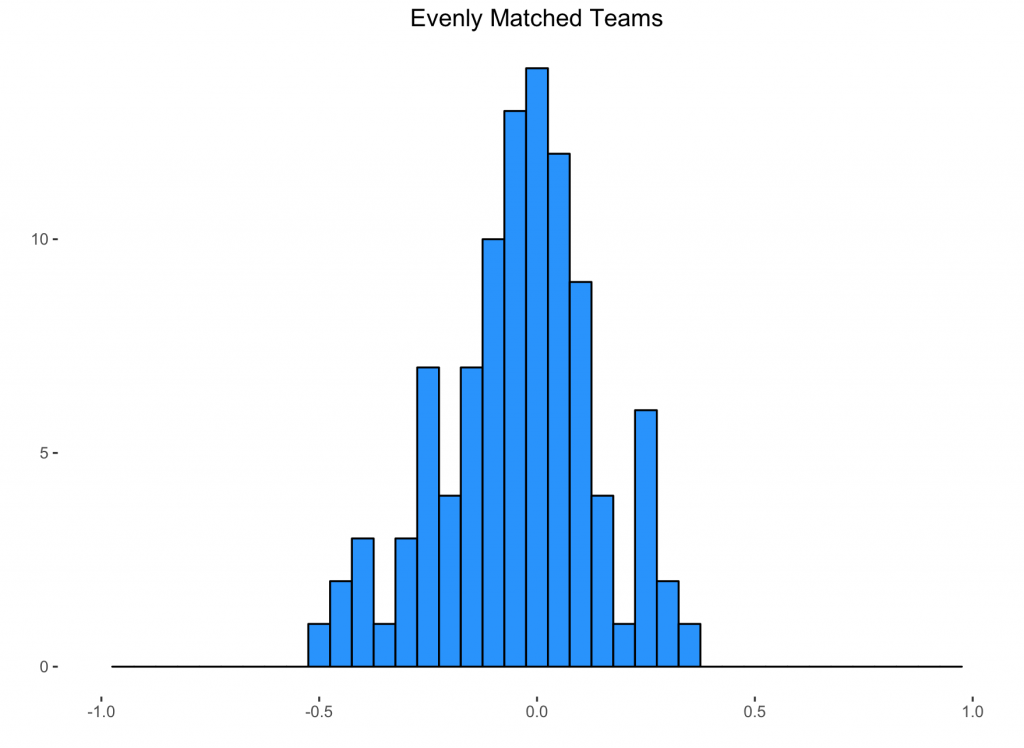 Notice most of the data is right around zero (our x-axis is showing the point differential between the teams over an entire season). This is a really involved way of showing that if two evenly matched teams play a lot of games, they generally end up generating the same amount of points. Shocking, right? Well, the beauty of doing this on a computer is that it takes about 65 seconds, instead of 6500 years4. That's if nobody sleeps. Hope one of the teams signed Alexis Sanchez. And that he's immortal. The more important beauty of doing it this way is now that we've created a baseline, we can see easily see what movement away from it looks like. Oh, actually we've already done it. That's the graph up top. For it, we took those same two even teams and said, 'Okay, now instead of being equal, let's give one a 55%/45% advantage over the other.'5 This is the advantage that was dismissed in our seed tweet. In football (still fútbol), that works out to 14.75 points on average. That's a lot of points (more than I would have ballparked anyway). In fact, last season, if you had given 14.75 points to a plucky little mid-table team like, say, billionaires Chelsea, it almost would have put them in the Champions League. Almost. Banter aside, 14-15 points is usually right around the point differential from missing out on Europe entirely to sneaking in to the last CL spot (in England... I didn't look at that other leagues). Now, one team getting 5% better doesn't necessarily imply the opponent getting 5% worse. I mean if the 5% is a global sort of improvement, then maybe. But making your offense 5% better doesn't necessarily imply you also made your defense 5% better. But here, to meet the terms of the original tweet, that's what we did. We increased one team's expected goals performance in a game by 5% and decreased the opposition by 5%. If you just get 5% better (without any impact on your opponent) the increase is half of the 55/45 split, about 7.4 points. The average point differential this century from the last Champions League spot to the next place on the table (read: usually Tottenham) is only 4.6 points. Ten percentage points is ridiculously large. Given that it comes from a character-limited medium it begs for a little context. It does ultimately involve the San Francisco 49ers. They might have usurped the mantle of the least functional front office from Cleveland (where they might finally be making not-terrible decisions). So nothing would be too surprising. Still, that smart, hyper-competitive people would causally dismiss any advantage like that is a little baffling. To bring it back to the global game, advantages can be small and have an enormous impact. If the movement from 'equal' is just +/- 1%, that's worth almost three full points. The mean advantage is 2.954. The difference between safety and relegation in the EPL has been more than three points only four times in the last 15 seasons (it was exactly three in 12-13, 13-14, and 14-15) with the average being 2.4 points. Just to be clear let's reiterate: the average distance between relegation and staying up is 2.4 points. The average gain from a 1% improvement (and that's both offensively and defensively) is just under 3 points. The latter is larger than the former. True, we did this assuming an average team. And the bottom end of the table is usually populated with bad teams. Average teams don't need three points to stay up and bad teams don't score 1.25 expected goals per game (although 03-04 Leicester, 10-11 Blackpool and 11-12 Blackburn went down scoring 48, 55, and 48 goals respectively; both of which are more than 1.25 actual goals per game). But consider that, in six of the 15 completed seasons this century, relegation was decided by one or zero points. That's 40% of the time. Massive edges (say, 10%) might not be realistic but if you're not very good, and the difference between staying up and going down (and the loss of a cut of the EPL's £5.14B TV pie that goes with it) is pretty tiny—and often it's literally one goal—you kinda can't afford not to employ people who can help you get that 1%. None of this is particularly new to people doing analytics. In fact, it's probably getting tiresome in the way that talking to a wall probably gets old. If there's anything novel here, it's that I had never made even a cursory attempt to quantify what a small advantage might look like. But man, as the financial stakes get larger, at some point poo-pooing even the smallest edge will be indefensibly foolish. If it's not already.
1 'Hey wait, aren't you that guy that hates expected goals?' Let's go with 'Yes' for now as it's a shorter conversation. But I did also say (paraphrasing): there are absolutely situations in which putting a probability on a shot is very valuable. This falls under that. 2 When looking at shot probabilities how they are distributed matters. If you don't understand why that's the case, read this post, paying attention to the part about Team Coin and Team Die (you should read the post anyway because it's really good and contains a lot of useful information). Even if teams are even and identical it changes their expected points. In other words if each team scored 1 goal on two shots of .5 probability, each team would expect to win 35% of the time. If each team scored 1 goal on 10 shots of .1 probability, each team would expect to win just 31.25% of the time. 3 These aren't even 'real' probabilities. Using a beta distribution I mimicked what a shot probability profile looked like. A beta distribution basically gives us probabilities of probabilities so adjusting the shape parameters we can approximate an average team. Anyway, we're randomly sampling from that distribution. 4 It's 38,000,000 total 'games'. 5 How you even quantify 'we're 5% better' in many areas is something I'm not even sure how to do. For the sake of ease, and to make this doable in a very simple way, the entirety of the increase or decrease is manifest entirely in shot quality. So moving from 50-50 to 55-45 is moving from 1.25 v. 1.25 in cumulative expected goals to 1.375 v. 1.125.
Serie A 2016/2017: Half Season Review
 The first match-day of 2017 coincided with the conclusion of the first half of the 2016/2017 Serie A championship. Or, rather, it should have coincided, since the Italian Super Cup and the snow of this cold start of the year, mixed up the schedule with Juventus, AC Milan, Crotone, Bologna, Fiorentina and Pescara played a game less than the others did. The symbolic turning point of the season remains the best moment to make a partial appraisal of the championship and having fun making some predictions about the league outcomes. To compensate the different amount of games played, it was necessary to use averages and this explains why expected goals difference and non-penalty goals difference are presented in a per game format. Expected goals data are from l’Ultimo Uomo xG model created by Alfredo Giacobbe. For an explanation of the model click here (Italian). How Juventus is superior to everyone else Even with a game less than their rivals, Juventus are solidly leading the Serie A with a 4-point advantage over Roma. Thus, they have the possibility to go +7 once they will have played their game against Crotone. Allegri’s team is reinforcing its position as favorite for the Scudetto, which would be their sixth in a row. The distance between the Bianconeri and the rest of the league is well depicted by their average non-penalty goals difference: +1.33. A figure significantly bigger than any other team: Napoli stops at 1.00, Roma doesn’t exceed +0.79, while Lazio (+0.53) is the only other team with a difference bigger than +0.5. Looking at the average expected goals difference, Juventus are still in front of everyone else, even if in this case the difference gets thinner: Roma and Napoli answers with +1.03 and +0.97 respectively to the Bianconeri +1.05. Juve confirm their leadership also in regards of expected performance, but they have created the gap in the table thanks to their technical superiority over the rest of the league, which allows them to go (once again) above expectations. As it was the case during past seasons, defence it’s Juve’s secret weapon, since they concede just 0.6 xG per game.
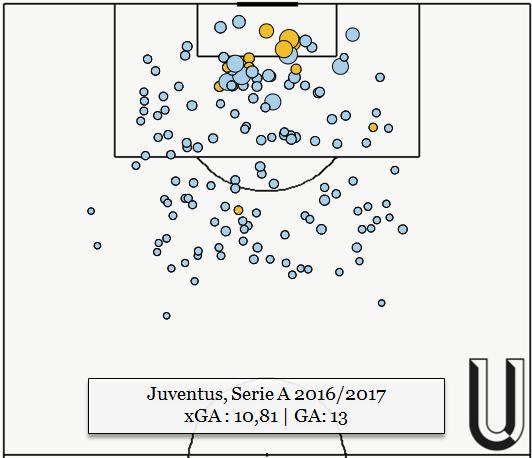
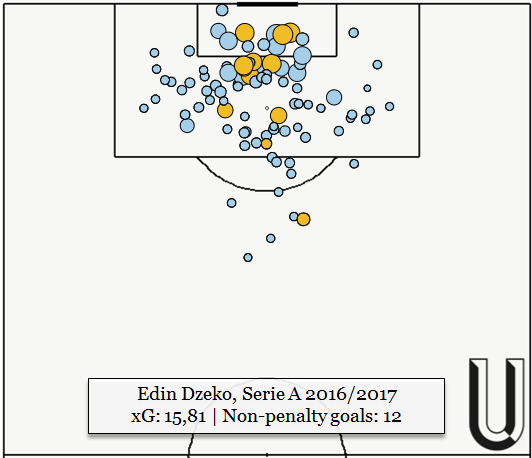
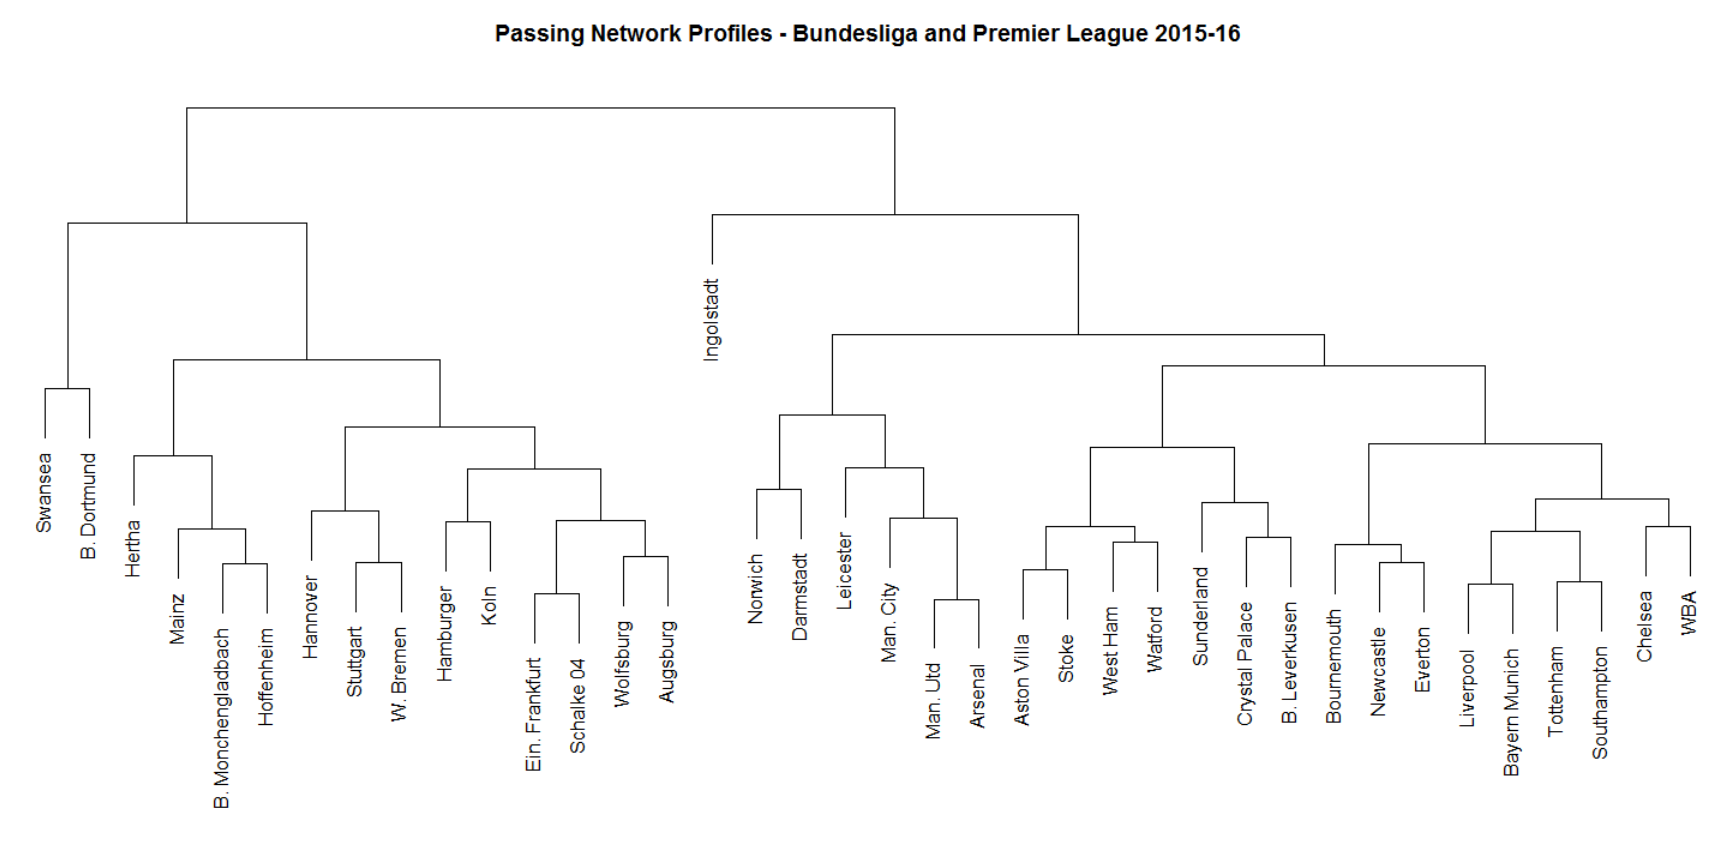 Dzeko’s fallibility in front of the goal is by now a fact of life, other than one of the main causes of Roma’s non-penalty underperformance. Anyway, the Bosnian is able to compensate with a shooting volume of 5.3 attempts per 90. Making a simple projection, if Dzeko maintained the same averages, the same efficiency and the same usage also in the second half of the season, he would reach 25 goals in total, a target which would make him immune to critics. Napoli, which is second per xG for and third per xG against per game – with a non-penalty goals difference of +19 and an expected goals difference of +18.36 – has pretty much offered performances in line with those expected. Despite Milik’s injury and Gabbiadini’s evanescence, that regardless of a similar usage has generated more xG per 90 than the Polish (0.48 vs. 0.33), Sarri has already found 11 different goal-scorers and above all a Mertens capable of scoring 10 non-penalty goals and 8.80 xG (4th overall in the league).
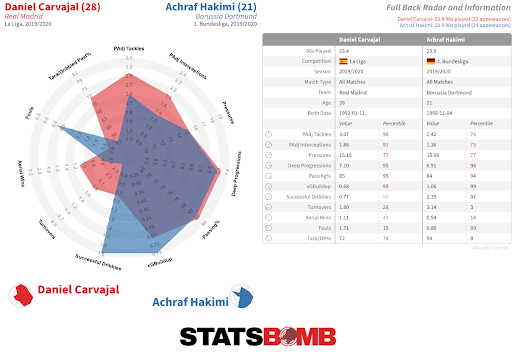
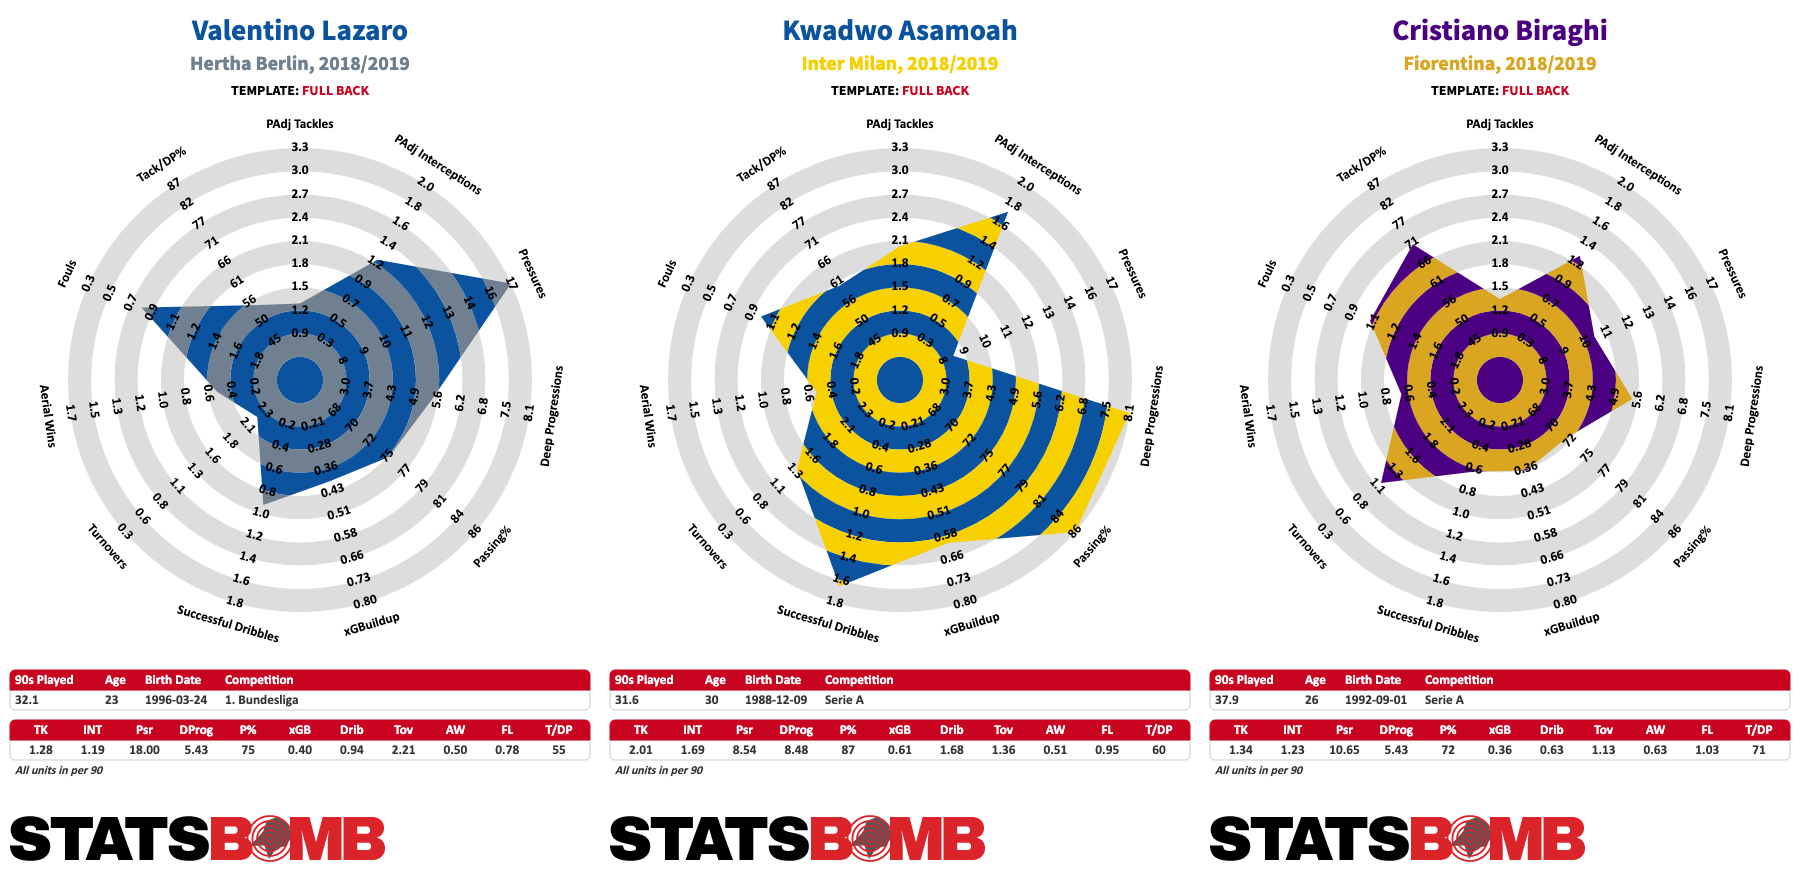
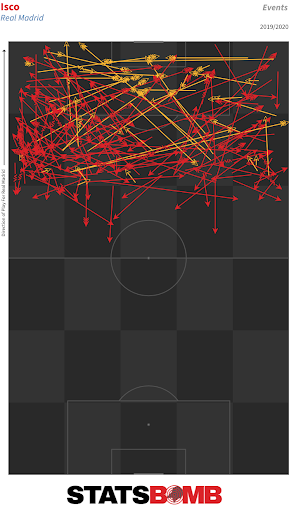
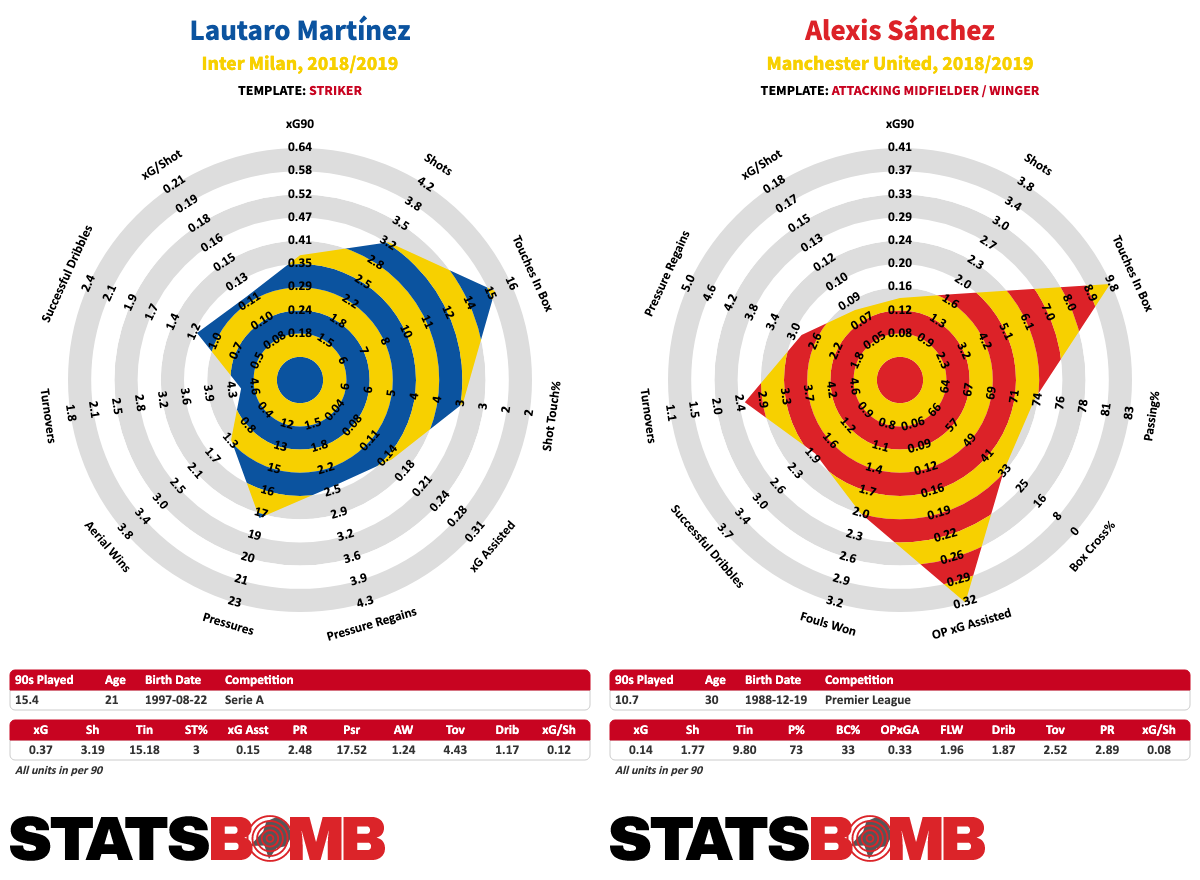 Looking at the rest of the league, there are a handful of other things that need to be mentioned. First and foremost the situation of Genoa, 12th in the table is quite strange, since as per xG, they could be even five places above. We can do a similar, yet inverse, reasoning for Torino, the team with the highest level of overperformance of the entire league: they sit at 8th, at least five places above their expected performance. Apparently, there aren’t many chances for Fiorentina to get back in contention for Europe, all the more so if they will lose Nikola Kalinic (7 NpG, 6.71 xG) to China. If this would have been a “normal” season and if variance would not have played a role – since they are both going above expectations – Bologna and Udinese would be fighting to avoid relegation. Giampaolo Samp’s does not seem ready to take off, while Chievo’s performances will assure them a 9th consecutive championship in the top tier of Italian football. Finally yet importantly, the most unlucky team of the league needs to be mentioned: after a never-ending series of injuries and an exhausting Europa League campaign, Sassuolo moved from a European qualification to the depths of the table. Di Francesco is struggling to choose his starting XI week-in week-out and even if they scored with 13 different players, they are performing under expectations of a considerable amount.
Shopping With Stats In the Transfer Market

Let's find some players.
On Twitter recently I've been trying to clean up my pass maps. I've been clustering every pass into one of 100 "types."
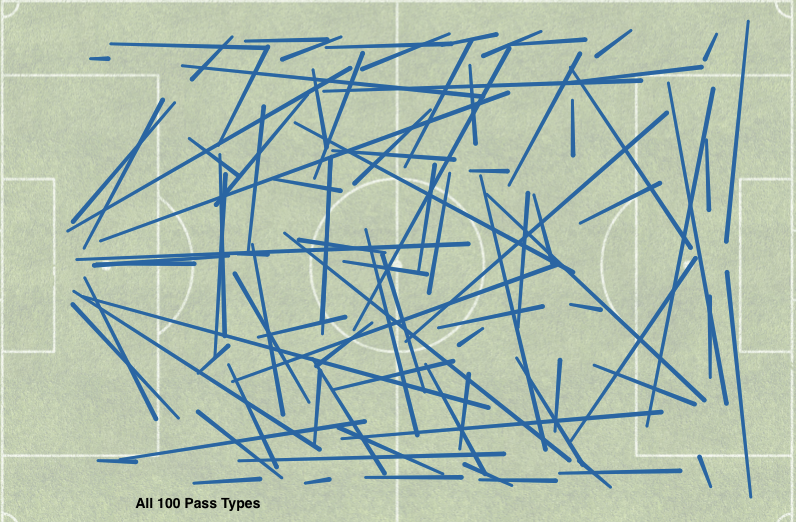
This is only based on starting and ending position, there are of course many other variables that could be added: when a pass comes in a possession sequence, body part, where previous pass was played, position (MC, FW, etc) of player as a proxy for options in front and behind, if a team is flooding their own zone to keep possession in useless areas which skews completion %, etc. All of these would contribute to a robust passing model but are not accounted for here. Nevertheless, we press ahead.
I started looking at how often teams played certain types of passes. For example, here are Liverpool's and Swansea's attacking maps.
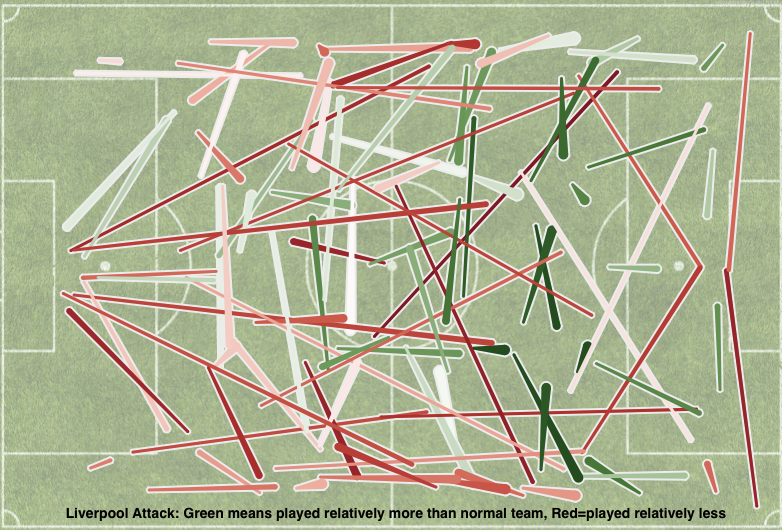
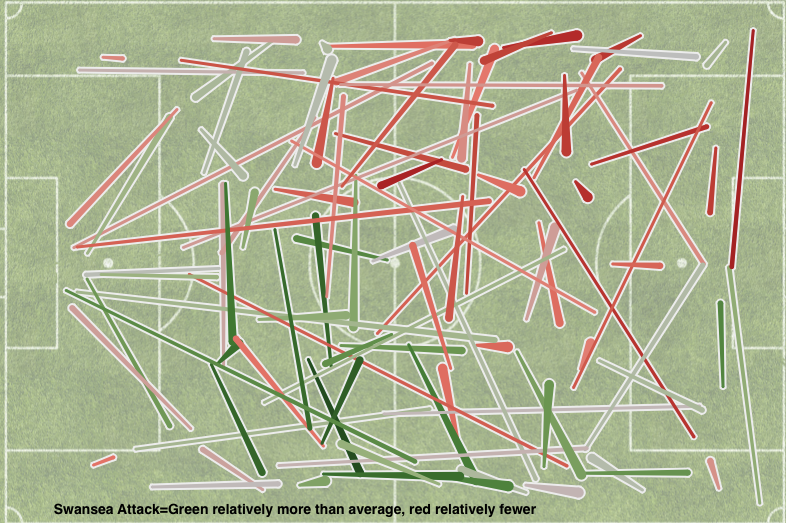
Liverpool tilt the pitch forwards and wind up playing short passes in the attacking third just outside the box a huge amount. Swansea never pass the ball to the left (sorry Wayne Routledge, it's nothing personal) and play around the midfield stripe a good bit.
I then wanted to see which teams were "overperforming" their pass types. If we know how often teams in general complete a certain type of pass, it's simple to add up expected completions and see which teams are beating that. At the top are mostly teams who you expect: Barcelona, Manchester United, Chelsea, Napoli, etc (City slide down the ranks a bit here when you account for pass type). The next step is to look at players. I'll use this basic framework to try and find interesting transfer candidates who stand out from their team and/or couple other solid output with ball progression.
We want players we don't have to break the bank for and prefer those who are under-the-radar, so while Willian, Nasri, Coutinho, and Banega stand out they will not be purchasable for most teams. A few other filters: outside the PL (to save money), sub 30 years old, and under 8m on transfermarkt. I will be role-playing as the stat-crazy agent trying to sell a team on my guy and then as a skeptical transfer guy raising some questions. Well, here we go.
CenteBacks-H Below Izzo
- Armando Izzo (Genoa), 24
Agents Pitch
You want a Boateng or a Hummels right? Playmaking and skill in possession from centerback allows you to shift the entire offense forward and not have to hit low EV long balls from the goalie or use a defensive midfielder as a third center back. Armando Izzo is your man to move possession forward.
Izzo has played as a very forward minded right CB in a 3-man defense. He leaps off the page at Genoa gaining his team an extra 50 completions from what you'd expect from looking at his pass types. Only 20 players across the top 4 leagues have added more than 50 completions and most are huge stars from excellent passing teams: Thiago, Cazorla, Ozil, Hamsik, Filipe Luis, etc. Genoa are basically completely average outside of their standout Izzo.
He doesn't really play like what you generally think a center back does. When you look at where he passes the ball and try to find players who do so similarly, you get hybrids like Nenad Tomovic, Joshua Kimmich, Antonio Rudiger or Mauricio Isla who play right back alongside center back or midfield. To drive the point home, Izzo was the leading passer in the final third in the Genoa-Roma game. He even scored the only goal! (Just don't check on which side that goal went in, please.)
Don't take only the stats word for it. More tactically minded analysts/coaches who have closely followed Genoa's training camps have loved Izzo's play as well (and if you don't care about age the 30-year old Gentiletti would be a fantastic addition).
Now, you are surely wondering if he's one of those fancy all-glamour-no-grit-sweet-passer-but-defensive liability types? I'm here to assuage those. Genoa are one of the tougher teams in Serie A to complete deep passes against (almost a standard deviation below average in the 30 yard radius around goal and the toughest to complete against in the 15-yard radius around goal). Drilling down further, only Crotone allow a higher share of key passes to come from their defensive left side than Genoa (not Izzo's side). So teams struggle to complete deep passes against Genoa, and when they are creating chances they come from Izzo's side at one of the lowest rates in the league.
Who to pitch to for maximum earnings: Dortmund, Everton, Southampton, Bournemouth
Front Office Questions:
Can this guy actually defend? That key pass side stuff doesn't really convince me. These stat guys generally have no clue when they talk about center backs and defense, let's get one of our other non-stat guys who might have a whiff (but just a whiff) of a clue on center back defense to check on that, at least he will sound more convincing.
This agent is convincing on the passing stuff and Izzo does seem as if he can start attacks from CB in a 2 or 3 man back-line and maybe even right back. Let's get working on the scouting side quick because there's a chance this guy might be a true difference-maker.
Also, let's try and get to talk to Izzo man-to-man and get him to cut this slimy agent out, he keeps WhatsApping me to Venmo him $100,000 to ensure the signature. Sad!
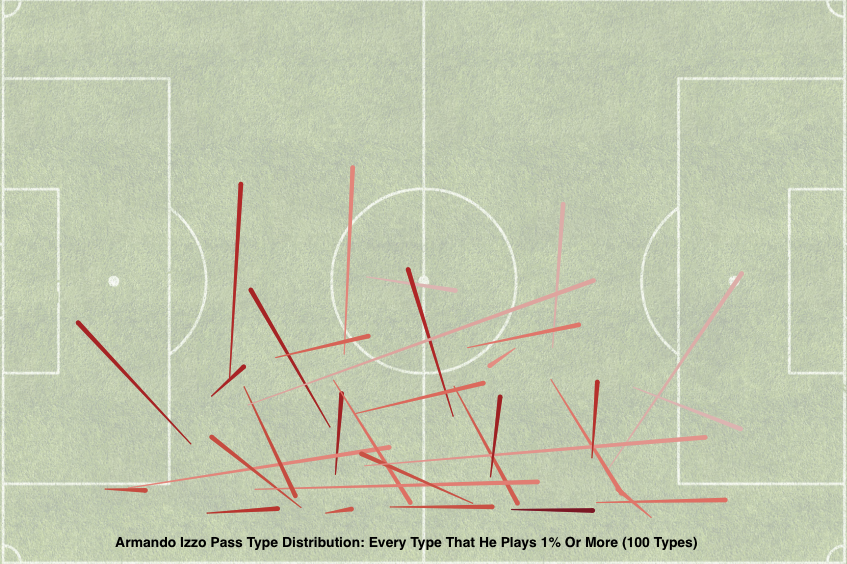 Other, Lesser Recommendations
2. Benjamin Hübner (Hoffenheim), 27
Fullbacks
- Jonny Castro (Celta Vigo), 22
Agents Pitch
Want a fullback like Wendell from Leverkusen who is a great passer and wins balls all the time on defense but don’t have the money to get Wendell? Jonny Castro from Celta Vigo might even be a better passer and a more active defender. On a team that is below average in terms of expected completions, Castro stands out bigly. No player on a team with a negative total has a higher over-performance than Castro's +36 completions. He's not exactly a Danny Rose type output guy, more of a helper in the buildup if you have players who can create shots up top. This can be seen in a differential pass map that shows the areas of greatest difference between two players.

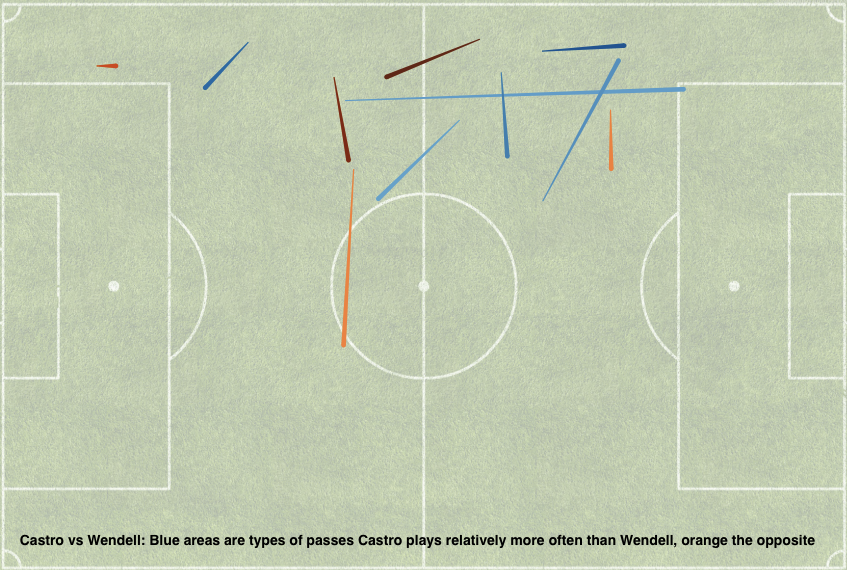
To go along with his passing goodness, he has defensive legs. Castro makes an interception or wins a tackle 6.7 times a game and gets dribbled past just 0.6 times. No fullback in the PL can match Castro's 6.7 number.
Where to aim pitch to maximize earnings: Manchester City, West Ham
Other, Lesser Recommendations
2. Yuri (Sociedad), 26
3. Giulio Donati (Mainz), 26
Attackers
- Bruno Fernandes (Sampdoria), 22
Agents Pitch:
If I asked you do you want a Christian Eriksen clone, you'd immediately say yes right? If you look at where Bruno Fernandes passes the ball, Eriksen is the single closest comparison you can find. If you then go stat-by-stat, Fernandes looks very similar to Eriksen, except he doesn't appear to need a hair transplant anytime soon.
Let's look at some of their stats side-by-side.

Sampdoria take 4 fewer shots than Tottenham, so Fernandes has even more impressive shot contribution numbers. He doesn't come with Eriksen's set piece reputation, but you can find someone else to get you a goal a season there.
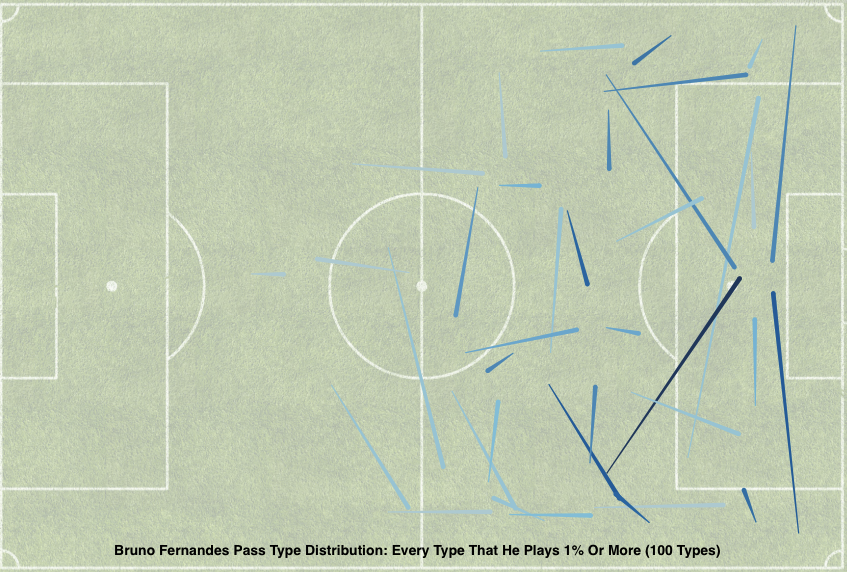
Front Office Questions:
Is this guy too cross happy? 10 crosses per 90 is pretty ridiculous, though in the past he has much more reasonable numbers. Who to pitch to for maximum earnings: Stoke, Bournemouth, Everton
Other, Lesser Recommendations
- Gianluca Caprari (Pescara), 23
- Jeremie Boga (Granada), 20
Midfielders
- Petros (Real Betis), 27
- Ivaylo Chochev (Palermo), 23
- Remo Freuler (Atalanta), 24
- Roque Mesa (Las Palmas), 27
Agents Pitch for Petros to Crystal Palace
Petros is absolutely an ideal deep-lying midfielder for your team. He completes passes at a rate way ahead of his Betis teammates. On a team that is overall well-below average (-160 completions below expected), he is +30 completions. These are generally safe passes played out wide, but he's great at doing it and that's exactly what you guys need.
You often struggle with getting the ball to your wingers to start attacks, MacArthur and Ledley are both below-average passers and are playing big minutes for you in Petros's position, grab him for an upgrade that you really need in a season where every point is crucial. If you are worried it will weaken your defense, don't be. Petros has 7.5 won tackles or interceptions per game while Ledley + MacArthur combine for 6.8 between them. He does the defensive work of both while outpassing them by leaps and bounds.
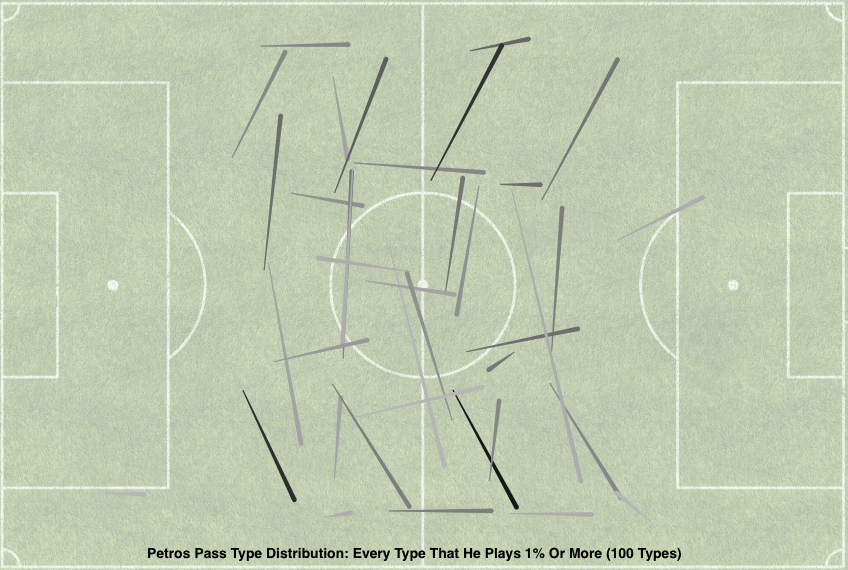
Agents Pitch for Chochev
Chochev brings a really unique skill set to the table, not many players can combine the things he does really well together.
-He's efficient: No Palermo player completes forward passes into the deep attacking zone (defined as a ~30 yard radius from goal) at a higher completion % than Chochev.
-He's dangerous: No Palermo player has a higher rate of key pass per pass than Chochev in this deep attacking area.
-He gets shots: Chochev takes a shot in the box per game trailing only Nesterovski and Robin Quaison (who both have played forward). No one else on Palermo takes over half a shot in the box per game.
-He works extremely hard defensively: Only a pair of center backs two top his huge tackle and INT rate (5.9 won tackles+INTs) on Palermo.
This is serious two-way potential that gives you the chance to play him all over the pitch.
Where to pitch for maximum earnings: Leverkusen, Leicester, Wolfsburg, Werder Bremen
Front Office Questions
Why does he get involved so rarely with the ball? A very low 33 passes per 90 rate raises questions to me.
The latter two (Roque Mesa and Freuler) are certainly more upmarket types. Roque Mesa is a Xabi Alonso-esque type player. Maybe I will try to get Manchester City interested. Freuler is more of the rangy Kroos/Koke type who is going to give you solid production in the box. I might ring Dortmund first on that one.
Well, there you go. My list of guys who I think could provide good bang for your buck in the transfer market and immediately help teams with money to spend. As a blogger my job is done but as an agent I am shooting for the stars with some of these pitches, so wish me luck and that I can wet my beak with several shady kickbacks so I can then roll that over into investments into 16-year old South American midfielders in an illegal scheme with a Portuguese team! Until next time, the Secret Agent/Statsbomb Blogger.
StatsBomb Transfer Pod, January Window #2
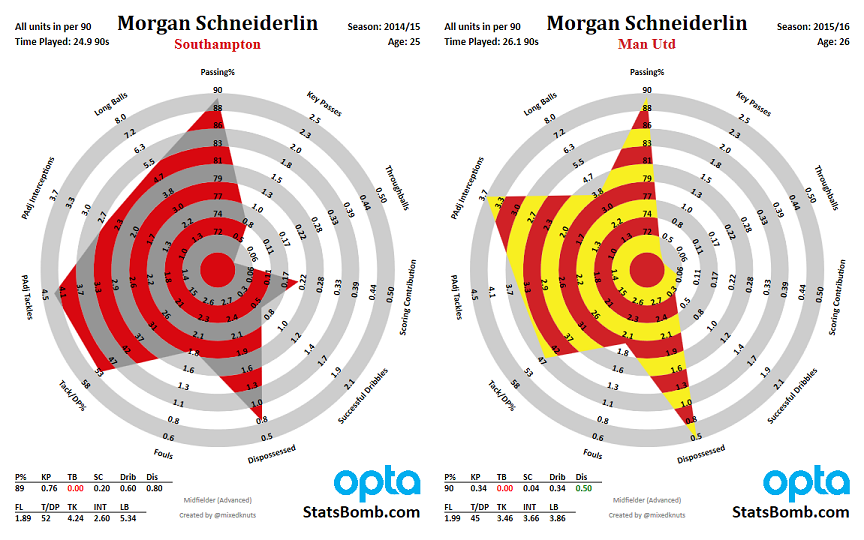 [soundcloud url="https://api.soundcloud.com/tracks/302039020" params="auto_play=false&hide_related=false&show_comments=true&show_user=true&show_reposts=false&visual=true" width="100%" height="450" iframe="true" /] Ted Knutson and James Yorke look at the transfer stories and moves around this January Downloadable on the soundcloud link and also available on iTunes, subscribe HERE If you like, we'd love it if you shared it. Thanks! This week, we have added radars from some of the players discussed:
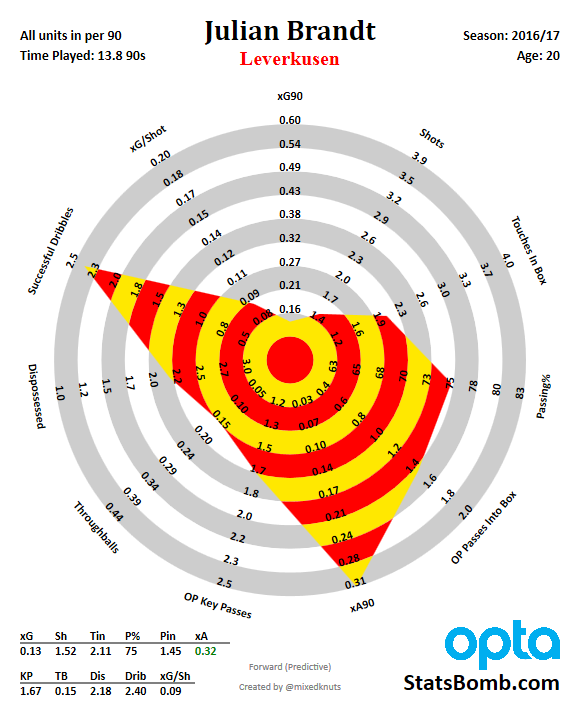
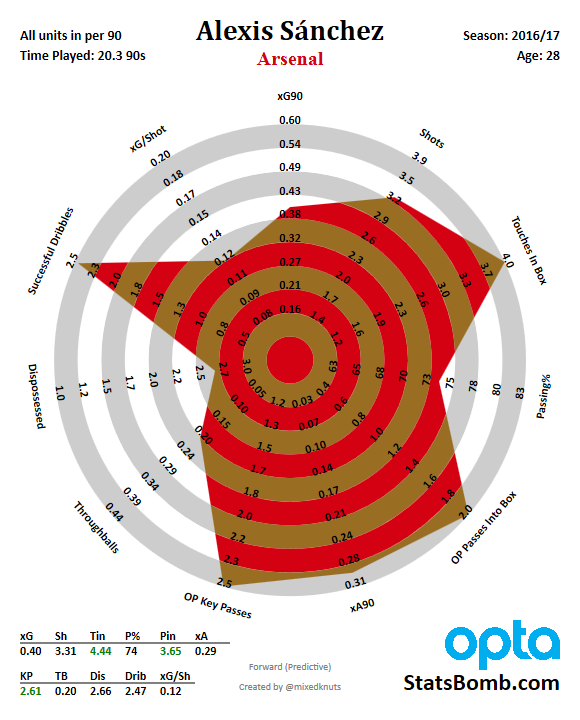
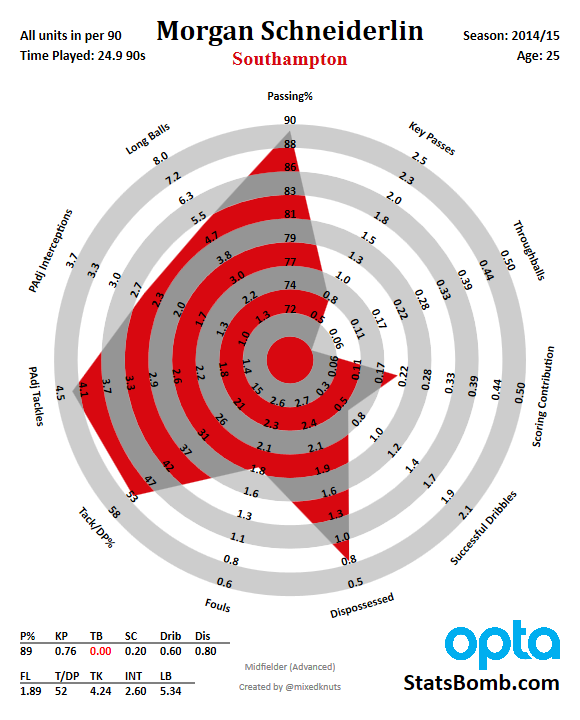
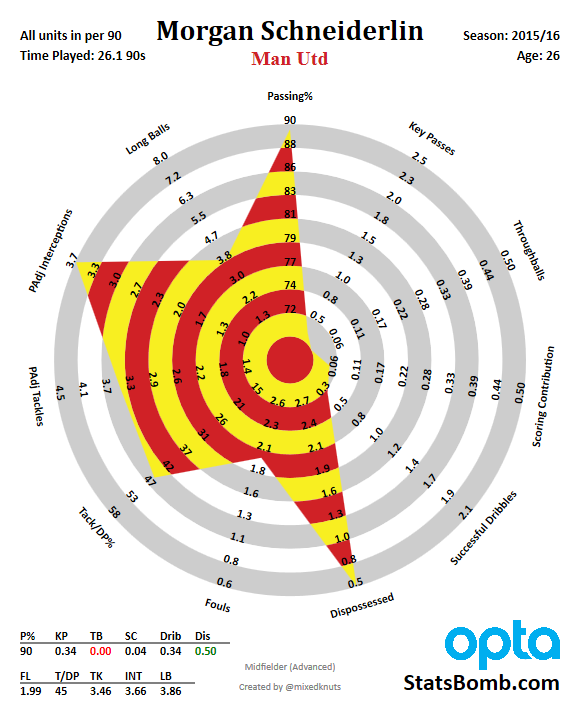
Are the mid-table Premier League sides weak this season?
 Plenty has now been written about the dominance of the top six in the Premier League this season but less about the absence of interlopers among the higher European places from the mid range. Usually we find at least one team skewing positively off their metrics and contending well into the season. Alan Pardew’s outlier 2011-12 season at Newcastle saw them land fifth and last season found Leicester win the title after being second at halfway while Crystal Palace--again driven by the inspirational Pardew--were sitting in fifth at the halfway mark before heading in entirely the other direction and West Ham meandered around the European slots before finally finishing seventh. Does this mean that this year’s selection of eager chasers are bad? Or is it a little more nuanced than that? There are a couple of ways we can approach this. Omar Chaudhuri provides a helpful service by tracking Sporting Index point predictions as the season progresses.
 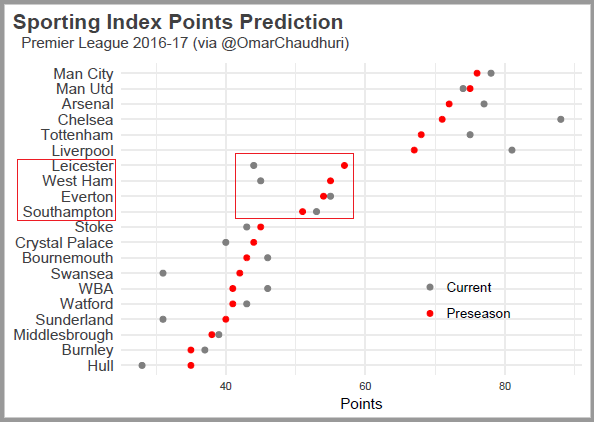 The most obvious takeaway here is the general stability of the league in relation to pre-season predictions, and given the various travails of Chelsea and Leicester quite understandably very different to last season. The initial points predictions can be loosely tiered into three sections: big six, mid-rangers (Everton, Leicester, West Ham and Southampton) and the rest. Broadly, the bookies thought there were ten fair to weak sides in the division to start with, and now they think that the outcome of the season will indicate twelve teams picking up below fifty points. Only Bournemouth and West Brom have increased expectation in the bottom half by a win or more (three and five points respectively) and from a low base, it hasn’t done much more than imply that they should be able to secure safety providing the wheels don’t fly off, or “to Pardew” as the kids call it. Four of the five biggest risers are in the top five positions in the table, and three of the five biggest losers fill the bottom three positions. From August to now, the only real movement between these loose groups has seen Leicester and West Ham appear to fall into the extensive bottom group. Performance metrics Results have driven these moves, but where do these teams fit in with regard actual performance metrics. What about our old friend expected goals?
 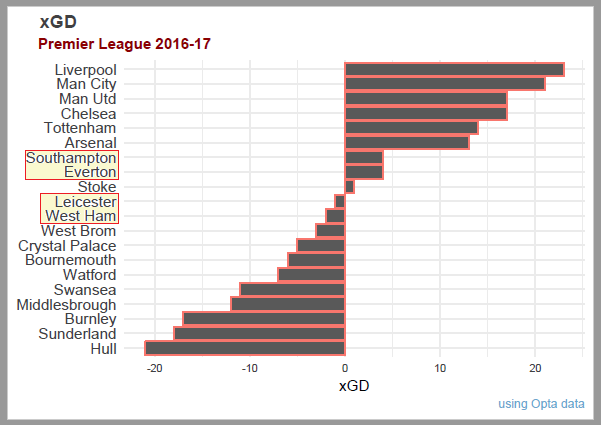 If we look from seventh downwards for expected goal difference we find our four “mid-rangers” occupying slots seven, eight, ten and eleven with slight interlopers Stoke splitting them and West Brom a shade behind. It was easy to look at Leicester and West Ham’s metrics last season and expect a drop off, but they haven’t fallen off entirely the map with regard their underlying strength. So why have they fallen off the map with regards results and league position?
 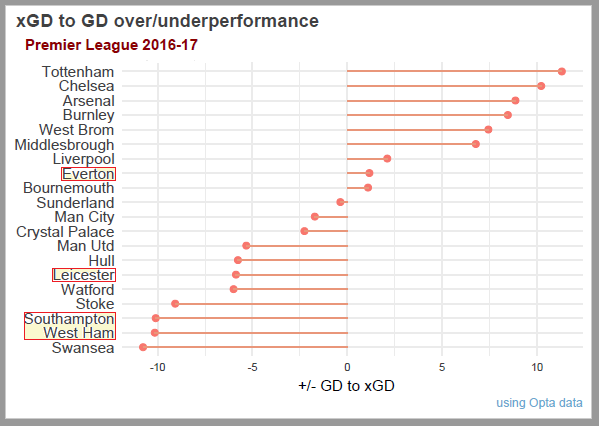 Of our four teams, only Everton are pitching in around expectation and the other three are well behind. As a group, the mid rangers are undershooting expectation by a large degree, have plenty of room for positive reversion and it’s realistic to assume each will start to climb the table as the season continues. So we return to our original question, are the mid table sides weak this season? If we calculate a typical expected goal value of all ranks we find that not to be the case, even allowing for fluctuations and a relatively limited six season sample:
 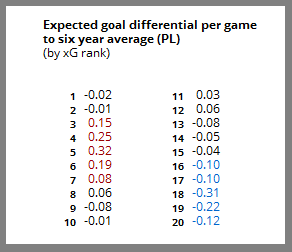 Positions three to six are understandably very strong this year, but seven and eight come out well too. The real weakness in the league is at the bottom with the five worst performers against the six year average ranking 16th to 20th. The strength of the top six has been largely powered by the weakness of the league’s worst teams and those in the mid range are in fact broadly on par with their usual standards. It’s just that it is usual to find one or more of them skewing upwards off their mid-range metrics and competing higher up, albeit temporarily. Instead, only Everton have held any kind of level commensurate to their real ability and Leicester, West Ham and Southampton have struggled. Leicester’s general shooting and conversion metrics are very flat overall, but they have only won two of thirteen games in which one goal separated them (2-6-5) compared to last year’s 14-12-2. West Ham have struggled with accuracy at both ends with historically low accuracy on their attacking end an historically high accuracy of their opponents. Southampton have saved only 58% of their shots faced while their opponents have saved 80%. All of these factors are at the extreme end of each metric and have meant each team has been looking over their shoulder rather than at Europa League qualification, but time will almost certainly move them upwards; simple variance is most likely to be the primary factor. The mid range might not be representing well this year, but they haven’t been killed off.
Pep's Struggles, Rashford vs Abraham, and Teasing xGChain

The Premier League has transformed from a very good football league into one of the world’s greatest soap operas, and perhaps my favorite storyline right now is the struggle of Pep Guardiola.
- Take the world’s greatest current manager.
- Add him to one of the world’s richest teams.
- Profit.
Before the season, most people thought it would be that simple. Halfway through the year, it is clear it has been anything but. The question is why? Pep didn’t struggle like this at Barcelona, nor at Bayern Munich. What makes Manchester City – just two seasons removed from the title when he took over – so much harder? For the answer to this question, I want to briefly cast back to some stuff written at the start of StatsBomb’s existence in 2013 by myself and Benjamin Pugsley. That summer City recruited Fernandinho, Jesus Navas, Stevan Jovetic, and Alvaro Negredo at the top end of the scale, aged 28, 27, 23, and 27 respectively. The problem we flagged up at the time was that these were clearly “win now” transfers that would have a stonking replacement cost down the road. You can’t sign guys in their late 20s and expect them to contribute at the same level as players in their prime at the end of 4- and 5-year contracts. It just doesn’t happen. Add in 32-year-old Martin DeMichelis for salt and City had signed fairly old. The next summer saw the arrival of Mangala, Fernando, Willy Caballero, and Bacary Sagna. Now Mangala was 23, but ended up being a disaster. This happens, especially with center backs. Fernando was 26 and has hardly contributed at a level commensurate with his fee. Caballero is a backup GK, and Arsenal fans will tell you that as much as they loved Sagna, he was already approaching washed up as a two-way fullback when City signed him at age 31. In his last season in North London, you could have Sagna attack. Or you could have him defend. Do not expect both. Two years, lots of fees, and no players in their prime that stuck. This is a problem for a club that wants to contend for titles every year. Last summer, City spent about £150M on Sterling, De Bruyne, and Otamendi to start digging out of the mess, and all three have proven to be good/great additions. Unfortunately, this equates to “normal” turnover spending for a super club. It didn’t improve the spine much, nor solve the growing geriatric issue. Fast forward to this summer, and the great master arrives along with John Stones, Leroy Sane, Nolito, Gundogan, and Claudio Bravo. Nolito and Bravo are 29 and 33, and neither one of them is a fullback. Gundogan is a world class talent and midfielding brain packed into a Mr. Glass body. Sane provides good depth and youth, but probably a year away from being good, and John Stones is a center back project that Pep desperately needs to succeed. The point of all this is that yes, Pep’s system might be the most fundamentally superior tactical system we have seen in modern football. And yes, Pep Guardiola is still a goddamned Footballing Jesus. But even Jesus was going to have a tough time resurrecting this squad and romping the league this season because of the issues created by years of ineffective squad planning before he ever got there. And all of that was before the entire league chose to collectively get their shit together on the manager front, giving the Premier League probably the greatest collection of coaching talent it has ever had at one time. City might have the best manager in England, but they could spend £200M in January and still need to stump up more in the summer in order to have the best squad in the league. It is great to see Guardiola struggle, and try to adjust his tactics to both the league and his squad at the same time. That very struggle has not only created a great story for this season, but it’s also enhanced the reputation of the Premier League by proving to be a tougher title to take than anything Pep has faced in recent times. Young Rash and Tam Tam I was asked this week on Twitter whether I would pick Marcus Rashford or Tammy Abraham as the bigger talent. This came out of a broader discussion on what “the analytics world” thought of Rashford this summer, after a fiery debut season. My point then bears repeating: there is no such thing as “the analytics world.” There is no monolith of opinion with regard to stats and football. There is a loosely-connected community of people who work with stats, but that’s about it. The site you are reading this on right now is not called TedBomb, and even here on StatsBomb you will see differing opinions and analysis of the exact same data by different writers. Lumping all analysts into a group sells the great work everyone does short in the same way lumping all journalists into one misguided, monolithic opinion group would. We are all unique snowflakes, dahling. 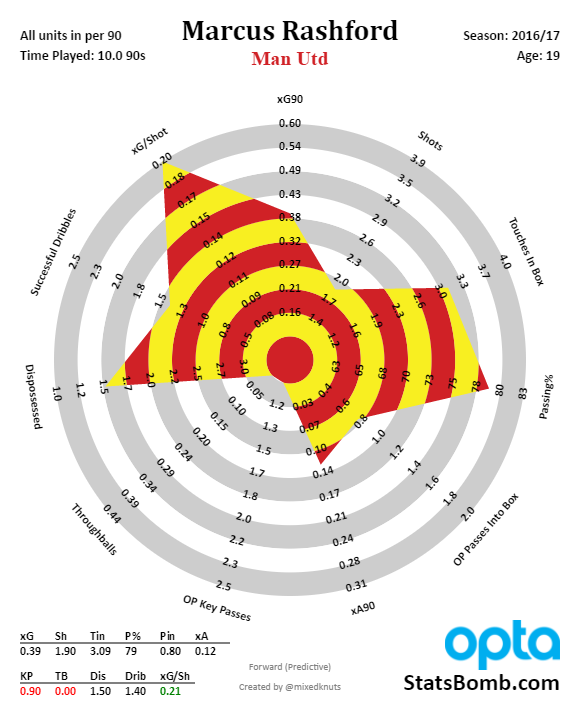
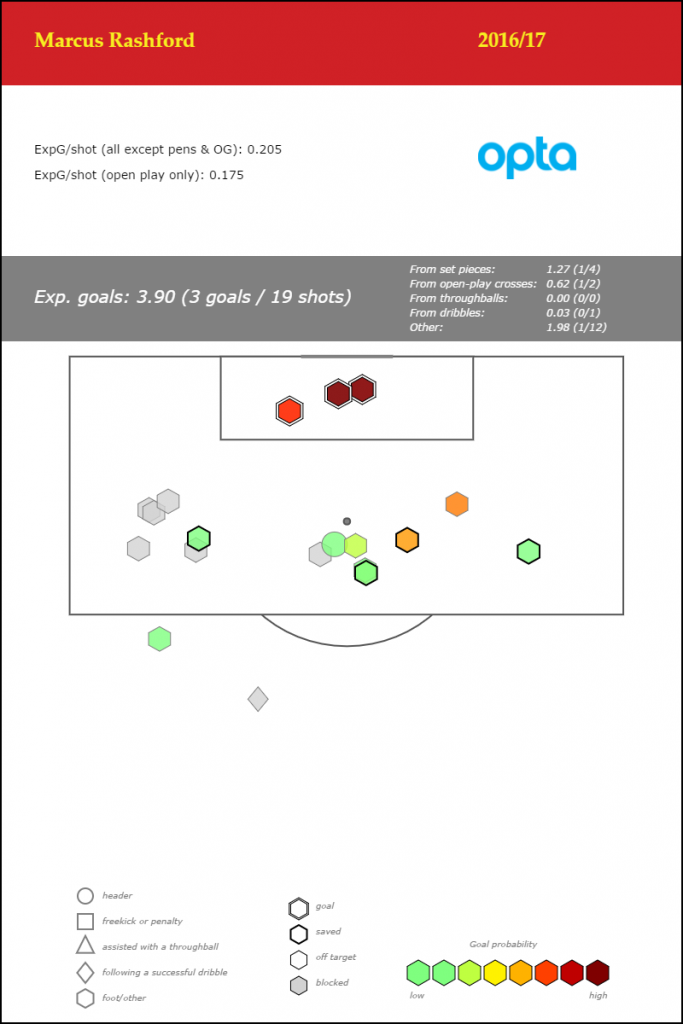 My opinion from this summer on what Rashford was and what he could be is largely unchanged. The fact that he is scoring goals regularly in the Premier League at his age is notable by itself. Add to that a serious commitment to run at defenders this year and a bit more creative passing, and he looks like one of the best prospects to come out of Manchester in ages. He’s clearly still learning, but also good enough to start for most teams in the league right now, either as a center forward or as a wide forward. Tammy Abraham may be a less common household name right now, but he has been lighting up the Championship at Bristol City this year in his first season of senior football. The Chelsea loanee is only 19.
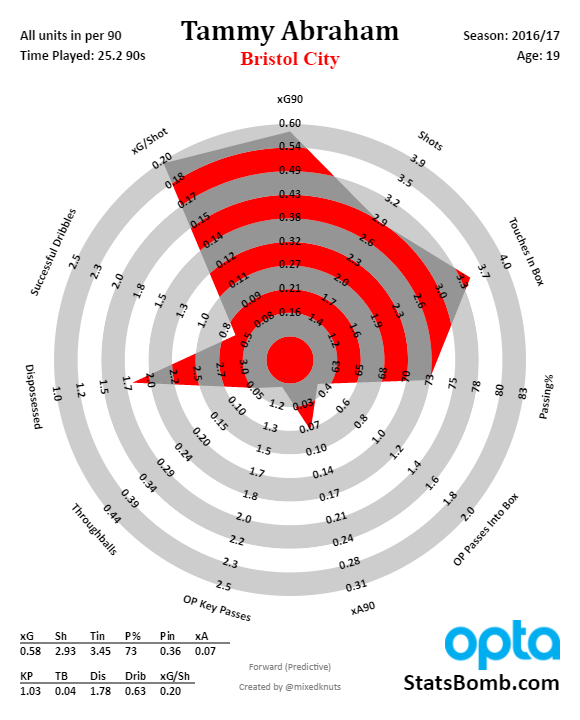
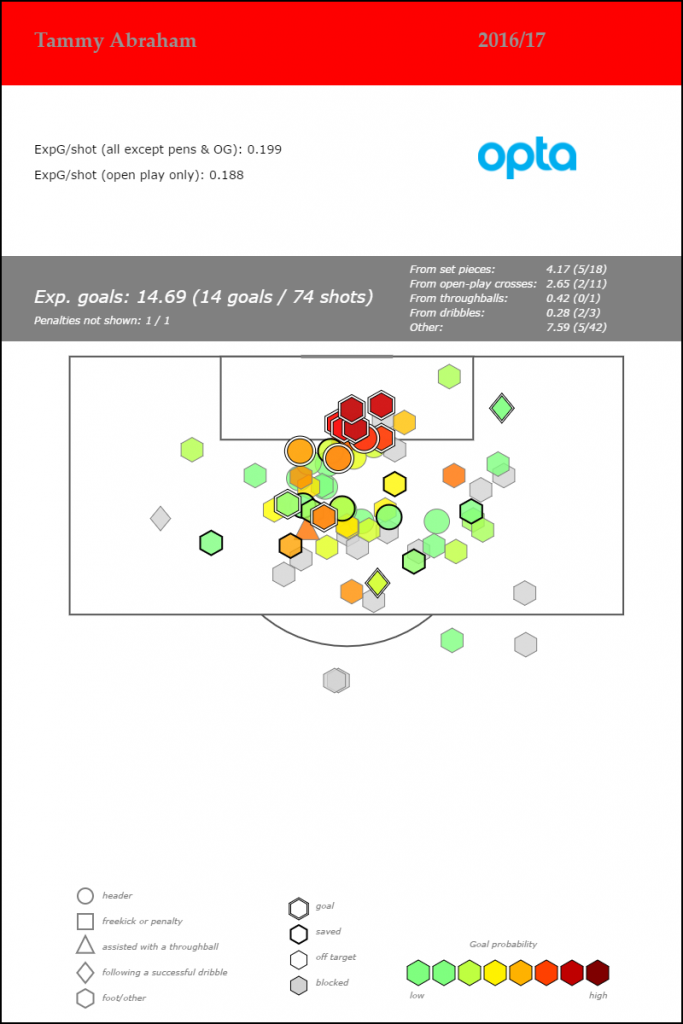 This is extremely unusual for a young forward, and looking backward one of the most similar profiles I can find at this age is another Chelsea loanee: Romelu Lukaku. Yes, Lukaku’s season came against Premier League competition and TamTam’s is in the Championship, but Lukaku certainly looked a bit more physically mature when he did it while Tammy still has some teenager left on those lanky bones. Back in February, my group at Brentford produced a list of young forwards that we thought would contribute to our club this season, and Abraham was at the very top of that list*. He is a breathtaking talent who is producing incredible numbers without being surrounded by particularly good teammates at Bristol City. So you know I'm legit on this, here's a tweet from the first day of the season in August.
  (* The previous season we flagged up Sergi Canos and John Swift as good loanees, both of whom were excellent contributors, so pretty happy with the process there.) Anyway, back to the actual question: say for the next five seasons would you rather have Rashford or Abraham? The statistician in me leans Rashford. Obviously he’s performing against better competition, and the success he is having as a wide forward at his age is more rare and unusual than Abraham’s profile. Yung Rash is the real deal already, and who knows how high his ceiling is? The scout in me leans Abraham. He’s killing it week in and week out, in a very physical league, without the help of United’s amazing squad around him. His passing as a CF is probably better than average, and he has pace, strength, and surprising technical ability for a player his size. He’ll be in the Premier League next season and will likely not look at all out of place. Both of these guys are part of the English National Team setup, and England is absolutely spoiled for choice at the attacking positions for what looks like a decade to come. Oh, and before we change topics, Kelechi Iheanacho at City still looks really special.
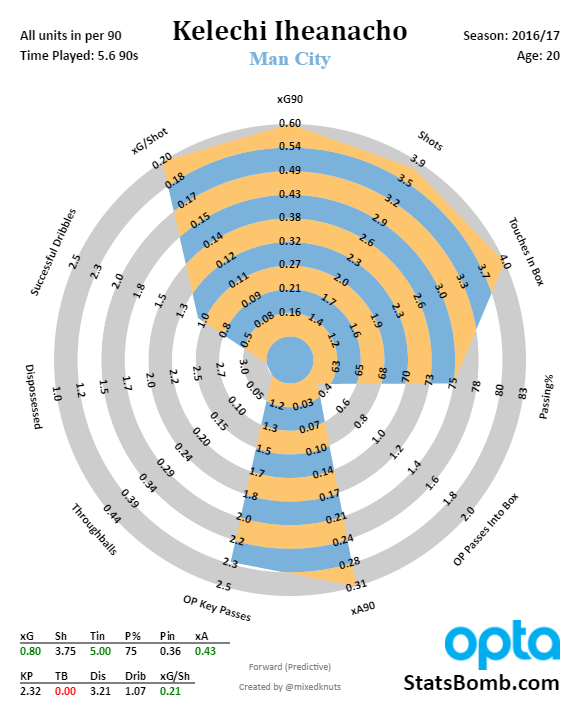
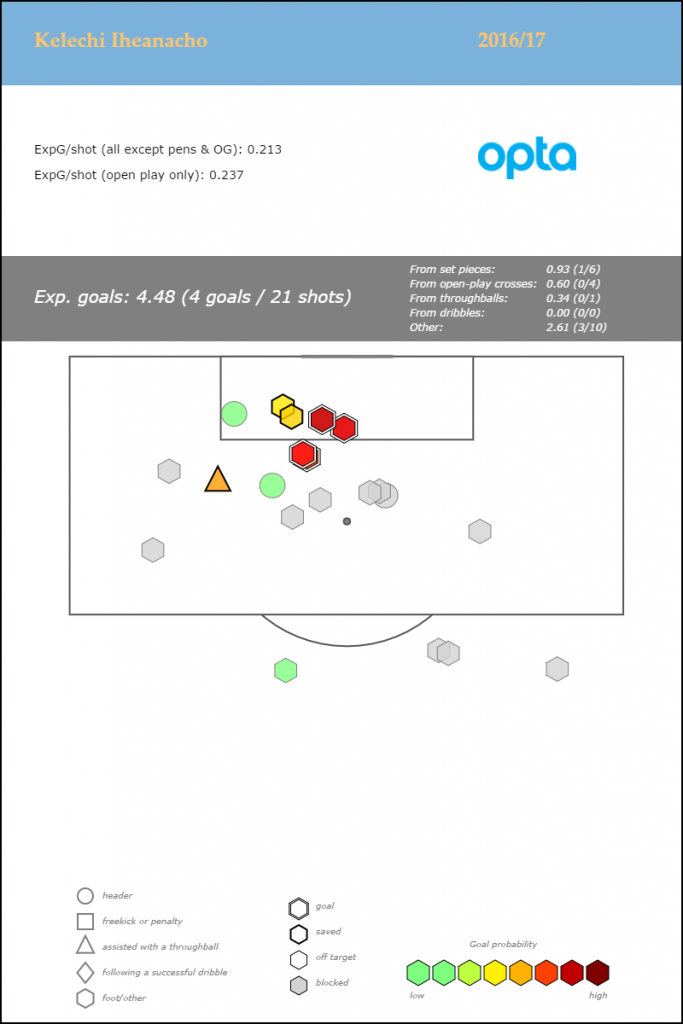 The Premier League Cliff Some years the relegation battle is all we have left for excitement by the end of the season. Others, it’s the race for the final Champions League spot. Once a generation you might get "AGUEROOOOOOOOOOOOOOOOOOOOOOOOOO!" This year, the entire table seems to be in motion every single week, but I find the bottom of the table particularly intriguing. Two early, improbable wins disguised it for a while, but Hull have been the worst team in the league since the start. They have a squad stuck between Championship and Premier League calibre and though they were probably improving a bit in recent months, they still hadn’t beaten anyone since *scrolls through fixture list* *still scrolling* Uh… Jesus, November 6th against Southampton. Even that was *ahem* a bit fortunate.
 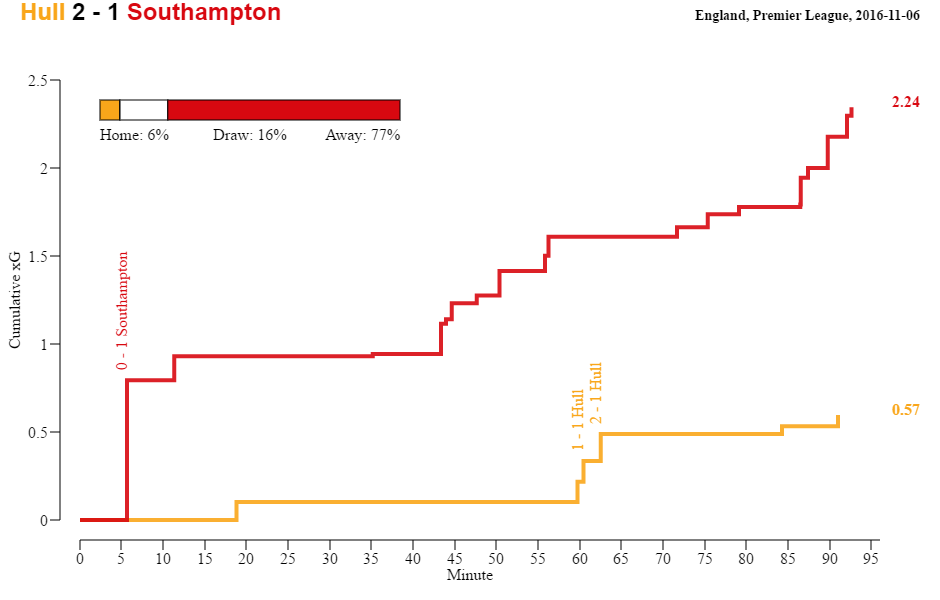 So yeah, change was needed and Hull went way off the beaten path to hire former Sporting Lisbon and Olympiakos boss Marco Silva. I like this appointment for lots of reasons, not least that it should give them an actual chance to survive pending additional recruitment this month, and it doesn't recycle old names. They are 4 points off safety with 18 games left. It’s an ask, but I am saying there's a chance. Moving up the table, we have The Swansea Debacle. A club that can’t stop shooting themselves in the foot has named Paul Clement as a perfectly reasonable head coaching appointment that also gives them a shot at survival. Like Hull, their squad is also a mixed bag of talent, with two solid forwards, some decent pieces dotted around the pitch, and yet huge need for upgrades in about five positions. Like we discussed above with Manchester City, if you recruit poorly for a couple of seasons in a row, you will eventually pay a price. Swansea’s Premier League dreams will live or die on Clement’s ability to solidify the defense while still allowing them to create enough goals to get 3 points on a regular basis. One simple barometer of doom that I discovered a couple of seasons ago is the 16 Shots Rule. If your club is giving up 16 shots or more a game, you have a strong probability of being relegated. Burnley are defying this metric this season because Sean Dyche has somehow crafted a Jekyll and Hyde tactical team who are surprisingly good at home – 5th best in the league right now with 22 points - while being the worst team in the league on the road. Their home return means they are almost certainly safe this year, and if Dyche can figure out how to bring similar output to Burnley’s road performances, they may become mainstays in the PL, at which point the media will suddenly appreciate him more and begin referring to him as Dutch tactical mastermind Jan Dijks. (Shout out to @noverheul for the nickname.) The doom clock doth toll, and it tolls for Sunderland. David Moyes's team are giving up nearly 19 shots a game, and circling the Premier League toilet bowl, waiting to be flushed. We know Moyes’s Everton teams were difficult to beat, but Sunderland are tied for most losses in the league with 13. Something is clearly lacking at the Stadium of Light beyond funds for additional transfers. That said, given Moyes's history, it’s tough to completely rule them out either. Directly above Sunderland, one point away from being flushable, are Crystal Palace. The complicated reign of Alan Pardew is now over, and The Great Allardici has been tasked with his usual magic act of keeping a struggling club up. Their underlying metrics were actually pretty good even before Pardew was sacked, but the table position is precarious enough that a bad run will cause normally sweaty Big Sam to look like he’s managing in a sauna. Who doesn’t want to see that? Finally we get to the clubs that appear in relative safety. Aitor Karanka’s Middlesboro are dreadfully boring to watch, but are also 4 points plus strong goal difference away from the drop. They could get sucked down to the bottom, but it would take a strong final 18 matches from two clubs below them to cause any real trouble. Every other club from Leicester on up should surely fight on for another season and another massive injection of TV money. Maybe it’s just me, but I’m kind of looking forward to the relegation run-in of nearly competent teams desperately hanging on for another year. It's SCRABBLING FOR SAFETY SUNDAY, AND IT'S LIVE... Random xGChain Trivia I teased a new metric that Thom Lawrence has developed for StatsBomb Services on the podcast this week. I’m not going to steal Thom’s thunder – he will write about it in detail next week, and then I will follow-up with more analysis after, but I am going to provide random historic trivia with absolutely zero explanation right now. I will say that we’re currently breaking it into xGChain/90 and what I refer to as xGChain Residual, but Thom may end up calling Pre-xGCh**. Either way, please enjoy.
- Arsenal’s highest xGChain player in 14-15 was Santi Cazorla. He was also Arsenal’s highest player in 15-16. Pretty interesting, given their struggles without him.
- I knew Atletico Madrid’s Angel Correa was good, but he has the top xGCh value for them so far this season, above Gameiro and well ahead of Antoine Griezmann.
- Neymar actually had the highest xGChain/90 at Barcelona last season, and not Lionel Messi.
- Xavi 10-11 has the highest residual xGChain score in the data followed closely by Jerome Boateng at Bayern last in 15-16. Yes, a center back.
- The highest non-Bayern, non-Barcelona players in residual xGChain values are Ozil at Real Madrid in 12-13, Cazorla at Arsenal last season, and Gundogan at Dortmund also in 15-16.
Oh, and back when I first started toying with Manager Fingerprints in 2013, I described Mark Hughes as a bang average Premier League manager. Stoke are currently 11th in the table, having finished 9th, 9th, and well... 9th in the previous three seasons. Some times "average" really is a bit of a compliment. Have a good weekend! --Ted Knutson @mixedknuts mixedknuts@gmail.com ** If you want to complain about names, feel free to develop your own metrics instead 😀
StatsBomb Transfer Pod, January Window #1

[soundcloud url="https://api.soundcloud.com/tracks/300885013" params="auto_play=false&hide_related=false&show_comments=true&show_user=true&show_reposts=false&visual=true" width="100%" height="450" iframe="true" /] Ted Knutson and James Yorke look at the transfer stories and moves around this January Downloadable on the soundcloud link and also available on iTunes, subscribe HERE If you like, we'd love it if you shared it. Thanks!