
It's another Podcast! [soundcloud url="https://api.soundcloud.com/tracks/216127702" params="color=ff5500&auto_play=false&hide_related=false&show_comments=true&show_user=true&show_reposts=false" width="100%" height="166" iframe="true" /] Enlivening your commute once more, and attempting to fill the horrific summer gap. It's transfer season and the EPL is awash with TV cash. Is it being well spent? Are teams addressing their needs? Questions that need answers, right? And we attempt to shoehorn a few stats in along the way... If you are an iTunes user (or want to subscribe to the pod via a different player) this link should help: Stats Bomb podcast (thanks again to @cricsheet for the help here) And here's a direct link to the Soundcloud if needed: Stats Bomb Podcast James Yorke (@jair1970) and Benjamin Pugsley (@BenjaminPugsley) thrash it out.
Month: July 2015
Controlling the Midfield (and why James Milner might not be the answer for Liverpool)
Each sport has it’s truisms about where the core of winning teams come from. In baseball it’s “up the middle”, the notion that if you get your defensive players in the middle of the field right, it’s easier to fill the rest. In football, games are won and lost “in the trenches” where the unappreciated lineman clear holes for skill players to score touchdowns. In soccer, it’s the midfield or in one of the more delightful sporting cliches: the engine room. Great forwards will not score goals without a solid midfield to move the ball up and give them plenty of touches. A top class back four can’t hold out for 90 minutes repeatedly if they have to constantly defend against passes coming toward their goal. These are widely accepted truisms but it is pretty hard to look at stats to determine which engine rooms are running at top speed and which are bogged down. Hopefully this is a step toward determining that.
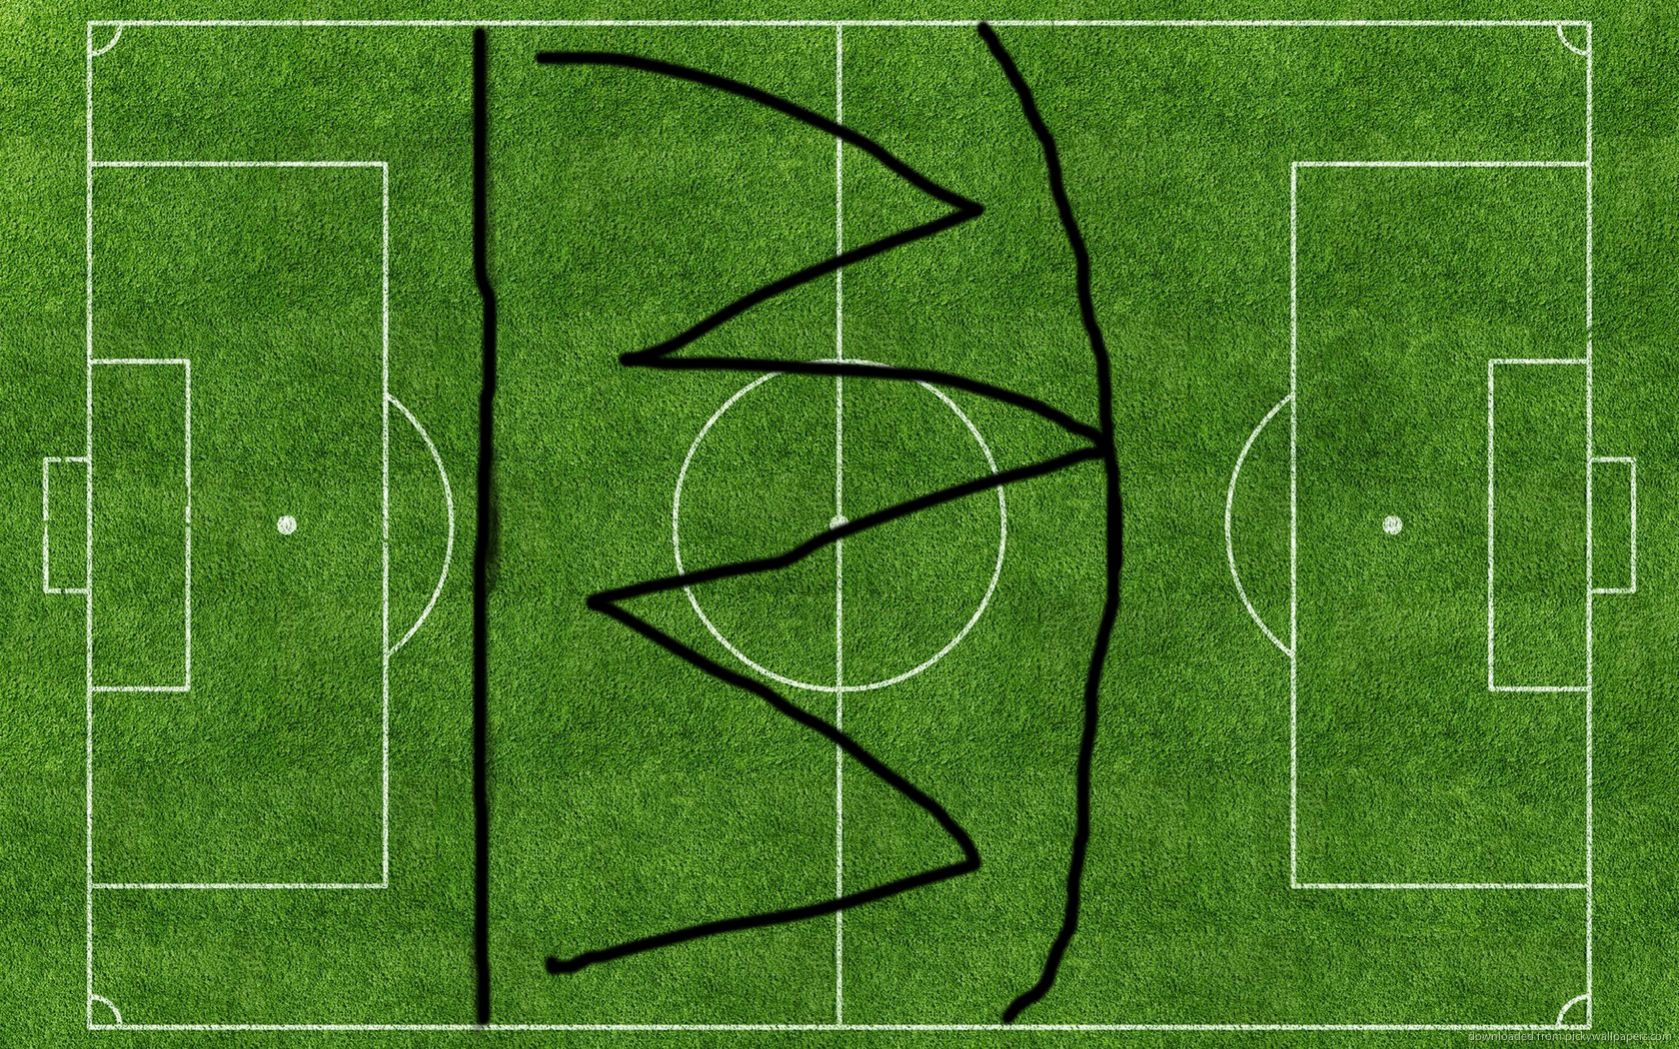
First, we need to define where the midfield is. This is how I defined it, between 38 and 79 yards away from the goal in my advanced soccer graphics representation program. This was just my decision based on what looked right and there are probably other ways of defining it that might be more correct.
Next we want to determine what stats to use to determine whether a team is dominating the midfield. Number of completions for and against shows possession but we need more, completion percentage is nice but rewards simple, short passes back and forth just inside the area equally with incisive balls through the middle. In the end, I came up with 4 factors to measure a team’s midfield control.
The first three are simple. One: completions per game. Two: the share of passes that are going backwards, mainly for context. Three: how far the average pass travels.
The fourth is a little more complicated. It is basically adjusted completion % on forward passes. To measure which teams were actually best as moving the ball through the midfield, I created a rough model for how an average team passes. It takes into account how far from goal the origin of the pass is and how much closer to goal the ball goes. I did this separately for La Liga, the Bundesliga, and the EPL. For example, in the EPL a pass that originates 63 yards from goal and is targeted at a player 4 yards closer to goal (59 yards from goal)*, is expected to be completed 86% of the time. If a passer is 40 yards from goal and tries to play a ball 26 yards closer to goal (in the box 14 yards from goal) it is expected to be completed 20% of the time. Obviously there are big changes depending on pressure and number of options available: a striker playing a ball forward will have a lower % than a midfielder or a defender simply due to how the team is laid out. This is ok, especially at the team level, as we are simply using this to measure which teams are actually passing well and which teams might be inflating their completion percentage through short passes far from goal. We add up each passes expected completion percentage then compare how many passes were actually completed to see if a team is above or below what you would expect.
*from goal is measured directly from goal. So a pass completed to the corner would be measured as 30+ yards from goal, not 0 even though it might be completed on the end line.
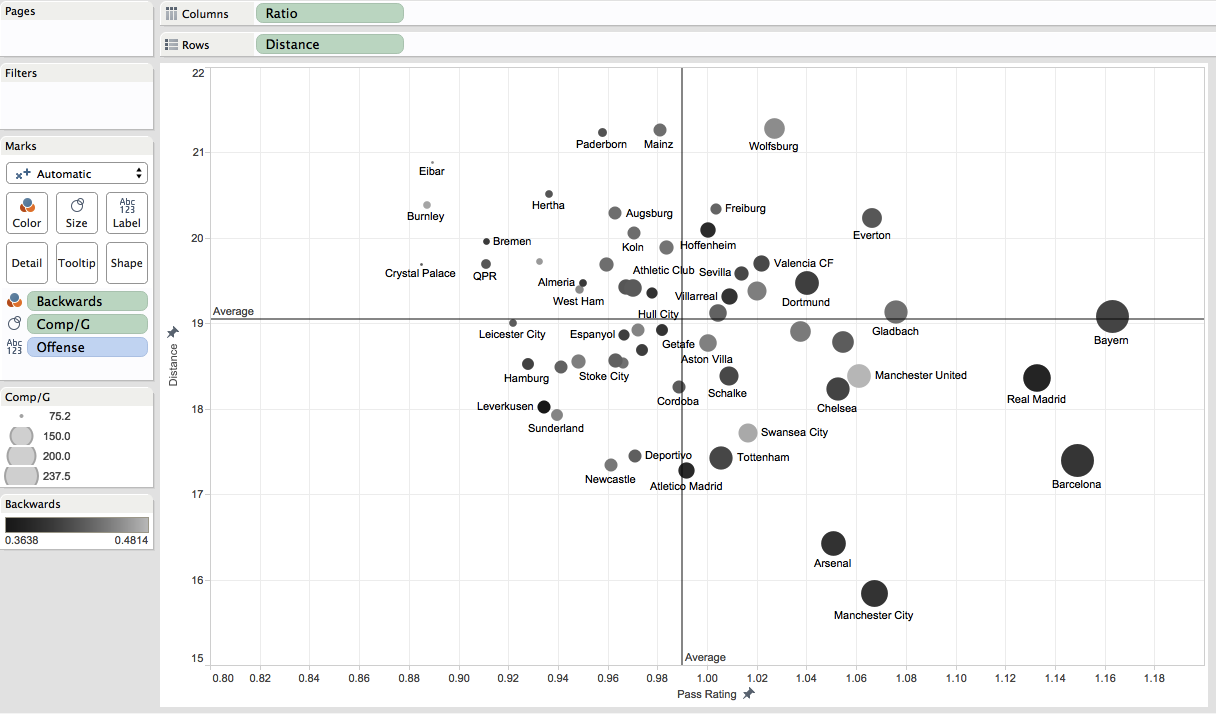
To visualize all of these factors, we go to Tableau and look at the 3 biggest leagues graphed:

Clickable link for interaction
Far on the left side of the grap we see Crystal Palace, Burnley and Eibar. These are the three teams who completed a lot fewer passes than you’d expect an average team in their leagues to complete. They were only about 89% as likely to complete any given pass as the normal team was. Moving from left to right we see teams like Newcastle, Atletico Madrid, and Mainz around the average line when it comes to pass completion quality. Far on the right, we see the expected big boys in Bayern, Barcelona, and Real Madrid. Gladbach, Everton, and both Manchester teams sit significantly behind those 3 in the second tier of this pass rating.
Looking at the bottom of the graph we see Man City and Arsenal in a group of their own when it comes to playing short passes. Up top we see 3 German teams play the longest passes, with varying rates of success. Paderborn, Mainz and Wolfsburg average midfield pass is over 5 yards longer than Man City.
Looking at the size of the bubbles, we see unsurprisingly that the best teams at completing passes are generally the ones who complete the most. One place we can see a contrast is between Tottenham and Atletico Madrid, who play similar short passes at similar success rates but the difference comes when we see Spurs play complete almost 40 more passes per game in the midfield.
The share of passes that go backwards is the color of the bubble. We see that Swansea and Manchester United are teams in the right half who play backwards passes more than anyone else, in fact Manchester United play the highest share of midfield backwards passes of any team on this chart. This is rare for a top team as you can see, and indicates a lack of forward options, a lack of aggression, or a tactic obsessed with keeping the ball.
Here is the defensive chart with a clickable link for more interaction:
We see two massive outliers immediately. One is Leverkusen, who were just enormously harder to get through the midfield against than anyone else. The other is the infintesimal dot representing Bayern. Teams complete 40 more passes per game in the midfield against Man City than they do vs Bayern. Two interesting teams to contrast are Manchester United and Rayo Vallecano. They see the same amount of passes, are both very good at stopping passes and allow a little above average pass distance. The main difference is teams play forward a ton vs Rayo (because they press extremely high) while opponents play backwards a high amount against United.
Still the single most interesting part of this graph is Real Madrid. Teams play extremely short passes while completing more than you would expect. This was not something I picked up on while watching and something that is hard to explain away as a tactical decision in a league where they are simply so much better than many of their opponents. Something was wrong with Real’s defensive midfield last season, and that looks to be a pretty big hole going forward for a team with UCL and La Liga ambitions.
Chelsea are somewhat close to Madrid, down by Swansea. This is more easily explained as a tactical decision as we know from my previous piece on converting shots to passes that Chelsea are one of the best at keeping teams at arms length or on the edge of the attacking area, and one of the best at keeping passes from being converted into shots.
The longest passes allowed are generally all German teams (see below for more on league differences) and then some bad Spanish teams and then Tottenham, who are right besides Augsburg. Only Man United and strangely QPR are better at stopping passes through the midfield than Tottenham, the main problem with their defense was the passes that get through are long and dangerous, and are converted into shots at a higher rate than any other EPL team. This would suggest at first glance that the backline is more of a problem than the midfield. United had similar problems, though they were tougher to pass against and not near as susceptible to passes being converted to shots.
Combining shot conversion and midfield control
We saw how Chelsea’s unimpressive defensive midfield numbers were overcome by the sterling job they do stopping deep passes from being turned into shots, let’s see if there are other interesting separations.
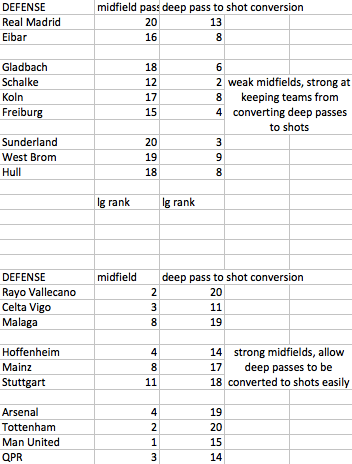
There are obvious tactical reasons for some of these (Gladbach’s shelling, Celta/Rayo’s high presses) but there are some general conclusions we can make. If my team was in the second group, I would look first to upgrade my back-line if I wanted to improve my defense.
Combining offense and defense for total control of the midfield
To see which teams really control the midfield as the title mentioned we will combine the offensive and defensive metrics. The ratio of completions/completions allowed and the amount pass ratings on offense and defense are combined for one ranking.
Top 10
1. Bayern Munich
2. Barcelona
3. Dortmund
4. Manchester United
5. Real Madrid
6. Manchester City
7. Celta Vigo
8. Arsenal
9. Liverpool
10. Tottenham
Real Madrid’s poor defensive showing is outweighed by its dominant offense. The rankings give some weight to the idea that a good midfield will build you a good team. One interesting team not in the top 10 is Chelsea, who were 15th overall but still won the league without a dominant midfield.
Looking at individual teams
When you see a team rank high or low, the next question becomes why are they so high? What players are dominating the midfield for them? While this is still a very hard question that I am in no way certain of answering, looking deeper at this kind of passing data can help tell us a little bit. We will look quickly at Man City and Liverpool, two teams who were both easily above average in number of passes and pass rating (completed passes compared to "expected" completions).
We won’t look at defenders (though I will mention Mamadou Sakho was nearly off the charts in how well he advanced the ball aggressively) or forwards (where the differences between Eden Dzeko, Stevan Jovetic and Aguero are very noticeable) but will focus only on midfielders for now.
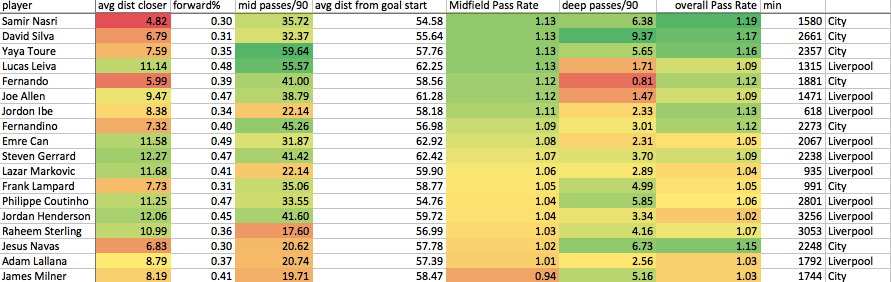
The midfield pass rate is basically how well the player is doing at completing passes that move their team toward goal in the midfield. A rating of 1 means they do exactly as well as an average EPL player, as you can see everyone here has a rating above 1, except for Milner who is 6 points below the average EPL player when it comes to completing these passes. His role was obviously much different at City than it will be at Liverpool, but the number remains a big worry for Liverpool fans. He is now being featured in an area where he really struggled to move the ball last season. When you factor in every pass over the whole field (overall pass rate), we can see Milner rises above average indicating he was at his best in the final third. His volume of work will drop there and rise in the center of the pitch in the upcoming season. Of course, more than half of the game is missing here but defensive work will come in another time, another article.
Other interesting player notes: Jordan Ibe’s high rating in limited minutes bodes well for his future and it’s another reminder of how silly good Yaya Toure and David Silva are. Liverpool as a whole saw their pass ratings drop the further upfield they got, no surprise to Liverpool fans who watched as they played an extremely conservative style for most of 2015, committing very few players forward. The limited attacking options made it very hard to pass, which will make it interesting to check in on Sterling at Man City and Coutinho with more options to see if they raise their ratings.
This is a broad overview of midfields, there are probably 20 articles to be written simply on Liverpool alone and there are tons of ways of looking deeper (who is forcing teams to play through the edges, hint: Villarreal, looking at game-by-game throughout the season and wondering why Liverpool had such poor midfield numbers vs Tottenham and great vs Chelsea while awful at home vs City and great away, etc) but hopefully you enjoyed this start. Any questions, comments, criticisms, etc feel free to reach me on twitter @Saturdayoncouch or post in the relatively new comment box below and I will be glad to discuss. Spammers, if you have read this far I am all set on sunglasses so please do not post.
Postscript comparing leagues
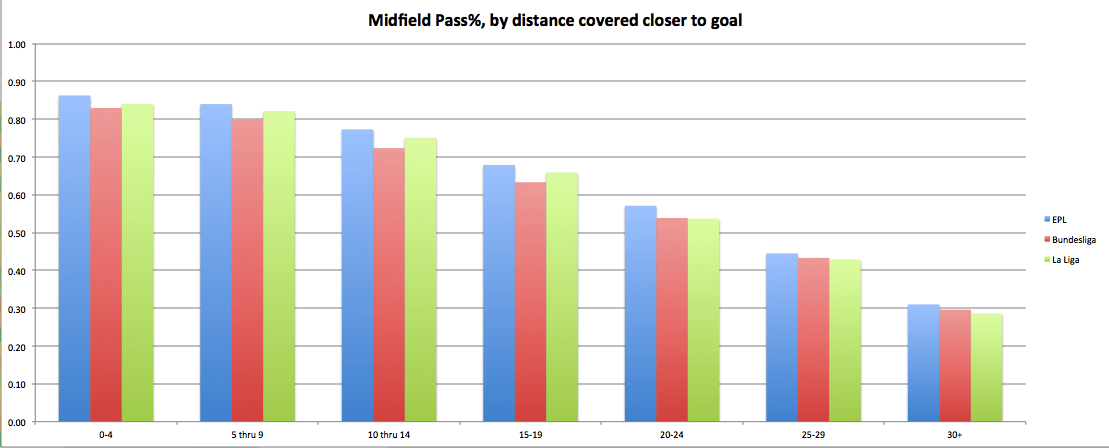
I promised a breakdown between leagues, but ran out of time. Here is a quick graph comparing completion percentages for different length passes. The Bundesliga is noticeably harder to complete passes. La Liga tends to see more short passes and Bundesliga: more long passes. Another time, maybe we can expand but there’s never enough time, right?
Footedness And Why Erik Lamela Is Worth £30m
Why Erik Lamela is worth £30m
When young players break through and score a ton of goals it's easy to take a look at their goal to shot rates and be cynical.
In fact, unless you are Ronaldo, it's likely that any season of high goal volume will be accompanied by a tasty conversion rate. In the course of my pondering, I came to look at young players who had scored a good volume of goals: specifically players who at the age of 21 or under had finished a season with 15 or more non-penalty goals.
Looking at the Enlightened data Era (2009-10 onwards) this left me with a pretty tiny sample of qualifiers; Kane and Lukaku (twice!) in the Premier League, Drmic in the Bundesliga and El Shaarawy and Lamela in Serie A. I had a quick check back and Messi only qualified once, but by that point he was already unstoppable, so little to critique there...
Now each of these players converted their shots at a rate high above league averages of around 9-10%, as you might expect for forwards – between 14% and 23% (Drmic) and each converted their shots on target at a similarly high level- 33 to 43% compared to an average of ~30%.
The higher end of these rates are obvious warning signs: that a player has scored a volume of goals is inevitably impressive and inflates their perceived reputation, but largely, aspects of the method are likely unrepeatable.
Of the five, three have been sold for large transfer fees, Lamela for around £30m, Lukaku for a shade less and El Shaarawy was bought by Milan for 20 million Euros. Kane's value, at this moment, is out of the range of any club on the planet, particularly Man Utd.
Ahem.
So I got to thinking: both the higher fees here were paid for left footed players and that chimed with some research I put together some while back about foot prevalence in football. Taking a sharp turn, that's where we now head.
Foot dominance
Footedness is an area of investigation that appears to have been somewhat under-researched in the public domain.
There is an academic paper from September 2009 called The Returns to Scarce Talent: Footedness and Player Remuneration in European Soccer by Alex Bryson, Bernd Frick and Rob Simmons that attempted to find out the effect two-footedness had on wages. They concurred that indeed two-footed players commanded a greater wage premium and in the course of establishing this carried out valuable work.
Using data sourced from transfermarkt and a sample of over 2,200 players from five leagues, they showed that of outfield players:
...the majority (…) are right-footed (60%); 22% are left-footed players and only 18% of the players in the five leagues are equally strong with both feet. The classification of players is undertaken by external experts who assess players based on observation of matches.
Then: Carey et al., “Footedness in world soccer: an analysis of France ’98” (2001), a study that decided two-footedness was far less prevalent, around 1%, with decidedly stricter criteria. Interestingly here, the disappearing 17% landed entirely on the right footed side leading to a general 80:20 split. There is also this blog that discusses the two papers in a lighter manner.
The blog is labelled “Part 1” and sadly it appears part two never came to fruition. Each study and the less heavyweight comparison blog are worth your perusal. And as far as I can tell there is little else.
Research
I went about this a little differently given that I am not an academic team and am aware of the limitations of my source material- WhoScored to be precise- but many months ago I started collecting shot and goal information and the foot used therein about higher volume shooters in the top leagues. Initially I collected 100 players from the Premier League in 2013-14.
Then some interesting players figured in the next 20 slots so I collected them too. And then I repeated the task for preceding seasons and then for other major European Leagues. I had to create a cut-off point somewhere and there seemed a little logic here, being a shooting chart, 120 players would likely collect somewhere around the 5 to 8 highest volume shooters per team: the main contributors, mostly midfielders and forwards.
Call it a labour of love, call it a pain in the arse or whatever, I did it because I was interested to and I eventually ended up with 3000 player seasons to prod and poke at. Now anyone who has collected shot and goal data will tell you that that's only half the job: next you need to throw out penalties, as they skew results and do not offer a helpful representation of general play; they are an entirely separate skill. The vast majority of penalties were easy to strip out, as the taker showed a clear predominance in the data for one foot.
A very small element of this section was subject to my interpretation, it was an inevitable problem that needed to be solved. So penalties? Out they went. And then I had to pull away the headers and finally split the shots into two categories.
By this point it was getting pretty frosty down in hell, so I figured I should look a little at the data. This is a chart that shows the prevalence of right-footedness in those 3000 player seasons- note players will duplicate- amongst just shots taken with the foot (of course, left-footedness is just the opposite graph): 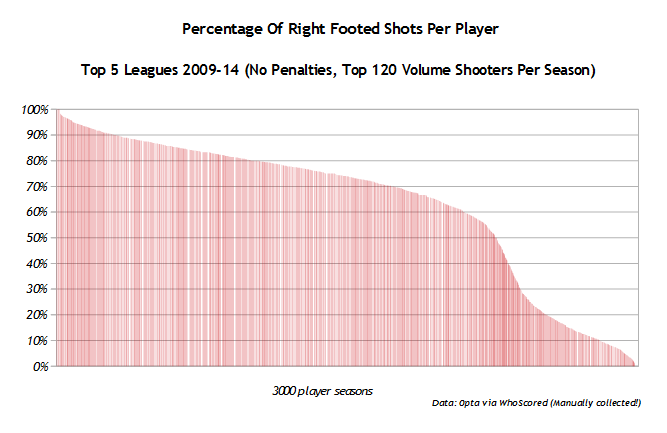
Ain't that a pretty curve? As a general rule the pattern holds for each league; a sample of four 2013-14 leagues can be seen here: 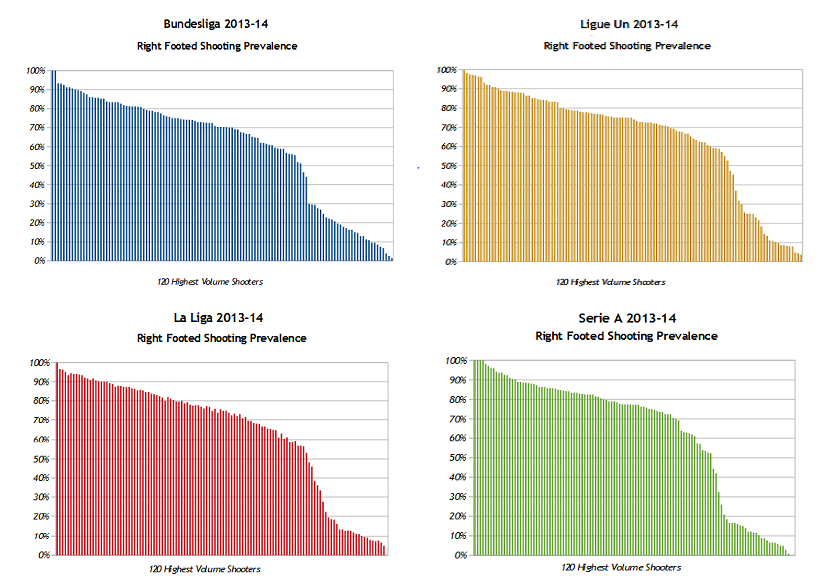
If we're looking for differences, the Bryson paper suggested that there were higher rates of two-footed and left footed players in the Bundesliga and there is a subtle difference in the shape of its graph here; the trend is very similar but the tail of left footers is noticably longer.
What these graphs show is that entirely as expected: the vast majority of players are right footed. However it is worth considering exactly how many. The earlier Bryson, Frick and Simmons paper presented their findings as follows: 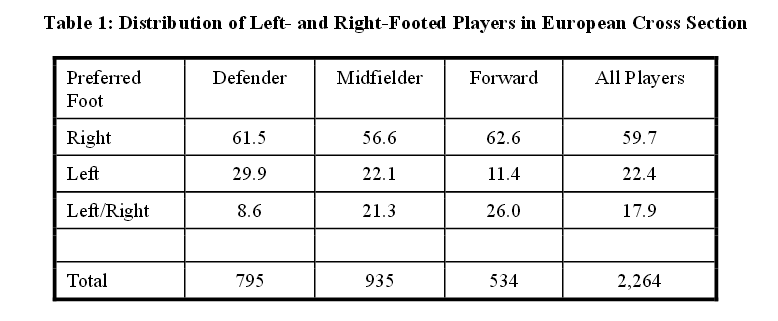
The main anomalies worth noting here are in defence; presumably the strict left/right definitions of positions here encourage a greater proportion of left footers than elsewhere in the team. Also the lack of left footers in forward positions, for which I have less tangible ideas.
For my own study I needed to find a rate of shots taken that would imply predominance. I theorised it could be defined as if a player uses their favoured foot for over two-thirds of their shots and then checked the rates for both 60% and 70% by way of comparison: 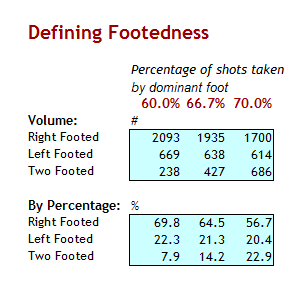
What is encouraging here is the definition of left footed players. In my sample it lands at a shade over 20% for each of the three suggested definitions, very similar to the overall sample observed by the Bryson survey.
With a predominance of attacking players in my sample, it could be theorised that a definition should be specified towards the higher end, but that remains to be seen. As a follow on to the coherence in the left footer definition we find a grey area between right footed and two footed, something which reflects back on the different definitions from the two earlier surveys.
Depending on where you peg the dominant percentage, the two groups fuel and supply each other. And we can see that 80:20 holds but more strongly as a definition between Right/Two-footed and Left footed.
Back to Lamela
The conclusion around Lamela or Lukaku is clear.
Their value is in their scarcity.
The Bryson study implies that a forward such as Lukaku is five to six times as uncommon as an equivalent right footed counterpart. Even being generous, you can locate and scout three right footed shooters for every Lamela you may find. And this shows the value in somebody as divisive as Andros Townsend.
Though confident to shoot with either foot, to be a left footer in an attacking role holds a significant potential premium. If there's anything to take from this it's surely to recognise that when a team is recruiting a left footed attacking player, they are shopping in a smaller market than for their opposite side.
Maybe even a set-up incorporating a wide right player (Navas?) and a right footer on the left side (Nasri/Sterling?) is less a tactical tweak rather than a function of necessity... Who knows? Anyway, I have other theories i've pondered or examined over months-left footers are more left footed than right footers are right footed is just one- but hopefully, this post will create a bit of interest in what I feel is an underdeveloped aspect of using the data.
There are possible implications for expected goals modelling too as people strive towards improving work here. And there are also factors around conversion rates that merit discussion but are beyond the remit of this initial post. I appreciate that people may look in and instantly see different (better?) methods of examining this subject but i've attempted to work to create an accessible point to start from and provoke thought. Cherish those lefties, for they are few.
Thanks for reading!
____________________________________________
Follow me on Twitter @jair1970
Why Did Yohan Cabaye End Up At Crystal Palace?
 Would you like Yohan Cabaye on your team? This must have been a question that floated around a few boardrooms in early summer and it seems that fewer decision makers put a tick in the “Yes” box than you might have thought. The Premier League is awash with cash these days and a player that cost Paris Saint Germain around £20m just 18 months ago and was available about half that tariff failed to rouse the interest of the top four, or even the top seven. So why not? Cabaye at Newcastle Back in the January window of 2013-14, Cabaye left the Premier League after a storming half season that surely represented his best form. A comparative rarity in the league: a genuine two-way midfielder, capable of driving play forward and with a strong shot usually employed from range, he was also unafraid of putting in defensive work. In fact, in some research I did around that time, I could only find three other midfielders with his level of contribution, in regard defensive work married to attacking output: Ramsey- in his breakout season- and in a potentially intriguing hint for any Schweinsteiger deniers- the still contributing Lampard and Gerrard. At that time, he looked as though he could start in any Premier League midfield and enhance it. But the petrodollars landed and Mike Ashley cashed in and back to France he went. Whilst selling your best player at the absolute peak of his form seems like a stupid thing to do, and disregarding Newcastle's annual spring malaise, a bid of the scale received combined with a recognition that he'd hit the high watermark made it arguably a smart move. Newcastle are smart, right? Right? Hello? Anyway, at that precise moment, a high performing 27 year old midfielder was available. You could theorise he had two absolute peak years left and on the front end you were buying this output:
 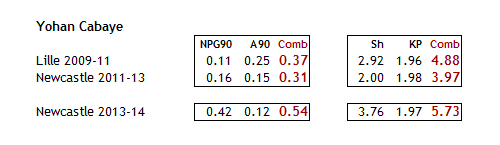 So, a cursory glance and we have a solid contributor who had the half season of his life. He and Tiote were the main volume passers in these Newcastle teams and both offered extensive defensive contribution. That last season, Cabaye, with slightly more license and an ability to roam took his shot and goal rate into the realm of a forward. But, and this is key, 75% of his shots were coming from range. Of the 16 non-penalty goals he scored in his time at Newcastle, ten of them were with his right foot and from outside the box. The four from 48 shots in 2013-14 was an extremely high rate, and was highly unlikely to sustain. The quality of performance seen- the kind that attracts a wealthy suitor's eye- was built from goals and shots. 18 months at PSG And so to Paris, the glitz, the glamour a multi-talented squad full of equivalent or better players and 18 months of well... nothing much? Let's add in the PSG numbers and a bit of information on minutes and team shot contribution:
 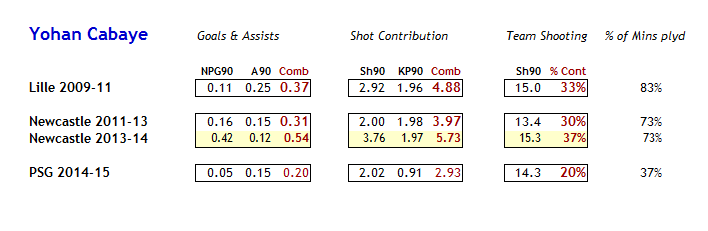 The first thing to note is Cabaye never nailed down a starting spot at PSG. That in itself is only mildly indicative given the huge depth of talent in their squad but he moved from being very much a big fish in a moderately sized pool to one of the shoal in a lake. Revered analytics sage Paul Riley hinted at this in a tweet: The problem with half decent players in bad teams is that they look like world beaters His role in the PSG team, when picked, was clearly different to before. Given a world class array of attacking talent in front of him, rather than say, Shola Ameobi, the expectation on him wasn't to drive forward and shoot, as he had at Newcastle but keep things ticking over. During his time at Newcastle, he averaged around 45 to 55 passes per 90 and lead the team in pass volume. At PSG, who were naturally dominant in their league in most metrics, this rocketed up to 75 to 85 passes per 90 but his attacking contribution fell in a hole. This seems like the motif of a player that has been confounded by two issues; team instructions and possibly his own inhibitions. Noting that his “key pass” rate halved during his sporadic PSG appearances will have done little to convince his coach or teammates of his importance. His shot rate returned to his pre-2013-14 Newcastle level; and understandably given his over-performance in long range conversion prior to his move, they stopped going in. There may well have been further issues causing problems here, but we've supposed enough for now. So, from being a first on a team-sheet key guy for Lille and then Newcastle, he became a bit part player for the French giants. He only completed 90 minutes three times in 2014-15 and got on the pitch for a mere 37% of available league minutes during his season and a half. Palace? Upon signing for Crystal Palace, plenty of people expressed surprise that a club of higher standing hadn't attempted to secure his services. There was a definite bias at work here: many people will have their most recent memory of Cabaye as rampaging through the Premier League, fewer will have visualised him warming a Parisian bench and there are rational explanations for the move that extend beyond the obvious. The straightforward re-coupling of Cabaye with Pardew is a simple hook to hang the transfer on. Pardew supervised the best form of his career, managed him for two and half seasons and will no doubt know how to incorporate him into the team he is fashioning at Palace. I'd imagine playing alongside a Tiote-like defensive midfielder in Jedinak would be the plan and once more, Cabaye returns to be the big fish in a smaller pond. This factor, combined with his age- his presumed peak years are behind him- look like the key reasons why a larger club hasn't taken a chance on him. With wages likely generous, and his reputation forged in France then cemented in England, other destinations were unlikely. Unfortunately, the time for Cabaye to join the top tier passed on PSG's bench. We can easily see why the top 7 of the Premier League may have passed on his transfer:
- Arsenal: recent policy involves world stars (Ozil, Sanchez) and fewer older players. Ramsey also occupies a similar role.
- Man Utd: the proposed Schweinsteiger signing shows the tier of player that they are looking at. There is a difference between winning French trophies and World and European titles.
- Chelsea/Man City: Odd Delph bid apart, generally shop at top table
- Liverpool/Tottenham: both buying policies revolve around younger players
- Southampton: again represent the opposite to Cabaye in transfer policy.
There simply weren't viable options for a sporadically involved 29 year old player beyond the mid-tier of the Premier League. In a sense he has returned to his natural level. It gives Palace a significant upgrade in their midfield, at least for a year or two, and is another representation of the increased spending power in the Premier League, moreso that they would meet his wage demands. Linked to that, of all the middle to lower tier, Palace seem most keen to spend to their limits. Good luck Yohan Cabaye. Maybe you will star once more in a side that is built to allow you to shine? _______________________________________ Thanks for reading! Follow me on Twitter: @jair1970 If you don’t already, be sure to follow the @Statsbomb account to ensure you are aware of all our new content
And if this piqued your interest, check out our other articles: StatsBomb 
Converting Dangerous Passing into Shots
When watching the Milan-Torino film for my last piece, the idea came to me to look deeper into dangerous area passes. Torino had put the ball into dangerous spots a lot in the first half but a check of the shot map made their half look harmless when it had actually been anything but. That led to a lot of research and then into this post, where I'll look at how often passes into dangerous areas are converted into shots, the difference in assisted and unassisted shots, what teams do this well and poorly, and ask what we can do with all this new data. Hopefully you will find this as fascinating as I did.
What are dangerous, or Very Deep passes?
Passes played very deep into the opponents area.
Okay, smartass, what is this area you are defining as Very Deep?
The area roughly covered by blue lines here, within 15 yards of the opponents goal
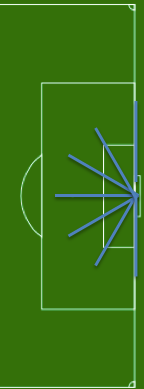
Okay, what is so special about this area, I am tired of learning about new areas and terms why should I put this one in my memory bank?
To ease the understanding of the rest of the article. There is no special reason I chose exactly 15 other than it's a clear number. Teams converted 18% of shots from this area, compared to 6% in the 15-25 yard range but that is likely true for 14 or 16, but I chose 15. Very Deep is also easier to say that 0-15 yards of opposing goal every time.
How often do teams pass into this area?
I see where you are headed. To pre-empt the next few questions, here is a general table:
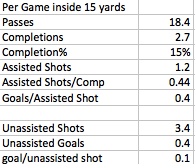
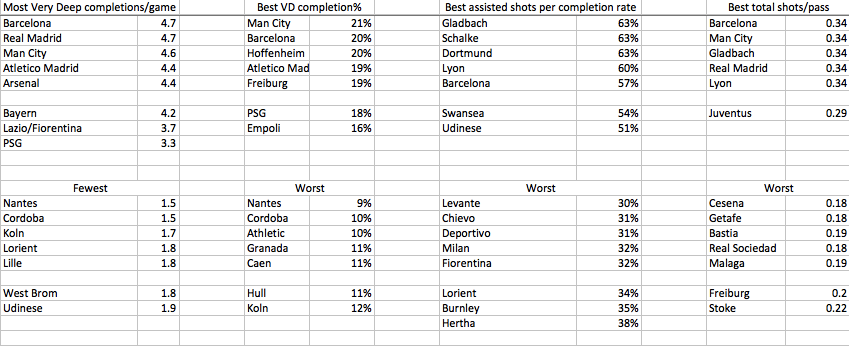
If you complete a pass in this area and get a shot off then unsurprisingly it is a golden chance. It follows that turning more of these passes into shots one of the best ways to improve your offense (or vice versa for defense). A few quick best and worst lists to put down some context.
Offense:
and defense:
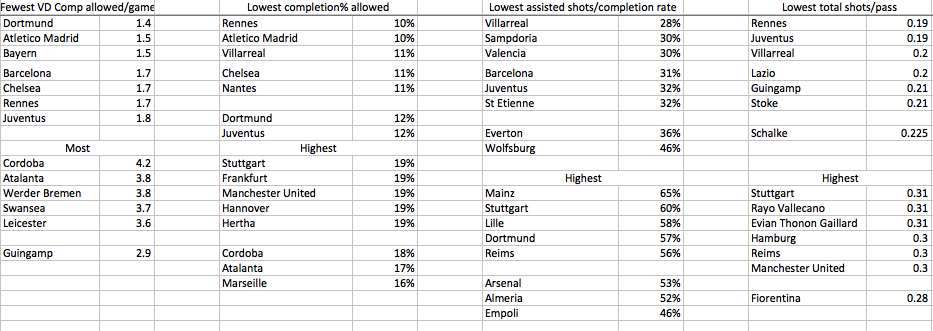
First, to explain the difference in the two right-most columns. Assisted shots/completion is how often a completed pass turns into a shot. Total shots/pass is all shots (assisted and unassisted divided by total passes into the area). A couple interesting observations: Manchester United's soft underbelly shows up here, nearly the easiest to complete passes against in this area and then allow nearly the highest shots/pass of any team.
Those are simply unacceptably bad rates for a team with their payroll. Dortmund allow the fewest completions per game, yet when they are completed they were converted into shots at the 4th highest rate. This makes me think there is very high pressure on the players attempting the pass and maybe higher risk defending on the recipient.
Ok, so where do passes into the very deep area generally come from?
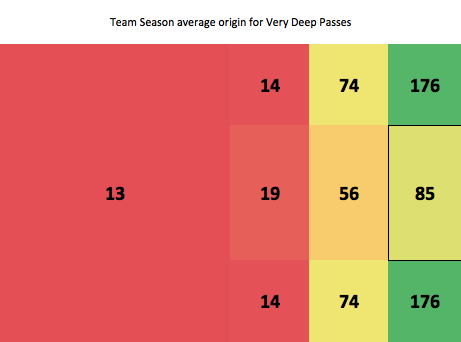
(sides have been equalized to hopefully increase comprehension, differences not significant between sides, the huge box with 13 in it is the entire own half, opposition half is the rest broken down) We see that passes into the Very Deep area come primarily from the sides, in a season an average team will play 350 passes from the corners of the pitch into this area (not counting actual corners).
All Very Deep passes aren't created equally are they?
No they are not. Here is how often they are converted directly into assisted shots:
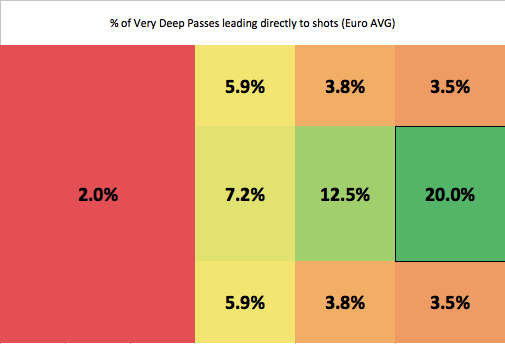
So we see that as we expected it's better to play a shorter pass from the middle of the field into the area than to hoof one from out wide. Only 1 out of 29 passes from the corners turns into a assisted shot while 1 out of 8 from the middle outside the box turn into assisted shots.
That's a European average though, does it mask differences from league to league?
As you'd suspect looking at the leaders charts above, it absolutely does. Let's look at the Bundesliga vs Ligue 1:
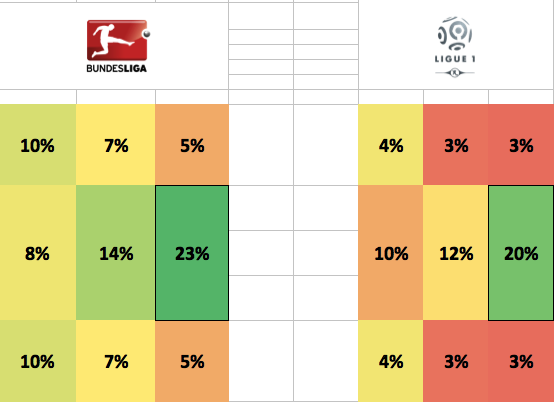
We see that long passes from the sides of the pitch are turned into shots over two times as often in Germany as they are in France. This variation in styles between leagues (which also shows up in shots) is one of the more interesting questions in football data.
Teams in the Bundesliga press out a lot more than in Ligue 1, leading to some of the differences we see here and causing pesky problems for anyone trying to build any sort of expected goals (or, as I briefly and madly considered, expected shots *shudders*) model that covers more than one league.
Pressure is the missing component I assume, as there are simply fewer defenders covering pass recipients in the Bundesliga than there are in France but until we can account for that, differences in playing styles across teams leagues will continue to trouble global model-makers, in which I semi-proudly claim membership.
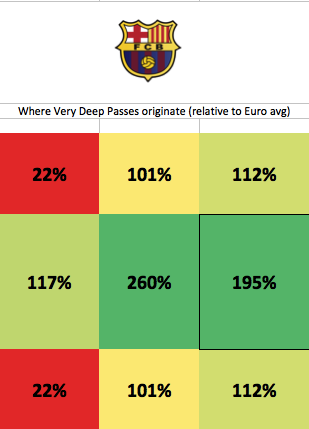
A few interesting team maps before we move on, first Barcelona. Barcelona attempts passes from the deep sides of the pitch near the halfway line less than any other team in Europe. They tried only 6 passes from there, understandably working the ball through the center.
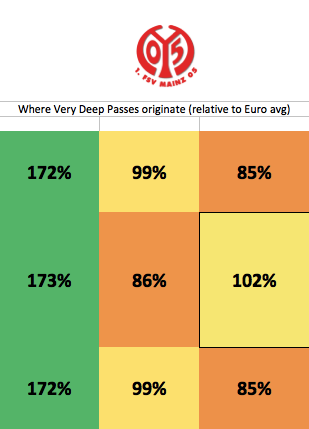
Mainz on the other hand tried 47 passes from the sides near the halfway line:
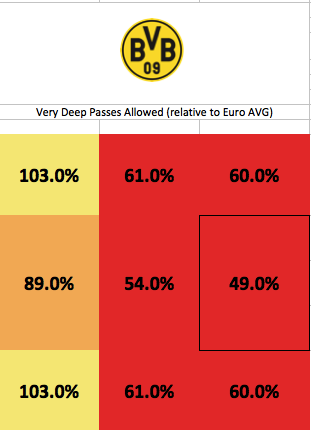
Dortmund rarely allowed any dangerous passes, though as we saw the very few that were completed caused major damage.
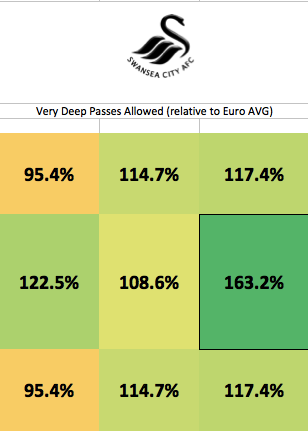
while Swansea allowed 139 passes that originated inside the box (which led Europe):
I know you just disregarded an Expected Shots model but let's see it in action anyway.
If you insist, and at the least it leads us to some interesting conclusions even if it is simply an assisted shots model. It is a very simple setup: if a pass came from the center square it is given a 12.5% chance of leading to an assisted shot, from the corners: 3.5%, etc, etc. You can look back a few graphs up at the % of Very Deep passes leading directly to shots graph to see the rest.
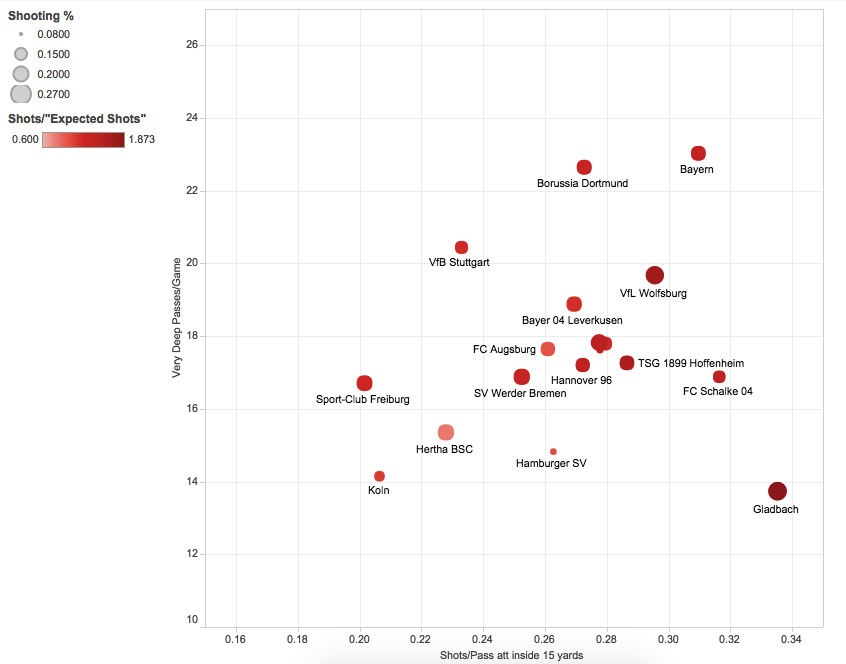
Looking at actual shots compared to "expected" shots will tell us who was the best offense at turning dangerous pass attempts into very dangerous shot attempts and who was the best defense at defusing their box being bombarded by limiting the number of shots. As expected we see a lot of German teams are great at converting their passes into shots above the rate we would expect based on where those passes came from, starting with Wolfsburg who took 32 more assisted, close-range shots than we would expect from their pass numbers:
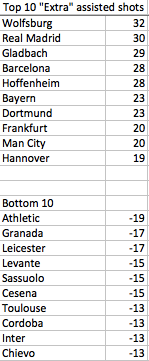
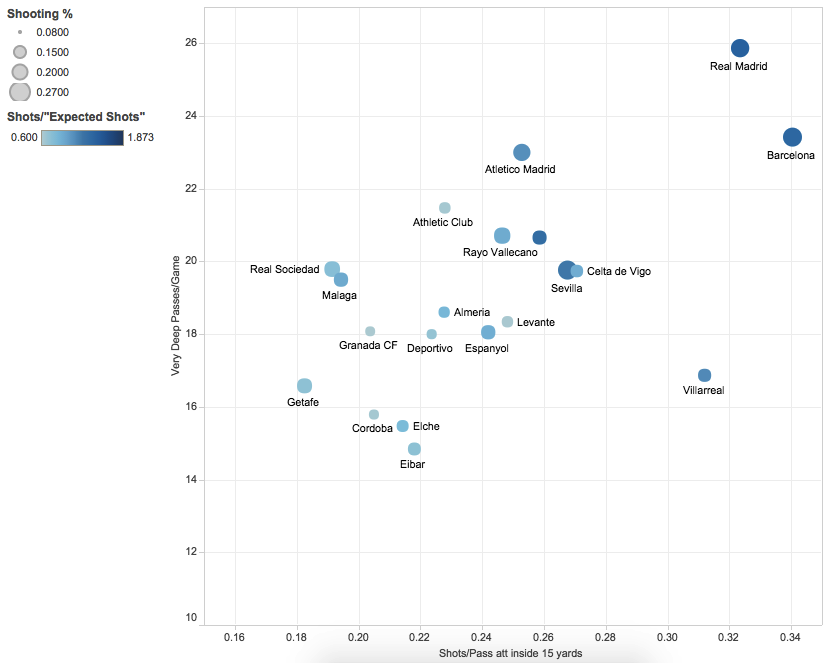
So if Athletic could convert passes into shots like Real Madrid, they would have added 50 more assisted shots to their total. If they converted those at the European average rate of 40%, they would have scored 20 more goals and possibly threatened for Champions League. I think that this means Athletic's attacking line is holding back a team with the potential to easily score 50+ goals.
They have enough dangerous possession to be doing much better, so if looking for an offensive upgrade I'd look toward those involved in the final ball as the players behind them are being let down by those in front. Looking at defenses I will split it up by league so it's not just a list of German teams in the top 10 of defenses who allow a high rate of shot conversion (number is "extra" shots allowed above or below what would be expected from pass totals and origin):
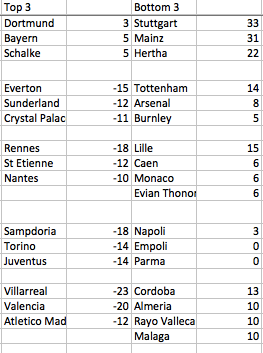
Here we see possibly why Sunderland stayed up this season. They are a surprising name to see on the left side of this table and facing 12 fewer high quality chances than expected was a big boost toward gaining the 3 key points between survival and the Championship.
We can look deeper into each league with the following images and interactive links. In Germany high on the y-axis Bayern and Dortmund are the teams well ahead of the pack in sending passes into the box. Gladbach's extreme efficiency shows up as they are near the bottom of Very Deep passes attempted, but they are best in the league in converting passes into shots. The dark color of their circle shows it's not just passes from high quality areas, they are simply converting passes into shots at a rate above anyone else in the league. The size of the circle shows they are converting those shots into goals atop the league as well.
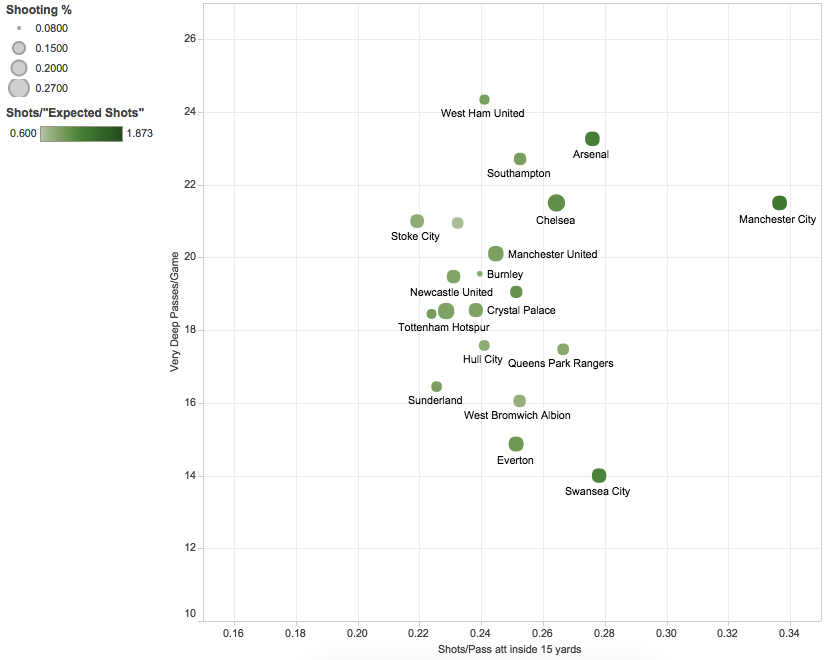
In the EPL we have more uniform conversion rates outside of Man City.
In La Liga we see massive spreads in conversion rate and very deep passes per game. This wide spread has always made this league the toughest to model correctly.
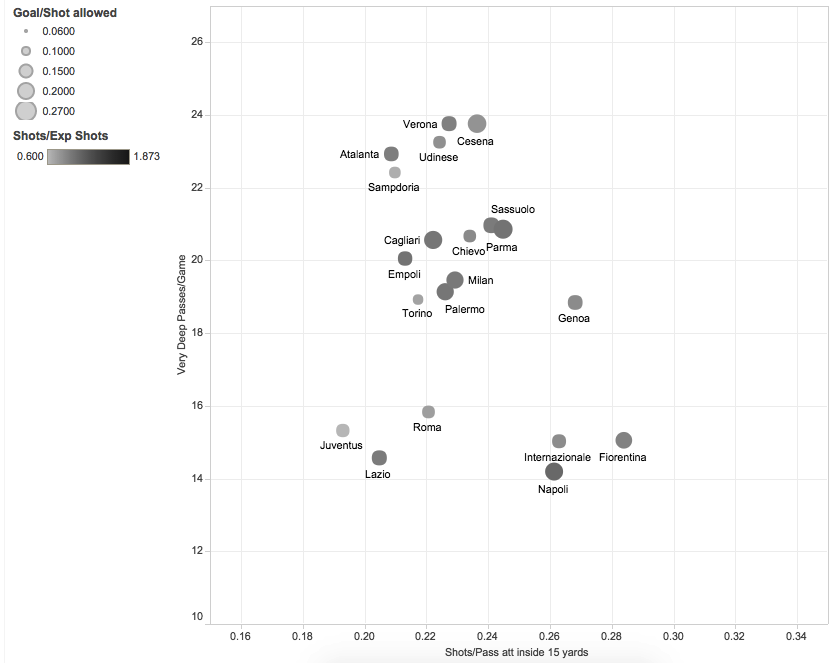
An interesting case is Serie A's defenses. 6 teams allow essentially the same amount of passes into the box but we see the difference in Juve, Lazio and Roma (the top 3 teams in the table and fewest goals allowed) is they turn those passes into fewer shots allowed than Inter, Fiorentina and Napoli.
Looking one step back
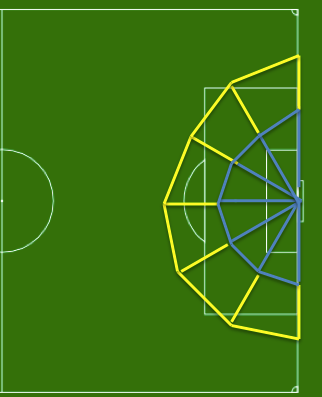
What about the yellow area (15-25 yards out from goal)? It's not near as dangerous: only 22% of completions turn into assisted shots and 10% of assisted shots are turned into goals (Unassisted shots clock in at 3%). There are still interesting things to learn looking at this area. I looked at the ratio of completions in the yellow area (deep) to the blue area (very deep), thinking teams that build a shell around their goal might keep the action at arms length.
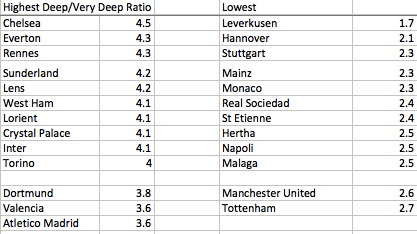
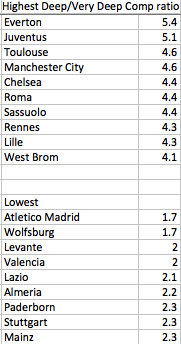
We see a familiar face at the top in Chelsea. Mourinho's wall around the goal is a familiar, frustrating sight for EPL teams and it's borne out here. You can get close, but not close enough to get a really high quality shot. At the other end Leverkusen tries to not let teams get close to their goal, but when they do they don't slow down on the doorstep they barrel down on goal. Teams who have a high completion ratio (like Chelsea and Everton) are also generally better at keeping their opponents from converting passes to shots. On offense that relationship does not hold, though Chelsea and Everton are again near the top. The offensive top 10s look like this:
What are the uses?
These metrics can help evaluate where your team's attack or defense is being let down. We used Dortmund's defense earlier and identified the final link as the weakest: they are allowing an extremely low amount of very deep passes and a low completion rate, but those completions turn into shots way too often. If they can get that rate down to even European average, that could be 35 fewer shots they would face. It gives us a glance at where teams are entering the ball to dangerous spots and how well they are converting those passes.
What is missing and what is the next step?
The obvious next step is looking at which of these metrics are repeatable and which are most influenced by luck. Right now, I have no statistical backing to say which is which but I am pretty confident that simply based on larger sample size, pass-to-shot conversion rates are much more indicative of true skill than shot-to-goal conversion rates.
Applying these metrics to individual players would be an interesting use. If Leighton Baines crosses are converted into shots at a significantly higher level than everyone else that is useful information. Same with strikers, if Aubemayang is converting passes into shots at an elevated rate while Ramos and Immobile are not, then he might be the reason and not the supply. Defenders can be looked at as well, though as usual that comes with a lot of complexity.
Problems with these metrics are the difficulty in classifying unassisted shots. Some of these likely were assisted from passes just outside the area I selected as a cutoff but it is hard to determine which ones come from dribbles, loose balls, rebounds, etc. That would add useful information. It almost doesn't need to be stated at this point, but pressure would totally change how we look at metrics like these and shots. Without a huge manual project, it's unlikely we will have Europe-wide pressure stats anytime soon. Of course, the ultimate end point is shots to goals but I felt the piece was already long enough and I don't have as much new to add in that area. There has already been plenty of good work (like this piece from Michael Caley) that has established a lot in that area. Classifying % of shots taken as headers from each area would be another improvement I could make.
Thanks for sticking with this piece through the stats and the tables.
Hopefully you enjoyed it or it sparked an idea for you. If you have comments, critiques, ideas, or anything else you can reach me @SaturdayonCouch on twitter or you can post a comment on my website.
Thanks for reading StatsBomb!

Sacked! Profiling Managers Who Failed
 Every year in the Premier League, around November (though increasingly it seems earlier), the press starts to talk about the 'sack race'. In this time, it is not uncommon to see headlines like 'X is one bad result from the sack' or 'Loss in game against Y could spell end for Z'. The focus on results has always seemed slightly odd to me. What if manager X inspires a great performance only to lose against the run of play? Should he be sacked? Conversely, if the team puts out the worst performance of the season but manage to scrape a point (or three), should that really influence your decision to sack the current boss? It is this type of thinking, of putting results ahead of performances, that results in Paul Lambert being given a new contract only to be replaced by Sherwood later in the same season. It is also the kind of thinking that analytics can help you to avoid. Given the huge financial implications of the Premier League, it is no wonder that clubs should find this sort of thing attractive.
Blame it on the TSR? Blame it on the SoTR? Blame it on the PDO...
So, how much do highly variable measures of performance influence the sack race versus the more stable underlying numbers? The first distinction we can make is between sackings that take place during the season, and those that occur towards the end and in the off-season. Intuitively, it seems like decision makers, under less pressure in the close-season, ought to be less likely to pull the trigger in response to a brief downturn in results. So does the data back this up? The following table shows the change in some of the basic performance metrics between the penultimate 5 games (10th-6th games before sacking) and final 5 games (5th-1st game before sacking) of a managers tenure, split between managers towards the end of the season and in the off-season and those sacked during the season (2009/10 to 2014/15):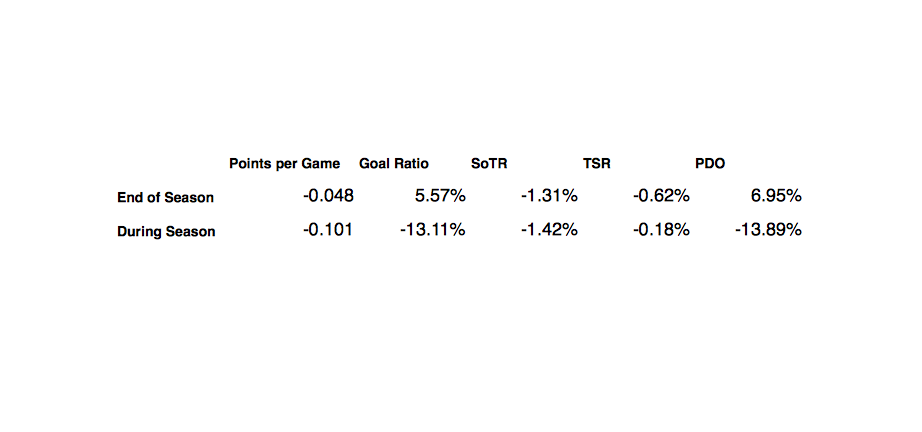 (For a slightly lengthier definitions of the metrics here, see the StatsBomb definitions page, but in short, Shots on Target Ratio (SoTR) and Total Shots Ratio (TSR) are very stable in the Premier League. As a result, these are two of the key underlying metrics to evaluate teams' 'true' performance level. On the other hand, PDO, the sum of a team's on target conversion and save percentage, is very volatile and much less repeatable. For this reason, PDO is often described as a proxy for 'luck'.) The first thing we can see is that for managers replaced at the end of the season, there is a much weaker association with a recent downturn in points gained versus managers sacked mid-season. This suggests that there is a difference in the statistical profile of performances immediately preceding sackings depending on when in the season they occur. While I'm naturally wary to infer too much causation from this, it seems reasonable to say that this could be due to post-season managerial changes being part of a longer term plan than those in-season. One example of this would be Tony Pulis's departure from Stoke City after being unable to evolve his team's style and subsequent replacement by someone who could, in fact, do it on a warm Sunday night in Catalonia.
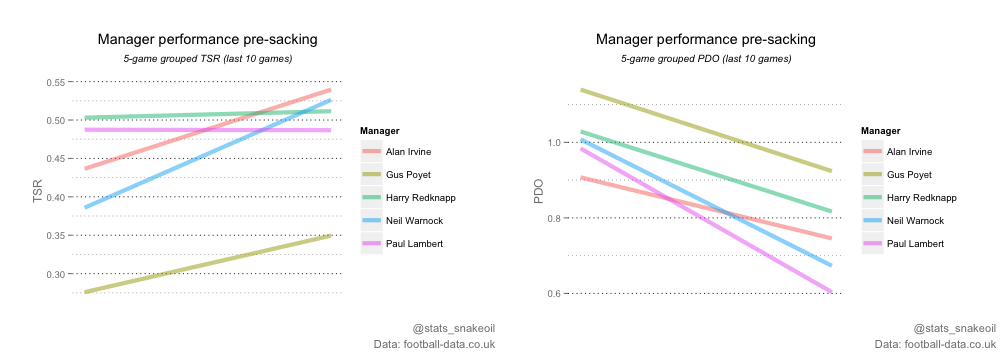
What about position in the table?
So, can we break up this group a bit more and see if a team's position in the table affects the statistical profile? The following table shoes the same metrics for teams split up by the team's final position in the Premier League table. It's also worth noting that the sample sizes are naturally smaller for the teams that ended up finishing in the top half (the top row for instance only includes Mark Hughes and Roberto Di Matteo at Man City and Chelsea, respectively) . 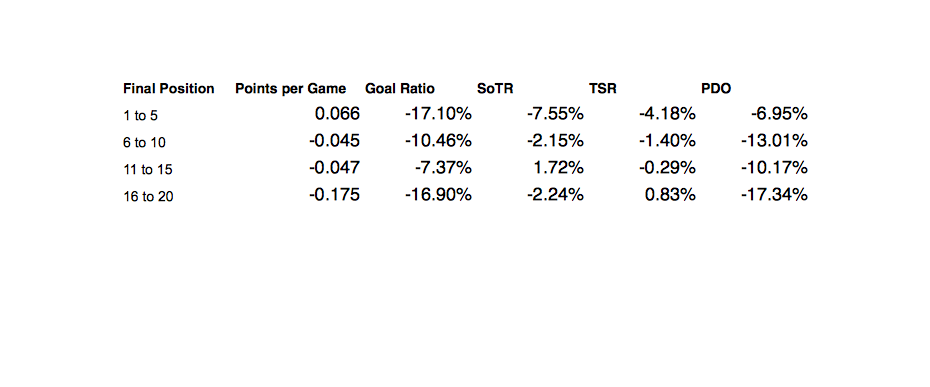 Interestingly, the broad strokes for the other three groups remains pretty similar: a drop in points yield driven largely by a swing in conversion. Ultimately, I believe this is an area where analytics can instantly help clubs make better decisions. We have only used basic measures of performance here, and without delving into more advanced metrics like expected goals, we can see patterns in manager departures. Of course, this means nothing if this insight isn't actionable; no-one wants a doctor who can diagnose but not treat sickness. I would suggest that the evidence here supports the view that the importance of results is overestimated compared to actual performance. Unfortunately for Alan Shearer, the table does lie ('almost always' according to Rasmus Ankersen) and clubs could improve their firing practices by focusing on underlying performances and progress rather than just results. Statistical models, though not the only option, are useful in this respect to gain an alternative perspective, and hopefully one that won't mistake a scrappy 1-0 win for "grit" or "spirit". All they need to do then is make sure they hire the right guy. Easy, right?...
  Follow me on Twitter:
@stats_snakeoil
Transfer Theory: 5 Things about Shot-Takers and Shot-Makers...
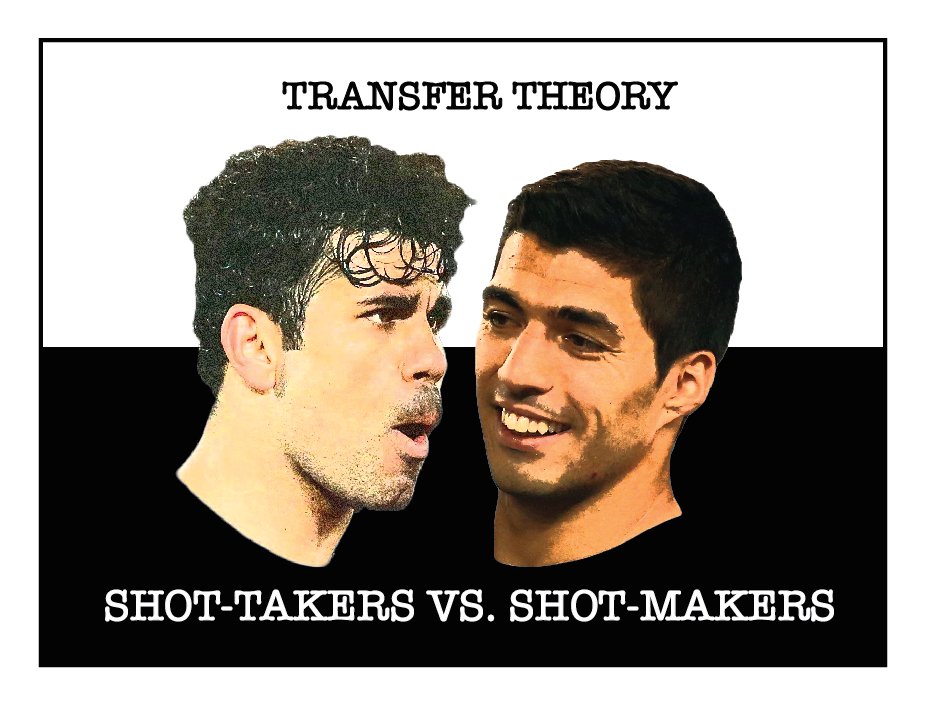 Some players are shot makers, and some are shot takers… That’s a distinction that should matter to clubs in the market for a goal-scorer.
- The Modern Day Poacher
Fillipo Inzaghi and Robbie Fowler built enormously productive careers on their shared ability to suddenly, inexplicably (!!!) be open in the box when the ball broke their way. In their heyday, these ‘shot-takers’ converted sweetly timed runs and a PHD-level understanding of the tiny pockets of space around the 6-yard box into goals, and lots of them. The trouble with players who possess this specific, narrow skillset is that they are highly dependent on their teammates creating scoring opportunities for them. If those teammates can’t or won’t do that, then all the finishing ability in the world will go unrewarded. That’s a problem Javier Hernandez struggled with in 2013/14. Despite playing a similar number of minutes as he had the previous year, Hernandez’s NPG per 90 tumbled from 0.93 per 90 in 2012/13 to 0.42 per 90 in 2013/14. The root cause for this decline was worrying… His shots/90 had halved. Generally, that’s the sign of a striker’s declining abilities, either through injury or age. And so, Hernandez was exiled to the end of the longest bench in world football. Yet suddenly, at the tail end of the season, there he was. Converting shots into goals at… oh… almost exactly the same rate he’d been managing over the previous two seasons. For a pure ‘shot-taker’ like Hernandez, a decline in shots is less worrying than it is for other types of strikers, since it’s more a reflection of the quality of the surrounding team than the deteriorating skills of the player himself. Did I mention his beefed up assist totals and increased defensive work rate? Collarbone aside, maybe Chicharito’s stopover in Madrid is the template for the survival of the old school ‘poacher’ in the modern game… 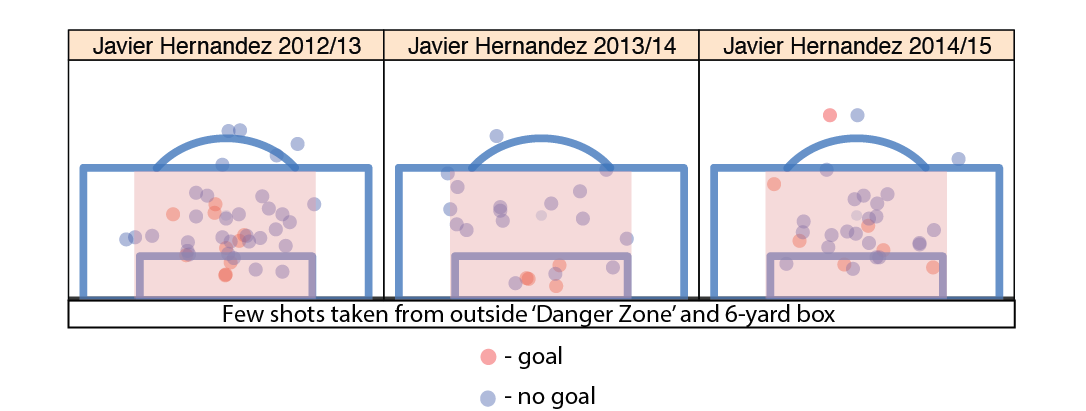
- So then, what the hell happened to Roberto Soldado?
Many thought Soldado came a little dear when he signed for Tottenham two years ago. Yes, he had scored 24 goals for Valencia that past season in La Liga, but 5 of those had come from the penalty spot and he’d played heavy minutes. The closest comps for his 2012/13 season are Artiz Arduriz (2014/15), Germán Denis (2012/13) and Dimitar Berbatov (2012/13 at Fulham): very good, but certainly not elite, strikers. Still, what has happened to him in North London boggles the mind. In 28 games under Andre Villas-Boas, he scored 6 goals, 4 of them were penalties. Strangely though, his shot totals only decreased slightly. He attempted 3.1 shots/90 in his final season at la Mestalla and 2.7 shots/90 in his first year at White Hart Lane. Stranger still, his shot locations stayed the same too. He didn’t suddenly just start taking a bunch of bad long-range shots. Apparently, they just weren’t going in. 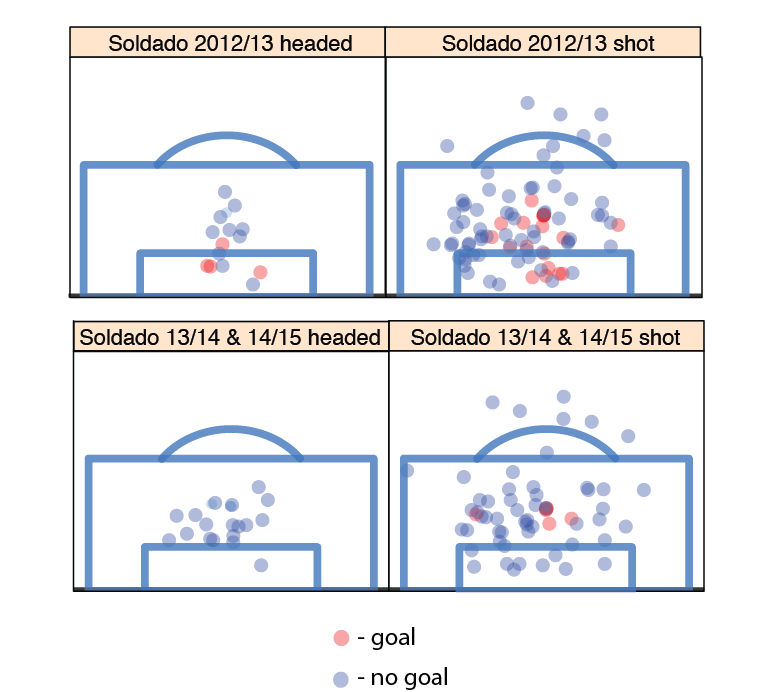 There are a few clues in the stats… Shots on target went waaaaaaaaay down, which probably indicates a decline in the quality of shots he was attempting that’s not reflected in where he took them from. If you give him the benefit of the doubt as a ‘shot taker’, that could have a lot to do with the quality of service he’s receiving and less to do with his own deteriorating skills. Also, the percentage of aerial duels he won also tumbled. I’m squeamish putting that down to the oft cited “increased physicality of the Premier League”. It could be that, but it could also be that Premier League teams tend to sit deeper when they defend, giving defenders a better chance to win balls in the air. At any rate, in the shot charts, you can see he didn’t score any goals from headers at Tottenham, despite this being an area of some strength at his previous club. Other than that, I really don’t know. Perhaps it really is a chronic loss of confidence. I certainly believe the mental side of things can account for some things, I just don’t know if it can account for this much. At 30 (just), Soldado has value, but don’t make me laugh. Clearly, he doesn’t mesh with the rest of the Tottenham team and at this point, even if he did, he still needs a change of scenery. A deal for him, be it a loan, like the one Real Madrid agreed for Chicaharito, or a permanent transfer with a small fee and a short term contract, are options that smart teams should at least kick the tires on. Then again, apparently the market for Spurs’ castoffs is pretty high this year.
- How will Radamel Falcao age?
Radamel Falcao is 29. Sometimes it’s hard to remember that just two years ago, he was one of the most highly rated strikers in Europe, seen as just a cut below the 5 or so truly elite players in world football… Well at least it would be if people weren’t constantly reminding us of this fact. You’ve already heard it. Radamel Falcao is a natural goalscorer, a finisher, a poacher (i.e. a shot-taker). Wait. No he’s not. Radamel Falcao, at least the one we knew before his knee injury, was anything but a shot-taker. Shot takers float around inside the box hunting pockets of space and a well-placed pass. They take most of their shots from inside the box, specifically, from inside the danger zone. Diego Costa is a shot-taker. Here’s his shot chart from last season. Notice how few attempts he took from the wide channels and from outside the box. 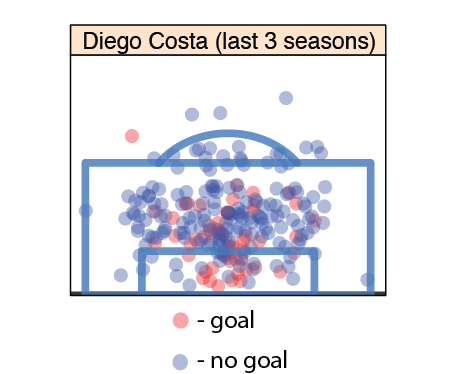 Now here’s Falcao’s shot chart from his final season at Atletico.
 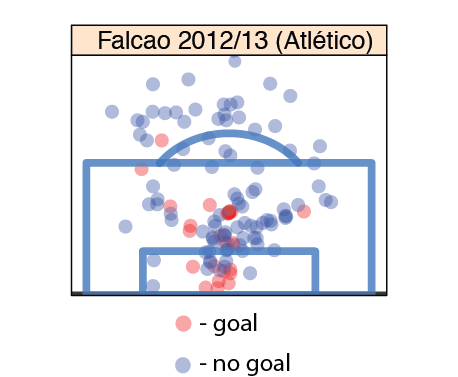 I don’t know where this misguided notion of ‘Falcao the Poacher’ came from, (EDITOR’S NOTE: probably Jamie Redknapp), but it’s plain wrong. And that’s what makes his knee injury so troubling… It’s not that he won’t recover from it[1], but by the time he does, he’ll be slowed down by age. Unlike shot-takers, shot-makers rely on their athleticism to create shots. So what happens when shot-makers lose their athleticism? What happens when Falcao’s first step becomes merely electric? Where do shot-makers go to die? Italy. Move to a less competitive league - (mi dispiace, ragazzi... ma è vero!) - and continue with your shot-making ways, just against inferior competition. That’s cribbed from the Carlos Tevez textbook. Remind me, where he’s be playing next season? Another option is to turn into a shot-taker. Van Persie’s the most recent convert, but I seem to remember Henrik Larsson having some fun with this late in his career. Look how Van Persie started focusing on the danger zone when he hit 30.
  While we’re on the subject of Falcao, why don’t go through all the reasons Chelsea won’t sign him despite Mourinho’s words to the contrary… Reasons Chelsea won’t sign Falcao
- Monaco will do everything they can to arrange a permanent deal for Falcao in his last year as a 20-something.
- The Blues don’t have a good history signing (relatively) older strikers with knee problems (see above).
- Mourinho only said all that stuff about Falcao as a favor to their shared agent, Jorge Mendes.
Reasons Chelsea will sign Falcao
- As a favor to his agent... Jorge Mendes.
- How will Memphis Depay fit in?
What happens when you stick a bunch of high-usage players (shot-makers) on a team together? Basketball fans might know this as the ‘Miami Heat Conondrum’, but football has its own ‘super-friends’… This is what happened when Luis Suarez joined Lionel Messi and Neymar in Barcelona:
| NPG/90 | NPG+A/90 | SHOTS/90 | SHOTS/NPG | |
| SUPER-AMIGOS 13/14 | 2.15 | 3.32 | 14.78 | 6.87 |
| SUPER-AMIGOS 14/15 | 2.41 | 3.72 | 11.43 | 4.74 |
Together, they took less shots, yet scored more goals. In other words, they scored more efficiently. The person who sacrificed the most was Suarez. He went from taking over 5 shots/90 at Liverpool to taking 3.1 shots/90 in his first season at the Nou Camp. It’s easy to see where those shots came from.  The critics will say that it’s easier to pass up shots for Messi and Neymar than it is to pass them up for Rooney and… Aubameyang (other idle guesses are welcome), but I’m pretty sure that we’ll see Memphis Depay become a more efficient and less voluminous scorer next season.
- Does Andros Townsend have a head?
Andros Townsend is one of the most unique players in the Premier League. I wonder if we will ever see another player like him... I commend him for the attempts he's made to diversify his game over the last two seasons, (although I wonder if he wouldn’t be better off just focusing on his strengths – a la Robben). Still, something popped out at me while I was creating these shot charts. Of the 74 shots Andros Townsend has taken over the last few seasons, not a single one has been a header.  Which makes it just too easy to say… [youtube http://www.youtube.com/watch?v=e8ONj28Tccw&w=640&h=390] [1] Repeat after me: “It takes TWO years to recover from an ACL tear.” It just does. Follow me on Twitter: @MaxOdenheimer