Roman Numerals

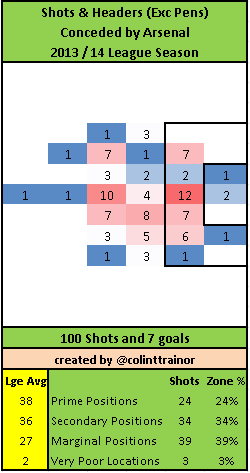
Michael Bradley’s 81st minute winner for Roma away to Udinese on Sunday afternoon was an historic moment.  It enabled Roma to notch up their ninth consecutive win at the start of a Serie A season.  This feat has only been achieved once in Italy, via Juventus in the 2005/06 season, or never before, if you prefer not to see an asterisk when looking at past achievments. With not hours enough in the week I’ll confess to not having seen much of Roma this season but I thought I would see what my numbers can tell us about their wonderful start. Defence A cursory look at the league table will tell us that with just 1 goal conceded in 9 games Rudi Garcia has ensured that Roma has delivered an almost perfect defensive performance.  As is our style, we need to go a little further into the numbers to see if the concession of single goal has been deserved or whether they have been the beneficiary of large chunks of good fortune. Defensive Shot Chart Roma Defence ShotChart 
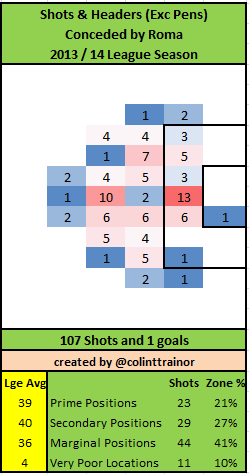
Roma’s defensive shot chart is impressive.  Although the concession of 107 shots (excluding penalties) is good, it places them in just 4th place in terms of the fewest amount of shots allowed in Serie A.  Juventus top the table with a really stingy total of just 70 shots given up during their first 9 games; Sampdoria and Inter complete the teams that have conceded fewer shots than the league leaders. Roma’s defensive strength has been in the way that they have forced the opposition to take long range shots.  Only 21% of shots against them have come from the Prime Zone (defined below); this figure is the lowest in the league. Shooting Zones 
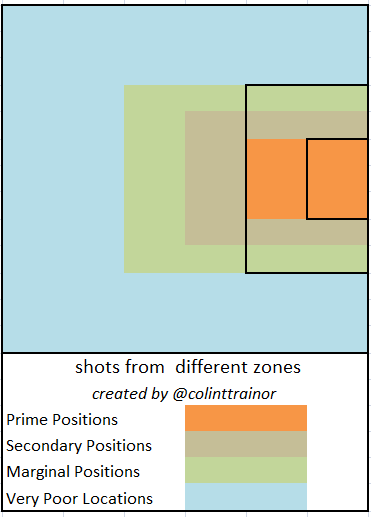
Their staunch defending around the areas of the penalty area can be further seen by the fact that by allowing just 27% of their shots conceded to be hit from the Secondary zone, they ensure that a massive 51% (roundings) of shots targeted at Morgan De Sanctis originated from the two outside zones.  Inter trail a long way behind in second place in this metric at 41%. So, in terms of defensive shooting zones Roma have been superb.  In fact, so good have they been at preventing teams from taking shots at goals from favourable positions that they have the lowest average ExpG value per shot conceded in the Big 5 leagues this season. ExpG Values To expand a little on ExpG for those unfamiliar with the concept, we assign a probability of each shot being scored.  This probability is determined with reference to all of the information that we have about a shot; the information is obtained from Squawka and StatsZone. There’s obviously something special going on with this team in terms of defence.  This can be seen in the chart below which plots the average ExpG values for the teams across all Big 5 leagues that have have had the lowest average ExpG values for the shots they have conceded. Roma AvgExpG Big5 
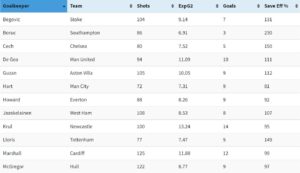
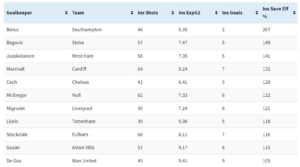
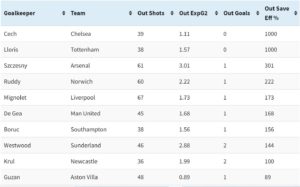
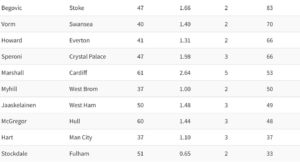
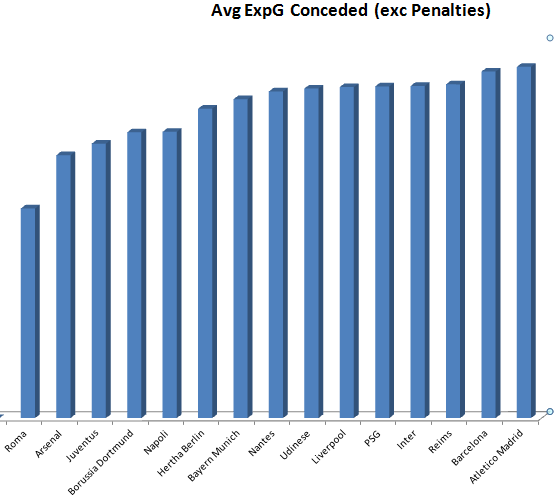
Not only do Roma lead this measure, which is quite a feat in itself, but the difference they have over the other leading teams is clear to see.  Even with removing the scale on the y axis, we can see how closely bunched the teams that follow behind Roma are on this measure.  This is always a really good indicator of a team that is head and shoulders clear of the chasing pack. Other than the shooting opportunities they give up, if I was to point out one other facet of the defensive play that they have excelled it, it would be their ability to block shots. Roma have blocked 41% of all shots they have allowed.  Only one other team in Italy has blocked more than 30% of the opposition shots, Catania at a clip of 32%. This large amount of blocked shots leads to an interesting anomaly.  De Sanctis, as the Roma goalkeeper, has saved just 17% of shots taken.  Unbelievably, with just 18 saves he has actually had the fewest number of saves in Italy.  That is certainly not what you’d expect the goalkeeping stats of the team that has just conceded 1 goal in 9 games to look like. Defensive Style It may be as a result of the fact that they have spent huge amounts of time in leading game states, but Roma’s defensive style has certainly been one of keeping it tight and compact at the back.  They do not press high up the pitch at all, they are content to let the opposition have the ball in non-threatening positions and reorganise themselves in their own half. Here follows the defensive actions (tackles, interceptions and fouls) carried out by Roma in their last home game, against Napoli. RomaTackles RomaInterceptions RomaFouls 
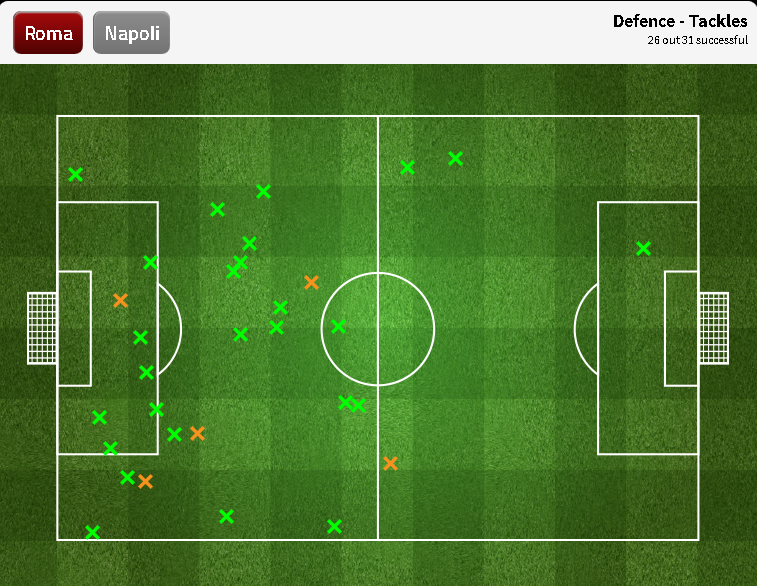
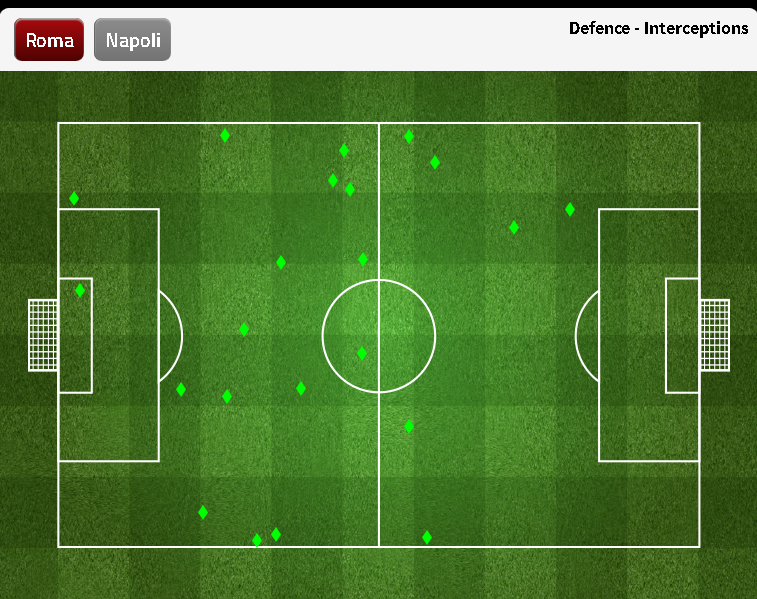
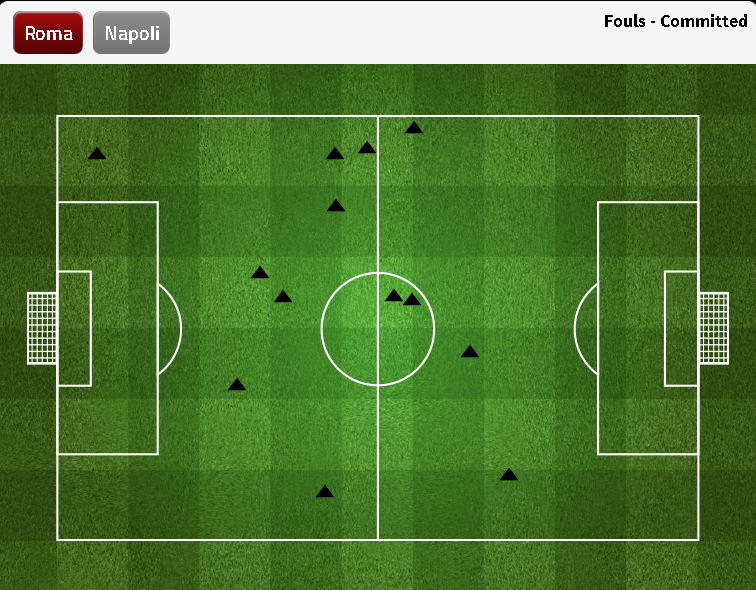
During this game Roma only had 4 defensive actions (1 foul, 2 interceptions and 1 tackle) in their attacking third.  This game was by no means a one off in this regard as they consistently have amongst the fewest defensive actions at the top end of the pitch in Serie A.  The proviso here is that we wouldn’t expect a team that has led for so many minutes to do much pressing.  However, I think this lack of pressing is important as it partly explains why they have been able to block so many of their shots faced this season. Defensive over performance However, even with the exceptionally low average ExpG defensive values that they have posted, they have still massively over performed in allowing just 1 goal to be conceded.  Based on the objective ExpG calculations Roma would have been expected to have conceded a few more goals on top of that.  Given that their goals against tally currently stands at 1 it’s not the bravest call in the world to suggest that they will see some regression in the near future.  But all I can say, is that they will…….. Outcome of Shots Conceded RomaShotsOutcome 
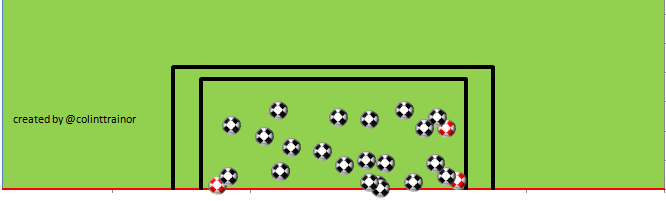
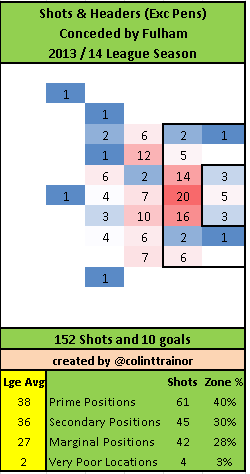
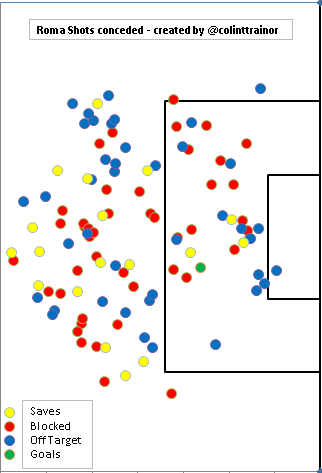
The above image shows the location, as well as the outcome for each shot that Roma has conceded.  Apart from the sheer volume of dots outside the penalty area what is striking is the 7 blue shots that have been taken from central locations in an around the edge of the 6 yard box.  The fact that they are coloured blue means that they missed the target. The wayward placing of what should be great shooting opportunities for goal scoring from those shots will go a little towards explaining why their concession of just 1 goal is much less than they “should” have conceded. For what it’s worth, according to our ExpG values Juventus should have conceded fewer goals than Roma.  Yet the Turin giants have conceded 9 (excluding penalties) to AS Roma’s 1.  Make of that what you wish. I’ll make just one final comment on the ExpG values of the shots they have conceded.  As I have stated in all similar articles, our ExpG values do not take account of defensive pressure.  The data that is currently displayed by the likes of Sqauwka and StatsZone do not include any defensive information at all.  The data does not know whether there were any defenders pressuring the striker as he took the shot or whether the defensive team had a significant number of defenders back. As Roma have blocked such a high proportion of the shots they have faced, perhaps the defensive pressure they are exerting on shots they allow is higher than average.  If this is the case then the ExpG values that we assign to the shots they conceded may well be over-estimated as our model is not capturing exactly how any given team defends.   Attacking For me, Roma aren’t nearly as interesting going forward as they are in terms of trying to understand how they defend. Attacking Shot Chart RomaAttackShotChart 
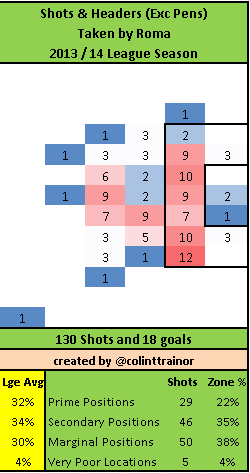
With just 22% of Roma’s shots being hit from Prime Locations they actually have the second lowest proportion of shots from this optimum location in Serie A; Livorno are the only team worse than Roma on this measure.  This fact certainly isn't what we'd expect to see of a team that is top of the table. They have slightly more shots (excluding penalties) than average with 130 against the league average of 119, and this mix of shot quantity with their shot quality results in a forecast position of 9th in the league in terms of ExpG scored.   Yes, in terms of the number of goals scored there should have been 8 teams that scored more goals than them, but there has only been one that has actually done this. It will therefore come as no surprise for me to say that through scoring 18 goals from non-penalty situations they have comfortably exceeded the amount of goals that our model had expected them to score. RomaShotsForOutcome 
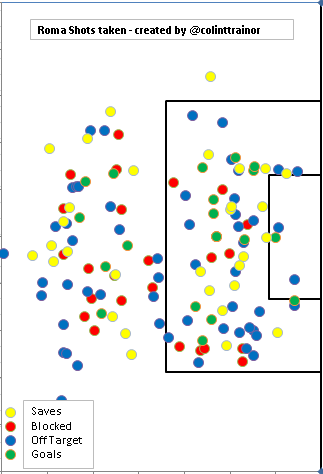
The majority of Roma’s over performance can be attributed to their long range shooting.  Their total of 6 goals from outside the penalty area is a league best total (jointly held with Napoli), this compares with a total ExpG value per our model for these shots of 2 goals.  Perhaps their style of play; compact defensive shape and then quick transitions to counter attacking football, means that due to the relative lack of defensive pressure the quality of the chances they create are better than our model gives them credit for. However, even bearing this in mind I’d be strongly of the opinion that their goals scored tally of 18 (excluding penalties) makes them look much better than their bare numbers would suggest from an attacking point of view. Placement of Roma’s shots At this early stage of football analystics, not enough work has been done to be able to conclude whether a team or a player can, in general terms, repeat good shot placements.  Personally, I think it is reasonable to accept that the very best strikers demonstrate a specific skill which allows them to pick out great shot placements.  However, on a team level I’d need some persuasive evidence to suggest that this phenomenon exists. RomaShotPlacement 
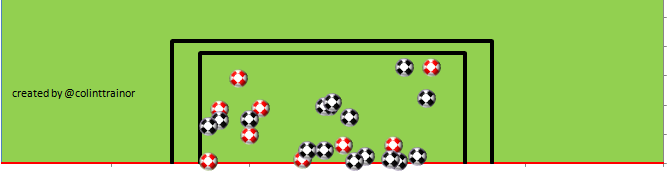
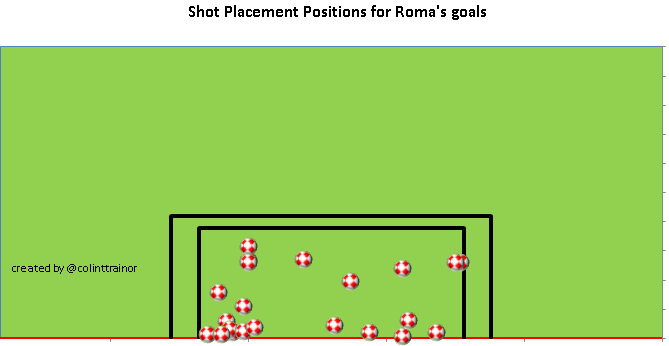
The above Shot Placement chart suggests that Roma have been very effective at picking out spots that goalkeepers find it difficult to save from.  I think this goes a little to explain why their conversion rate is 14%, which is second highest in the league.  This is conversion rate is even more astounding when you consider that they have had the second fewest proportion of their shots from Prime shooting locations. The question is whether they can continue to be as efficient with their shot placements given the distances that they have tended to shoot from. Summary So, after my detailed look at Roma I hope that this article will help Statsbomb readers gain a better understanding of how they have managed to capture 27 league points from their opening 9 league games.  With that in mind, here’s my wrap-up thoughts on their performances to date:

  • They are doing something very special in defence.  The quality of the average chance they concede is the lowest in the Big 5 leagues.  That is a serious accolade to have on your mantelpiece.
  • With a blocked shots percentage of 41% they get a huge amount of bodies back when defending which constricts the space available to opposition forwards.
  • But even with these terrific defensive traits they have still over performed significantly in defence to have conceded just one goal.  Given the amount of shots they concede their goals against tally will start to increase.
  • Going forward they appear to be average, with a slightly higher than average volume of shots being offset by generally poor shooting choices.
  • They seem to have led a charmed life with the number of goals they have scored, especially from long distance shots.  I’ll be hugely surprised if this continues.


10 Points: Evil, Regression, Fulham & Striker Per90's (wk 9)

 1) Deep Breath

When do we begin to panic over Man City's 7th place, 16 point haul? NOW! screams the generic fan. Maybe I have mellowed in my old age, maybe I don't care as much, but I am absolutely miles away from panic.

Either way, we must look at Man City's form and be gently concerned at certain traits.

  • Defensive lapses.
  • Goalkeeper having a crazy, uncharacteristic funk in form.
  • Kompany's injury breakdowns.

Here's the thing: I don't see how any of the three points that I quickly thought of are systemic faults in tactics or setup and thus can be pinned on Pellegrini.

Pellegrini can set up his team in meticulous fashion, get his tactics and personnel spot on, Man City can out-shoot their opponents, out-chance their opponents, but he can do very little about the daggers than keep piercing his best laid plans. Those daggers are individual mistakes, 5 second mistakes in a 96 minute game and they are costing Man City dearly right now. Hart, Nastasic, Kompany, Clichy, Negredo. Pick any names you want.

Man City's tactical setup, both in attack and defense is absolutely fine, in fact it is producing some of the best underlying numbers in the league. So we don't need to worry about the system Pellegrini is employing.

Think of Man City team as a huge, elegant steam liner. These individual mistakes are the giant anchor that is stuck fast to the sea bed.

Time for Joe to sit for a game or two. Have a rest, work with him on some technical issues/decision making, bring him back into a side that has Kompany in it.

 2) Torres To Aguero

Niall Quinn made an interesting point during Sky's broadcast yesterday. When asked when we'll know if Fernando Torres is back to his old form Quinn replied "when he is scoring two or three goals a game".

We know Quinn's statement is nonsense, we all laughed. But the discussion had me thinking, just how good does Torres look in the PL this year? Obviously the goals haven't flowed, but maybe the players underlying numbers can point to a return to form?

9 games into the season this is how a select group of strikers are performing:


Name Shots p90 SoT p90 Gls p90 A p90 Sc% SoT% Pass p90 ToP%
Suarez 6.42 3.35 1.68 0.28 50 52.2 48.6 44.2
Aguero 4.12 2.74 1.2 0.34 43.75 66.7 32.8 72
Sturridge 3.98 1.86 0.99 0.25 53.33 46.9 31.3 99.4
Benteke 3.55 1.97 0.79 40 55.6 42.2 62.6
RvP 4.81 1.55 0.78 0.16 50 32.3 25.1 79.6
Giroud 4.67 1.43 0.65 0.52 45.45 30.6 33.9 95.2
Negredo 3.65 1.22 0.61 0.41 50 33.3 29.8 60.9
Rooney 3.82 1.98 0.61 0.31 30.77 52 55.4 80.9
Eto'o 4.88 2.44 0.41 0.41 16.67 50 24.4 30.4
Torres 3.69 1.42 0.28 0.28 20 38.5 26.7 43.5


Torres has pretty similar SoT numbers to Olivier Giroud. Giroud has the hot scoring%, Torres doesn't.

Suarez is out of this world in his shortened season. Aguero is dynamite in every category. Sturridge has some really nice shots numbers but the goals are coming from that unsustainable scoring%, which will cool off. Also, Sturridge needs some rest, he'll become jaded or, worse, injured if he continues to play nearly every minute available.

Torres's shots and shots on target numbers are an improvement on previous seasons but they still aren't super good. The low scoring% is the anchor.

3) Player Of The Week

Suarez v West Brom. Yes, we know that Suarez crushes teams like this, but it's still nice to see one of the league's best operators in top form.

4) Southampton & Stats

Mauricio Pochettino

"I think statistics are evil," he said. "They don't really show anything. "Today it is okay as we win, but when you lose they are not as important. "I think more than anything today it is about how we played aside from the three points, aside from getting the victory. "Statistics are relative and more than anything I am satisfied with how we won today."

Pretty funny, really. Maybe MP meant it, maybe it was something that got lost in translation.

Statistics may be evil, at least in Pochettino's mind, but in the first 9 games they have some dark, evil love for Southampton. Let's see if some numbers which tell us some nice things about Pochettino's defensive scheme can convince him!

SoT Prevention% (how good a team is at preventing the opposition from getting shots on target) 70.47% (3rd)

Save% 88.46% (1st - by a mile)
 
Goals Against three (1st)
 
Final Third Passes Against 1011 (3rd)
 
Shots Against 88 (2nd after the defensive chaos and turmoil that is Man City)
 

All of these numbers tell us that Southampton have some really good things going on defensively. Southampton are able to restrict the opposition passing in their own third of the pitch, they are also able to restrict the number of shots against and how many of those are actually on target. All told, Southampton have some wicked defensive numbers.

But, and there is always a but, Southampton's save% is a thing we must talk about. At 88% it is around 16% points above the league average. It is not going to stay 16% points above league average, in fact the save percentage is going to fall and regress.

When that save% does regress, Southampton's won't be able to sustain their current ppg clip unless they can significantly increase their offensive output to cover for the regression of said save%.

Southampton have a lot of really good things going for them, but that scary good save% is coming down.

Mauricio, un poco de musica para ti...puede aprender algo!


5) Quick Fire

Fernandinho Is starting, ever so slowly, to look really good. Hid performance in the 2nd half v Chelsea reminded me of his Shakhtar days. Quick, good passer, ball-carrier, destroyer.

Cardiff If Norwich can post 31(10) shots against you, then you have some serious issues with defending, control of the game and restricting the opposition.

Swansea Look like Barcelona right now in terms of their ability to get a high percentage f their shots on target. SoT for% currently stands at 43.3%. An interesting attacking scheme for sure.

Villa, of any PL team, have had by far the hardest set of fixtures through the first 9 games. That difficult run has ended, Villa are in good shape, it's now time to get more points on the board against some of the weaker teams. West Ham, Cardiff, West Brom & Sunderland are the next four fixtures.

6) Fulham, We're Worried About You

Fulham, you want to thank Crystal Palace and Sunderland for their utter ineptitude. For if they weren't so inept we may be talking about you a little bit more than we currently are. This may seem odd, right? Fulham have 10 points so far, hell they probably only need another 25 or 27 points to survive, so what's my problem?

Fulham are a horrible team. They are constantly out-shot, they lack pace and dynamism. Hell, the only thing they seem to be good at is getting the shots they take on target (Fulham's numbers are on par with Man City, Arsenal and Liverpool. Sustainable?). Anyway, I am not sure if Fulham can continue to be out-shot to the extent they are in each game they play. Fulham's Rolling Total Shots Count (9 games)

Obviously Fulham's SoT numbers don't look as bad as their shots numbers do, but both numbers are in the bottom two in the entire league. Now, there are no certainties in life but if Fulham continue to be out-shot by this margin or worse (they have faced soft competition so far) then they will be in deep relegation trouble.

Fulham cannot, and should not, believe that a PDO of 109  (above average) will continue to bail them out of the shots deficit.

Fulham are on course to be out-shot by 439 shots and 97 shots on target.

7) Tied GS Shots & Win %

Ever wondered what the w/d/l record of the team who out-shoots their opponents at Tied GS where score effects are at a minimum? Of course you haven't.

Anyhow, I wondered what the answer is so I pulled all 90 PL games this year and looked for the team with the highest number of shots at tied and checked that against the game result. I threw out the games where the shots count was tied (7 games) just because I felt like it!

Tied_shots_win_perc_medium

The dominant shot team at tied GS went W50 D18 L15. That works out at 2.02 ppg for the dominant shots team, which isn't bad at all. A list of Tied TSR teams can be found here.

Not sure it means too much after juts 9 rounds of fixtures (luck and variance etc), but I thought it was an interesting quirk and I was really struggling to fill this point with anything worthwhile!

8) Arsenal: The Good

Arsenal have had a tremendous start to the season and it's been a lot of fun to watch. Things that are going great for Arsenal:

  • Scoring% 35% (2nd)
  • Save% 78% (6th)
  • PDO  113 (3rd)
  • SoTR 58% (6th)
  • Time Spent Winning 49 minutes per game on average.

Shots on target ratio is pretty darn good but once we marry that to the scoring% and save% numbers then it's easy to see why Arsenal have been piling up the points.

At Tied Game State
  • SoTR 60.98%
  • Scoring% 47.61% (lge ave = 30%)
  • PDO 119 (lge ave = 100)

WHOA! Arsenal are a fine shots on target team at Tied GS (no score effects). Again, add the shots ratio to the scoring%/PDO and it's easy to see why Arsenal have had such a fine start to the season. Arsenal out-shoot their opponents and the convert their shots at a more efficient rate.

So far so good...

9) Arsenal: The Regression

Now I am going to be a dick and tell you why it might not continue. Things that will regress:

  • Arsenal's scoring% at Tied Game State. It's going to regress hard.
  • The amount of time spent winning and the booster effects to scoring% & save% that minutes spent in a winning position causes. You may think 49 minutes per game in a winning position is sustainable, I don't.

Another potential reason for Arsenal's excellent numbers is their strength of schedule. I have Arsenal down as having faced (10th game included) the weakest shots TSR teams, the 3rd weakest SoTR teams and the 2nd weakest final third possession teams.

Knowing this, it's understandable that Arsenal have beaten a lot of those teams quite handily, for Arsenal beat sub-par teams better than almost anyone else in the PL. Some of Arsenal's excellent scoring%'s and PDO numbers will regress, the shots ratios are also likely to come down over the coming weeks. Why?

Upcoming Fixtures: Liverpool (h) Man Utd (a) Southampton (h) Cardiff (a) Hull (h) Everton (h) City (a) Chelsea (h).

Wow, I count two easy games there in Cardiff and Hull. The rest? That's six of the seven best teams in the country that Arsenal have to play and those games are sandwiched in-between CL games and the notorious injury months of November and December.

I asked twitter this question: What is the O/U points for Arsenal's next 8 games? Twitter thinks it's around 12.5/13 points. That would leave Arsenal at 35 points from 17 games. A good haul, but not title form.

10) Goal of The Week

Sturridge. Bad keeping but hey, the execution was dreamy.

Is Masai Ujiri Really That Great?

Everyone should be skeptical of “best executive” awards. This is part of a larger contention that people should be more skeptical in general, but “best executive” awards are a great example. People like to credit the executive with everything that went right in their organization, and blame them for everything that went wrong. The best estimate is that CEO ability has about a .3 correlation with company performance,[1] meaning that the better CEO’s company will outperform a worse-run company about 60% of the time. Luck affects the NBA’s general managers in a big way. If they make a blockbuster trade or have a good season, they’ll look like a genius; if they go years without winning, they’re likely to get fired. It’s an extremely results-oriented, rather than process-oriented, field. If you want to get sad, take a look at the NBA’s past Executive of the Year awards. Bryan Colangelo earned his second EotY honor with the Raptors after the 2006-07 season, when the Raptors won 57% of their regular season games and made the playoffs. Their win percentage after that: .500, .402, .488, .268, .348, .415. Then he gets fired and replaced with Mr. Masai Ujiri, the reigning Executive of the Year. Geoff Petrie had an even worse trajectory. The Kings put him in charge in the mid-90s, and he assembled a fantastic squad in the early 2000s that will be remembered as one of the most fun teams to watch of all time. This got him two EotY awards in three years, the only person to do that until Calangelo did the same a half-decade later. The following year, Petrie’s Kings improved again to 61 wins, winning the West. Their decline started after that, slowly but surely moving from a team that lost game seven of the Western conference finals to the Lakers with prime Shaq and Kobe (in the most bullshit playoff series of all time), to a team that missed the playoffs seven years in a row, including  a 17-win season in 2008-09. Not all of this is the fault of the executives, of course. But that’s part of the point: they didn’t have perfect control; they probably made some good decisions that turned out poorly, but on their ascent, they probably made some bad decisions that turned out well. Luck cuts both ways, and any great seasons that seemingly come out of nowhere are going to regress to the mean the next year, whether you’re executive, coach, or player. Why do I bring up all these downer lookbacks on previous EotY winners? Because I wanted to set the stage for talking about someone that I’ve come to think of as a legitimately fantastic executive: Masai Ujiri. I was shocked for him to win the award, not because I didn’t think he was the best… I was shocked that the league agreed with me. This was a year when his team ended up underperforming in the playoffs, and their team didn’t send a single player to the All-Star game. When going back over his previous transactions, I want to be really careful to separate when he made a deal that was just fantastic, and when he did something that simply ended up turning out well. This is a tricky thing, and hindsight can never perfectly reproduce the information people had going into a decision. First, let’s start off with That Big Trade, the one that put Ujiri on the map: the Carmelo Anthony trade.[2] Denver traded away: Carmelo Anthony, Renaldo Balkman, Chauncey Billups, Anthony Carter, Kosta Koufos, Shelden Williams, 2015 second-round pick Denver acquired: Wilson Chandler, Raymond Felton, Danilo Gallinari, Timofey Mozgov, 2012 and 2013 second-round picks, 2014 first-round pick, cash The Knicks certainly got the best player in the deal, but it shows the price a team has to pay to get that: three above-average starting players, two of whom were in their early 20s at the time, along with a project big man and an upgrade in second-round picks. Billups was an extremely effective player at the time, but he was aging and earning $13m in that year, and eventually got amnestied. Since it happened, this trade has been held up as the model for trading off one’s star player: clearing roster room and salary, dumping your biggest contract, acquiring several starting-quality young players, and picking up an extra pick in the process. It was thought of as a near-miracle at the time for Denver, and hindsight has made it look even better: Gallinari is coming off his best year ever, and Chandler, though hobbled by injuries, produced much better on a per-minute basis than he ever had before. Raymond Felton was turned into Andre Miller, Jordan Hamilton and a second-round pick in a deal that did more for the lob pass than any trade aside from the Chris Paul one. Kosta Koufos is a noteworthy player here, and I suspect Ujiri just got lucky with this one. He was the only player from Minnesota that Denver acquired, and at the time, he was thought of as being a pretty bad end-of-bench guy. If he was any good, Minnesota would have thought more of sending away a seven-foot center making just over $1m a year on his rookie contract. At the time, he had played just over 1000 career NBA minutes, and had already been a throw-in on a trade from Utah. His true shooting was under .500 midway through his Minnesota season when he got shipped out. Whether Denver had scouted him and seen something that could be developed and cunningly swiped him, or thought nothing of him and Denver’s player development squad had turned him into the defensive presence he is now… I have no idea. The next trade is the one with the most uncertainty still around it. Denver traded away: Nenê Denver acquired: JaVale McGee Analysis of this one comes down to a few things: how much should a good, young team value getting more young players? If a player has played on a high level for many years, and starts playing worse after injury, are they likely to regress back to their higher level of play, or is this the new norm? And, the almost philosophical question: if a person raised in a bad environment ends up bad, can they change when moved to a better one? The Nuggets had, some months earlier, signed Nenê to a monster five-year, $65m contract… the kind that can ruin a team if he turns into an injured shell of his former self. Nenê wasn’t clearly headed in that direction, but he was missing time for injuries, and wasn’t the hyper-efficient Nenê he had been in years past. So, whether by design when they signed the deal or whether they just thought better of the contract afterward, Denver sent him away for the… um… ‘inconsistent’ JaVale McGee. This is an area where I have to be very careful to divorce my non-statistical reactions to watching him play with the factual realities. For people who haven’t done it, watching McGee play is a great time. He catches lobs. He pulls off some amazing moves. He goes for sky-high blocks, and on some of those attempts, actually connects with the ball. But no matter how good his efficiency, rebounding, and block numbers look (quite good, in fact), the plus/minus data tells the real story here: with very few exceptions, his team plays worse on both ends of the court with JaVale on the floor. Nenê does not have that sort of discrepancy between his personal stats and team stats; he has monstrously improved the Wizards when he’s out there for them. JaVale, somehow, made the Wizards worse. But his talent is so obvious. Can Denver’s excellent staff train him to unlearn all those horrific years in Washington, and play like a reasonable basketball player? Watching him, I keep tricking myself into seeing improvements. Then I look back at the numbers, and they’re basically the same as they were with the Wizards: good personal stats, makes his team worse. So, a playoff team sent away an older, injury-prone veteran, effective but waning, for a younger, highly talented player who makes his team worse (at the moment). This is a tough one. I will reluctantly call it a positive for Denver, but it’s extremely close, and part of it hinges on the possibility of a pump-and-dump: acquiring JaVale, convincing the league he’s way better now, shipping him out for someone who’s actually effective. Mr. Ujiri only made four notable trades while in Denver, and we’ve already covered three. The last of his deals seemed to be, at the time, The Big One: Denver traded away: Arron Afflalo, Al Harrington, 2013 second-round pick, 2014 first-round pick, 2014 second-round pick (clause on this so that Denver will send the worse of their two 2014 second-round picks) Denver acquired: Andre Iguodala When this trade happened, my jaw was on the floor. The Nuggets managed to join in a trade they seemingly had no business being in, and gave up Afflalo (a decent-though-overrated defender and very good shooter with illusions of iso prowess), a first, and somehow dumped the Harrington albatross contract to get Iguodala. How on earth? This one is a difficult in-hindsight trade to evaluate, since Iguodala was a free agent after the season. Making trades based on what a player will decide to do in the future is a bit dicey, and as third-party analysts we’re not entitled to the in-person discussions that players have with their team and agent about where they’d like to go. Iguodala ended up leaving in a sign-and-trade with the Warriors after Ujiri left, and who knows what would have convinced him to stay? If the team had won that series against the Warriors, and the Nuggets had retained Ujiri and Karl… well, maybe the result would have been different. But what Ujiri did was give the Nuggets one of the best wing defensive players in the league, and someone that the transition-based offense put to very good use. With the information we have available, then, I’m going to conclude that this was a great deal, and one any GM would be ecstatic to make, even if it didn’t work out as well as the Nuggets would have liked. Ujiri did other things other than those trades, of course. Drafting is super-important, and he deserves credit for correctly picking Kenneth Faried… sort of. Every mock draft had him going at the 21st spot, to the Portland Trailblazers, which Portland fans will always bring up in discussions of Faried. All Denver did was take the guy that should have gone one slot higher. Also worth noting: many of the basketball analytics-oriented people, including myself, had singled out Faried prior to the draft as someone who was way, way, way better than his projected draft position. Kevin Pelton’s SCHOENE model projected him as being the second-best player in the draft, after Kyrie Irving, and there’s a very good case that’s been how things worked out. Saying he only picked him 22nd because he didn’t go 21st is a cop-out, though, since players fall unexpectedly in every draft. MarShon Brooks was expected to go in the mid-teens and fell ten slots below that, and he’s been a solid bench scorer, but nothing to get excited about. Drafting Faried was, both at the time and in hindsight, a blatantly obvious move, but being obvious doesn’t mean it wasn’t correct. Instead, I’d say that about 20 general managers made a mistake by not listening to the advanced stats people and taking Faried sooner. The jury is still out on the rest of his draft picks, since we’ve barely see them play. Fournier could end up being a steal in the late first, but the sample size is way too low to tell. There’s an important aspect we haven’t addressed though: even if Ujiri is the best GM in the league, how much is that worth? Could he be replaced by some guy off the street earning a fraction of his salary? The notoriously cheap Kroenke family aims to find that out, and so far, the answer is: no, and you’re getting a bad value for even trying. Reportedly, the Raptors persuaded Ujiri with an offer of $15m over five years, and the Nuggets wouldn’t even offer half of that annual salary. Instead, they hired Tim Connelly at what must logically be a far cheaper rate. If he could do the same job, then that’s a great deal. So far, he cannot. He has made two trades so far: shipping Kosta Koufos, who I’ve already laid my praise all over and think of as one of the league’s most underrated players, to the Memphis Grizzlies for the near-worthless Darrell Arthur, an offensively inefficient bench forward who’s way worse offensively after a ruptured Achilles. This results in JaVale McGee as the team’s only real center (Mozgov is awful), a log jam at power forward, and a downgrade in talent whether measured by conventional player rankings (150 vs 201 on ESPN’s rankings) or advanced statistics. His other trade is the sign-and-trade to send Iguodala (and cash) out, and receive the thoroughly mediocre 30 year-old Randy Foye in return. As any angry 70 year-old will note, professional athletes are paid a lot. Even Darrell Arthur makes $3m a year, which just happens to be the salary of Ujiri with the Raptors. All it takes for Ujiri to pay for himself over a bargain-bin $500k GM is to produce more than $2.5m a year in value for his franchise. Connelly, in that single Kosta Koufos transaction, probably cost the team far more in value than that, and that’s not even a trade involving players anyone has heard of. Because of how easy it is to sign a player to a bad contract that will burden a team for years (Amar’e Stoudemire, Andris Biedrins, Ben Gordon, etc), it’s pretty crucial to hire a GM that won’t make mistakes that outright terrible. A single year of paying Emeka Okafor to be mediocre costs about the same as Ujiri’s entire five-year contract, and he’s the highest-paid GM in the league. On the other hand, let’s check in with what Ujiri is doing over at his new Toronto home: Toronto traded away: Andrea Bargnani Toronto acquired: Marcus Camby, Steve Novak, Quentin Richardson, 2014 second-round pick, 2016 first-round pick, 2017 second-round pick When Ujiri went over to Toronto, I was incredibly curious whether he’d be able to duplicate those Denver trades where he seems to get way more value than he should have. And holy god, is this a value-laced trade. Bargnani makes almost $12m in his first Knicks season, had a TS of .482 last year, and (depending on who you listen to) is somewhere between average and a train wreck on defense. That contract is something that, seemingly, Toronto would want to dump at all costs, and they somehow got a first-round pick for him… and one of the best three-point shooters in the game… and a couple second-round picks, I guess just to see if the Knicks would go for literally anything. This trade goes beyond lopsided and into the realm of hilarious. When Ujiri went to Toronto, I was crossing my fingers that Denver was on some next-level statistical analysis, paying attention to the aforementioned research on how luck-based executive performance is. But the A vs B of Connelly’s transactions compared to Ujiri couldn’t be clearer: Ujiri is the game’s best general manager, and teams need to start paying their general managers like the crucial decision-makers they are. Because who’d you rather have: him or Darrell Arthur?


[1] James H Steiger, via Daniel Kahneman’s absolutely essential book Thinking, Fast and Slow. Summaries of CEO performance and related subjects are mostly summaries of Chapter 19 in that book.
[2] I’m using basketball-reference for transaction histories (and everything else), but you can get the same info just about anywhere.

5 Thoughts Through 9 Games – The English Premier League

1) AVB and the Crazy Contradictions I was talking to Mike Goodman this weekend, and we both noted that we’ve never encountered a manager with such a strong tactical system, who seems to be so adept at choosing the wrong personnel like AVB. villas-boas_contemplateAt this point, Spurs tactical system is a fairly easy read. They run a high line and two destructive midfielders to break up opponent play and recycle the ball back into the offense. They need their fullbacks to overlap and create width so their wide forwards/attacking midfielders can flood the box.  They counterattack whenever possible. And they can definitely have problems creating good chances from open play. This is especially true now that opponents understand what is going on. This last one is kind of a big deal, because as good as they look in defense (and they are outstanding), Spurs still need to score goals to win games. Last season, they averaged 1.73 goals per game on the offensive end, all of which came from open play. Spurs probably should have had 3-4 penalties last season, but those were converted into yellow cards for Gareth Bale via the magic combination of reputation + diving. This season, sans only Gareth Bale, but plus Roberto Soldado, Christian Eriksen, Erik Lamela, Nacer Chadli, and Andros Townsend, they average… 1 goal per game. But three of the nine goals they have scored so far this season came via penalty. So in reality, they are averaging .66 non-penalty goals per game, or over one goal per game fewer than last season. Knowing that they have some systemic creativity difficulties, and going into a match against Hull, a team whose only definable footballing trait is “organized defense,” who did AVB choose for his front 6?

  • Sandro, destroyer.
  • Paulinho, runner.
  • Roberto Soldado, potential penalty-box goal converter, but equally likely Spanish olive tree.
  • Andros Townsend, Captain of the Dibbles Well and Shoots from Range All-Stars.
  • Aaron Lennon… on the left. (Wait, what?)
  • And Lewis Holtby, who might be good, might be shit, and has been in England since January, yet somehow we still don’t know which is which.

On the bench were

  • Moussa Dembele, Spurs glue midfielder and their most important transitional player.
  • Christian Eriksen, a wildly creative passer and one of the top 10 assist men in Europe over the last three seasons.
  • Gylffi Sigurdsson, Icelander. Another attacking midfielder and one of the few creative bright spots for Spurs so far.
  • And Erik Lamela, £30M man, and one of the best young wide forwards in Europe. A guy who is best played as an inverted wing (on the right) because his left-footed dribbling brings him into better central shooting positions, and also helps link up with his teammates. He goes central, leaving space for the always important Kyle Walker overlaps. But who was played on the left in Europe midweek because… um… yeah.

Thus it came as little surprise to anyone that pays attention that Spurs had real problems breaking down Hull. They escaped with yet another narrow 1-0 victory, courtesy of a sketchy penalty call. Sound familiar? (Chorus: Yes!) Hull can just barely mount an attack - why not replace either Paulinho or Sandro with another good passer centrally? Why not put Sig on the left wing instead of putting Lennon out of position, especially since Lennon NEVER SCORES GOALS? Why not... well, I could do this all day. Regardless of what I think, AVB did his own thing and Spurs scrapped out another scintillating win. It did, however, come as quite a surprise that AVB chose the press conference after this game to take shots at the White Hart Lane support.  “We looked like the away team. We played in a difficult atmosphere with almost no support.” I see… It’s not that he’s wrong – fan support at home when your team is winning consistently should be tremendous. England would certainly benefit from having more German-style fans. Then again, English fans would certainly benefit from paying more German-style prices… The problem comes with the timing, and realization among Spurs fans that, hey our team DOES have problems creating, and double hey, that lineup was fucking terrible. Questioning AVB’s lineups isn’t a new thing, it’s a constant. Last year, he kept playing old dudes in defense to start the season and Spurs kept giving up late goals. Huh. This year, it’s a different angle. I personally would suggest playing your most creative players away in Europe midweek in a meaningless match was stupid. I would also suggest that leaving them out of a match where they were definitely needed in the Premier League was just asinine. Yet it keeps happening. And fans keep noticing. AVB has a great system. Spurs have a number of quite impressive players. At some point he’ll figure out how to use them all correctly, right? Maybe? [While I’m here… how much does Erik Lamela wish he were in Rome right now? Nine games played under Rudi Garcia, nine wins. No dodgy penalties required. And he’s probably the first choice right forward instead of riding pine every match in North London.] 2) David Moyes, Archetypical Muggle

United were almost inexplicably good last year. Everything about David Moyes suggests that he operates in the world of muggles. Fergie was secretly headmaster of footballing Hogwarts.”

moyes-resizeThat’s from the season preview. At this point, it’s probably fair to say that not only is Moyes a muggle, he is the archetypical one. His footballing system is built entirely on hard work and perspiration, lacking entirely in inspiration, especially with the ball. This is a problem, because Manchester United have a number of certified footballing geniuses in the squad who are used to magicking up amazing finishes for the entire world to see. Thus far under Moyes, United players have largely been robbed of their magic. All of those Evertonian thoughts about how Moyes’s offensive system would be better if he just had better players? Nonsense. He has some of the best talent in Europe at his disposal at Manchester United, and they still struggle to score, just like Everton did. Strip out 80% of the inexplicable things Fergie did - including the high tempo, and RVP taking set pieces, and the final third post-up, give-and-go game - and replace it with Moyes’s swing-it-wide, then swing crosses back in because… well, just because, and you have the 2013-14 version of Manchester United.  Including the leaky defense Fergie had in the first half of last year. Mourinho’s Chelsea have given up 6 goals through nine matches. United have given up 12. That’s enough to be the difference in the title, though right now it looks as though United will struggle to finish fourth. Back in that preview, I speculated that Fergie might help Moyes add his offensive system to Moyes’s defensive principles. After reading excerpts of Fergie’s autobiography, I feel fairly confident that would never happen. Despite his love for United, Fergie still needs the world to know he was the greatest. Giving Moyes that element of his genius so that United could carry on performing at such an amazing level might have diminished his legacy, and that’s something the old man probably couldn’t allow. At the end of the day, Moyes's greatest crime isn't not being Fergie, though many people will see it as such. His greatest crime will be not understanding how to coach an effective offense, and subsequently stealing all the fun from the Theater of Dreams. 3) Broadsides and Barns Up until this year, Luis Suarez was the poster boy for inefficient forwards. He was brilliant at creating shots for himself, but horrific at choosing effective areas to shoot from. His first season in England, this added up to a whole lotta shots and not much return. Last year, this added up to even more shots, but also quite a few goals. Yet it wasn’t nearly enough to propel Liverpool into the top 4. Efficiency matters. This season… 23 shots. 12 on target. 6 goals. 26% conversion rate.  In four games!!! That is very un-Suarez-like. Check out the guy next to him, too. Daniel Sturridge was my pick to win the golden boot in our season previews, based in large part because of how good he was at Liverpool last year, and how many chances I expected this team to create. Through nine matches, Sturridge has 32 shots, 15 on target, 8 goals and a cool 25% conversion rate. I'm going to be really irritated if Suarez pips him to the goal-scoring title. Up front, Liverpool are now one of the four most dangerous teams in the league, even without Coutinho. What’s weird, is that they have dramatically changed their style as part of the process. Mostly gone is the possession passing game, and in its place is a pragmatic, fast-break style that uses those quick, tricky attackers to their fullest extent. I get the sense that Rodgers figured out he just didn’t have the passing talent in the team to pull off his ideal footballing vision, but he does have the attacking talent to demolish teams consistently on the break. It’s an unexpected change, but one that is yielding dividends, as Liverpool sit tied for second in the table. Rodgers now has two of the top 10 forwards in the Premier League at his disposal, a fairly solid defense, an excellent keeper, and a very real chance of finishing in the top 4. I’m not sure this way of playing is more effective than last season’s, and I feel like melding the two together would yield the greatest dividends (something Arsenal appear to have already done), but I am swayed enough by the results to keep giving Rodgers the benefit of the doubt. 4) Doom Patrol Because of their early start under Crazy Paolo, Sunderland need to perform like a slightly above average Premier League team in their remaining games just to escape relegation.  That’s a huge ask for a team that is clearly “a bit challenged” in talent, but they do still get to play Cardiff, Hull, and Norwich twice. Probability says they are almost certainly doomed. To the silver lining crew hoping that Poyet is going to make them that much better… they were outshot 16-8 at home against Newcastle on Sunday. Good result. Still the worst fundamentals in the league. Speaking of awful fundamentals, the predictive model has Cardiff as the second worst team in the Premier League. Some of you are clearly spluttering and saying, “BUT CRYSTAL PALACE!!!”  The reality is that despite their initial beating of Manchester City, Cardiff are surprisingly bad, and it’s not just because they’ve had a tough schedule so far. This past weekend against offensively-challenged Norwich (their official name), the home team had 31 shots, 10 of which were on target. Cardiff had 6 shots, 4 on target. To recap, Cardiff gave up the most shots in a single Premier League game so far this season to a fellow relegation candidate. They drew that match, but still… Assuming they don’t change managers, I would be surprised if they are somehow back in the Premier League again next August. Crystal Palace may have the least talent of any team to enter the Premier League in recent memory. They have already burned through one manager and have yet to hire another. I fully expect them to pocket the Premier League money for this year, use it as a longer-term investment in the club, and rebuild back in the Championship next season. Norwich are a tricky team. At this point, it’s clear that Chris Hughton doesn’t know how to coach an offense, but he’s good at organizing defences. This particular trait, plus a reasonable level of talent  -Redmond, Snodgrass, and Fer are actually pretty good. Hooper and Ricky from the Wolfshop… maybe not - should be enough to see them through to another season. Hull will likely do the same on the back of an even more stout defense, but less* offensive talent. shahid-khan-locksMartin Jol needs to send Christmas baskets to the owners of Sunderland, Cardiff, Crystal Palace, and Norwich simply for existing in the Premier League this season. Or as a Christmas gift to the world at large, he could just grow a Shahid Khan-style handlebar mustache. THAT would be awesome. *And by less, I mean almost none. Error, Error on the Wall One of the things that models have a really hard time with is incorporating individual errors. Is Joe Hart going to screw up… again? Is Laurent Koscielny going to take down a forward 45 yards from goal near the sideline and get a red card… again? Is Yanga-Mbiwa going to… well, in the case of Mbiwa, you can just assume the likelihood of error is 100% and move along, but for most teams predicting when and where errors will happen is basically impossible. This brings us to the problem of Manuel Pellegrini and Manchester City. This team is playing outstanding football. Possibly the best football in the Premier League this season. They have the best offense in the league. They have the second best goal difference, one point behind Arsenal. hart_faceExcept… They keep committing soul-crushing, goal-yielding errors on defense. Joe Hart is a problem, but he’s not the problem. The problem is that they have had too many injuries at center back for any sort of a reliable partnership to form, and they somehow keep letting guys run through on goal. Oh, and Gael Clichy might as well be named the team’s official bonfire for how often he gets torched. And Joe Hart is completely, and utterly unreliable right now. Quality full backs are hugely important. So are healthy, good center backs. The margin for error in the Premier League is exceptionally low, which makes the cost of individual errors exceptionally high. City are good enough that they can overcome being 7th in the table after 9 games, six points back of the league leaders. A couple more of these, however, and another Champions League qualification will be all they play for this season. 5) That Team In First 1)      Are not as good as they were last season defensively. 2)      Went toe-to-toe with one of the two best teams in Europe for 84 minutes last week in a match that could have gone either way. 3)      Still might not make it through to the knock out stages of the CL. 4)      Have had a fairly easy run of teams in the league so far this season. 5)      Are somehow getting 43% of their shots on target, a Barcelona-like number. 6)      Still haven’t fielded their best 11 players together yet this season. 7)      Are leading the league in goal difference. 8)      Analytically look an awful lot like Manchester United last year. 9)      Have one healthy starting forward. A forward who is only getting 30% of his shots on target, and converting only 14% of his shots into goals (which is basically his career rate). 10)   Will inevitably… *CRY OF ANGUISH* *I AM NOT TYPING THIS, YOU CAN’T MAKE ME!!!!* Cheers, --TK           *…regress. Dammit.  

10 Points: Arsenal, Requirements, Set Pieces & Game State Effects


1) Goal Of The Week

Kasaaaaami! This is what I said on twitter on Sunday morning:

@mixedknuts Unless van Basten, circa '88, scores today then Arsenal's first will be the nicest goal for a long time... — Ben Pugsley (@benjaminpugsley) October 20, 2013

And just like that the Pajtim Kasami scored a goal which had tiny hints of the peerless Marco Van Basten sprinkled over it.

2) Scoring

We've been through this before at 10 Points, but @richardwhittall brought it back up again!

Whittall: While it’s certainly possible that something was up early on and has now smoothed itself out, it’s equally possible that the slow opening was just a tick of the needle in the wrong direction, a quirk of random variation. Perhaps as the games pile up, that number may creep ever higher, or, as is more likely, plateau. We should keep this in mind before rushing off to search for meaning in seasonal goal-per-game trends. Historical trends are far more telling of the health of the sport.

Agreed. From the start of this debate I always maintained that shots on target were pretty stable, shots on target% was also pretty stable and at normal historic levels. Instead, the lack of goals was all due to the weirdness of scoring% (goals/shots on target).

The historical average for Scoring% is about 31%-ish. As we can see from the graph below the PL's first 4 weeks of the season saw pretty low levels of scoring% and, in week 3, a ridiculously low scoring% number. Reasons for that 4 week stretch to open the season? No idea, who the fuck cares, it's probably variance and luck and maybe some system effects in the early season.

As we can see from the chart below rolling scoring% is on the rise. REGRESSION! Scoring%, by the seasons end, will settle at ~31%.

Sc__wk_8_medium

3) Arsenal: Shots Influence

Arsenal are top of the league after 8 games and congratulations to them. They have recorded some excellent results so far, although slight negatives would be the weak quality of opposition that Arsenal have faced and Arsenal's non-stellar underlying numbers.

Anyway, I don't want to be a killjoy about a team who is playing some bloody nice football and should get better when some key players return from injury. Wenger must rotate his players in November and December though, gotta keep the players fresh.

Shots Influence

Shots influence looks at each players contribution to team shots when on the field of play. So, we count a players shots and shots assists and divide them by the team total. Giroud and Ozil are the two players who are driving Arsenal's offensive output thus far. For me, Ramsey is by far the most interesting: why is Ramsey's number rising on a game by game basis? is Ramsey's role changing, which allows the player to be more influential, or is it something else? Confidence or a self belief that he can be an important contributor on the offensive side of the ball? It'll be interesting to see how long Ramsey continues this improvement in terms of shots influence.

4) Set Piece Stuff

Set pieces are funny old things, eh. I can't decide just what the luck/skill split is for set pieces and this makes evaluating some of these numbers problematic. If pushed I'd say shots creation/prevention has far more skill than luck.

Still, here are the set-piece SHOTS numbers through the first 80 games. *Set piece shots= shots from corners, shots from free kicks, shots from direct free kicks. (I wish I could separate direct free kick shots but I can't)


Sp_shots_wk8_medium

Man City are doing some pretty wild things in terms of generating set-piece shots for (1st) and preventing set-piece shots against (1st). This doesn't really fit with Man City the weak set-piece team. City have conceded a low, low number of shots from set-pieces but what about goals?

Sp_goals_wk8_medium

So, City have conceded just 14 shots from set-pieces but those 14 shots have yielded 4 goals. City conceded% is28.7%, league average is 9.2%. In short, City won't carry on conceding goals at that rate.

A word on Fulham who have conceded the most shots and taken the least shots from set-pieces. Fulham have scored 5 set-piece goals from 16 set-piece shots. Unsustainable to say the least.

5) Week 8 = No Shocks

I had a mighty good week in terms of betting on the PL; if I believed in accumulators then the girlfriends shoe collection would look a whole lot better right now!

This was the week of the fav: Chelsea, Arsenal, City, Arsenal, Fulham, Everton and Swansea. Even the tricky picks weren't that tricky. Stoke were a good shout to draw and opposing Liverpool and Man United in last weeks games wasn't too difficult a decision.

Having no shocks in a round of games is a pretty rare occurrence.

6) Requirements: Man United

Man United: Currently have 11 points from 8 games, which is very un-United like. Would it be fair to say 83 points would be in the ballpark to win the 2013/14 PL? That means Man United need 72 points or 2.4 ppg from here till the end of the season.

2.4ppg is a 91 point pace over the course of a 38 game season. Absolutely nothing about this Man United team gives us the slightest hint that they can suddenly become a team capable of 2.4 ppg/91 point season over 38 games.

There is a glimmer of hope for United in that their schedule has been mighty tough so far this season and at some point (last 10 games?) United's schedule will cool down significantly. Still, United are facing a 30 game run of 23 wins, 3 draws and 4 losses to get to 83 points by the seasons end. Even 83 points may not be enough.

6) Requirements: Sunderland

Sunderland have 1 point from their first 8 games. 38 points is the line in the sand for PL survival. 37 points from Sunderland's remaining 30 games works out at 1.23 ppg, or, normalized over a full 38 game season, ~47 points. It seems to be very unlikely that Poyet can turn this Sunderland side into an upper mid table team in his remaining 30 games.

Obviously, we never want to deal in certainties, but it looks pretty clear from this writers point of view that Sunderland are in desperate trouble. If you need further evidence, just go look at Sunderland's SoTR and PDO numbers from this post.

To me, in my dark, attempting to quit smoking mood, this is what doom sounds like. This is Sunderland's sound:

8) Palace: How Low Will You Go?

Two points from 8 games and looking severely over-matched in most games they have played, what will become of Crystal Palace? Relegation seems to be the likely answer and, quite frankly, it was always on the cards what with minimal investment and a thin squad to begin with.

Palace are on course for 9.5 points. Obviously that is not going to happen, but is 20 points a fair line in the sand for this Palace team? Is that too low?

How about 25 points which is the only live line I can find right now. Do Crystal Palace make it to 25 points? I'd be amazed, quite frankly. They appear to be awfully weak right across all positions and without a huge investment in January (unlikely) this looks like the worst team to grace the PL since those glorious Sunderland and Derby County teams.

Obviously, when Palace survive on the last day with 40 points, I expect someone to dig this up and tell me how stupid I am!

9) Game State Effects On Shooting Accuracy And Prevention

Long title, a ton of work but by the end of the season I will have so much information on game state effects that it will make the effort worth it.

For now, I just want to show you how the game state and the tactical effects of the game state affect shooting accuracy% (shots on target/total shots)

Shooting_acc_game_state_medium

Now, the information at +2 game state/-2 game state will need some time to smooth out but there are some interesting things going at the Close Game States.

Tied game state shows us information about teams' behaviour without any score effects so things here look pretty normal.

Plus 1 Game State is mighty interesting through the first 80 games: The team leading by a goal (plus1) manages to get a higher% of it's shots on target than their opponents who are trailing by a goal (35.2% to 33.7%) and we know this is probably due to shelling effects.

Shelling effects? The team that leads by a goal tends to sit back in a tight defensive shell which restricts their opponents ability to get shots on target. Included in this shelling tactic is the counter attacking bonus: it's easier for a team leading by a goal to create better shooting opportunities as it's trailing opponent pushes hard for an equalizer and leaves a lot of space to be exploited. That space allows the team at Plus 1 to get a higher percentage of their shots on target.

Looking at Minus 2 game state, it's easy to see why the game is virtually over with. The team that is trailing by two goals finds it extremely hard to get their shots on target, whilst at the same time leaving their defense horribly exposed to efficient opposition attacks.

In short, if your team falls a goal behind it's more difficult to get your own shots on target and the opposition find it easier to get their shots on target. Falling a goal behind is a lose-lose situation.

10) Team Goal Of The Week

A thing of beauty. Controlled passing, speed of thought and feet, and a snap finish by Wilshere on his right foot foxes the 'keeper. Beautiful goal.

Goalkeeper Saves Week8 EPL 2013/14

In the article I published on Monday I introduced our (Constantinos Chappas and I) ExpG2 metric as an objective quantitative method to rate the shot saving performances of goalkeepers.  Due to the way that ExpG2 values are calculated it makes an excellent objective measure of how effectively a goalkeeper dealt with the shots he faced.

To recap, the ExpG2 value is the goal expectation that each shot has after it has been struck by the player shooting and it is calculated with reference to all of the data that we know about the shot.  One of the main drivers of the ExpG2 values is the placement of the shots.  Any shot that is blocked or off target has an ExpG2 value of zero.

What information do we know about the shot? We have the information that is provided by Squawka and StatsZone (both of which are powered by Opta).  Unfortunately, we have no defensive pressure data available to us so the ExpG2 values do not take into account defensive pressure.  Still, even with that omission we’re left with what, in my opinion, is the most objective measurement of how a goalkeeper performed from a shot stopping point of view.

My article on Monday looked at EPL ratings for last season, and I promised that I would use the same methodology to rate the goalkeepers for the current season.  I’m going to present the data from the first 8 games in the EPL this season, but due to the lack of games played I need to issue a warning as to the volatility of these results.

You will see that even just 1 more goal conceded or prevented may substantially change the ratings at this early stage of the season.  That’s not the fault of ExpG2, it’s simply reporting mathematically,  what has happened.

2013/14 EPL Season (thru 8 Games)

We’ll start off with looking at all shots for goalkeepers that have faced at least 32 shots (that’s 4 per game).


ExpG2 is the amount of goals that our model expected the goalkeepers to concede based on the type of shot and shot placement

Goals are the number of goals conceded by the respective GKs Save Efficiency is (ExpG2  / Goals), with a higher number signifying less goals than expected were conceded

This table has been sorted by default in descending order of Save Efficiency, but you can sort the table as you wish.

Southampton

We can immediately see part of the reason why Southampton has had such a great defensive record at the start of this season.  The concession of just 3 goals means that their defence has conceded the least so far in the Premier League.  As you would expect with such an excellent defensive performance, it has been achieved as a function of both great goalkeeping and a defence or team that protected him very well.

From the protection point of view, the fact that the shots faced by Boruc has lower ExpG2 values than all the other teams in the Premier League demonstrates that his teammates in front of him have excelled at ensuing Boruc had just the minimum amount of work to do.

The Save Efficiency % suggests that Boruc has massively outperformed as he has saved 4 more goals than his numbers would have suggested.  His value of 230% is excellent, but unless he now gets changed in a phone box before matches and wears his underpants outside his shorts his Save Eff number will inevitably have to reduce. For reference, De Gea was the league leader in this measure last season at 138%.

Although I’m absolutely confident that Boruc’s Save Eff % will regress, it will be really interesting to see if his teammates can keep him as well protected for the remainder of this season.

Here is Boruc’s Shot Chart for shots faced this season.  Saves are the white balls and goals conceded are the red ones.  You can see why he has earned a rating of 230%.

Boruc's Shots Faced


BorucShots


Cech, Lloris, Begovic and Mignolet are all bunched up fairly tight behind Boruc as the best of the rest.  Each of those 4 goalkeepers has saved their teams approximately 2 – 2.5 goals so far this season. Mignolet’s performance reaffirms the decision that Liverpool made to replace Reina with the Belgian.

Eagle eyed readers will see that this table doesn’t average at 100%.  The reason for this is that our model wasn’t fitted using just this dataset.  We used a number of leagues and a longer time period.  The fact that the average sits well above 100% tells us that goals haven’t been scored at the rates that the raw shot data would dictate.  Perhaps this may be due to the defensive pressure in the Premier League that we cannot measure, or it may also be due to short term variance.  Most likely, it’ll be a combination of those two factors.

Fulham

Anyone who follows me on Twitter will have seen the Fulham Shot Chart that I published yesterday morning.  They have conceded a huge amount of shots from what appear to be great locations:


FulhamShots


Yet they have only conceded 10 goals.  So, for me, it’s interesting to see that the ability of Fulham to prevent those shots turning into goals on a more regular basis doesnn't seem to be down to the performance of Stockwell in goals as he is actually one of the poorer performing keepers so far on this metric.

Everton fans won’t like to see Tim Howard with just 92%.  Mind you, the Man City fans might just wish that Tim Howard was their goalkeeper.

Joe Hart

In Monday’s article I concluded that Joe Hart was below average last season, and this under performance was solely attributable to the long range shots he faced.  As I said at the top of this piece, it’s early in the season and much too early to be drawing too many conclusions from these numbers but the lack of saves made thus far by Joe Hart is alarming.  He has conceded almost 2 goals more than the shots he has faced would suggest.

If I can brielfy have a licence to be melodramatic, we can compare the sublime (Boruc) with the ridiculous (Hart) with Joe Hart’s shot chart:


HartShots


As England’s Number 1, or even just a Premier League standard goalkeeper, Hart will be disappointed with how poorly he has saved the shots aimed at him during City’s opening 8 games.  In this regard it will be interesting to see how Hart performs over the remainder of the season and just how high he can lift his rating from the current 81%.

Shots from Inside the Penalty Area


We have included goalkeepers that have faced at least 32 shots from inside the penalty area. Unsurprisingly, the general shape of this table is the same as the overall one with a few noticeable differences. Joe Hart has a more respectable 104% Save Efficiency rating for close range shots (this mirror’s last season’s pattern) and Arsenal’s Szczesny goes the other way down the table with what looks to be some poor shot stopping from shots taken inside the area.

Shots from outside the Penalty Area

The final table shows the shots that each keeper faced from outside the area.  Given the relatively few goals that the keepers have conceded from long range shots at this stage of the season these ratings are incredibly volatile and will change quite a lot as more goals are conceded.

So with that in mind, a large dollop of prudence is required when trying to undertake any analysis of these values.  They are provided for information purposes as much as anything else.

Joe Hart’s unfortunate penchant for being beaten from long range has seemed to continue into this new season.  He has conceded 3 goals from outside the penalty area, when our model suggests that he should have been beaten on only one occasion.  It does appear that Hart has an issue with saving long range shots; this pattern has emerged from this data, the piece I looked at on Monday as well as this article by Paul Riley.  Generally, I’m not a fan of long range shooting, but if I was advising any of Man City’s opposition I certainly wouldn’t be discouraging them from trying their luck from long range a little more often than would ordinarily be good for them.

At the top of the table, Szczesny has done really well in producing a mirror image of Hart’s numbers – he conceded just 1 goal when he “should have” conceded 3, whilst two other London based keepers, Cech and Lloris, are yet to be defeated from shots outside the area.

It’s worth noting that Szczesny’s ExpG2 value for shots from outside the area is significantly higher than any of the other keepers in the league.  This is due to the fact that Arsenal have been excellent at forcing teams to shoot from long ranges. Here is the Shots Chart for shots conceded by Arsenal this season:


ArsenalShots

The Small Print

For those not familiar with my work, perhaps a brief introduction to me may help manage readers’ expectations.

I see myself primarily as a sports bettor and the articles that I write here on Statsbomb are only possible thanks to the huge amount of data that I have collated and analysed for betting purposes.  If I didn’t bet then I’m quite sure that I wouldn’t have spent the time required to collect the necessary data.

So the plus side is that my articles exist as a by-product of my football betting.  The downside is that I always need to be mindful of my betting edge.  This inevitably means that I can’t get into specifics as to how our models work or what’s taken into account in their calculation.   Sorry, but that's the deal I made with myself.

Advanced NBA Stats Basics

Now is a great time to be a supporter of basketball analytics. The ‘advanced stats’ approach has been creeping into front offices, with ESPN’s John Hollinger getting hired by the Grizzlies as a vice president, forward-thinking Masai Ujiri getting named executive of the year and earning a big pay bump from the Raptors, and long-admired Houston Rockets GM Daryl Morey has had his approach vindicated when it landed his team James Harden and that other dude whose name I forget. [Dwight something? – Ed]

But, as any intro-level college class or 1950s instruction film would ask: what does ‘advanced stats’ or ‘analytics’ mean?

It’s more than just watching games, knowing the points per game of Kobe Bryant, and yelling to the next cubicle that your team’s rookie is “completely unstoppable.” At its most basic, it’s about using stats that explain what we want them to explain, rather than the traditional ones that’ve been used since people first saw a tall guy and went “wow, that guy is good at basketball.” And that starts with the complete destruction of all “per game” statistics.

The basic unit of a basketball game is the possession. Each team gets the same amount of possessions per game (plus or minus a small number due to who uses the last possession in a quarter), and the team wins if they use them more efficiently (ie, more points) than their opponent. Thus, when looking at a bunch of games from a team, what matters is not how many points they scored per game, but how many they scored and allowed per possession. To make the numbers easier to look at, this is usually stated as per 100 possessions, since that’s roughly the number in an average game. Why does this matter in the real world? Because it lets us look at how good an offense actually was, rather than having it affected by how many possessions there were in a game. Running up and down the court doesn’t make your offense necessarily good, and slowing things down to a crawl doesn’t make it necessarily bad, and our stats should reflect this.

For example, this past season, the league’s best offense was the Thunder, with their 112.4 points scored per 100 possessions (also called offensive rating or ORTG) barely edging out Miami’s 112.3. This matches much better with what we can see than if we had used points per game, where the Nuggets had the most with 106.1, and Houston close behind with 106.0. Those were offenses that, while very good, were also the top two in possessions per game (also called pace), at 96.1 for Houston and 95.1 for Denver. The per-game statistics would punish Miami, who played at the eighth-slowest speed, despite their excellent offense.

Similarly for defense, both points allowed per game and per possession (defensive rating, or DRTG) show that Indiana and Memphis were the best on that side of the ball. But DRTG reveals the uptempo Spurs were the third-best there, whereas the snail’s-pace Nets, sixth in points allowed per game, were actually below average in DRTG.

These differences might seem like a whole lot of effort for some minor movement around meaningless rankings, but they’re important: the same logic that applies to teams applies to individual players, and here’s where the shocking revelations come pouring through. By looking at per possession stats for points, for example, we can see who’s truly unstoppable and who is entirely stoppable, but just taking tons of shots.

Some stats should be immediately adopted by everyone, whether they’re the biggest cheerleaders for advanced stats on the planet or a basketball insider stick-in-the-mud who thinks the game died with the retirement of Bill Russell. One of these is True Shooting % (TS%). Instead of the absolutely useless FG% that cares not whether a player was shooting from two, three, or how often they got to the line, TS% is strictly the points a player generates per shot, no matter how they got them. A player that takes three shots and gets three points off of them has a TS% of .500, regardless of whether they took three three-pointers and made one of them, or missed a shot, drunked, then went ½ from the line. Since it doesn’t care how a player got their points, it’s a stat that we can apply equally to Steve Novak, Tyson Chandler, and Monta Ellis. (One of these players had a terrible TS%. Guess which!)

There are a lot of other stats that are percentage-based replacements of their conventional counterparts, which makes evaluating starters against bench players a lot easier. Offensive and defensive rebounding percentage are the percentage of available rebounds that team or player got; assist percentage is the percentage of teammates’ shots the player in question assisted on; steal%, block%, and turnover% are fairly easy to figure out.

(By the way, whoever saw offensive and defensive rebounds, thought “well, those are pretty much the same,” and then put them in one column, deserves whatever death he has surely already suffered. They do totally different things: offensive rebounds give the team an entire new play, and are rare relative to defensive rebounds, which a team would get anyway most of the time.)

Reevaluation of What Matters

You might be asking: so what, stats man? Per possession stats are a replacement for per game ones, but how could that possibly be a whole new way of thinking about the game?

Well, once we start looking at teams and player on that per-possession basis… doesn’t the same thing apply to individual in-game decisions? Since we want to maximize our points per possession and minimize our opponents’, doesn’t everything have a per possession value?

sergeibaka

It’s led to a reprioritizing of shots. The best shot, obviously, is the dunk: instant two points. Hard to beat that. After that are free throws. They’re not just to bail someone out when they miss a shot; since the league average was 75.3% at the line, getting fouled while shooting has a base rate of 1.5PPP. That is worth crafting strategy over. The best offenses are ones that draw a lot of fouls, and the best defenses (contrary to the smashmouth, old-school “no layups” philosophy) see fouling as something to be avoided at all costs. Not because of “foul trouble,” but because it’s just a terrible way to end a possession for a defense. A shooter only has to hit 56.3% of free throws before sending them to the foul line every play would result in the league’s best offense.

After free throws in the hierarchy are three-point shots. Specifically, the corner three, which has come to symbolize all that Stats Nerds stand for: a seemingly insignificant differentiation, a high-efficiency shot taken by oft-overlooked players, and a smart point on the risk-reward spectrum. Analysis by 82games shows them to produce an incredible 1.18PPP, which makes them worth building an offense around. The Spurs, who have been The Smartest Team in Basketball for quite a long time, have done so.

After that come straight-ahead threes, then wing threes, and after that… the dreaded Midrange Shot. Surprisingly, shots that would seem “easier” just outside the paint are not. Everything outside the paint but within the three point line is almost equally bad, and shots that come from there as the result of designed plays are becoming less and less frequent (though they can still be seen in the horrifically boring old-school East coast teams like the Celtics, Bulls, and Pacers, which are not coincidentally not good offensive teams). Great offenses like the aforementioned Rockets and Nuggets were able to essentially ignore that entire area of the court from a shoot perspective.

Almost everything I’ve said about stats on a per-play and per-player basis has been about offense: how good a player is at shooting, where they take their shots, how good they are at assisting and grabbing offensive rebounds. The sad fact is that defensive stats are way behind offensive ones. There is no easily-calculated equivalent to TS%. Steals and blocks, analysts have known for years, are overrated as box score stats, since a player can get a stop by forcing a missed shot, or a bad pass, or taking a charge, or even just making the player break the play to pass out desperately.

Synergy Sports has a rather brute-force solution to this: they analyzed every single play for play type, offensive players and defenders, as well as numerous other things, and gave the world offensive and defensive per-possession numbers for every team and player. This still has some weaknesses when it comes to defense, because it’s so fundamentally team-oriented, but it’s better than looking at who blocked the most shots and calling them the league’s best defender.

A similarly brute-force, but extremely useful, tool is looking at the +/- numbers for how the team did with that player on and off the court. This has more cautions than almost any other “advanced” statistic, because it can be subject to so many factors beyond the player’s control: who they played with and against, most obviously, but also issues of sample size and straightforward variance. Sometimes you’re playing against Nate Robinson and he hits five threes in a row. It happens. If you don’t see the court much, that’ll affect your +/- in a big way even if you did everything perfectly. That being said, for players that are in the regular rotation, it’s an invaluable tool for doing some rough fact-checking: if a broadcaster says Kosta Koufos was secretly a fabulous, I’ll check his last year with the Nuggets and see that, since the Nuggets defense was three points better in DRTG with him out there with a sample of almost 2000 minutes both on and off, they might really be onto something. If they say the same thing about JaVale McGee (“look at all those blocks!”), I’ll see that the team was two points worse in DRTG and dismiss it.

What I love so much about basketball statistics is how, despite these enormous amounts of fascinating and useful data, there is still so much left to be discovered. Advanced stats have not “solved” basketball; they have not definitively made a ranking of the best or worst players of this or any other era; and anyone making far-reaching and specific declarations about certain teams based on Their Statistical Model is probably at least slightly full of shit. But still, every year we learn a little more about the statistical rules underlying the game, and now’s a great time to be a stats-minded basketball fan.

Before I go, a few quick winners and losers from this analytic era of basketball: Winners:

  • Anyone that can shoot a three-pointer at an elite rate. Steve Kerr was a one-of-a-kind specialist once upon a time; now a team is thought of as incomplete without someone taking that role. (Examples: Steve Novak, Ersan Ilyasova, roughly half the Spurs roster.)
  • The big man equivalent of the above: the guy who doesn’t use an above-average amount of his team’s possessions, but makes the shots dunks he does take. (Tyson Chandler, DeAndre Jordan, Serge Ibaka.)
  • Offensive rebounders. These are incredibly offensively valuable, and roughly one-third as common as the defensive rebounds that go in the same column. (Reggie Evans, Zach Randolph, KENNETH FARIED.)
  • Anyone that provides good defense without getting a lot of blocks or steals. Old stats would be completely blind to who was a useless seven-footer taking up roster space, and who is the invaluable anchor of a defense. (Tony Allen, Andre Iguodala, Marc Gasol.)
  • The foul-drawing machines, who might have a lower FG% than their peers, but make up for it with constant trips to the line. (This is basically a list of superstars, but James Harden stands out.)
  • And now a moment for the non-specialists: those players who excel in something that’s often overlooked for their position, like rebounding guards or big men who can really pass. (Kyle Lowry and Russell Westbrook for their rebounding, either of the Gasols and Blake Griffin for their passing.)

Losers:

  • The high-usage, low-efficiency gunner. (Examples are almost too easy to find: Monta Ellis, DeMarcus Cousins, Rudy Gay, Michael Beasley… notice how they’re either highly paid, high draft picks, or both?)
  • Overlapping with the above: the back-to-the basket big who takes shots from there rather than passing out. This is basically just Al Jefferson now, but there’s a good reason they’ve gone away.
  • Big men who get a lot of blocks, at the expense of playing good defense. (JaVale McGee, DeAndre Jordan, who gets to be both a winner and loser for different reasons.)
  • One-way scorers that the team has to go outside of their way to hide on defense. (Pretty much the same list as the gunners above.)
  • Midrange specialists, especially big men, who live at that god-forsaken area between the three point line and the paint. (Carlos Boozer, and anyone a broadcaster over 50 refers to as “fundamentally strong.”)

Hopefully, this introduction to basketball analytics shed some light on a nebulous concept. Keep in mind that, much like a political philosophy, basketball analytics are not a monolith. There can be extreme disagreement among people in this community, especially when two stats-based models clash or provide different causes for the same outcome. I’m sure that someone could accept all of my premises and reject all my conclusions as complete trash.

-Jesse Mason

What Does It Take To Qualify For the Champions League?

One of the things I enjoy doing is building statistical profiles for football labels. By labels, I mean things like “What do AVB’s teams look like?” or “What performance in certain metrics is likely to get a team relegated?” Today I want to do that for teams that qualified for the Champions League across the big European leagues.  At the end, I’m also going to drop some league-adjusted team rankings for all the Euro leagues I have data for this year, which may be of interest for those of you looking to place wagers on the Champions League in the next couple of days. Or might just be too ridiculous to take seriously. Don't blame me... blame the math. Or the meth. One of those. Champions League Stats As mentioned above, one of the things I wanted to do was look at how previous teams that qualified for the Champions League performed in certain metrics. Unfortunately, my detailed stats database isn’t very deep outside of the last twelve months or so, but we do have a few decent predictive metrics to investigate including Passing%, Possession, and Shot Dominance. For those who are unfamiliar with Shot Dominance, it’s a way of looking at the struggle to take more shots than your opponents. If a team consistently shoots more often than their opponents, they should end up doing well in the league table. If a team takes exactly as many shots as their opponents, they will have a ShDom value of 1. If they take twice as many shots as average opponents, they will have a ShDom value of 2, if they take half as many, the value will be .5. Since we are only looking at CL teams today, you generally expect that ShDom values to be above 1. Anyway, I grabbed information from as far back as WhoScored had data (Season End 2010, so 4 years from the Big 5 Euro leagues), and then plugged the Excel spreadsheet into Tableau to produce this. The numbers alongside the team name are passing percentages, the colors represent the various leagues, and the axes are shot dominance and possession.  Teams in the bottom left have comparatively poor shot dominance and low possession values. Teams in the top right have really good shot dominance and possession numbers. As you probably noticed, Barcelona have some extreme outliers. Shot Dominance of about 1.4 seems to be the halfway point for CL teams, and above there teams are breaking into elite territory (usually on pace for the CL final 8 or so). Anyway, I don’t have much more to say about this now, but I thought the visualization was pretty interesting overall. Euro Rankings – Oct 22, 2013 As most of you who read the site know, we’ve been producing rankings for various leagues across Europe, based on my predictive model. It occurred to me that it could also be interesting to lump all the teams we are tracking together, and get sort of a Big 6 ranking (since that’s all the leagues I have data for right now). However… Not all leagues are created equal. Eredivisie is not remotely the same quality as the English Premier League. Thus I needed to take the model coefficients and adjust them based on league. If an elite team faces lower quality opponents, they will produce better stats. If your league is solely populated by crappy teams with a few powerhouses on top, those teams will dominate. However, if even those “lesser” teams are producing good players regularly… what does that mean? Here are the adjustment values I finally ended up with. EPL: 1.08 Bundesliga: 1 LaLiga: .95 SerieA: .95 French: .85 Eredivisie: .8 Quibble with these all you want – they are less science and more art. The Premier League is insanely deep this year, and they have used the money their TV deal is raking in to buy more and more talent from around the world. I wouldn’t have ranked it this highly last season, but there are just a crazy number of good teams floating around this year. La Liga has been marked down this season due to the exodus of talent from the second tier teams. Serie A has been marked up because they are deeper and better than in recent seasons, and French and the Dutch league are trailing the rest of Europe in depth of quality by some distance. Realizing that some of you might not like my adjustments, I have also included the raw rank as a column in the graphic below. statsbomb_euro_wide_rankings_oct_22 Dortmund are playing the most statistically dominant football in Europe by a surprising margin. That said, Bayern aren't that far behind. Pity all the rest of the teams in Germany, because once again these two clubs are juggernauts. Barcelona are mashing their league again this season, and despite some troubles away, Manchester City look like the top team in England so far. Then comes a team that isn’t even qualified for the Champions League in Roma. The stuff Rudi Garcia has them doing is special on both ends of the pitch. They aren’t super deep, but they should end up competing for the Serie A title right until the end. After Roma, you have Chelsea (still learning Mourinho’s system), Madrid (who got a big bump after an utterly dominant performance against Malaga this weekend), and another non-CL team in Tottenham.  Everton round out the Euro-wide Adjusted Top 10. … I’m sorry, can you repeat that? Everton. Euro-wide. Top 10. And on that note, we’re finished!  Good night, everybody! Enjoy the Champions League!           All I can say is that it’s still early in the season and maaaaybe the EPL quality bump should perhaps be a little smaller. They rank 15th in the non-league adjusted metric, which is still damned high. They are also shockingly good on the defensive end for a Roberto Martinez team. I am sooooo going to end up eating crow re: their crazy loan deals, aren’t I? Conclusion I don’t know what to think about this Euro-wide stuff. The predictive model is built to evaluate teams against each other inside the league, but it successfully would have predicted the final 4 of the Champions League last year, especially once Juve got paired against Bayern. I’ll try and track this once a month from here out and see what we end up with at the end of the season. Whatever the case, these are just out here because I had a CL piece I wanted to write and figured I might as well use all these data for something as well. Thanks for listening, --TK  

Introducing MiPMoP (Again)

Introduction MiPMoP stands for Minutes in Possession/Minutes out of Possession, and it’s something I started keeping track of last year to help contextualize stats by adjusting them for how long a team was in possession. Basically it’s a way to look at how a team’s possession impacts their stats. Generally I use it to look at (and refer to) shooting numbers, but there’s no reason it couldn’t be applied to other stats as well. Let’s take a quick example. Teams A and B both shoot the ball 10 times per game. Without using MiPMoP, they both average 9 minutes per shot. Now let’s say that Team A averages 50% possession while team B averages 60%.* Team A’s MiP is 4.5, while Team B’s is 5.4 (for another more completely drawn example you can check out my old site). Clearly the two teams play differently, looking at their shooting statistics through the lens of possession helps show that. The below table is the MiPMoP for the Premier League for the first seven games (MoP is just like MiP but based on shots conceded during time without the ball). To clear up (or cause) confusion, I’ve left the units as decimals of minutes, rather than converting to seconds. We’re dealing with fine lines here, and rounding to the nearest second seemed less precise. All the data is compiled from Opta powered Whoscored.com [table id=32 /] A Random Collection of MiPMoP Thoughts Bad Teams I’m generally pretty hesitant to make any blanket statements about statistics, but here’s one. If a team has under 50% possession, and higher MiP than MoP you are looking at a bad team. Basically, the team doesn’t have the ball, and they shoot more slowly in possession than their opponent, they are in serious trouble. Those stats may lineup for fewer teams than you think. This year so far only the three newly promoted teams, Fulham, and Norwich fit the bill. That seems to pick up all the major relegation battle candidates, with the exception of Sunderland, who have a surprisingly healthy looking slash line of 43/2.91/3.78. Sunderland are dire, but the reasons for it, apparently, don’t have to do with the frequency of shots taken and conceded. Fulham It’s difficult to describe just how awful Fulham are. No single other team in the top four leagues has managed to shoot only half as often in possession as their opponents, and that’s compounded by a pretty dire possession level. Clocking in at 45.7/4.96/2.48 makes them pretty much the laughingstock of Europe’s elite leagues. In the Premier League they’ve managed to be both the slowest to shoot in possession and the fastest to concede out of possession. Conceptually you might expect that from a team that dominated the ball, and basically played defense by playing keep away. It’s pretty difficult to claim that’s your plan though with only 45.7 percent possession. Fulham are in big big trouble. Reverse Splits While shooting less frequently in possession than your opponents is unambiguously bad when a team has low possession, the situation is a lot less cut and dried when a team dominates the ball. Last year both Barcelona and Manchester United’s stats looked that way, but none of the other Champions League qualifiers across the top four leagues did. And in the Premier League, only Swansea and Wigan joined United in the reverse splits category. This year, at least so far, things are different. In addition to United, Swansea and Everton (where Wigan manager Roberto Martinez now resides), Arsenal, Liverpool, Southampton and Stoke all have reverse splits. It’s a trend that may not mean anything, but it’s certainly one worth keeping an eye as the season progresses, especially in light of the lower goal scoring numbers rolling in. It’s not all that hard to imagine a world where cagier managers focus on killing off games with a lead, skewing MiPs higher as they defend with the ball. Liverpool Liverpool’s line of 51.7/3.58/2.95 makes sense in light of what their early season has looked like, especially before the return of Luis Suarez. They just spent so much time absorbing pressure, without counterattacking that their line almost has to be reversed, and those numbers have certainly been skewed higher given the absurd amount of time they’ve spent winning by a single goal. With the return of Suarez, however, I’d expect those numbers to start changing very quickly, as Suarez is one of the most prolific shooters and creators in the game when up a goal. I’d expect a much lower MiP than MoP for them going forward. Those Portuguese Managers A lot has been made about how different Andre Villas Boas is from his mentor Jose Mourinho. And while that may be true, they both excel in very similar ways when looked at through the MiPMoP looking glass. AVB and Mourinho preside over two of the most dominant MiPMoP teams in Europe at the moment, both in attack and defense. The same was true last year (it just happens that Mourinho’s dominant side was Real Madrid). The very low MiP, very high MoP, majority position combination is an extremely rare one in Europe. Most good teams keep the ball, and are dominant at either shooting or preventing shots, but not both. Mourinho has clearly mastered it, and AVB seems to have as well, which puts them in a very small club (Jurgen Klopp and Antonio Conte also hang out there, but that’s about it). Conclusions Don’t draw too many. This is the first time I’ve tracked MiPMoP data in-season, and I expect the numbers to change a lot as the season progresses. They serve as more of a descriptor of how a team is playing stylistically than a predictor of how they will perform. But, it’s a particularly effective one-stop shop to get a basic picture of how teams look stylistically. If teams defend with the ball, it shows up here. If they emphasize counterattacking, it shows up here. Style is important, and it can be hard to reflect in numbers - this is a good way to start.   *A brief statistical note. The way Opta calculates possession is actually not based on time but based on the percentage of passes each team has played. So, using possession statistics to calculate how many minutes each team has had the ball is kind of a cheat. But, Opta has done a bunch of work showing that it’s a pretty darn good proxy for time, and I’m all for using the tools we have until improved ones come along. So, until we have a more accurate measurement of possession I’m using Opta’s, but it pays to be aware of its possible shortcomings.

Goalkeeper Save Ratings EPL 2012/13

During the Summer I cast my first analytical eye at Goalkeepers in a piece over at my old Statsbettor site, this article can be found here.  In that piece I analysed the saves made by Premier League goalkeepers during the 2012/13 season and I concluded that Julio Cesar from QPR was the best shot stopping keeper last season. Just about the only other person within the analytics community that cares about the poor old goalkeeper is Paul Riley, and he produced this excellent piece yesterday. As tends to be the difference in our styles, I am tackling the same subject in a slightly more quantitative way than Paul did yesterday, but I’ve no doubt that we’ll end up at almost the same place. All regular readers of my writing will know that Constantinos Chappas and I have developed a number of models that numerically  estimate the probability of a goal being scored.  We use Opta data served up by Squawka and / or StatsZone in order to estimate these probabilities.  As a result we do not have any data on defensive or goalkeeper positioning, but our models take into account whatever “on the ball” information is significant in determining the probability of a goal being scored. ExpG2 In an article published last month I introduced a new metric that Constantinos and I calculated, ExpG2.  ExpG2 tells us the probability of a shot being scored AFTER the shot has been struck. In short, ExpG2 is arrived at by looking at where and how the shot was taken and where it was eventually aimed for.  The further away from the centre of the goal the shot is placed the higher the ExpG2 value. A blocked shot or a shot off target will always have an ExpG2 of zero because once these shots have been struck there is a 0% probability of them resulting directly in a goal.  A close range shot that is aimed towards the corners will have an ExpG2 value approaching  1.00. According to my records there were 10,562 shots in last season’s EPL and 97 of them had an ExpG2 value of >0.90 (ie they had a greater than 90% chance of being scored).  89 of them were actually converted which suggests that the ExpG2 values are pretty well calibrated. Rating Goalkeeper’s Saving Performances After we created the ExpG2 values, their potential to rate the saves (or lack thereof) by goalkeepers became obvious to me.  In simple terms, we now have a numerical value of how difficult each save was to make. At this point I must acknowledge once more that these values do not take into account defensive pressure.  However, the work that has gone into them and the detail included in their calculation means that I am not aware of any other goalkeeper save rating system that is more detailed. The table below includes all Premier League goalkeepers that faced more than 100 shots last season.  It’s not important to know how many of the +100 shots were on target as we compare actual goals conceded to the Expected number conceded. [table id=33 /] ExpG2 is the amount of goals that our model expected the goalkeepers to concede based on the type of shot and shot placement Goals are the number of goals conceded by the respective GKs Save Efficiency is (ExpG2  / Goals), with a higher number signifying less goals than expected were conceded The first thing to note is that the 7 keepers at the top of the list are the same 7 that appeared atop my ranking table in my previous look at this topic, even though my method of evaluation was slightly different.  So that’s a good start. The more exact data that has been used in this exercise sees David De Gea achieve the best shot stopping performances last season.  The shots he faced suggested that he should have conceded 8.6 goals more than he actually did; this along with United’s ruthless attacking efficiency last season would have been major reasons that help explain how Fergie could succeed where David Moyes is so far failing. You’ve got to feel for Gerhard Tremmel, I’ve him in second place in terms of saves in the Premier League last season, yet he can’t even get a game. Mignolet, Julio Cesar and Begovic where the only other goalkeepers to have a Save Efficiency of more than 125%.  I haven’t yet ran the current season’s saves through ExpG2 (I intend to do this in the coming days) but it certainly feels that Mignolet has brought his super saving performances to Liverpool this season. At the other end of the table you can see that Wigan struggled with whichever keeper they picked (as did Southampton).  Looking at the values returned by the two Man United keepers it is difficult to think that at one stage last season Lindegaard appeared to be the first choice custodian at Old Trafford.  Unfortunately for him, his and De Gea’s season went in entirely different directions. In North London it is clear to see why Spurs decided to bring in Hugo Lloris to replace the aging (and ailing) Brad Friedel.  Although at less than 100% Save Eff the French man didn’t return sparkling numbers himself. It strikes me as unusual to see the England GK (Joe Hart) having a worse than average record of saving shots last season, his Save Eff was just 95%. Shots From Inside the Penalty Area To give us a little more detail we can divide the shots faced between those coming from inside and from outside the penalty area.  This time we’ll concentrate on shots that were taken from inside the Penalty Area.  Again, the table below includes all goalkeepers that faced more than 100 shots from inside the area. [table id=34 /] For shots faced from inside the penalty area De Gea appears in just 4th position.  Three keepers (Begovic, Cesar and Mignolet) returned almost identical performances at the top of the rankings with Save Eff values of 127%. Joe Hart noticeably climbs the rankings on this measure as he conceded 2.5 less goals from close in shots than would have been expected.  Hart’s strength appears to be stopping the closer in shots (perhaps due to good reflexes). Reina underperformed badly when faced with shots from inside the area.  The information available to me suggests that he allowed 2 more goals that he should have done.  In both of these tables it can be seen that, from a shot stopping point of view, the replacement of Reina with Mignolet was a clear upgrade by Liverpool. Shots From Outside the Penalty Area The table below shows all goalkeepers that faced more than 50 shots from outside the penalty area last season. [table id=35 /] Due to the volatility implicit with long range shooting there is a much greater spread of performances than we seen with the inside penalty area saves.  As a result of this we perhaps need to be careful with any conclusions that we draw from this dataset as a keeper allowing or stopping just 1 additional goal could have quite an influence on the values in this table. Alex McCarthy of Reading did really well when dealing with long range shots as he only conceded 1 goal instead of the 4 that the shots aimed at him would have suggested. Tremmel, Lloris and De Gea all conceded at rates of half (or less) that would have been expected. But let’s cast our eyes right to the foot of this table.  Joe Hart is in penultimate place in terms Premier League goalkeepers saving long range shots. Last season he conceded 9 goals from these shots, when our model would have said that he should have allowed 5 of those efforts to result in a score.  This finding agrees with what Paul Riley concluded in his piece from yesterday, Joe Hart had a problem last season with stopping long range efforts.  With him being above average in terms of stopping closer shots perhaps his footwork or anticipation lets him done on these long range efforts. To put Hart’s (lack of) performance in context, Alex McCarthy conceded 1 goal and Joe Hart 9 last season from shots outside the area when all quantitative data tells us that Hart should have just conceded one more goal.  That’s quite the difference…….. Repeatability Like all the analytical work I perform I ask myself whether I’m reporting on something that just happened or whether these values are repeatable and thus they can be used in terms of picking teams or lining up transfer targets. As we are just in the infancy of soccer analytics I can’t answer that question right now.  But with time, and the ability to run this type of analysis over previous seasons I hope to be in a position to determine whether there is any repeatable material difference in the ability of Premier league goalkeepers to save the efforts headed their way.

Saturday Morning Ramble: Notes & Previews

Notes

Januzaj has signed a new 5 year contract at Man United. The fact that the player re-upped with Man United was never in doubt, but by God I bet Man United overpaid by a mile for a player who, so far, know little about. He will take time to develop, there will be good games and bad games, some patience may be required. United have done well to avoid another Pogba situation. Andros Townsend has also re-upped his contract for another 4 years. It's quite the career turnaround for a player who always had the talent but needed multiple loan spells in order to round out his game. The smoothing of those raw edges to his game is not yet complete, as is evident by his willingness to shoot from everywhere. A little more shot discipline, and a realization that he now has team-mates that are plenty capable of creating chances too, should, hopefully, lead to an eradication of his shooting from piss poor locations. Competition for wide places at Tottenham is intense, that can only be a good thing for player and team. Bale - badly herniated disk  and all, according to Marca - will play some part against Malaga this afternoon. More importantly, this means Bale will be fit to play against Barcelona in a weeks time. Showdown. Great Games between Newcastle and Liverpool. The Joy Of Six. Kompany Is Injured Usually the absence of captain marvel from Man City's team sparks panic and defensive chaos.  But, City coped pretty well in Kompany's absence in their last PL outing, which was, like, 91 weeks ago. Or so it seemed. The issue I have with a Nastasic/Lescott axis has nothing to do with the young Serbian, but all to do with Lescott. Specifically, can Lescott play effectively away from home without getting exposed too often? Mancini didn't seem to think so: Puc_mc_defenders_medium Lescott played ~1070 minutes at home and just ~500 minutes away from home. Sheltered minutes. A Song. The Premier League Is Back No more Internationals. Please. I know there must be a few International Friendly weeks coming up soon, but I don't want to upset myself by discovering when said weeks actually are.  

Previews

  Newcastle v Liverpool Newcastle away might be a nice little test for Liverpool. Newcastle are a pretty good shots team and Liverpool are, well, average. Score effects play a part in this, though. Liverpool are carrying a very good save% (opposition goals to shots on target) at 86.1% or 94% better than league average. Newcastle save% is at the other end of the spectrum at 60%. I find it hard to believe Liverpool can continue to spend an average of 59 minutes per game in a winning position, that number has to regress at some point. I also think Newcastle impressive raw shots numbers will fall away soon enough. Let's call this the regression derby. Newcastle double chance is even money. Arsenal v Norwich Arsenal, at home, against sub-par shots opposition? Arsenal, moving closer to full health? Add those two things together and this should be a routine home win. Norwich aren't a bad possession team at 48.9%, their PDO is a shade under league average, but The Canaries are being butchered by the TSR and SoTR count, with both of Norwich's numbers under 40%. I'm trying to think of ways Norwich can win at The Emirates, but I don't have all day to think of those reasons, and it may take all day just come up with a single one. Except for sheer luck or the fear of Dortmund at home on Tuesday! Chelsea v Cardiff Cardiff have faced some pretty tough quality of opposition so far this season and this skews their shots number to hell. Cardiff have a Total Shots +/- of -52 and a shots on target +/- of -28. Both of those numbers will look worse after today and nor will Cardiff's point total look any better. All of Chelsea's underlying numbers look pretty darn good, except for their scoring% which sits at 24.39%. Today could be the day to improve that scoring%. Could be as tough a day for Cardiff as Chelsea want to make it. Then again, an away trip at Schalke looms for Chelsea on Tuesday, so rotation may be a thing. Everton v Hull Let's take Hull first: Hull are in the bottom four teams in TSR, SoTR, Unblocked Shots ratio and Final Third Passing% - which is really bad. Things Hull are good at: PDO at 105 and shots on target rating at 103, which is either efficient or lucky, just depends on your outlook, really. Everton are the fourth best shots on target team in the PL, have Gareth Barry available for selection again and have enough guile and talent to cause Hull serious problems. Oh, and Robbie Brady, Hull's most influential shots player (involved in 31% of all Hull shots while on the field of play), is out with a hernia op. Everton are 1.50 for the flat win. Stoke v West Brom I'll struggle to write a hundred words for this. Both teams's shots profiles in terms of TSR and efficiency (SoT rating) are awfully similar. West Brom are riding a PDO of 115, Stoke a PDO of 94. Regression to rear it's beautiful head? Man United v Southampton Apparently United have Carrick, Fellaini and Cleverly out injured. That means two of Jones, Anderson, Giggs or Bryan Robson will start. I'm not sure that will be good enough against a Southampton side that have impressed so far. 2013/14 Man United don't really look like 2012/13 Man united, at least not by the numbers. And that may be a problem when facing a Southampton team who have faced some pretty tough competition so far and come out of the other side with some mighty impressive shots numbers (+13) and shots on target numbers (+10). Southampton's save% is the real story though: 90.48% through the first seven games is 184% above league average. There is either some mighty impressive things taking place in Southampton's defensive scheme or that number is going to regress hard at some point. We just don't know if that point will be today. Southampton double chance is 7/5, then again players like Rooney & RvP exist and that may just be enough for United. Fascinating game, though. Swansea v Sunderland Sunderland have a new manager, so we need to wait to see how or if he can change this team. Swansea are aplus shots and shots on target team who also are pretty efficient at getting shots on target and preventing the opposition form doing likewise. Swansea PDO of 82.85 is the worst in the league, just behind Sunderland (83.3). Swansea are especially poor at converting their shots on target into goals, Sunderland are poor at preventing the opposition from preventing the opposition from doing the same. West Ham v Man City Do not trust Man City away from home until they prove they can be trusted. City come up against a West Ham team who are pretty darn good at restricting opposition shots on target through the first 7 games. City's strength? Managing to get a good percentage of their shots on target. City have the excellent underlying numbers and West Ham, save for their ability to restrict the opposition, don't have good numbers. Could well be a siege around West ham's box, with City being frustrated for long spells. A little biased here, but I think City may get a breakthrough eventually. The focus may then turn towards City's underperforming defensive unit, which will have to come good at some point. Man City's save% is the third worst in the league. Shirley it has to come good at some point?! Doesn't it.....