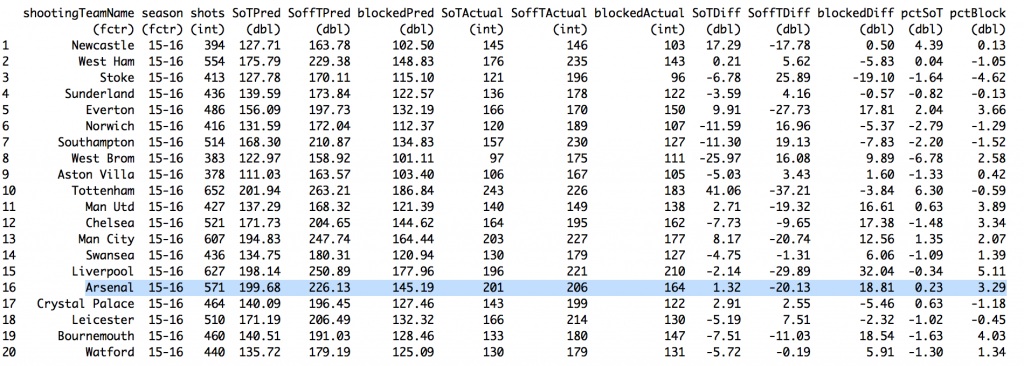
 There were two impetuses for this. The first was Arsenal. That's usually the case. It's a completely rational response to the frustration caused by watching a Wenger-managed team week after week. If you bury yourself deep enough in the individual trees of observation you'll totally miss the forest of ennui. The other option is to drink. If you go back and canvass last season's week-by-week EPL title predictions floating around the Twittersphere, you'll find that many of those models generally loved Arsenal almost up until the day when it was mathematically impossible for them to win the Premier League. But most of those models don't have any defensive information or, if they try to impute it, it's probably coming up short. Models that were largely expected-goals-based were probably loving Arsenal because they were probably over-estimating the probability Arsenal's shots were ending up as goals. And that's because, well, they were. That's an insightful tautology, huh? But at this point a bot could manage against Arsenal. Put 10 men behind the ball and defend while they try to walk the ball into the net for 70 minutes. Then, when they start pressing for a winner because the clock is winding down and they are getting frustrated, hit them on the counter 1. And it's my contention—possibly with an assist from confirmation bias—that no team sees a defense like that as consistently as Arsenal. A shot against a defense with four guys in the box has a higher probability of getting scored as a goal than a shot against a defensive with eight guys in the box. That's not a guess. Not all datasets lack defensive info. In another post on Statsbomb Dustin Ward started generating his own (scroll down to the subsection title 'Box Density'). It was crude, but still, it produced maybe the single most important result last season (that I saw anyway). He tracked Stuttgart's Bundesliga shots for and against by hand (seriously, that level of commitment is both laudable and baffling) and found that, on shots under 20 yards, just the difference between having 4 or fewer defenders vs. 5 or more defenders in the box caused a 1/3rd drop in the percentage of shots to score. If we assume that Arsenal are indeed consistently facing more defenders in the box more often, then their shots have a lower probability of being scored than a model built on entire league-seasons would predict. Not only that, but they would also get shots blocked at a higher rate. We can't really calculate the entirety of the former (that would be in the defensive info that we's missing), but we can capture a bit of it in the latter. To do that we build a three term model where we calculate the probability that a shot ends up 1) on target 2) off target or 3) blocked 2. This is roughly analogous to Three True Outcomes in baseball. If you're shooting in soccer you can't really control whether the keeper makes a save or not, all you can control is whether or not you get it on target (necessary but not sufficient for scoring)3. Here we're taking shot data and just re-slicing it in a way to model what number of shots 'should' get blocked (along with a couple of other things). But we're theorizing that is going to be wrong for Arsenal. They routinely encounter enough extra men packed in the box against them that they are going to see more of their shots blocked than a model lacking defensive info would predict.
![]()
And we're right (see the above). They did see more blocked shots. The model predicts Arsenal should have had 145.2 shots blocked whereas in actual game play they had 164, a difference of just under 19 (column names should be self-explanatory; 'Pred' is short for 'Predicted', 'pct' for 'percent', and 'Diff' for 'Difference'). That might be worth as many as 4 points on the table4. That's probably not enough of a difference to explain why the models were so wrong for so long. The other, more likely answer is that 38 games is just big enough for us to think our models are useful, but small enough for the massive amounts of deviance to remind us otherwise5. The other impetus for this piece was a tweet by James Yorke, which itself is actually just shot a map from Paul Riley.
Some Tottenham shot locations courtesy of the @footballfactman on target charts (Eriksen!)https://t.co/4x9sb7GTuJ pic.twitter.com/z6KJ5fy99B
— James Yorke (@jair1970) March 7, 2016
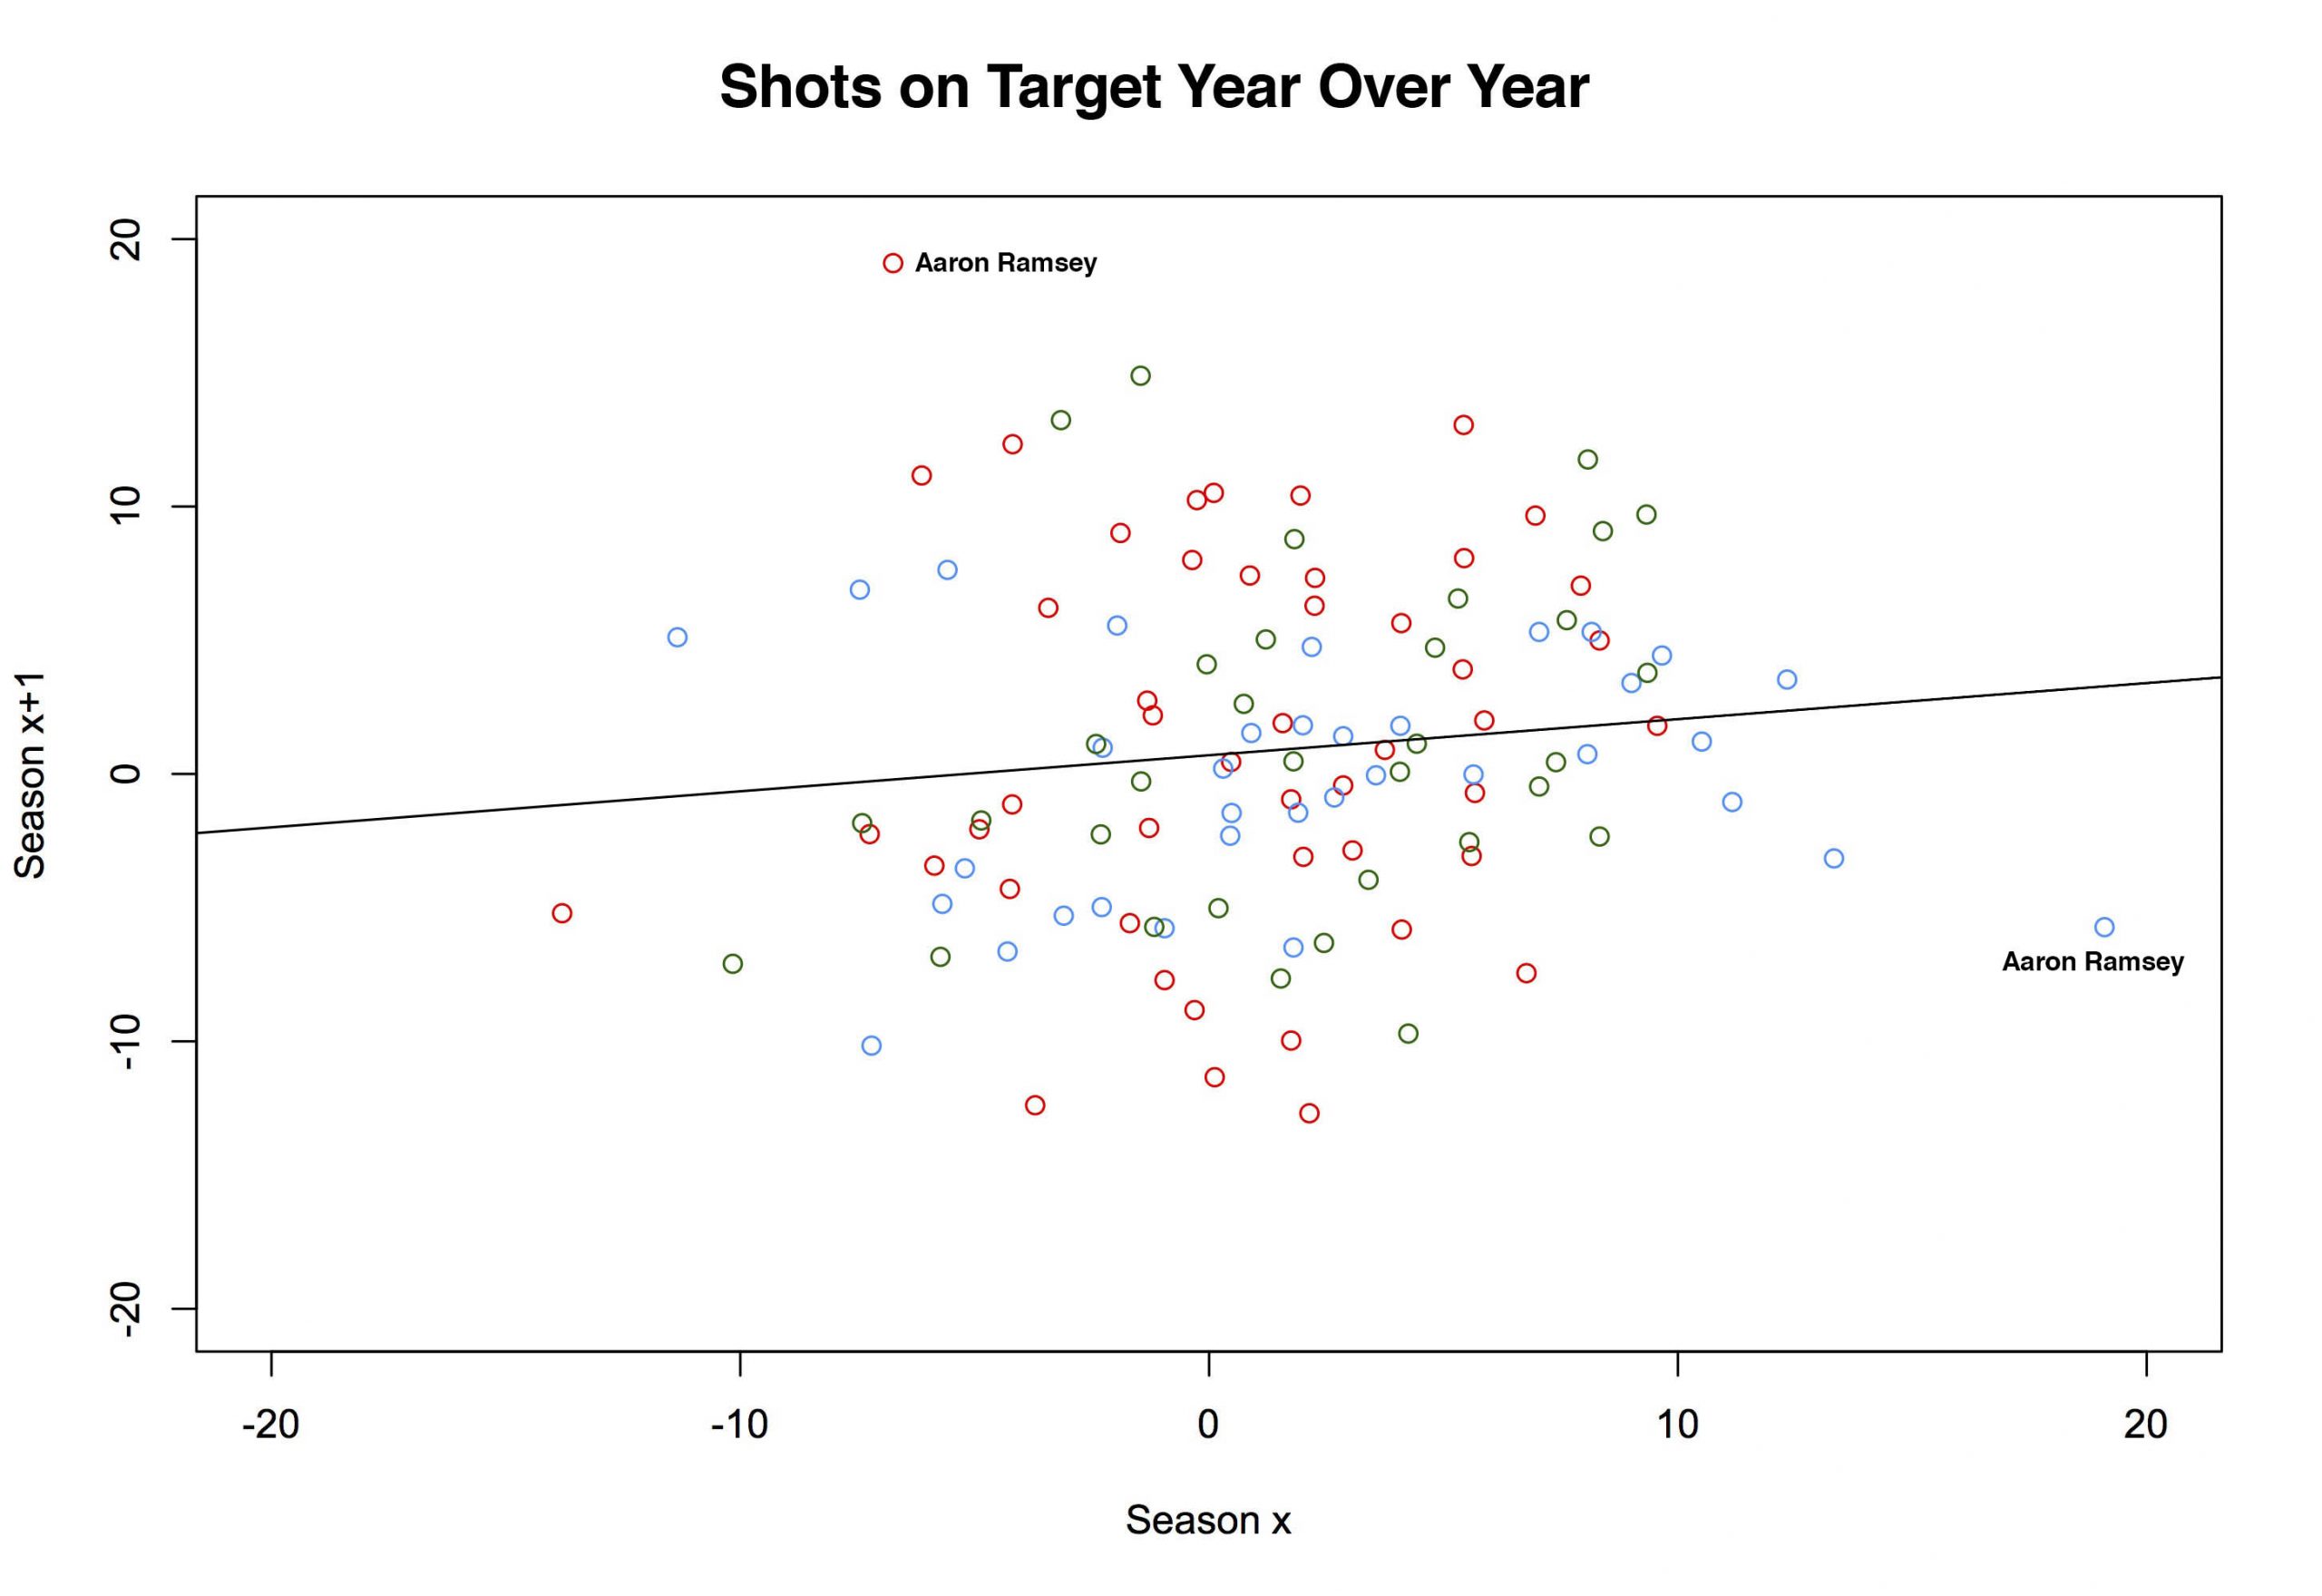
Look at that Eriksen map. All those shots on target from outside the box. That's insane, right? Well, it turns out Riley only uses shots on target, so that's all he's plotting. Assuming they take enough shots, anyone could look like they are lethal from distance. D'oh. Still, my kneejerk idiocy doesn't change the question: How often should shots from distance end up on target? 'Bad' shots should have a lower probability of ending up on target (if you don't believe that, watch Philippe Coutinho for, oh, at least a half or, better yet, rewatch England play Iceland). If a player takes lots of those shots, he'll end up with fewer on target than someone who takes the same number while parked inside the six. That Eriksen plot might still be ridiculous, depending on how many shots he has taken. And, by summing on individual players instead of teams, we can use the same model from above to examine just that. Turns out, it was pretty ridiculous. By the model, Eriksen should have put 27.77 of his 100 shots on target last season. He put 41 on target. As a percentage of total shots, he was second in the league only to Yannick Bolasie. The more important question is: Is that repeatable? To answer that, we sum over multiple seasons, then plot one season on the x-axis, and the subsequent season on the y-axis and we get the quasi-amorphous blob of a chart below6. The x-axis is the percentage of excess (or deficit) shots on target relative to the total for any given player. The y-axis is the same number in the following season. The colors are for the three different paired seasons (12-13 to 13-14 (red), 13-14 to 14-15 (blue), and 14-15 to 15-16 (green)). 
![]()
For example, the red-colored point sitting up near the top of the chart labelled "Aaron Ramsey"? That represents Aaron Ramsey. Clever, no? In the 2012-13 season, the model predicts that Ramsey should have put 15.1 of his 46 shots on target. In the real world, Ramsey only managed to get 12 of his shots on target7. So he was -3.1 away from the target, or -6.74% of the total (-3.1/46). The following season, we get a predicted SoT for Ramsey of 17.45. He put 27 out of 50 of them on target. His percent overage was 19.10. And with that, the half of Arsenal fans who thought Ramsey was horribly overrated were forced to admit they were wrong or at least forced to do some linguistic gymnastics to find ways to consistently criticize him. But there is that blue dot on the right side of the graph. It's also labeled 'Aaron Ramsey' and it also represents two seasons of his shooting. This time the x-axis is the same as the y value from the 13-14 season (above). Now our y-axis is 14-15 Aaron Ramsey. His predicted SoT was 20.6. His actual total was 17. One season later, he's gone back to being slightly negative and half of Arsenal's fan base subsequently reverted to being wrong about being wrong about Ramsey8. If we fit a line to the above plot (it's there already) we get a slope of .135. It's slightly positive, but that's mostly noise9. So there's little to support the idea that getting shots on target is a repeatable skill 10. Kind of. It turns out it might matter how we set this up. Again we plotted consecutive seasons. But of the four best player-seasons in our set, Eriksen actually has two of them (his 13-14 and 15-16 season). It just so happens that for the 14-15 season he went slightly negative. So, while on the whole, it looks like it's not repeatable—we do have 168 player pairs in our plot—that mightn't be true of everyone. Cesc Fabregas also has two good seasons as does Harry Kane. With only a couplathree seasons here, we might lack the data to saying anything more definitive than it doesn't look to be repeatable overall but it might be repeatable for a select few players11. That's probably not too reassuring to Tottenham fans wondering how many of those 'excess' 41 shots on target (see top chart) they can expect not to get next season. Sorry12. @bertinbertin 1 It also helps when your keeper has the game of his life, which seems to happen fortnightly against Arsenal. 2 For this I built a cross-validated multinomial model. The nice thing about multinomials is that you have a built-in way to quickly check you did everything right. All of the outcomes you specify in the model should sum to one. Right? If you say there are three things that can happen, then for each observation, those three individual probabilities need to add up to one. And hey, we didn't mess it up. Below is a screen of a few rows. All do indeed sum up to one. More importantly, hand auditing a few observations seems to check out (i.e. close-in non-headed shots have high probabilities of end up on target and low probabilities of being blocked). 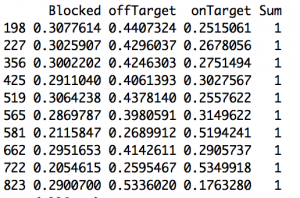 3 I'm still not sure about how to think about blocks in terms of whether it's in a shooter's control. Theoretically, an offensive player should be able to know whether he has a clear shot on target. If there are three bodies between you and the goal mouth, you are free to pass up that shot, knowing there is a very good chance it will be blocked. But by that logic you could also wait until you know you had the keeper beat before taking a shot. So then there would be four outcomes (block, on target, off target, goal). However, one of the things I'm trying to measure is blocks, so I have to have it in the model; the other two terms (on- off-target) are things within a player's control. It is admittedly not as tidy conceptually as I would like. Also, I stuck with the convention of classifying a shot that hit the post as off-target. Not entirely sure why traditionally it's done that way. Can't you hit the inside or underside of the post and have it carom in? That seems pretty on target. 4 If you want to assume that all of the excess blocked shots would have ended up on target—and that's by no means necessarily a good assumption—then we can ballpark that Arsenal missed out on about 4 points. Here's the no-modeling-skills-needed estimation for that. First, about 30% of SoT end up as goals, so if Arsenal missed about 19 SoT, that's around 6 goals. By the Soccer Pythagorean, you get about an extra 2/3rds of a point for each additional goal in goal difference. So an extra +6 GD is about 4 points. That's just enough to make a dent in Leicester's final 10-point margin but not enough to threaten. Maybe... depending when the points had been picked up, 'pressure' on Leicester before their relatively easy run might have changed the entire dynamic of the back end of the season. Moreover, when those 6 goals were scored (Southampton (H), Palace (H) off the top of my head) could theoretically be worth much more than 4 points. Clearly I'm still at the 'Bargaining' stage. I hope to have achieved 'Acceptance' by the start of next season. 5 It's worth pointing out that, even though that 18.81 for Arsenal looks pretty large, Chelsea, Manchester United, Liverpool, Bournemouth (really?), and Everton all had higher percentage of blocks above expected. I'd say those are generally attacking teams but, well, that's LVG's United. City was also non-trivially positive. 6 For the upper 'mistake' chart, I used a qualifying cutoff of 30 shots. For this expanded chart I used 40 shots. That's not based on anything other than 40 is just over 1 shot per game, which seemed like something you couldn't fluke into. 7 Incidentally, almost the entirety of his deficit can be attributed to blocks; he had about 3.5 excess blocked shots. 8 This season he had about 3 fewer blocked than predicted. He Zamora'd an excess of about 10% of his shots that season. Not good. 9 Residual deviance over null deviance here is 4518/4581. So we're basically doing little better than just the intercept, which, incidentally was just fractionally over zero. 10 Either that or there is something in defensive positional information we're missing that will help with prediction here. That's likely. The degree to which it will improve such a model, that would be a straight guess. Also, even if we limit it to people whose job it is to shoot (i.e forwards), it doesn't get a whole lot better. Across the data there are just three who posted plus-percentages in back-to-back seasons: Aguero, Suarez and Kane. I should also point out that I upped the minimum qualifier to 100 shots for that set. 11 I'm fairly confident I'll think of a better way to come up with something more definitive about 10 minutes after this posts. 12 Not sorry.




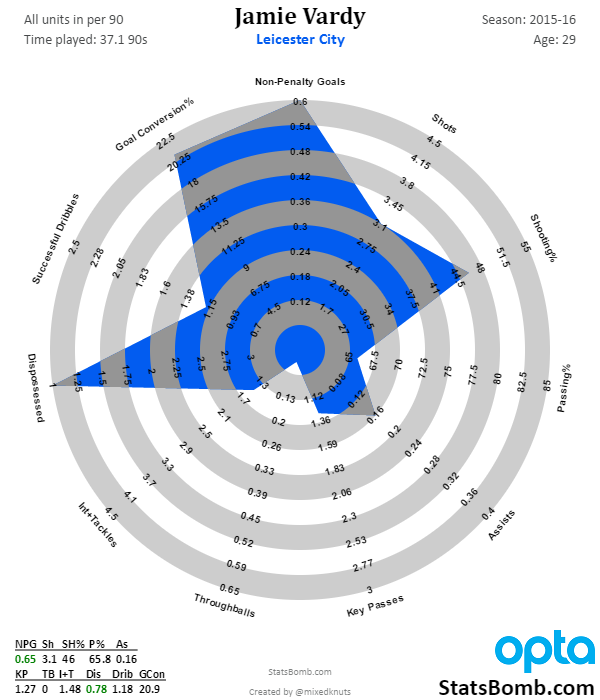
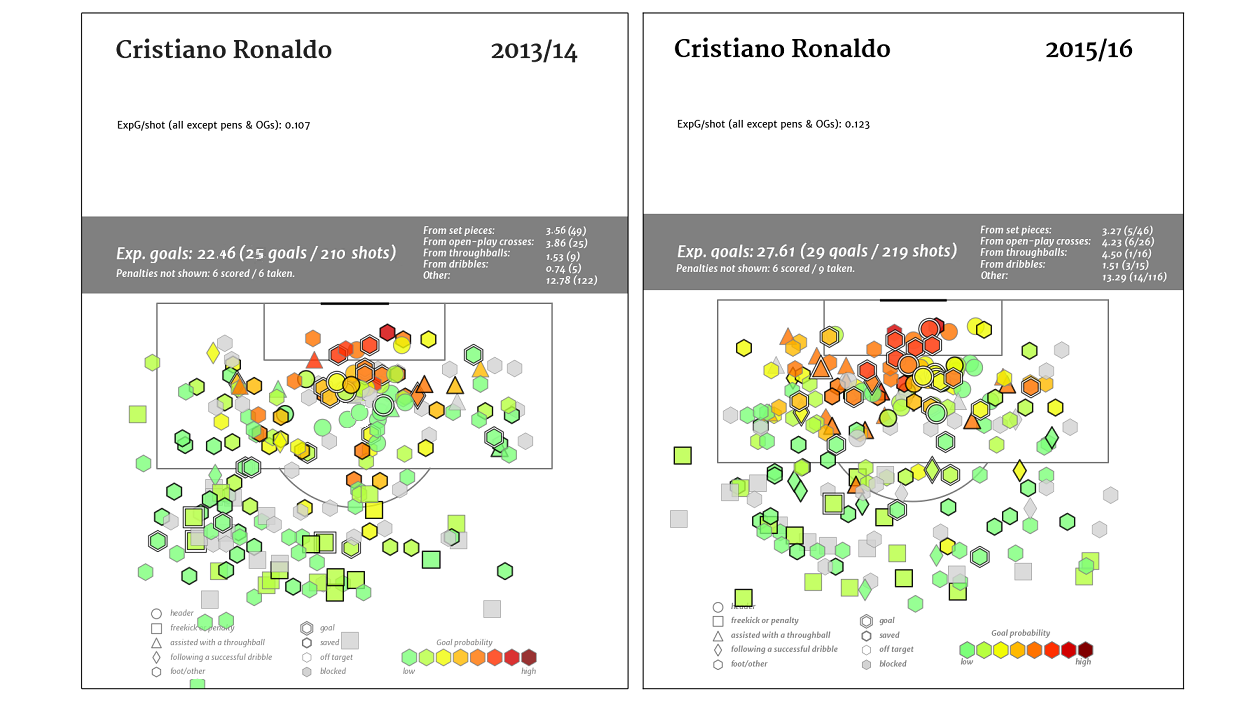
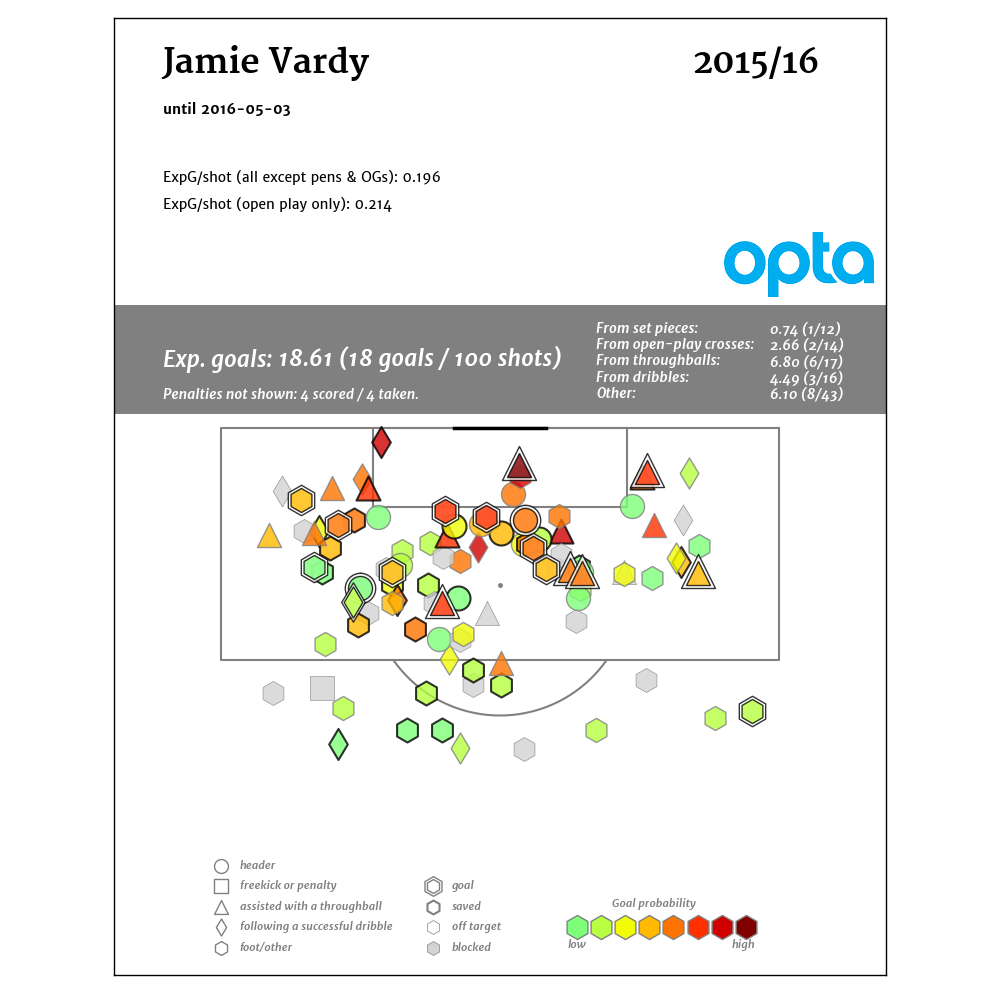 Obviously this is good. Good enough to help Leicester City’s cinderella squad win the Premier League. Vardy’s shot map might just be the best in the Premier League this past year, and the number of throughballs in the box is ridiculous. Esteemed Managing Editor James Yorke offered up the following alternative as his visualization of Vardy’s shot map
  17 shots off throughballs, 16 after completed dribbles – Vardy was getting a huge chance more than once a game. This by itself would be enough to bring scrutiny by a club in need of an elite striker, even with the age and personality concerns. Vardy’s expected goals per shot were exceptional, and he posted similar numbers in that respect in 14-15, though he played more of a hybrid role that season. However, there’s another element of Vardy's game that is massive for Arsenal. Vardy creates goals for teammates. If you can’t set up teammates for shots, you can’t play center forward for Arsenal under Arsene Wenger. Only an average passer across the rest of the pitch, Vardy keeps his head up in the box and as a result he has produced assists consistently for teammates at the Premier League level (.23 per90 in 14-15, .13 in 15-16). A final factor that deserves note: Vardy drew 7 penalties this season, which was more than 18 of the 20 Premier League teams. Convert those into assists at a .78 rate, and his scoring contribution numbers look even better. He likely won’t generate as many penalties in the future, but it’s a valuable skill and one that is shared by another center forward whose release clause Arsenal tried to activate a couple of summers ago. It also further highlights how miserable Vardy and Mahrez were to deal with in and around the penalty box.
 But It’s Just One Good Season Well actually… *puts on his statsplaining cap* It’s just one elite season. (Though I agree with the general point here.) This season Vardy was 21st in expected scoring contribution (expected goals + expected assists) across Europe, and the six players around him were: Marco Reus, Alexis Sanchez, Aguero, [Vardy], Mkhitaryan, Cavani, Ozil. That’s undeniably good. However, last season was still decent. In a bad team playing a couple of different positions, Vardy’s expected scoring contribution was still .48. A selection of the cohort around him yields Immobile, Mario Gomez, Keita Balde, [Vardy], Haris Seferovic, Danny Ings and Jesus Navas. We are still camping in the realm of mostly good players. Oh, and amusingly, Riyad Mahrez was right there at .46. But He Doesn’t Fit the Style! Funny thing about that – almost no one does. There are very few elite possession teams in Europe these days, and even fewer that play anything like Arsenal. Fitting the style is always going to be an issue. One thing that Vardy does do is fit the league, which is always at least a minor concern when bringing players from abroad. He's been pretty healthy too, though obviously he will end up horribly broken the moment he signs an Arsenal contract.
  Please, please please, tell me there are other options beyond Jamie Vardy! Well, there are… they are just a lot more expensive. The reason Arsenal have likely landed at Jamie Vardy is a basic disconnect between price and value. Vardy at £25M is mispriced in the current HOLY SHIT EVERYONE IN THE PREMIER LEAGUE HAS CRAZY MONEY market. Remember, Arsenal are definitely buying a forward, and everyone knows that, so teams will try to extract max value because of it. There’s an argument that if Wenger were truly thinking ahead, he probably would have addressed this issue a number of times over the previous 3 summers, taking small gambles on 20-22 year old players with big potential and hoping that one of them would grow into his center forward of the future. He kind of did that with Welbeck, but injuries wrecked the plan. Three summers ago he could have bought Aubameyang for 13m. Two summers ago it was Morata and Michy as standouts. Last year it might have been Santi Mina, Vietto, Borja Baston, or Sebastien Haller. Arsenal have a good recruitment department and resources that dwarf almost every other football club out there. At some point you’d think they’d let them gamble a little on the future, especially when Wenger has been destroyed by poor market reads again and again (FFP never really mattered, and the EPL TV deals meant that money spent in 2013 and 2014 was way more valuable than current dollars). ANYWAY, we are where we are, and unless he's going to Looper into his past to fix things, Big Weng has to deal with the now, which means buying a forward. Assume Vardy turns Arsenal down for whatever reason – where do you go next? The obvious one that Arsenal were allegedly in contact about (both now and in 2014) is Alvaro Morata. The problem there is that Arsenal find themselves competing not only with Real Madrid for the player, but also with PSG and potentially Chelsea. It's great to identify the player and all, but you still have to convince him to come play for you. Arsenal are rich, but they have never paid as much in wages as any of those clubs. Aubameyang? Great, but probably not available and if he is, it’s for £60M+. Higuain? He’s awesome, but same age issues as Vardy for twice the price. Ibrahimovic? This would have been a fascinating move, but he'd take Arsenal's wage structure and break it in half. Lacazette? This would make sense and Lyon might be willing to sell at this point. There are questions about how well he would fit into Arsenal’s style, but he has pace and his expected scoring contribution was right there with Giroud this season. He also just turned 25, so the age doesn't make me wince. As you go further and further down the list, it gets harder to get excited. Lukaku? 60m and style concerns. Harry Kane? Hahahahaha... No. If Arsenal strike out on the top targets, I wouldn’t be completely surprised to see them try to convert a wide man like Julian Draxler, or to take a punt on a mostly unknown from France (speaking of... they should have bought Ousmane Dembele to play wide, but whatever). Anyway, it’s a complicated problem and one that is compounded by past mistakes. However, these facts should guide future decision making.

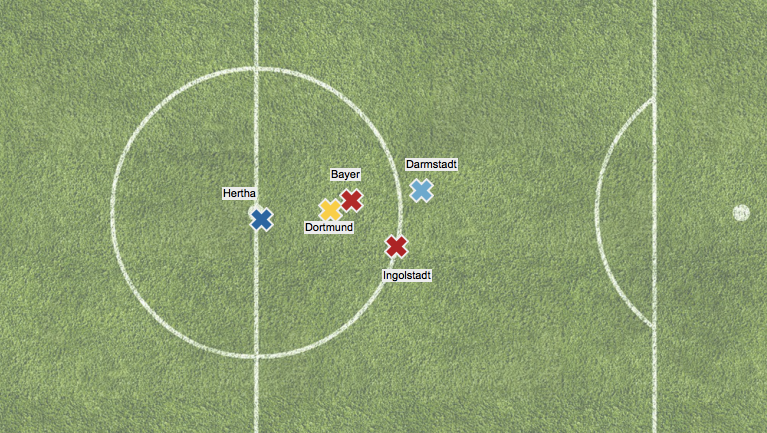
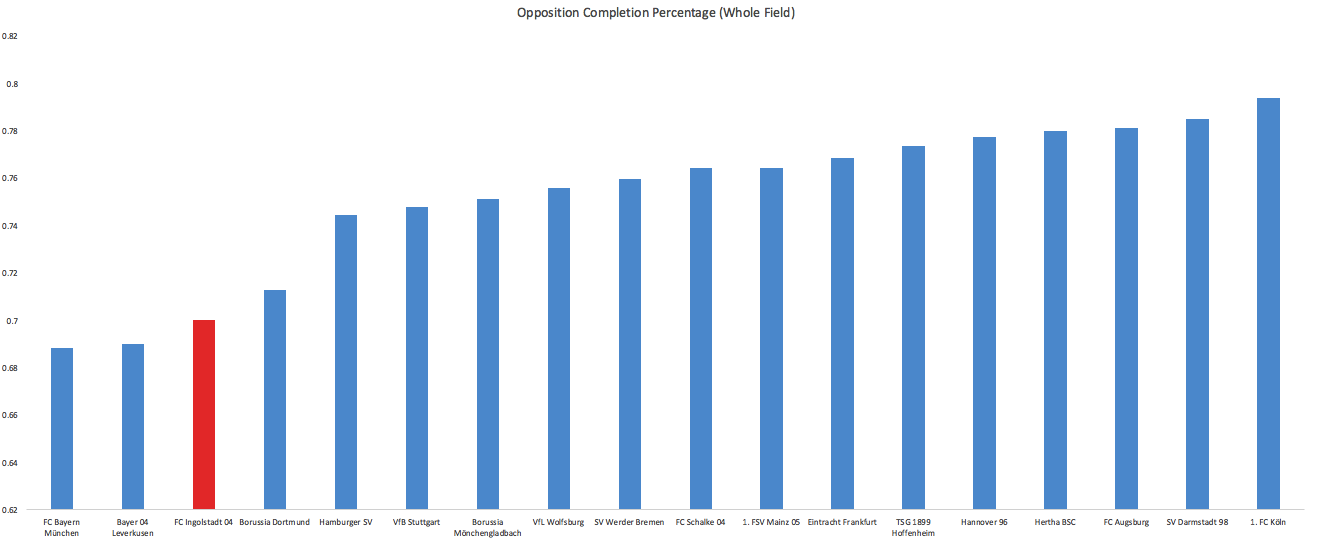
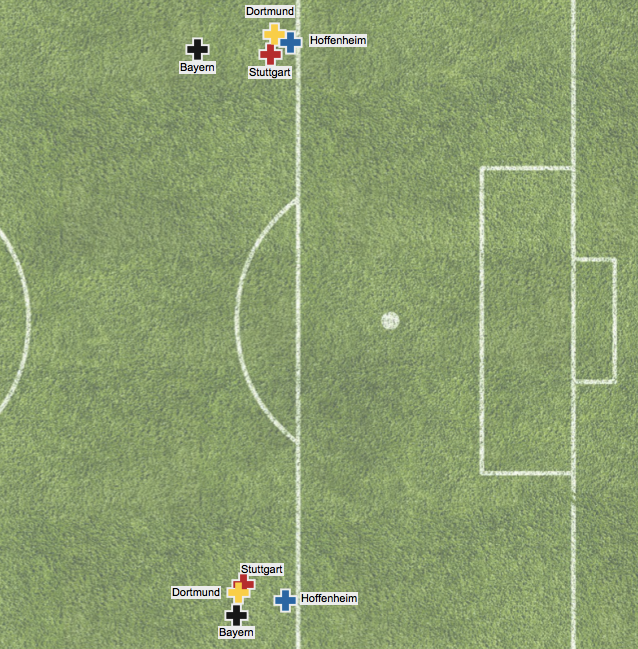 This may not look like much of a gap, but a pass toward goal from Hoffenheim’s average locations are about 20% more likely to be completed and *40%* more likely to be converted into a shot than passes originating from Bayern’s average locations without even factoring in Bayern’s typical numerical advantage where they force opponents into early passes toward isolated strikers. Seemingly small distances make a huge difference when it comes to around the goal. Other Superlatives Unsurprisingly Bayern were also outliers in holding opponents to a low deep completion % but impressively they also allow a lower proportion of total passes to even be played into dangerous positions (
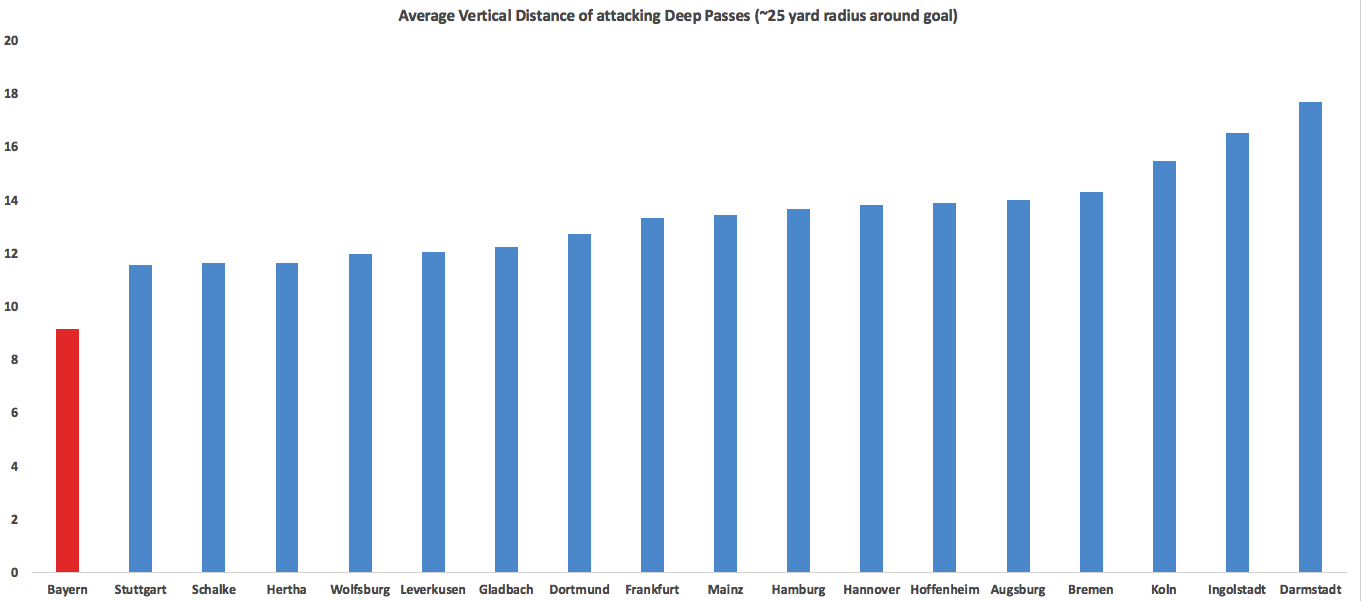 Getting past all the parts of their game and looking at the whole, Bayern as a whole this season were probably as close to a perfect team as we will ever see in the Bundesliga. Pep constantly increased their shots rate and territory dominance in his 3 years in charge and they had no real weaknesses. Dortmund had a team that could reasonably contend for any title in any league and the race was essentially over in early October when Bayern rolled them 5-1. For neutrals, the fact we didn’t get a two-legged, full-strength Barcelona vs Bayern matchup will be the biggest disappointment of Pep’s tenure. There can’t really be any substantive disappointments about the level they reached on the field. A non-stat moment that really resonated with me was Pep's final game. After winning in penalties, he was on the side crying for several minutes. The amount of effort and intensity Pep pours into each match and each season is really impressive and admirable and to see it kind of all come out with the final win and final title at Bayern was a nice way to cap an absolutely phenomenal 3 seasons.
  And still that's not even their craziest stat of the season. Last year across Europe, no team played a faster "pace" than Leverkusen, who took a shot every 17 completions. That was 2 standard deviations below the European average of 26. This year Darmstadt destroyed that by taking a shot every 13 completions. They are in a group of their own, with some room to stretch out.
 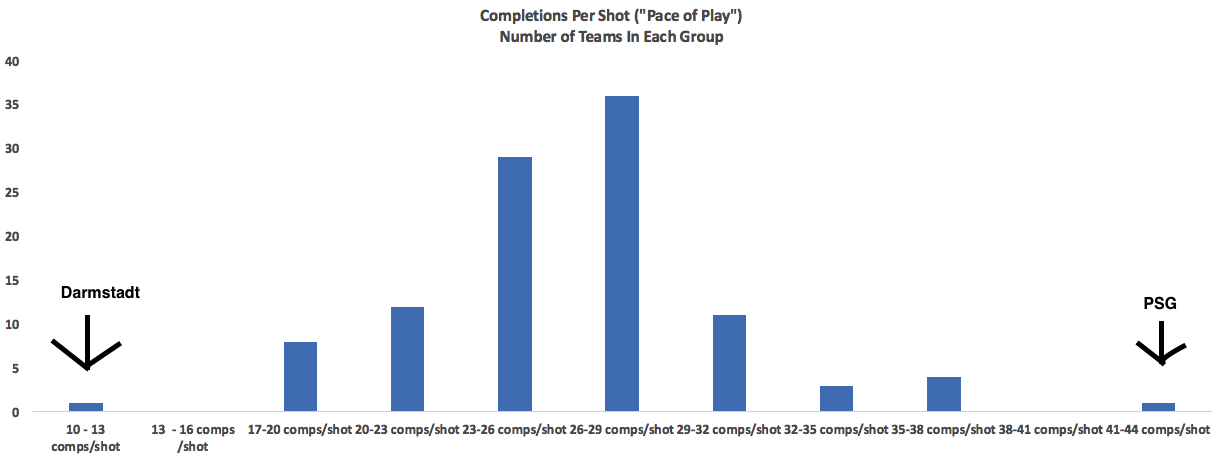 They weren't any good and should be heavy favorites for relegation next season but they are bad in a beautiful and unique way. Watching hundreds of games a year can sometimes get to be a slog (Frankfurt again?) so when we get teams like Darmstadt who are trying stuff so far outside the norm, I enjoy it. ***BONUS CONTENT*** The worst single shot quality game came in August when Hannover hosted Leverkusen. The average Hannover shot came from over 30 yards.
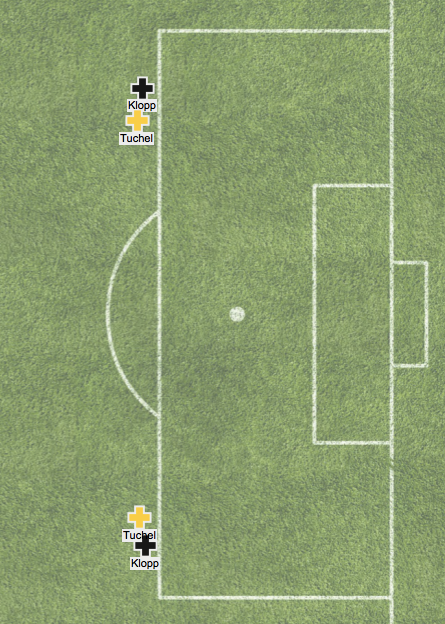
 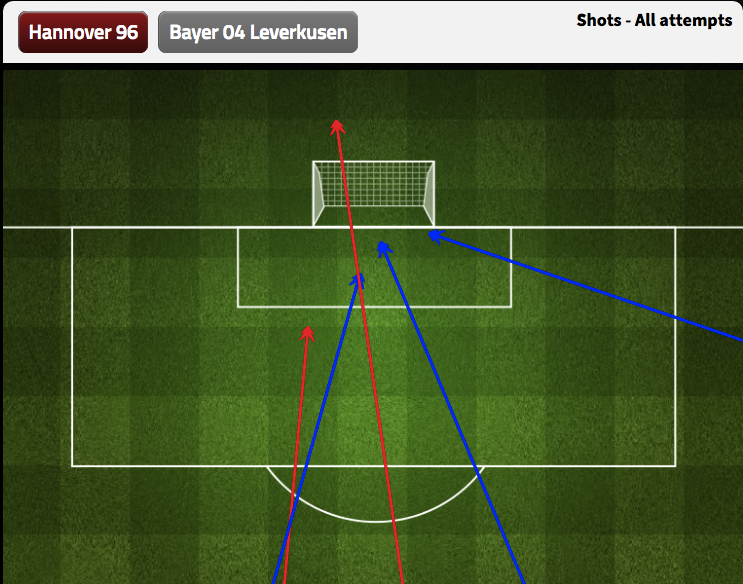 We should have known, if you can't get a shot to start on-screen at all in a home game, you might be headed for relegation. Dortmund Again more was written about them at the halfway mark in the link above, but they clearly re-established themselves as a legitimate top European team this season after last years strange bobble. Tuchel at Mainz showed a tendency to dominate the center of the pitch and he continued that this season and was able to narrow Dortmund’s previously too-wide dangerous passes:
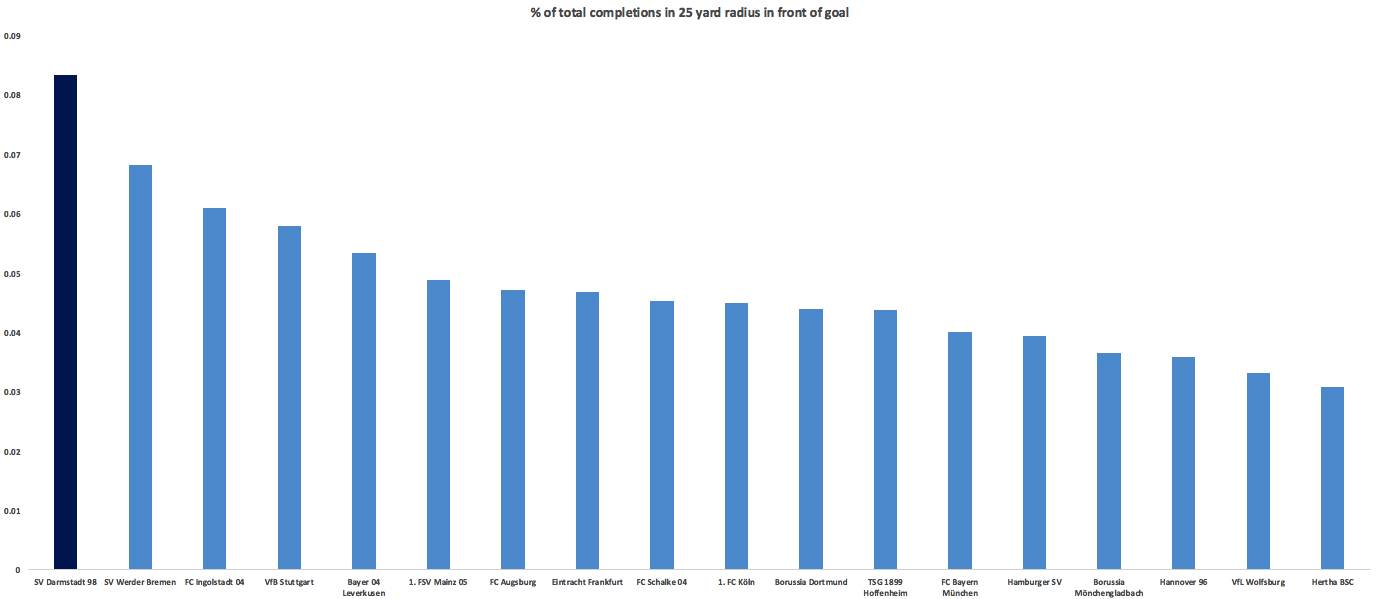
 Werder Bremen This may seem strange at first as last year they finished 10th with 43 points and this season they slipped to 13th with 38 points with the exact same goals numbers (50 for-65 against) and battled relegation for a long time but bear with me. Let me make my case before you trust the table, which can have a Trumpian relationship with the underlying truth at times. No team improved as much as Bremen did from last year to this in increasing the number of passes they completed in dangerous areas. No team improved as much in decreasing the number of passes their opponents completed in dangerous areas. With these two improvements, they wound up pretty solidly on the positive side of the ledger here, and only behind the Big 3 when it comes to territory dominance.
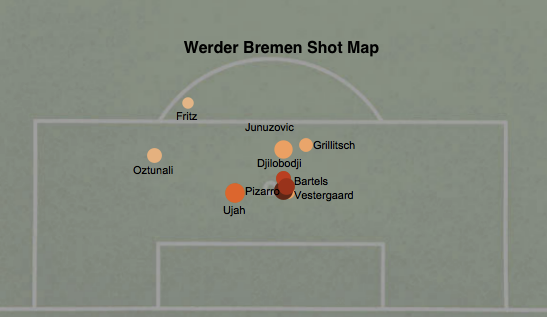
 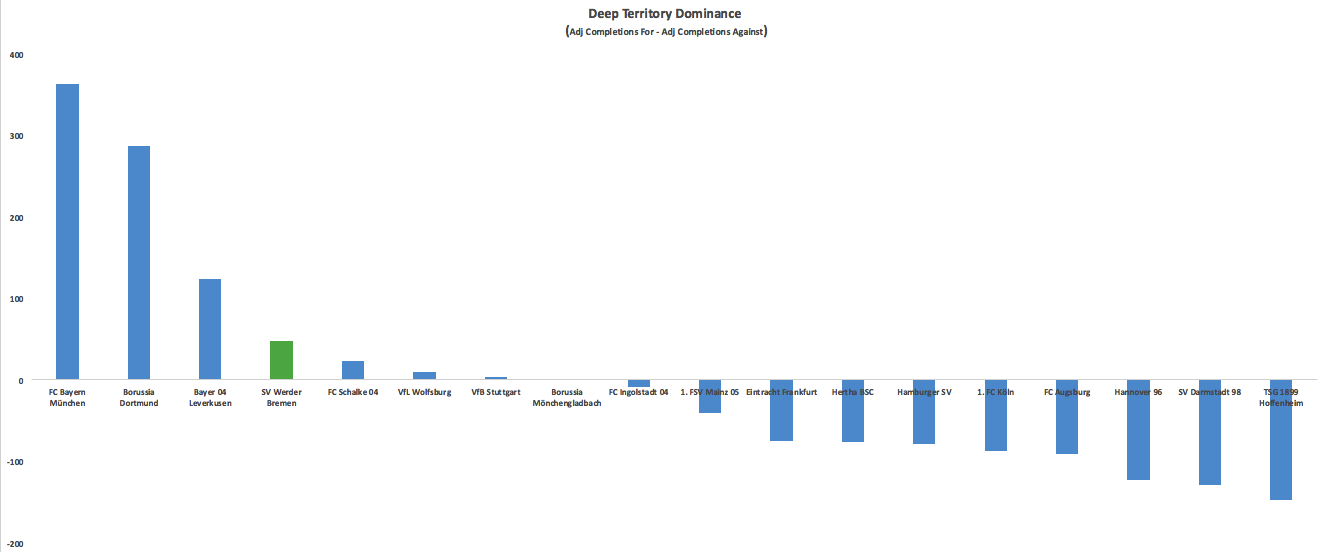 *Adjusted deep completions means I weight ones ending in a 0-15 yard radius from goal 4x as much as those from 16-30 and crosses are half as valuable as open play completions. Bremen were 7th in TSR, allowing a middling amount of shots (13 per game). There is reason to believe they might have been unlucky to allow that many: Bremen allowed a higher ratio of shots to deep completions allowed this year than any Bundesliga team over the past two seasons. This is something that seems to
  Honorable Mention: Schalke. Breitenreiter got their heads above water after the disastrous Di Matteo experiment but now they turn to Augsburg to take much lauded manager Marcus Weinzierl. I’ve never really been incredibly impressed with how Augsburg play and they’ve never stood out in the data, but it’s hard to tell what talent level he was working with. Schalke’s central midfield was basically a red carpet for teams to roll into attacking territory on, fix that and a Champions League return can be discussed. Others: Koln, Bayern (yes one of most improved teams after one of the best Bundesliga seasons ever last year), Hertha Berlin Most Disappointing Leverkusen
  Roger Schmidt’s Leverkusen remain one of the most fascinating teams in Europe, but this season saw their progress slow and even start to drift backwards even as the potential for something great dimmed slightly. First, the potential. Their games against Barcelona and Bayern showed just how brutal to play against Leverkusen can be. In a messy home 0-0 draw, Leverkusen held Bayern to 9 shots and 77% passing, both near the bottom of the entire Pep tenure. At the Camp Nou, Barcelona had just 5 shots in the first hour and Leverkusen controlled the game before Barca got 2 late goals for a comeback win. Aside from the raw numbers, watching the games you really felt like these were just even teams going at it, in the Barca game I thought Leverkusen were the better team for most of the first half and pretty dominant at times. It's stretches like that and their powerful (though a little less powerful this season) pressing game that make you think there is Atletico Madrid-type potential here. One fantastic bit of information I love to pull out every time I talk Leverkusen is their sideline pressing trigger:
 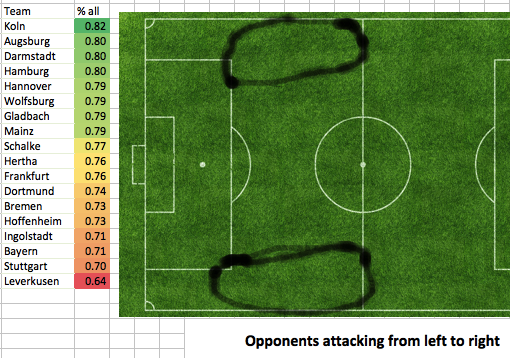 I first found that playing around with data and then later saw an interview where Karim Bellarabi said they are set-up to force opponents into these zones and then pounce to win the ball back. Pressing triggers and a few great performances aside, the big picture stats all trended the wrong way this season:
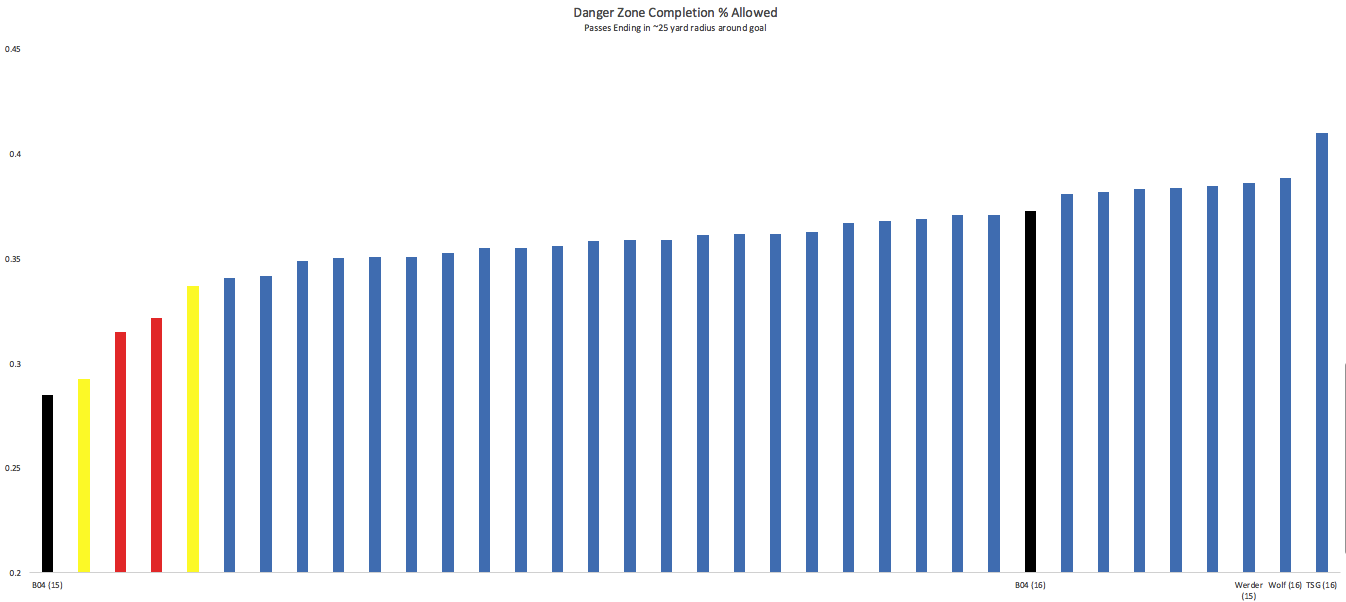
  The one thing holding them back from making the leap into the elite teams in Europe has always been generating enough offense. The frenetic defensive style often seemed to seep over into their attack and they became careless with the ball leading to very few sustained possessions. This year they eased up on the helter-skelter ball a little bit: they took 23 completions for every shot, which was 5th quickest tempo in the Bundesliga after they were fastest in Europe last season at 17 completions per shot. They saw their midfield completion percentage rise 6 points (helped by a huge reduction in share of midfield passes being played forward). This increased tranquility didn’t transfer to improved offense, as we saw from the raw numbers, and it didn’t lead to a more efficient attack: a lower % of dangerous passes were completed. I’d always said there is no reason to play with the ball like they did without, but maybe there is some connection I've been missing as when Leverkusen dropped a bit of franticness with the ball, the intensity on D dropped a bit as well. Last year they forced opponents into 32 yard passes on average as they approached goal, nearly 3 standard deviations above the Bundesliga average and the longest in Europe. This year they weren’t even 1 SD above the league average at about 29 yards. Allowing shorter passes led to a dramatically higher success rate as you can see by the 2 seasons charted:
  This contributed to allowing some of the easiest shots in the league on average. One place where they can point to some bad luck comes on close shots. When you combine both ends of the pitch, Leverkusen were the worst team on shots under 10 yards:
 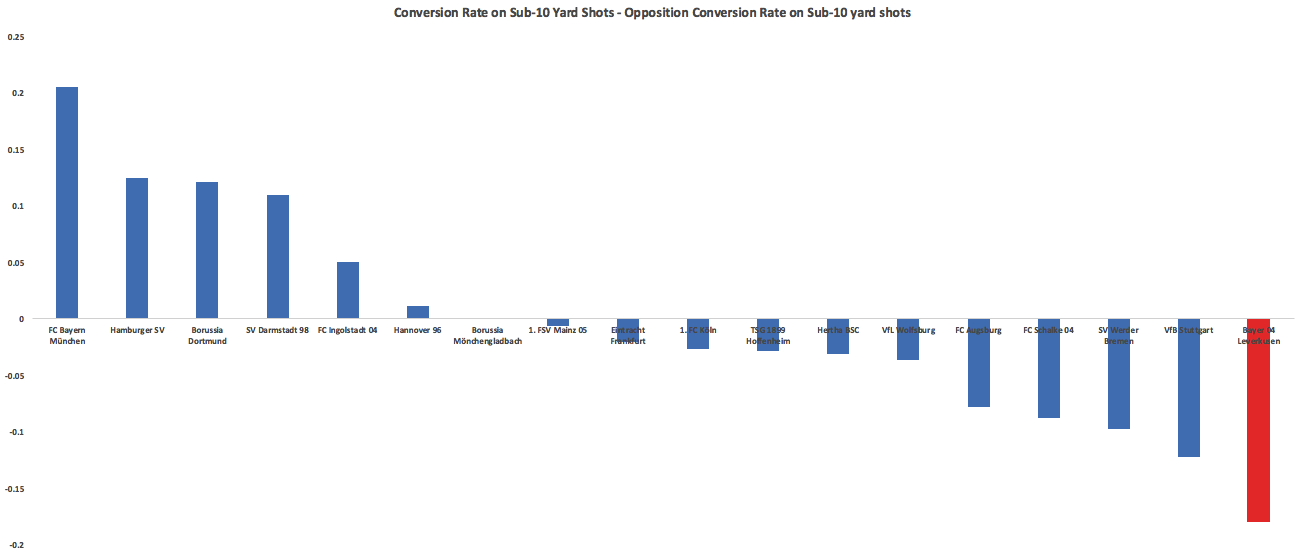 Stuttgart, the team who employed Przemysław Tytoń in goal and whose horrible short-range finishing became a well-worn source of comedy, finished ahead of Leverkusen here. The problems for Leverkusen were mainly on the defensive end, where 40% of these shots went in (league average: 26%). After the 2014-15 season if you told Leverkusen fans that Pep would leave Bayern and Dortmund would lose Gundogan, Hummels, and maybe Mkhitaryan after the 2015-16 season they would have had good reason to start dreaming of a competitive title race. After this step back, that looks like a tougher sell. You can still see a solid structure that oozes potential but you just have to squint a little more, maybe squinting really hard and having Kevin Kampl and Charles Aranguiz healthy next year will be enough to hassle the Big Two In Transition (the narrative I'm trying to gin up already). ***BONUS CONTENT*** Unsurprisingly it was Darmstadt who had the lowest ratio of completions to shots against any single opponent. Also unsurprisingly it was Stuttgart, a perfect match of fragile defending and wild pressing running up against long vertical passes. Darmstadt totaled 32 shots in the two games while only completing 255 passes, which is a lower pass total than almost every Bundesliga team averages per game. Others Who Disappointed Wolfsburg, Hoffenheim, Frankfurt Wolfsburg were cruising along at the winter break basically doing the same things as last season without the absurd conversion rates before losing some serious steam in the second half of the season. Opponents started accumulating 20% more dangerous completions and the VW club's early season numbers looked like they had just been fiddled with to give the appearance that everything was ok. The Wolves ended season with 8 points from their final 8 games while allowing more shots on target than they took (11th in league over that time period). The 2-0 win over Real Madrid means they get another year of cross-happy Hecking, who showed little flexibility in using Max Kruse and Julian Draxler this season. Most Unlucky Stuttgart For those not emotionally involved, Stuttgart’s season was simply amusing. Utterly chaotic pressing from first coach Alexander Zorniger led to them playing like Rayo Vallecano (and conceding uncontested shots like Rayo) only to pile up huge amounts of shots through their talented attackers to where their advanced numbers looked like a Champions League contender while they drifted toward the bottom of the table. Zorniger got the boot and conservative Jürgen Kramny came in to stop the chaos and quiet things down:
 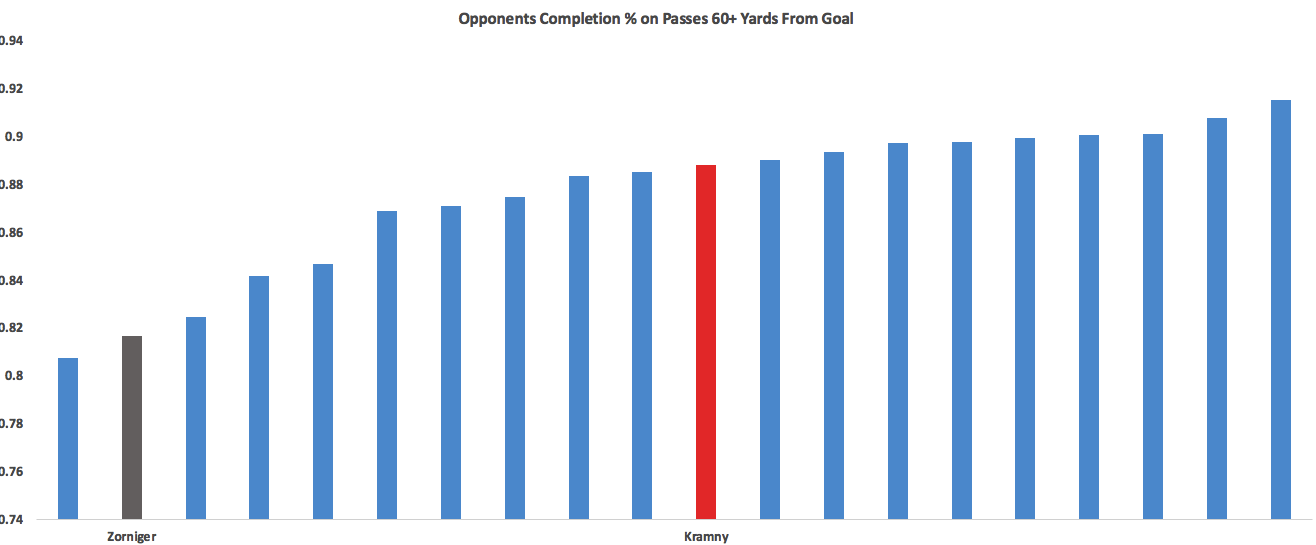 He did nothing of the sort, as Stuttgart started allowing an even higher completion % at the back. They ended the season with horrific block and SOT% allowed numbers, both worst in the league by some distance and close to 2 standard deviations below average. That’s how a team finishes 5th in TSR, 4th in Caley’s xGD and gets relegated. They allowed 22 fewer shots than Koln and yet allowed 33 more goals. Their playing style and atrocious defensive work means they never had a real chance of playing up to those lofty shot numbers, but they certainly were not a relegation level team either. Stuttgart improved their own SOT numbers 36% from last season and wound up with more on target than Leverkusen! That is usually not followed by relegation. The strange thing about Stuttgart is they are seemingly loaded with attacking talent for teams to presumably poach now. My opinion if you are trying to grab a player who will help you next season (and yes I am violating the strict rule of player talk in part 2): #1 Maxim (best passer of all, most involved, nearly tops scoring contribution list) #2 Ginczek (good at getting in-box shots off, chips in well with key passes) #3 Didavi (already off to Wolfsburg, 3.5 shots/90 led the team but showed a little too much affinity for long-range bombs with his head down. Has a strong track record) #4/#5 Harnik/Werner. Basically identical statistical profiles this season. Werner is only 20, Harnik 28. #6 Kostic. Potential is there but currently way too aggressive with the ball and just loses it too much for me to feel comfortable paying big bucks for him. Lowest volume shooter of everyone here, and still doesn’t take high-quality shots. ***BONUS CONTENT WITH THE BENEFIT OF NICELY EXEMPLIFYING TWO TEAMS ENTIRE SEASONS*** The single longest pass that led to a chance was an 85-yard bomb by who else, our old friends Darmstadt against who else, but Stuttgart. It shows off Darmstadt's ugly, vertical long bomb game, Stuttgart's relentless forward push and their generally awful defending mixed with a bit of bad luck (would have been better example if Tyton had botched the save, but good enough.) Others Wolfsburg, Werder Bremen Luckiest Hertha Berlin Hertha were both one of the more improved teams and the luckiest. They slowed the game down to an absolute crawl with the ball, taking 37 completions for every shot, a number only topped by Barcelona and PSG last season. They did this by passing backwards on average (Bayern the only other team to do this) and the average pass winding up closer to their own goal than any other team by 2 full yards.

 This
This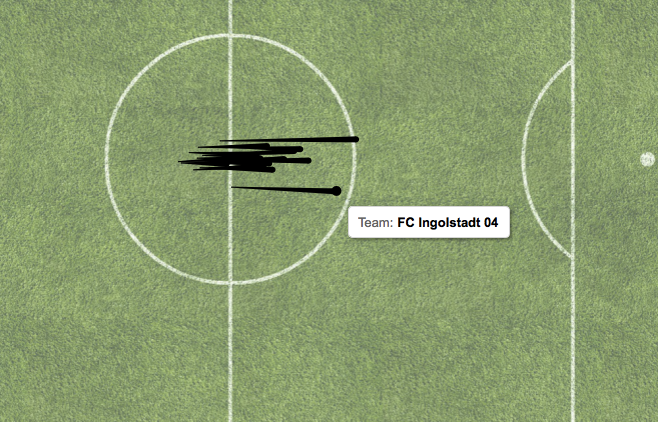
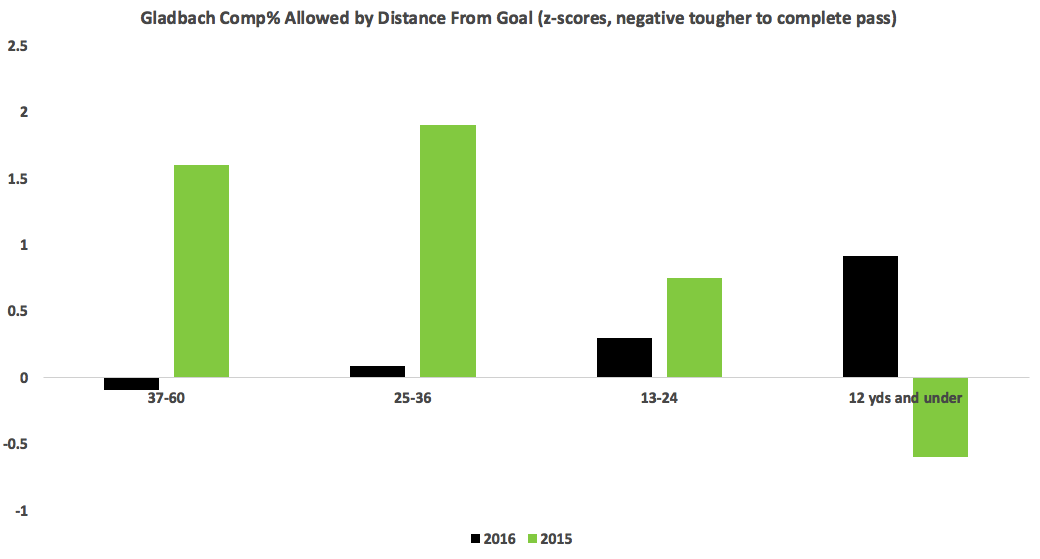
 Raffael. When Max Kruse left and Gladbach didn’t really
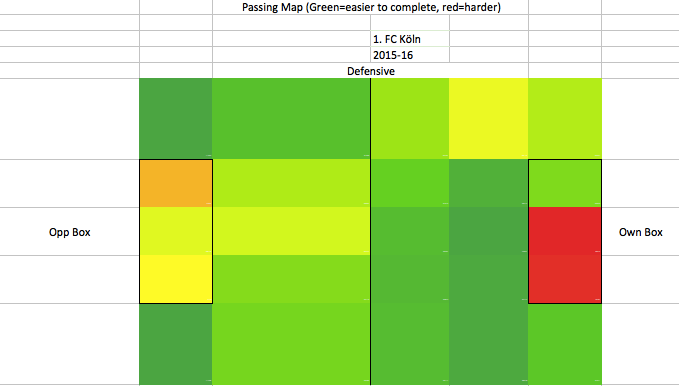 and wound up with a strong defense and a league-leading block%. -Marwin Hitz (Augsburg) distributed excellently and was the top shot-stopper according to fellow StatsBomber Thom Lawrence's number-churning. There is a whole argument on whether that’s sustainable or should even be recognized as a good performance, but we won’t have that here. It will continue to slowly rage on on Twitter, bubbling up every few weeks. All-Bundesliga Second Team GK: Oliver Baumann (Hoffenheim) CB: Naldo (Wolfsburg) CB: Mats Hummels (Dortmund) FB: Paul Verhaegh (Augsburg) FB: Jonas Hector (Koln) MF: Zlatko Junuzovic (Werder Bremen) MF: Julian Weigl (Dortmund) MF: Hiroshi Kiyotake (Hannover) MF: Marco Reus (Dortmund) F: Thomas Müller (Bayern) F: Pierre-Emerick Aubameyang (Dortmund) Over the past two seasons no Hannover attacking player has topped 72% completion percentage, except for Hiroshi Kiyotake who has put up 79 and 80%. He’s coupling by far the best percentage with what are probably the most aggressive passes of any Hannover attacker, so this isn’t a product of just playing the ball backwards. Looking at key passes, it’s the same story:
 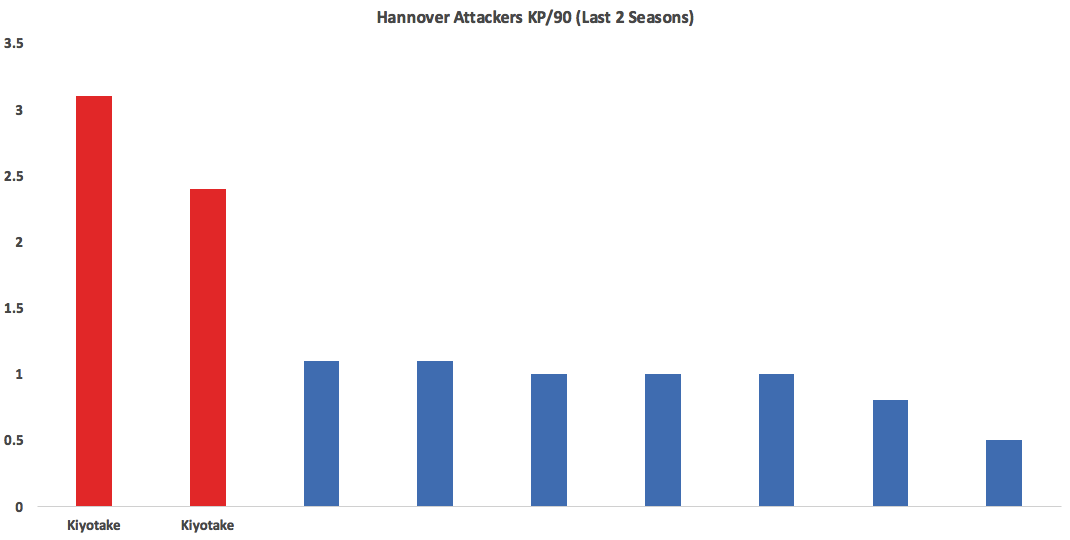 -Kiyotake is one of the better players in
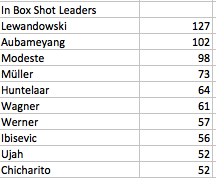 That’s an impressive year even accounting for the fact he gets a lot of headers. He’s in a nice spot alongside Koln’s fullbacks and should continue to rack up strong shot numbers as he’s done for each of the past 6 seasons. -Kevin Kampl was everywhere doing everything this season. He fit perfectly into Roger Schmidt’s midfield after a basically lost year wandering around on the wing in Dortmund. If not for injury would have put him on one of the first two teams. -Jerome Boateng/Josh Kimmich/Thiago/Xabi Alonso: You can’t write about every Bayern star. These guys were good.