
This entry is a follow up on my passing autographs entry (I've since decided that Passing Network Profiles has a better ring to it) in which I thought I'd go through some of the profiles' results for Bundesliga and Premier League teams. A quick update first of all: I've made a few small improvements to the methodology presented previously and have achieved repeatability above 95% now. Also, in this new improved methodology, 8 spatial categories slightly ousts 9 as the optimum choice. That's pleasant since 8 is a much nicely round number (no pun intended). Remember from last entry that what we mean by "team passing network profile" is a set of 40 numbers: the relative frequency of each of the 5 motif types performed in the form of each of the 8 spatial categories. Below are the results for the classic high-dimensional data visualisation methodologies of hierarchical clustering and principal components for data from the 2015-15 Bundesliga and Premier League: 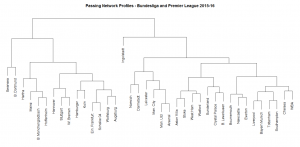
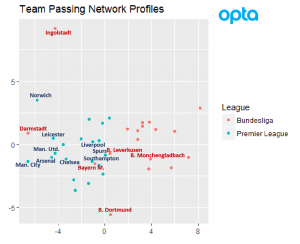 There's a lot to talk about regarding these results. First of all, there is a clear distinction between the profiles of Bundesliga teams versus Premier League teams, so in other words across both leagues we find different types of passing network profiles. Among Bundesliga teams though, there are 4 teams that are in general closer to Premier League teams than to their German counterparts: Bayern Munich, Bayer Leverkusen, Ingolstadt and Darmstadt. Clearly this is to varying fortunes: Darmstadt and Ingolstadt both seem to be headed for relegation. NOTE: Don't read too much into Ingolstadt and Darmstadt's position in these plots. Even though it's true that in general they are more similar to Premier League teams, they're actually outliers of the data set and are pretty far away from everybody. The same applies to Norwich. The fact that Norwich and Darmstadt appear similar to Leicester and Man. City is more a shortcoming of these methodologies when trying to plot high-dimensional observations in only two dimensions. Having said that, there are several clusters of interest. The first of these is the one made up by Arsenal, Manchester United, Manchester City and Leicester; and the second one is made up of Bayern Munich, Liverpool, Tottenham, Southampton and to a lesser degree Chelsea and WBA. This last pair is interesting considering WBA's great season so far in 2016-17. Another interesting pairing in this confirmation-bias sense is Hoffenheim and Monchengladbach. But anyways, best to keep it short and let the reader make his own analysis of these results. I'd love some feedback from the surely many many more tactically literate readers on what they make of these results. Please read and share!
Month: April 2017
The Table is the Same - Has Mourinho Improved Manchester United?
Last week I took a look at how changes in managers have affected the relegation chances of Swansea and Hull. Today we’re going to look at team performance through the lens of managers again, but at a much larger club. A Few Words About Louis van Gaal We need to be honest about what Jose Mourinho walked in to with this Manchester United team. United under Louis van Gaal were one of the worst-managed super teams possible. I have mentioned this on our podcast at various times, but this remains a staggering factoid: In van Gaal’s last season, with a fantastically expensive squad, they took fewer shots per game in attack than 17th place Sunderland. For reference, United took 11.3 shots per game in 15-16. A year before, Burnley and Hull both averaged 11.3 shots per game. And were relegated. If your attack is posting the same shots numbers as relegated teams - when you are Manchester fucking United - you have problems. Yes, United managed to finish 5th. With a +14 goal difference. The same goal difference as perennial Premier League titans West Ham. +14 was considerably less than 4th place Manchester City, who happened to have finished on the same points total as United (66), but backed into 4th place with a far more typical +30 goal difference. It’s not like they didn’t have shot volume guys in the squad, either. Rooney, Depay, Martial, Mata, even Lingard have all had substantial shot output in the past. Clearly, the lack of shots was via tactical instruction, which means van Gaal was to blame. The most shocking part of this to me is that even shooting less often in exchange presumably better shots, they barely moved the needle on shot quality. That last season under LVG they came in just above league average, at about 10.5%. All of this is a lengthy way of saying that despite van Gaal’s big name and pedigree, Jose Mourinho inherited a bit of a mess. The Numbers 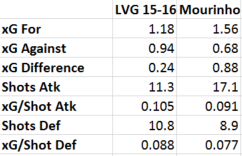 (Note: the United numbers are a week old and pre-Ibra injury, but I doubt they change much between now and the end of the season.) Looking at the numbers above, it’s very clear that Mourinho has had an enormous impact on United’s underlying numbers, even if the league table position looks the same. United under LVG were a decaying team that were lucky to finish 5th. United in Mourinho’s first season have numbers consistent with a top 4 team. United have improved on both sides of the ball, seeing a big boost in both attacking and defensive xG. They take nearly six more shots per game than the same team last season, while limiting the opposition to two fewer shots as well. That’s impressive and a radical change that is largely down to improved coaching. The increase in shots has a small caveat in that average shot quality is worse overall, but they are forcing opponents to take worse shots than last year as well. Plotted via time sequence across a match (thanks James Yorke), you can see the troubled production under LVG compared with the huge gap Mourinho's team is creating.
 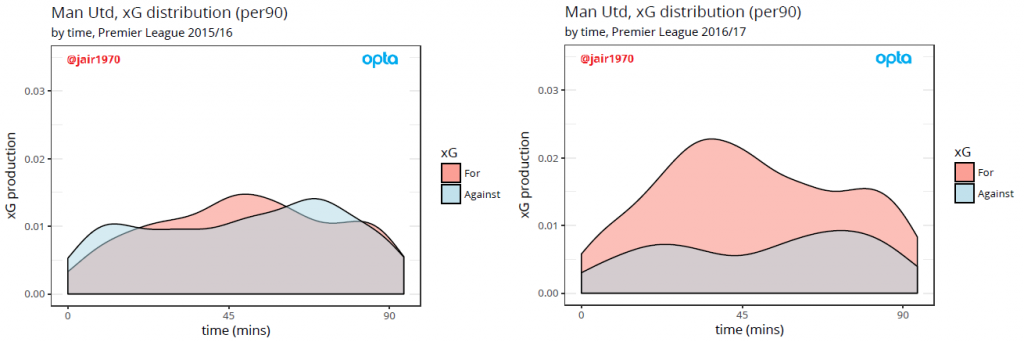 Beyond the scoring numbers, what else has changed? Well, Mourinho has De Gea playing the ball longer out of the back, and more regularly. The press has also improved slightly, which is a bit odd because Mourinho employs a middle block press, while LVG was generally known for more man-oriented pressing work. United give up about half as much xG per game from set pieces now versus under the Dutchman. In relative terms, the defense is good enough to win titles. The attack isn’t quite there yet, but the difference between LVG’s numbers and now is so substantial that United fans should be delighted. What Can Be Improved? So United are good. But how can they become good enough to once again sit at the top of the table? For starters, they need to take better shots.
 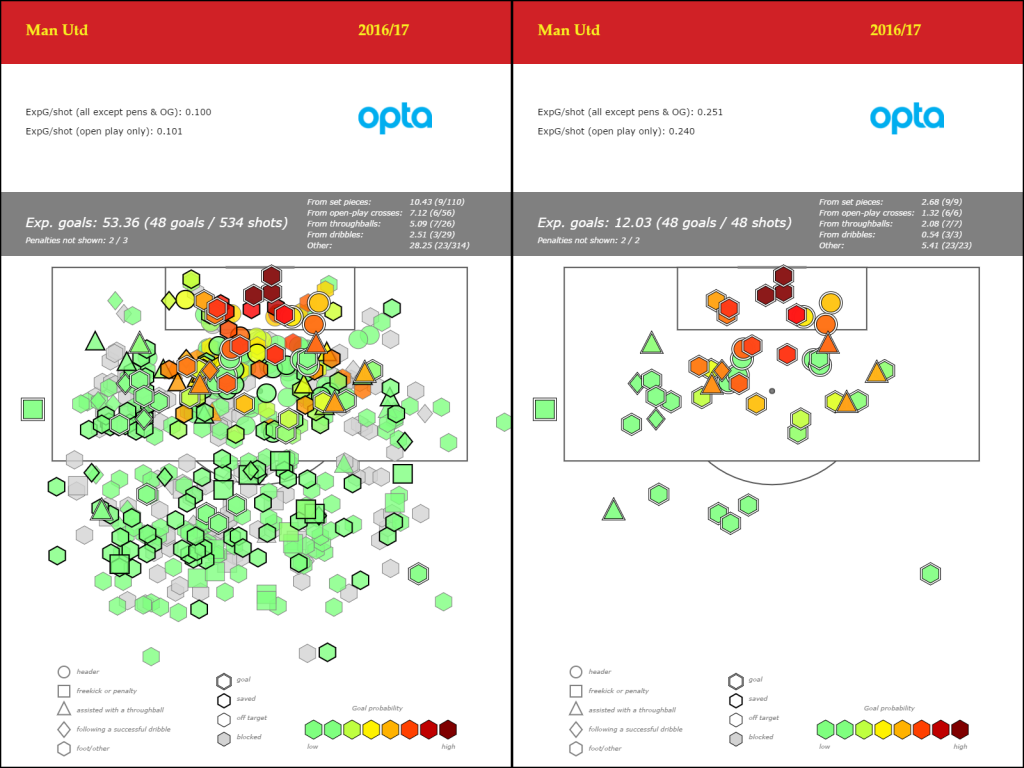 (click to embiggen) This is all United shots paired with all United goals this season. Interestingly, there’s a lot of joy from the left channel, presumably from an inverted forward curling in goals, but almost none from the right. There is also a LOT of chaff from range. Shot volume in general skews heavily to the left, which is something opposition scouts would want to be aware of. In aspirational terms, this is where Barcelona 15-16 scored their goals from. Want to be a super club in attack? Take some luck and variance out of the equation. Figure out how to create more of this.
 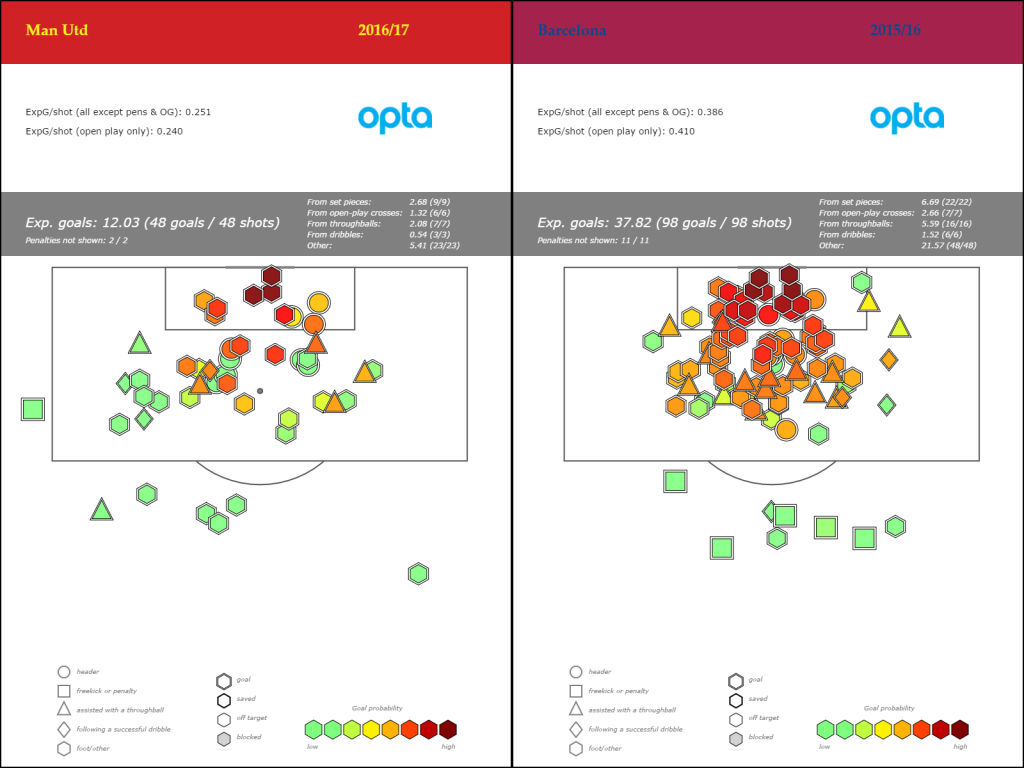 Another huge area for improvement in both United eras is set piece goals. Under LVG it was about .18 xG a game. Under Mourinho, it’s up fractionally to .22. With this personnel, plus how often they generate shots and fouls around the opposition box, a good set piece coach could likely improve that by .3 or .4 goals a game. That by itself is good enough to push United near title territory. Hey, Manchester United… I can help with that. Call me. Europe and beyond Despite never really having been in the top 4 all season, United still have a great chance at playing Champions League football next year. According to Paul Carr at ESPN, United are 58% to win the Europe League, and 35% to secure a top 4 finish in the Premier League. The combined probabilities make them about 73% likely to play in the CL for 17-18. As you can see from the analysis above, Mourinho’s arrival on Manchester has improved them massively. Part of this can be credited to the poor shape that LVG left them in, but most of the credit has to come back to The Special One and the superstar squad of players up at Old Trafford. They are much better than they were last year, and generally a lot better to watch as well. The underlying numbers this year will put them in the hunt for a Champions League place every season. With some minor improvements as noted above, Mourinho could return the red part of Manchester to title hunting next year, territory they have not occupied for quite some time. --Ted Knutson ted@statsbombservices.com @mixedknuts Bonus Radars Section
*NEW* StatsBomb Podcast: April 2017

Ted Knutson and James Yorke chat football, with a statistical angle
Downloadable on the soundcloud link and also available on iTunes, subscribe HERE
Thanks!
How Different Managers Are Affecting Premier League Relegation
I have talked on Twitter pretty regularly about using data to profile managers, both from a performance perspective and to detail style of play. However, what I have done very little of since I first started writing about Manager Fingerprints back in 2013, is practical public analysis. Let’s change that. Coaching a football team is a funny thing. Amidst all the media appearances, press conferences, and televised games where your body language on the sideline will be scrutinized like the Zapruder film, coaches are also responsible for making strategic choices about how their team are supposed to play. What do they do when they have the ball? When the opponent has the ball? How do you transition from attack to defense and back again? Then, once you have the strategy bit, you have to teach your players how to execute that at top speed, against the best players money can buy. This requires excellent analytical and communication skills. What went wrong? How do we fix it? How can I explain to each individual player what they need to see, how to understand that, and how to do better in the future? It’s no surprise then that like tigers, coaches almost never change their stripes. They typically stick with the same style of play, year after year, and because of that produce similar statistical output. As I’ve explained before, coaching is an apprentice-based learning process. Unlike book learning, where you learn by reading, coaches learn by doing. They learn from mentors they have worked with before, and perhaps by explicitly seeking out other coaches who coach a style they want to learn. And not only do they have to learn how to create the style, and evaluate it in motion on the pitch in training and in games, they also have to learn how to teach it. Coaching well is an extremely difficult job. With this in mind, it should come as little surprise that coaches whose teams don’t currently display certain tactical traits (like an aggressive zonal press without the ball) are unlikely to be able to coach that style in the future. The same is true for coaches whose teams don’t currently generate high quality chances inside the box. If they don’t already know how to create this, it’s unlikely they will magically learn it by taking a new job, at least not without supplemental learning or bringing in help from assistants. If coaches rarely change styles, this means that data suddenly becomes a great way to profile what you can expect from various head coaches when they change jobs. Player quality can vary wildly between teams, but the style is likely to remain the same. It also means that searching for coaching candidates via data is now at least as interesting as searching for players in the transfer market. Both are expensive endeavours, especially when you make mistakes, so it makes sense to gather as much information as possible before making decisions. Today I’m going to use these principles to look at how manager changes have impacted the relegation battle in the Premier League. Hull  The headline number here is that Marco Silva came in at midseason and improved Hull’s expected goal difference per game by .59 goals a game, from -.95 to -.36. This translates to a goal difference of -14 throughout a whole season, a total that hasn’t seen a team get relegated in at least the last four seasons*. Silva hasn’t made Hull a great team, but he’s at least given them a fighting chance. They were relegation certainties under Mike Phelan. (* Middlesboro are testing this number right now, mostly because their defense first policy under Karanka resulted in output that gave up very few goals but scored even fewer.) It’s all well and good to say Marco Silva has made Hull dramatically better, but we care about the details as well. HOW are they better? In attack they take about the same number of shots – a touch over 10 a game, but Silva’s managed to boost the quality of these significantly, from a putrescent .075 under Phelan (Hull would score an average of 7.5% of their shots) to .106. On the defensive side of the ball, we actually see the average quality of opposition shots has gone up a touch, which would seem bad at first until we look at the volume numbers. Phelan’s group were giving up 18.6 shots per game. Under Silva (as of this writing) it’s 14.2, which is a huge swing. Beyond the headline expected goal numbers, there are subtle differences. Silva’s tactics have them defending a bit higher, and destroying the central block of opposition attacks more consistently. Average shot distance is now inside the penalty box, even from open play. Under Phelan, distance from open play was nearly 3m outside the box, which is baaaaaad. Would Silva’s tactics be the same with a better group of players? Possibly not, but his output here is a classic recipe for what you can do to improve a seemingly doomed team, and give them a shot to avoid relegation. He seems like at least a safe pair of hands to hand any Premier League club to in the future, with a lot more potential upside. Swansea
 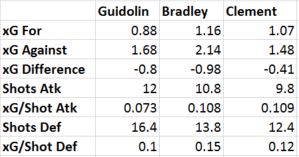 Swansea’s battle against relegation this season has included three different managers, all with different preferred styles. What’s interesting to me is that Guidolin’s 16 games in 15-16 produced far better underlying numbers than his stint this year, but I think a lot of that is down to strength of schedule. Sure, Swansea started the PL season with Burnley and Hull, but then faced Leicester, Chelsea, Southampton, Manchester City, and Liverpool. Good luck surviving that run with non-relegation numbers. The killer for Guidolin is the shot quality numbers in attack. Shot differential of -4.4 isn’t terrible, but cross that with a huge gap in shot quality and you’re likely to struggle. Would that have improved as they progressed into a softer schedule? Possibly. I said at the time I probably would not have changed managers at that point, and I still mostly think that, though it depends a bit on whether Guidolin had input into the poor quality of the squad coming out of the summer. Bradley’s issue was the catastrophic defense. The style he played at Stabaek had elite athletes with pace that destroyed the midfield and then counterattacked. Swansea’s squad is the exact opposite of that – highly technical and slow. They destroyed better than under Guidolin, but the cost was a 50% increase in shot quality conceded. Bradley’s done well with existing talent in the past, but this squad was troubled and proved to be a poor fit for his tactical preferences. This is something that can be teased out with proper manager candidate evaluations, both from a statistical perspective and from video scouting. Finally we get to Paul Clement. On our podcast about a month ago, I cautioned that I thought Swansea’s performances probably weren’t as good as their results. Since then, they have lost five and drawn one, plunging straight back down into the relegation zone. On the surface, it looks like Clement has righted the ship. The defense is far less leaky than under Bradley or Guidolin, but it’s come at the cost of attacking numbers. It’s all gone a bit Karanka, if we’re honest. They are defending and attacking well enough… to draw or regularly lose 1-0. The problem here is that draws won’t save them – they desperately need three points from as many matches as possible, and you only get 3 by scoring goals. The numbers are remarkably similar to what Silva is producing across the country. But... there's a catch. The last seven matches are one of their softest runs of schedule on the year for Swansea, playing Burnley, Hull, Bournemouth, Boro, Spurs, West Ham, and Watford in succession. The home game against Burnley is the only one where they won the xG race. You expect a bit of luck here and there, but being worse than your opponents every single week is still a recipe for relegation, which is why they once again find themselves in the bottom three. The fact that Hull beat Swansea in a close match (and also Boro) is the major difference in survival right now. Maybe across a whole season with Clement, Swansea would have been fine - the numbers certainly suggest he's improved them. However, with five matches left, Clement has to find some way for his guys to get a couple of wins or Wales will lose their Premier League representative for at least a season. Conclusion This was a brief look at the impact different managers have had on two of the teams fighting for Premier League survival. By using a variety of different key performance indicators, we can start to evaluate manager impact on squad output and to profile their styles of play. I didn't touch on it here, but we can profile how teams attack and defend, whether they are good at set pieces on both sides of the ball, what their possession tendencies look like, and a whole lot more. With some higher-powered maths, we can also adjust performance by strength of schedule to correct for things like Guidolin’s tough run at the start of the year, to better evaluate how the team is actually doing. Hiring and firing managers and their staffs is expensive. Data provides a much clearer picture of current and future performance under different managers than league table results, especially mid-season. We can use it not only to predict likely future performance, but we can also use it to profile coaching style and then help clubs find coaches that match their preferences for the style they want to see on the pitch. Next week I’ll take a look at a manager change that happened a bit further up the table, and we’ll talk about the difference different big names can have on one of the super clubs. If you want help evaluating your current manager or in finding your next one, get in touch. Ted Knutson ted@statsbombservices.com @mixedknuts
Tottenham: Success Awaits?
 Tottenham: Success Awaits? At this precise point in time, Tottenham are hot. Apparently secure in second in the Premier League, and certainly* secure of a top four slot once more, the team’s on field performances have been impressive throughout much of the last two seasons.That a team with a consistently outside top four budget should be entering the conversation for “who is the best team in the league?” is a testament to the significant progress made by Mauricio Pochettino during his tenure. However, as 2016-17 draws to a close and a title bid remains tantalisingly out of reach, we can reflect how this team has become so adept at killing off lesser outfits while repeatedly hitting a clear ceiling that manifests itself against rivals and in Europe. That’s the difference between a solid league team and a contender in any competition it competes in. The latter is something they are not--at least yet--and some kind of trophy would ice a pretty tasty looking cake that has been made under Pochettino's tutelege. Two season overview A slight illusion last season was the final result. Third was more than expected but the 70 points secured was close to level with the better seasons Tottenham have had in recent years under Harry Redknapp and Andre Villas Boas. The health of the squad and the club in general were significantly improved, but the actual output remained similar, in a season when the money clubs took a leave of absence. This season after just 32 games, they have exceeded that points total already, which looks to signify growth and progression, in a season in which they needed to or else fall into a possible hinterland that Arsenal look to be tentatively inching towards. On the surface that review is fine and it’s not untrue, but the method underpinning growth is worth deeper analysis. Shots A lot has been said about Tottenham’s shooting style under Pochettino. The team regularly bombards the opposition with a high volume of shots from all ranges. Across his reign, the team has posted extremely low goal expectancy per shot--I get them bottom of the big five leagues for each of his three seasons, among sides with 50-plus goals. But this is where we encounter interesting questions of volume versus efficiency. Across those three seasons, they have rarely had problems scoring with Harry Kane the benchmark performer, more recently assisted by significant goal volume from Heung-Min Son and Dele Alli. The last two seasons have seen the team average over 17 shots per game and land over six of them on target. These volumes are league leading and mean that even if the skew is towards long rangers, there is still plenty going on from in close. Indeed they take around as many shots as their rivals from within a median league distance of around 21 metres. So in the bigger picture, the overall profile may seem unattractive, but it does mean the team also creates a decent volume of solid chances. Finishing Part of the reason Tottenham’s title bid faltered last season was that they enjoyed very little in the way of a boost to their shooting, in terms of conversion. We see time and again, to win a league, you tend to need a combination of quality and fortune (or at least a non-model defined positive skew). In 2015-16, Tottenham converted their shots at a league average rate. This was good in terms of their imbalance towards longer range shots, but not enough to propel them far enough ahead of an expectation to lead them to compete late into the season. Leicester absolutely flew on this front and it was just one of the factors that helped them home. This season is different--they are well ahead, beyond the flat conversion and an expected rate. This is the kind of skew a team with strong metrics needs to propel them towards a title bid. Only problem being, that it can occur at the exact same time a rival is flying. In 2013-14, Liverpool’s metrics were great and they skewed positively off them--so did Man City. In 2011-12, Man City and Man Utd both did too. This year? Well, no surprises, Tottenham have walked into Chelsea’s heat. Now finishing skill in itself is extremely hard to identify, even career long sample sizes are too small to tease out a reliable signal, so the best we can assume here is that players with a history of overachievement compared to expectation may be above average finishers and Tottenham’s three main goalscorers all show up as ahead of expectation over samples available. Beyond this, and what’s powering the front end this season is that Kane, Alli and Son are all enjoying an extremely good run of finishing ahead of even long term rates:
 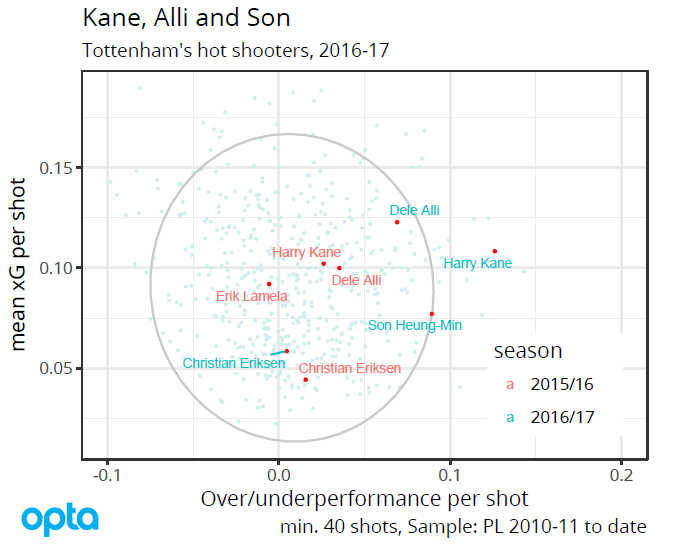 Outside the ellipse can be regarded as very likely to be a temporary existence and the fringes are pretty sparse too. Last season’s numbers show quite how variable finishing rates can be, with each within “normal” range. We get information about style here on the y axis; none of Tottenham’s players record a regular high average value per shot; Kane the nominal striker in the system shoots from all areas, and he is no routine poacher. The team has the shot volume to compete, and they are over shooting expectancy; a potent blend that has meant that they have stayed in the title hunt late into the season. Again: a hot finishing run has nearly no predictive value and because of this, teams and players can only hope that they find themselves in this exact situation, they cannot plan for it. Teams can plan to employ techniques that allow them to control play and outshoot the opposition, and the more successful they are at that, the better placed they will be to enjoy any positive skew that comes their way, as Tottenham have done here. Defence In simple terms, Tottenham’s defence has followed a trend around the top of the table, insofar as they have shed some of the shots they were conceding last year. Indeed it’s down around two per game from eleven to nine. There’s a resulting decline in expected goals against that understandably trends the same way. What influences are running here? One obvious change has been the addition of Victor Wanyama as a defined defensive midfield destroyer, most often in place of Eric Dier, but with the bigger teams in the league all showing extremely low shots and expected goals against volumes this season, it may well be a broader trend. Possession (as defined by Opta) for Tottenham has risen year on year by a couple of percentage points (~57% to ~59%) and the team has added on around 40 passes per game, almost all of which can be credited as short and completed. The light implication here is a combination of patience and control. These are aspects that have not always been part of the Pochettino armoury. In his first two seasons at the club, the team often seemed to lose focus around the 60-70 minute mark, a trend that wasn’t helped by a seemingly stratified substitution rota that rarely adapted in a timely manner to specific on-field issues. It didn’t always create demise, but a 2-2 draw at home to Stoke in the second game of 2015-16 and a 2-1 defeat at home to Newcastle later on that autumn are both examples of games in which Tottenham controlled a large portion of the game before wobbling and letting winning positions slip away. If we look at last season’s chart of expected goals by minute, this concern is borne out:
 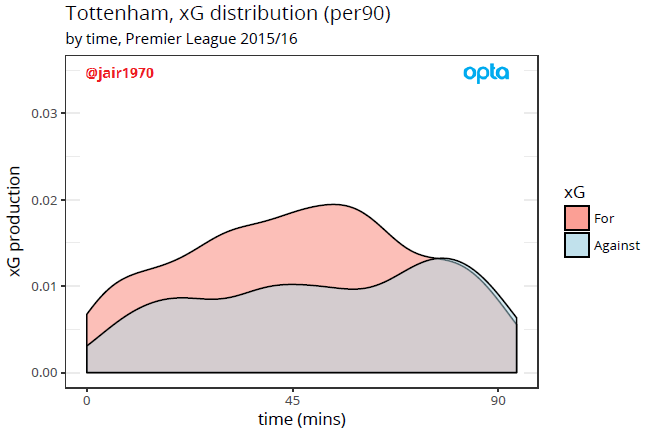 Tottenham fans will recognise that pattern, as described. Significantly outcreating the opposition until around halfway through the second half, where from then on in they actually allowed a higher value of opportunities than they created themselves, as the opposition often found their strongest period of the game. Reasons? Firstly, tiredness may well have come into play when factoring in the heavy workload and pressing Pochettino demanded from his players, but also situations in which the team was trying to sit off to protect a lead they may have earned prior. Regardless, being outperformed in that last quarter is not an optimal strategy, should the opposition finish chances, there is less time to respond and points are easily lost. This season appears to have seen a shift in emphasis, as we can see here:
 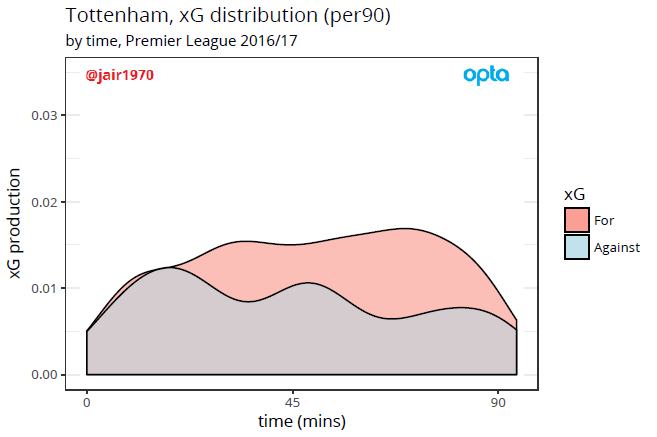 A more even spread, but importantly, the late decline we saw last year is gone, while the opposition levels decrease as games get later. Perhaps Pochettino’s hard running strategy has only got about 60-70 minutes of realistic effect? Would certainly be a more logical way to approach strategy to keep it tight to start before turning the screw. (A quick look at game state after 32 games year on year sees Tottenham having spent very similar volumes of time winning (33-34%), drawing (53-54%) and losing (13%), so it feels like that probably isn’t something that has had a significant influence.) One further factor that Tottenham have continued to benefit from is how infrequently they drop more than a goal behind. Last season in the league only in the emotionally empty final round 5-1 defeat at Newcastle did they fall two goals behind in a game, and this time round have only faced such a deficit for four minutes in the 2-2 draw at Manchester City and 72 minutes in the 2-0 defeat at Liverpool. They concede infrequently, but when they do, they rarely fail to respond. Room for improvement? The obvious gaps in Tottenham’s season revolve around two areas; games against rivals and European form. Last season, even allowing for the mixed time some of the big clubs were having, Tottenham went 3-6-1 against “big 6 rivals”. The only two times they significantly dominated the play were in the 2-2 home draw against Arsenal, in which they took 26 shots and landed 11 on target, usually more than enough to win, and in the 3-0 home win against Louis van Gaal’s Man Utd, in which a flurry of goals killed a game in which they dominated. Otherwise, games against rivals have been tight affairs, a trend that has carried on into this season. They have only won two of eight against these teams and all three of their defeats have been recorded against them, away from home. In none of these fixtures have they really shown clear dominance, even the wins came in tight affairs. Two of these fixtures remain; by chance the two fixtures described above, Arsenal and Man Utd at home, and if the team is to transition further, Pochettino needs to identify a way of translating his tactics to tougher games. So effective when able to dominate, they have often faltered against strong teams. The Champions League defeats against Monaco read significantly better than they did at the time, but we can add in the games against Bayer Leverkusen, in which the team were comfortably outplayed. Few teams are able to dominate their direct rivals, but if Tottenham are to continue an upward trajectory, this is the next problem to solve. Still young A return to the Champions League augers well for the future and immediately removes one aspect that could cause players to agitate for transfers, and new contracts have secured key players on long term deals. While the team has benefited from a positive boost this time round, the method in which they have dominated lesser teams does not preclude future success by any means. They are a fit, well bonded unit that buy into their manager’s methods. Christian Eriksen, Son and Kane are all entering their peak years, while Alli remains a unique young talent with a fantastic sense of timing. The defence and goalkeeper look set to remain and are well drilled and attuned to each other. It’s an ideal basis to continue to build from and a little more shrewdness in the transfer market than was seen in the summer of 2016 might well be decisive next season. Once more, Tottenham can see a good future ahead of them, but at some point they need to turn the promise into a trophy winning reality. _________________________ Thanks for reading @jair1970 *near as damnit
What's the ideal length of passing motifs?

In my last entry I pledged to answer this question using the 'repeatability' methodology I presented there. This will be a quick entry to confirm that luckily, we've been right all along and 3 is the ideal length to consider for passing motifs. The number of passes considered in a passing motifs analysis is a clear instance of the trade-off between detail and comparable structure that we discussed in the previous entry. The Figure below shows the number of motif types that occurred in the 2015-16 season of the Premier League depending on the number 'k' of passes we choose as 'length' from 3 to 7: 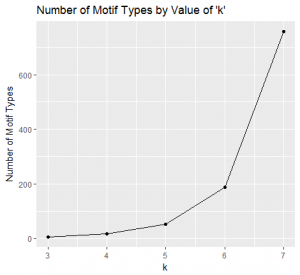 When we choose to consider 3 passes, there are 5 motif types which I hope all my readers know by heart by now: ABAB, ABAC, ABCA, ABCB and ABCD. If we choose to go up to 4 and consider one extra pass, there are 15 different types: ABABA, ABABC, ABACA, ABACB, ABACD, ABCAB, etc. For 5-passes long motifs there are 52 types (all of which occurred at some point in the 2015-16 season), and for 6-passes long motifs there are 203 (of which only 187 types occurred in the 2015-16 data). There were 759 different types of 7-pass motifs in the data. We can appreciate how the number of motif types grows quickly with the number of passes we are considering, which precisely lends itself to losing structure in the noisy haze of excessive detail. The Figure below shows the number of motifs for the 2015-16 season for each number of passes 'k' considered:
 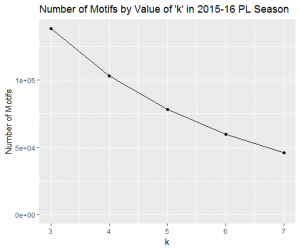 There were 138,432 3-pass long sequences compared to 45,820 7-pass long sequences. While there is a considerable amount less, the data set is still of a decent size to believe that we can extract meaningful conclusions. Finally, the figure below shows the repeatability percentage as per the methodology of the previous entry for each choice of length from 3 to 7 (as before, we consider relative frequencies of the different categories rather than raw amounts):
 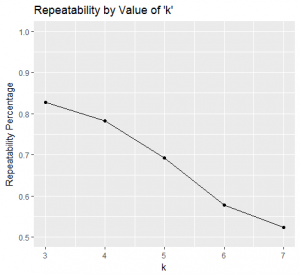 3-pass long motifs have a repeatability of about 82.7%; while 6 and 7-pass long motifs have 57.8% and 52.3% respectively. Considering that as per our methodology random methods that carry no structure would have 50% repeatability (equivalent to randomly assigning style), these figures mean that by then we've lost almost all structure. It's an interesting conclusion that sequences of 3 passes are the ideal number to consider which carry unique team structure better than longer sequences. Considering that passes constitute the grand majority of events on a football pitch, it's a far-reaching conclusion. It provides insight into breaking down the sequentiality of football matches into representative constituent blocks: looking at blocks of about the size corresponding to 3 passes should be best practice.
It's NOT the Same Old Arsenal
Around football right now, we seem to be hearing that Arsenal are basically the same as every other year, but all the clubs around them have improved. Our numbers suggest that's not the case, and Arsenal's performance on both sides of the ball has fallen off this season.
Let's start with the obvious ones, the expected goals numbers.
Attacking xG 15-16: 1.97
Attacking xG 16-17: 1.67
Defensive xG 15-16: .95
Defensive xG 16-17: 1.09
So the attack is generating .30 xG fewer per game, while the defense is allowing .14 xG more. Combine the two and you get -.44 in expected goal difference, which is a huge whack when it comes to performance in the league table.
Where's that coming from? Well shot generation is down a touch on the attacking side, 14.6 to 15, but open play shot quality has fallen from .135 to .115 per shot, so the drop in attacking output is almost all down to the quality of shots Arsenal are generating this season.
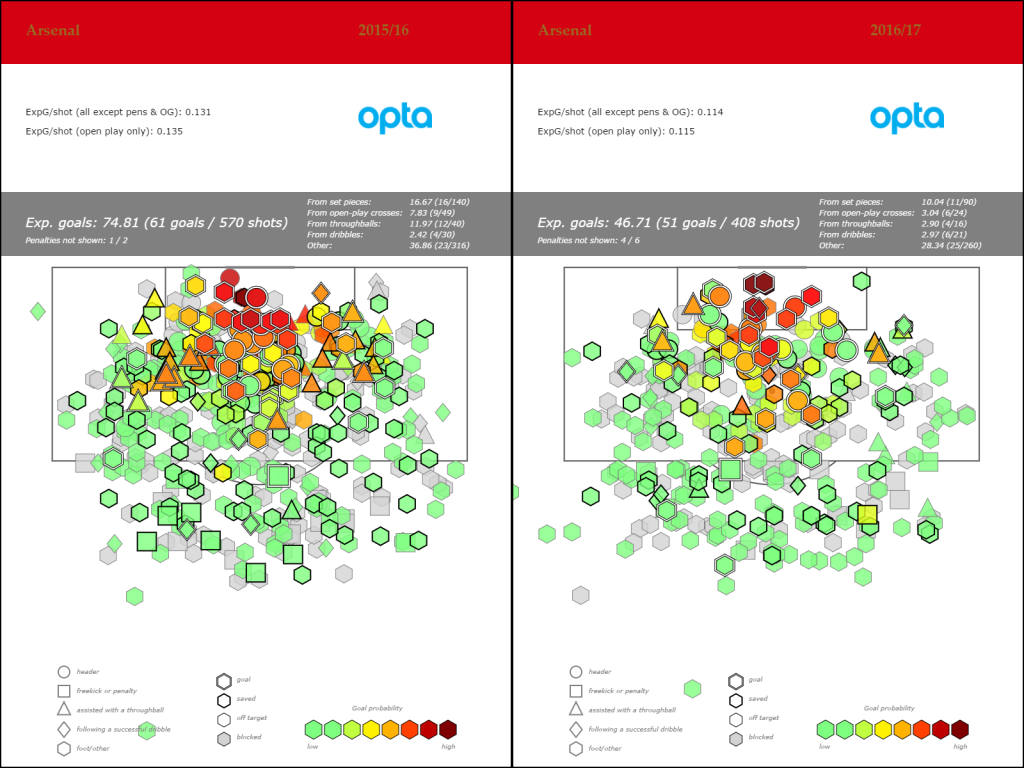
On the defensive side of the ball, Arsenal are actually giving up FEWER shots per game - 10.64 this season vs 11.82 last year. Again, the reason for the swing in xG Conceded is down to shot quality. In 15-16, Arsenal's average open play shot against was worth .075 xG. This season? .105.
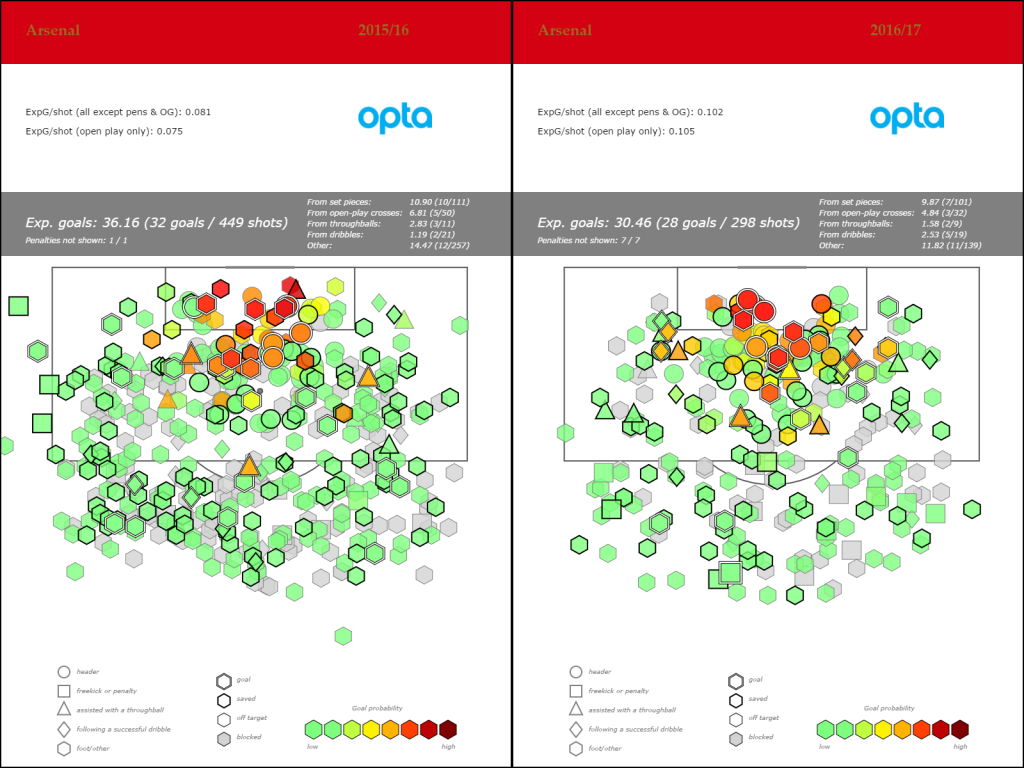
Arsenal's opponents are generating forty percent better shots than they were last season! What happened to all the long range pot shots?
In previous seasons Arsenal have gamed xG by generating 40-50% more shots than their opponents while having a huge quality differential between the shots they take and the ones they concede. This year the quality difference is almost completely gone, which has dramatically affected their expected goals numbers at both ends of the pitch. This feels like a strategic change on the part of their opponents, but maybe I'm reading too much into it.
How Do You Fix It?
This is a massive question and one that I don't really know the answer to. Are Arsenal defending badly? Have teams solved their defense, and because of that know how to create better chances against them?
Arsenal's attack is probably the best from a personnel perspective that it has been in ages, and yet that isn't exactly firing on all cylinders. Would Cazorla's presence magically heal all wounds? He only played 15 90's last year and the Gunners were much better then, so I'm not sure his absence again this year has enough explanatory power.
Average shot quality in attack is still better than the 14-15 season, but this has always been Wenger's special sauce that he brings to teams. This year it's still good, but it's no longer among the elite, and it needs to be for them to have a shot at winning the league. This year, it's just barely good enough to give them a shot at finishing 4th. This is also true because despite generating plenty of set piece chances, Arsenal are dead average in number of goals scored from them at 9.
Most worrying has to be the change in the defensive numbers. Arsenal tend to play a more passive style of defense than most of the top teams, trading shot suppression for forcing the opposition to take worse shots. However, this year they are giving up far higher xG shots, but doing it at nearly the same rate as before and basically at league average numbers. That's not gaming xG, that's just losing more games.
The question of why this is happening has lots of moving parts that seem to add up to a big problem. Monreal is finally showing a bit of age, and is no longer the elite defender he once was. though talented, Mustafi has had some issues bedding into the Premier League. Gabriel perhaps isn't as good as Arsenal thought when they bought him, and he's been forced to play right back when Bellerin is out.
Meanwhile in midfield, the aforementioned Cazorla may never be fully fit again. It's like Defensive Midfielder Groundhog Day Part 2, except instead of starring Mikel Arteta and his hair, we now have a different diminutive Spaniard playing the lead. Welsh hero Aaron Ramsey has played about the same amount as Santi, leaving Wenger to choose the so-called Dumb and Dumber axis of Coquelin-Xhaka as a double pivot, while occasionally adding El Neny, Oxlade-Chamberlain, or Alex Iwobi into the mix.
Last year's Arsenal looked like the best team in the league in the numbers, and a club that was close to taking the next steps in regularly competing for league titles instead of fourth place. This year's Arsenal looks almost exactly like their league position - likely to miss out on the Champions League for the first time in ages.
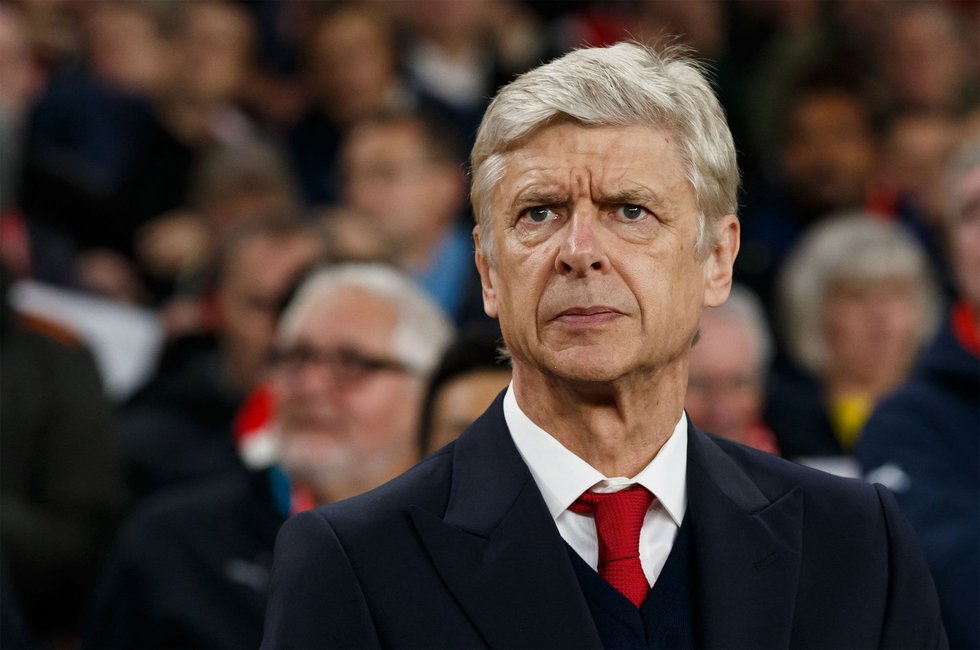
At least we know who to complain about all of this to. Unlike almost every other club in the Premier League, Arsene Wenger has full control at Arsenal. The question is whether he understands what the causes of the problems are, and whether he's adaptable enough at age 67 to rebuild this team for future title runs.
Despite a generation of good years together, Arsenal fans no longer seem convinced he's capable of anything other than 4th place trophies and Champions League knockout rounds, but they've certainly started yearning for something different.
Passing Network Autographs and Overshooting Style
There's a distinct trade-off between comparable structure and ‘granularity’ or ‘level of detail’ of football data. Imagine this: you have a player who has the ability to pick a certain type of between-lines pass that greatly increases your team’s chance of scoring in that play. With passing data, we could try and identify how this pass is represented in the data and then use the data to identify other players in the world that are also good at making this kind of pass.
To do this, we will need to break the data down in a detailed way, and differentiate this type of pass from other vertical passes that perhaps aren’t as effective. We might want to consider where in the pitch this type of pass comes from or where it finishes, what action it is preceded by, where the defenders are, what happens after the pass is made, etc.; all of this in the hope that we can clearly identify the type of pass we’re looking for and tell it apart from other passes.
However, what happens when we go too far and use too much detail? It is unlikely that each time our player performs this type of pass he does it in exactly the same way, in the same coordinates of the pitch and in the same conditions. If we start using too much detail, we might actually start classifying instances of this type of pass as different when in reality they correspond to the same sought-after ‘type’. Once this happens we are no longer capable of identifying the “type of pass” we were initially looking for, and now have hundreds of different passes that at this level of detail are all different from each other. We can no longer identify players who can play this pass because this “type” was obliterated in the detail.
I actually began thinking about this issue when reading Dustin Ward’s piece on clustering different types of passes. He decides to take 100 clusters or types of passes and see how often each team or player completes each of those types of passes. This is a good example of the trade-off mentioned above. 100 seems like a good number, it certainly reveals more info about a team than if we considered just 1 (which would basically be like looking at overall Pass Success percentages) or 2 types/clusters of passes.
Choosing 100 is also better than choosing 100,000. If we chose 100,000, then each player or team would perform maximum 1 instance in a season of highly detailed, highly differentiated types of passes. We wouldn’t be able to use this information to compare teams or players in any way. But is choosing 100 better than choosing 120? Or than choosing 80? How do we know when this trade-off is striking the right balance?
The key is having something against which to measure ‘balance’, something we want to optimise. In this entry I’ll show you an example of how this something could be ‘repeatability’:
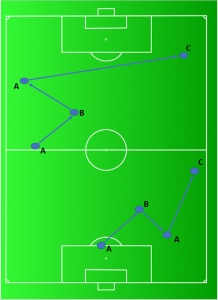
For a while I’ve been wanting to push the Passing Motifs methodology a bit further and include some spatial information about the passes to see what else it can tell us about teams’ passing networks. Below is an example of two very different instances of ABAC.
The question I wanted to answer was this: will we gain any additional valuable information about teams by differentiating different ‘types’ of motifs according to their angles, distances and coordinates on the pitch? Crucially, I also wanted to know where the right balance would be when doing this differentiation in light of our structure-detail trade-off. T
here are two ways of looking at spatial variables associated to motifs that I felt could be revealing:
x-y Coordinates of Passes: In Opta’s data files, each pass has a ‘Start x-y’ Coordinate and an ‘End x-y’ Coordinate, meaning each pass has four variables in terms of coordinates. A 3-pass long motif would therefore have a set of 12 variables representing where its passes began and ended.
Angles and Lengths: Another way of looking at it is by the ‘angles’ and ‘lengths’ of passes in a motif. The figure below illustrates how these are found.
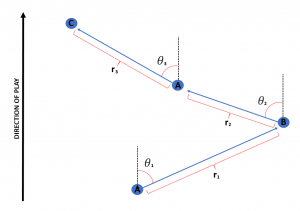
With this idea we would have six variables associated with a motif: the angle of each of the 3 passes of the motif and the length of each of the 3 passes as well.
NOTE: The thing I like about this ‘angles+lengths’ idea is that it doesn’t “care” where in the pitch a motif happened, only its geometric structure. I like this because if it has ‘structure’ or ‘insight’ into teams’ styles it will not be as heavily determined by whether the team dominates the opposition or not: if we only look at pitch coordinates of motifs then top teams like Chelsea or Manchester City will perform all of their motifs high up the pitch. Therefore, the method would be biased towards saying they perform the same ‘types’ of motifs, namely “high up the pitch” motifs. I’m not saying that this isn’t meaningful, but it is information we all know by simply looking at the league table and knowing these teams play deeper into their opposition’s half. However, if we discover structure that is independent of the league table from the geometric shape of motifs, it makes it interesting in the sense that perhaps it wasn’t correlated with "obvious" aspects.
Whichever of the two ideas we go for, there is going to be a set of variables associated to each motif, which we can then use k-means clustering to classify into a certain number of different types of motifs. Our intuition from the trade-off tells us that there is an intermediate number of categories that has the best representation of “style”. The problem is that to use a k-means clustering algorithm, we need to manually tell the algorithm how many different categories we want before knowing this optimum number.
Consider this: for each choice of number of categories, once we have determined the number of categories and classified the different motifs into the category they correspond to, we can use the best practice we know from the original passing motif methodology and look at what percentage of each motif category (in the ABAC-sense) corresponds to which ‘type’ (in a either a x-y coordinate or angles+length sense). So as an example, if we had chosen to have 3 different types of motifs, then for each team we would have this set of numbers: what percentage of the teams ABAB motifs are type 1, what percentage of the ABABs are type 2, what percentage of the ABABs are type 3, what percentage of the teams ABAC motifs are type 1, what percentage of the ABACs are type 2, etc. What we’ll have is a vector representing each team.
Now suppose we randomly divide each team’s motifs into two different sets, so now we have Arsenal’s A motifs and Arsenal’s B motifs as if we were artificially considering each as the motifs of different teams. If choosing this number of categories reveals teams’ structure or style, then the style attributed to Arsenal’s A vector should be very similar to the style attributed to Arsenal’s B vector. The more underlying structure we’re capturing, the more this effect should be obvious. If on the other hand we’ve gone too far and now the extreme detail is overshooting the underlying structure we want to discover, then Arsenal’s A vector will not necessarily be similar to Arsenal’s B vector because the extreme detail is damaging the comparability of styles. This is what I mean by “repeatability”.
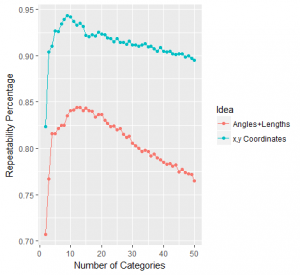
The following graph reveals how “repeatable” each choice of number of categories is for both the ‘x-y coordinates’ idea and the ‘angles+lengths’ idea:
The methodology is as follows: for each number from 2 to 50, we create that number of motif categories using k-means clustering and assign each motif to a category. We then divide randomly each team’s motifs into two different sets to have a vector A and vector B for each team. Then we check how “repeatable” the methodology by checking on average how close teams’ A vector is to their B vector in comparison to the rest of vectors representing other teams; and this process (since it involves both the randomness of a k-means algorithm and the division of a teams motifs into two sets) is repeated a hundred times for each number.
The graph shows as a percentage the average ‘relative closeness’ for each of the hundred trials as follows: I took each teams’ two vectors and determined on a scale of 1 to 39 how close a team’s A vector was to his B vector. Since there are 20 teams and I divided each one into two vectors, there will be a total of 40 vectors representing 'styles'. Considering as a focal point a team’s A vector, its B vector could either be the closest of the other 39 vectors (1), the second closest (2), all the way up to the farthest away (39). I did this for every team and averaged these numbers, to finally compute the percentage that the outcome was of 39 (this was done using passing data for the 2015-16 Premier League season).
Right off the bat we find evidence of the balance we’ve been speaking of. When we start increasing the number of categories we start obtaining more repeatability, meaning we can more closely recognise two vectors as being the A and B vectors of the same team because they are similar (i.e. close) to each other. I like to interpret this as uncovering more underlying information that uniquely identifies a team’s passing network style: no matter how we randomly divide a team’s motifs into two sets, we roughly still know which sets correspond to the same team because we know the “style”.
We then reach an optimum number of categories for which this repeatability is optimised: for the ‘x-y coordinates’ idea it’s at 9 and for the ‘angles+lengths’ idea it’s at 13. After this, the repeatability starts to decrease meaning that a team’s A and B vectors start to not be as similar to each other because they’re made up of highly detailed motifs that are overshooting the underlying “style” of what it actually is that a team inherently does with its passing networks.
We have answered our initial question: The original passing motif methodology (found in this entry) in which we took the 5 different motifs and compared teams according to how much they relatively used each motif had about 83.3% repeatability as per our methodology. By breaking motifs down into an optimum number of categories for the ‘x-y coordinates’ and ‘angles+lengths’ ideas (9 and 13 respectively), we were able to increase our repeatability to 94.3% and 84.4% respectively (evidently the 'x,y Coordinates' has better repeatability than 'Angles+Lengths', but as we said before any structure from a purely geometrical classification is interesting).
Below is a set of boxplots illustrating what the 9 categories represent in terms of the different 'x-y' coordinates:
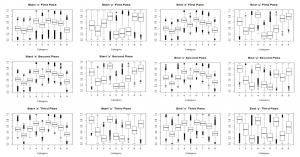
As an illustration, if you look at categories 4 and 8, they both begin a bit past the halfway line really close to the left touchline, but while in Category 4 motifs the three-pass sequence ends a bit further up but still on the left hand touchline, the Category 8 motifs made their way across the pitch to finish closer to the right hand touchline.
The 94.3% repeatability of the 'x-y coordinates 9 category' vectorisation is incredibly high. In fact, if we remove Sunderland and West Bromwich which for some reason only have 80.2% and 83.5% repeatability respectively, the other teams have an average repeatability of 95.7%!
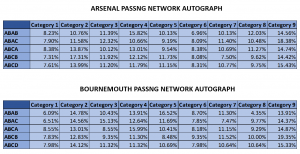
These results mean that we’ve managed to pin down an underlying structure in teams’ passing networks that allow us to identify unique team styles (lets call it "Passing Network Autographs") with a high degree of confidence. We’re at the point where if we’re given a set of motifs we could have a robust educated guess at which team they correspond to and most likely be right (except perhaps if they belong to West Brom or Sunderland for some reason). As an example, below is a comparison of Arsenal's autograph versus Bournemouth's (the team whose 'autograph' most differs from Arsenal's):
Perhaps some readers might be unimpressed with this rather theoretical and un-applied result, but although I admit that in its raw form this seems a bit unmanageable, I would advise them to keep an open mind and think of the potential. For example, having such a reliable ‘passing network autograph’ for teams, we can look through players from outside the Premier League and find those whose current passing network best fits within a team’s autograph.
We could also use our measure of team style to try and predict which styles are more effective against each other, or which defenses are the best at interrupting the attacking flow through a team’s passing network. These possibilities probably sound more appealing to most readers, but in order to do them in a meaningful way they must be underpinned by theoretical confidence that we are indeed identifying team styles. I will try and follow up this theoretical entry with a more applied one exploring some of these possibilities later this month.
I want to finish this entry off by highlighting the important potential of generalisation these ideas have. I feel they’ve helped me establish best practice when it comes to breaking passing motifs into different categories according to their spatial properties (and by best practice I mean knowing how many categories I should break it up into); but the method can also be used to determine best practice in other ideas currently being explored by football analysts.
For example, during my Opta Forum Presentation’s Q&A, Marek Kwiatkowski asked whether the passing motif methodology could be generalised to motifs of more than 3 passes. The answer is that it can, but we run the risk of going too far and start overshooting the structure that the methodology helped us identify as team and player passing style: for 3-pass long motifs we had 5 motif types, while only going up to 5 or 6-pass long motifs we’re already at 52 and 203 types respectively with wacky things like ABCADBA. The ideas presented here can help us answer the question whether it’s worth looking at longer motifs (another entry soon perhaps?).
It can also help Dustin Ward to establish exactly how many types of passes he should consider. In general, it helps us to establish standardised best practice that the whole of football analytics will benefit from and that its currently distinctly lacking.
Echoing Marek’s piece on the state of analytics:
“Established scientific disciplines rely on abstract concepts to organise their discoveries and provide a language in which conjectures can be stated, arguments conducted and findings related to each other. We lack this kind of language for football analytics”.
We need common-ground theory in which our public work can be related and compared, and it’s worth truly understood. The lack of it is holding back all of us who have an active interest in the field really taking off. I hope this approach to improve our understanding of our ideas and take steps towards enhancing them and establishing best practice can inspire other public (and even private) analysts to attempt similar things in their work and establish bridges through which we can compare and complement our work. Valuable applications will inevitably flow from robust, interconnected theory.
MATHEMATICAL FOOT-NOTE:
Comparing the distance between A and B vectors as their position from 1 to 39 on the closest-farthest away scale may seem a bit unorthodox and one might consider simply using the z-score of the distance between teams’ A and B vectors in the context of all the distances between all 40 vectors. However, the reason I don’t do this is that for each different choice of the number of categories, the dimension in which these vectors are is different, and on a personal mathematical note I have deep mistrust in comparing distances between things that are in different dimensions.
P.S.: I want to give a brief mention to Ben Torvaney who gave me a small but meaningful contribution which I feel greatly enhanced the results of this entry.
Premier League Relegation Wrap
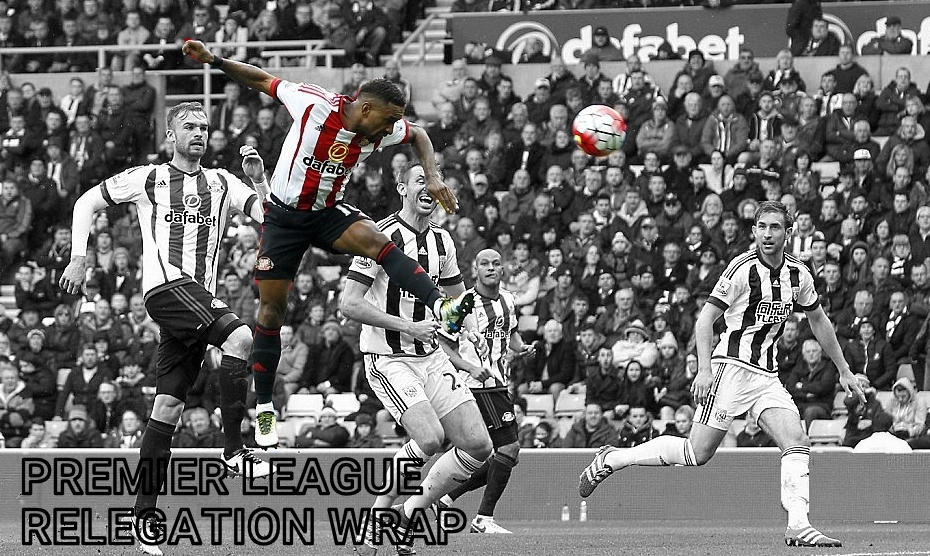 Nine, ten or eleven games have passed since the halfway point in the Premier League, with as ever the lack of progression in scheduling contributing to the imbalance. One day the league will realise the strength of its product and create 38 distinct game weekends or midweeks and that irritation will disappear and analysts will rejoice. In League 2 every team has played 40 games, so it’s not impossible to organise and the abandonment of World Cup qualifying, the Carling Cup, the Euro and a full and extremely hard "Brexit" will herald an era of fixture common sense sooner rather than later, perhaps. Back here in fan and TV company land, we are in the middle of a ten day stretch in which all the teams play three times, which is fun, if wildly impractical given a smattering of players have just returned from playing qualifiers in the four corners of the earth. Injuries have started to mount up across the league as the business end kicks in and the March international break remains as perplexing as relentless Christmas football and the transfer window shutting three weeks into the season. Football evolves slowly--this is not news--but some tweaking around fixture scheduling seems a smart thing to address, for all that it won’t happen while they are giving out “Winter” World Cups to be held in sauna conditions. Anyway... Sunderland On the pitch, or at least in the statistical representation of discrete events collected and coded, a few aspects in the league appear to be set, and in particular at the bottom of the table. Sunderland’s woeful season shows no sign of resuscitation and even a Sunderland-style great escape looks likely to be beyond them now. Eight points behind Swansea, albeit with a game in hand, their 20 points accrued is paltry and behind positions they’ve conjured escapes from previously, and significantly so:
  It’s been truly dismal stuff once more from the Black Cats, who have consistently shaped like A Bad Team across most of the last four or five seasons. Metrics indicate they were as bad as anyone bar Aston Villa last season, during 2014-15, their attack shot less frequently than any team in the league and 2013-14 was barely better. They have been fortunate that for a number of seasons the Premier League has had a jam of mediocre to bad teams at the bottom and that with no small amount of good fortune has spared them. This time round it’s a step too far. In only two games have they created anything like an impressive shot volume, at home vs Middlesbrough (18) and Leicester (22) and only twice have they limited the opposition to under 14 shots, against Watford (9) and the same Middlesbrough game (8), which they contrived to lose 2-1 anyway. Jermain Defoe may have carried the goal weight but his limited skillset seems an odd fit here, this is a Moyes team after all. He never heads the ball--he records a headed shot about once in every ten games and hasn't registered a single one all year--and has noticably failed to get chances close to goal:
 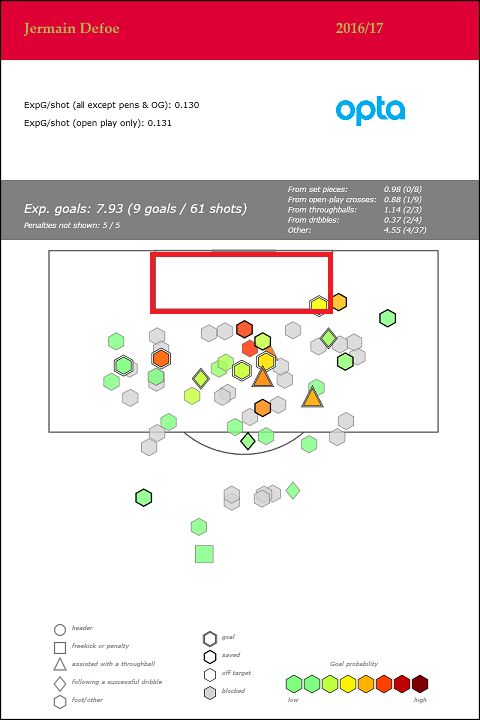 At 34, has he lost a bit of speed? Probably. And nobody else is backing up, and Sunderland just don't get in close. If we define a super close shot as one within 8 yards of the centre of the goal, Sunderland have the worst record of any Premier League team this decade, having notched just twice. Defoe doesn't get good chances close in, and nor do his teammates. Who does load up the chances and the goals from in there? The list is laden with title winners such as Man Utd 2012-13 or Leicester 2015-16 or Man City 2013-14. Oh and Stoke 2011-12, which may well be peak-Pulis, and clearly represents the difference in how to formulate a defensive strategy but also potentially optimise towards making the most of limited attacking panache. Alongside Middlesbrough and er... Tottenham, Sunderland's expected goals per shot is at the bottom of the league, so we have the simple problem of a team that creates few, low quality chances. It's far from ideal. David Moyes’ devolution is complete. At Everton he appeared to be a methodical and pragmatic coach powered by an extensive knowledge of players and shrewd use of the transfer market. Now he has overseen a truly dismal season, and is reported to be threatening reporters. Internal problems may have contributed to his collection of former charges arriving en masse, but if ever we needed a case study of how a manager’s stock can disappear almost entirely and quickly, this is it. That he remains in a job is curious--is there half a plan for him to rebuild from the lower league? While the club has previously bounced back quickly from Premier League relegation, the added investment in Championship clubs in recent years means that a swift return is less likely, so perhaps the idea that an experienced Premier League dinosaur is the right man to helm a recover appeals. Newcastle look sure to manage a quick return, but their structure was built in such a way that relegation was only ever likely to be an unfortunate blip for what should have been a solid Premier League team. Sunderland, much like Aston Villa before them, have suffered from multi-year failures and a cumulative effect. Middlesbrough Where Sunderland have been traditionally miserable, Middlesbrough have brought a new flavour of demise to the table. Their defense is quite good, or at least fairly limiting. It’s just that it comes at a price; they have no attack whatsoever:
- This decade only that Aston Villa team (2015-16) have created a lower expected goal rate in attack (both around 0.8 xG per game)
- They have only exceeded the league average shots (13) just once in a league game all year (16, v Hull)
- They haven't exceeded four shots on target in any game
- They have only beaten one team out side the bottom four, Bournemouth. They also beat Sunderland away--and we know how bad they are-- and Hull and Swansea at home.
All this is horrible, as is the contrast in Álvaro Negredo's two seasons in the Premier League. His Man City tenure was part of one of the great attacking seasons in recent league history. This is not. He has four non-penalty goals, a couple behind expectation, but it's hard to attribute blame; he's had so little to work with. Steve Agnew seems a likeable fellow but his enthusiasm that "one win turns the season, and I'm more than confident that win is very close" wildly denies the reality of the extreme peril his team is in. Boro have blinked too late this year and failed to solve any of their problems, which were evident from very early on. Exactly because it took them so much time to descend into the bottom three--even as February drew to a close they were 16th--masked genuine failings. It's a situation that a rudimentary analysis would have helped with. This team had and still has a huge problem in attack, a stifling lack of creativity and while Karanka deserved his shot in the league, warning signs were clear even in the early weeks and now they look adrift.. Installing Karanka's assistant as caretaker looks a move loaded with denial. Too little, too late, and another misstep. They will return to the Championship having endured a forgettable season. We are waving goodbye to those two but the question remains, who else? Probably safe West Ham and Burnley are probably a win or so from safety, but having been on six and seven game runs without one, could well do with getting a positive result soon. West Ham don't project as a bad team per se, but have struggled to keep clean sheets all year in a form similar to the other bottom sides. Only six have been registered, coming in home matches against Bournemouth, Sunderland, Burnley, Hull and Palace and their away game at Palace too. Traveling to Arsenal in midweek, the home game against Swansea this weekend looks an ideal opportunity to get their noses closer to the safety line. Burnley, well praised for their home record and gritty style, nevertheless project fairly badly as they have done all year. They are still a few goals ahead of expectation, but that Tom Heaton has garnished much of the praise is revealing. Their safety will prove a job well done, but a poor run such as the one they are on now was perhaps inevitable and will need to be halted soon. A forthcoming home fixture against Stoke appears non-threatening as does a trip to Middlesbrough but the schedule gets tougher thereafter. Once the confidence goes and the spirit fades, it can be tough to find leaders in the dressing room... etc etc copyright all papers... Palace look to have finally hauled themselves to a position of near safety too, thanks to their four game winning streak. Their schedule is still not easy, but it appears the Big Sam method has now taken hold. He said when he arrived that it wouldn't be until March that his players got to grips with what he wanted from them and their win streak started on the 25th of February, so he was almost right. How Sunderland probably wish they still had him. It has been an odd season for Palace. Their numbers never painted them as bad as their results, but that was a very typical Alan Pardew problem to have, and Allardyce's early form looked terrible, crowned by the 4-0 defeat to Sunderland. Stability now could be their ceiling, and if that's the case then it's somewhat of a shame as their squad does have talent within. But that's the flipside of the security Allardyce brings. The team probably won't go down, but next year it's unlikely to hit heights. Swansea... That leaves Swansea and Hull looking most likely. The tale is similar for both teams. Accepted wisdom is that in Paul Clement and Marco Silva, the two clubs have relatively young, progressive managers with bright futures in front of them. The reality is that while that may be true, the raw tools they have to work with right now--and the reason their are in these jobs--paint a less favourable picture. Life is tough at the bottom. Results have improved for both teams, and they have given themselves a fair chance of survival, but beneath the surface, they are both Still Quite Bad. While Sunderland and Middlesbrough's chief problems were the complete lack of a functioning attack, Hull and Swansea had been defensively suspect throughout having conceded more goals than the rest of the league, at rates commensurate with expectation. Clement has at least partly stemmed the flow in defence. They are still conceding too many goals, but he has got the shot levels down. He's helmed 11 games now, the same as Bob Bradley, shipped 19 goals to Bradley's abysmal 29, and the team is conceding around twelve shots per game, which is decent enough, it's just they aren't saving enough of them. That looks solvable, but the apparent cost of this limitation in defence is a neutering of their attack. Ten shots per game is weak and lower than his two predecessors, albeit by a small margin. A hot season from Gylfi Sigurdsson and the aerial prowess of Fernando Llorente has distracted from the underlying attacking frailties, and the run of two defeats and a draw featuring just one goal in vital fixtures against Hull, Bournemouth and Middlesbrough really hammers home the problem. A raft of fixtures against teams preparing for their holidays might help them but the Leroy Fer factor is hard to deny. He appears to be Premier League kryptonite, and can sink any team. ...and Hull The same recipe holds at Hull. Silva has effected change in defence, but not in attack. His team has been allowing around 13 shots per game, but has failed to increase the attack beyond ten. This is significantly better than pre-Silva in which they were allowing around 18 shots per game with a similar attack to now. Rightly castigated for conducting the summer transfer business five months late in January, Hull have nonetheless have positioned themselves on the coattails of Swansea and with a fair chance of survival. It's fascinating that both coaches looked to solve their problems in identical ways, to turn their games low event and hope to eke out points. Stemming the flow was necessary and an obvious strategy, but the combination of the anchor of their early form and misfiring attacks will likely finish with one of them relegated. At some point caution will no longer be enough. Projections find it relatively hard to separate them, and the forthcoming careers of each of their managers will pivot on their final finishing position. Each has shown enough to think they merit further time in the league, but whether that is next season and with their current clubs remains to be seen. ____________________________ Thanks for reading @jair1970