Should Swansea Sack Garry Monk?

boots 
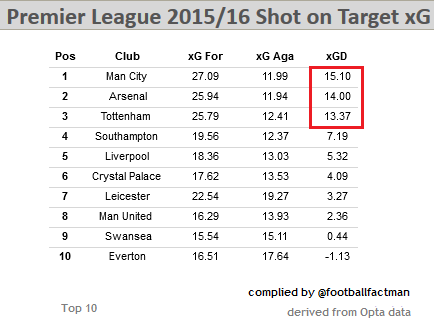
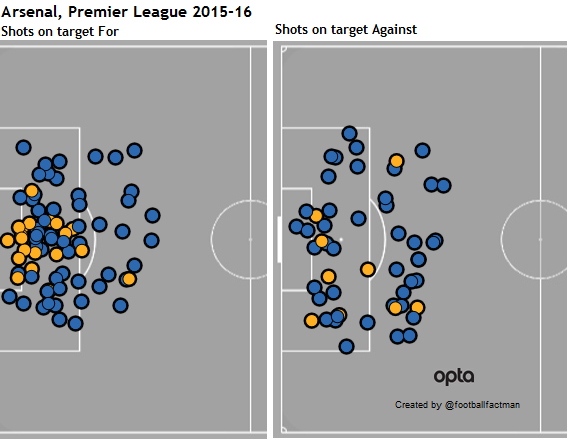
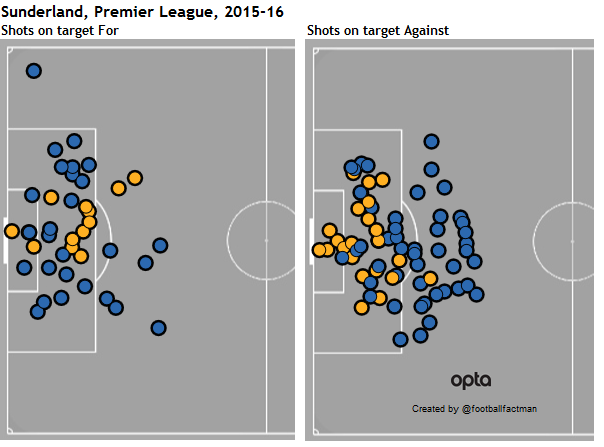
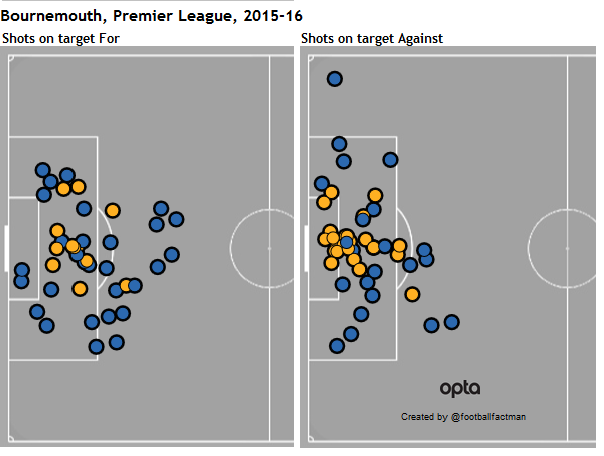
Losing at Anfield is hardly going to increase the pressure on Garry Monk as much as losing to Norwich did. However the two games had an identical feature; on each occasion Swansea managed eight shots, none of which required the opposition keeper to make a save. With a key function of creating goals being an ability to invite the keeper to stop the ball, these numbers make grim reading and are a low watermark in what increasingly looks like an attacking drought. Swansea flew out of the blocks this year with good results and performances against teams that, with hindsight, had vulnerabilities: Chelsea, Sunderland and Newcastle, then a sneaky traditional win against Man Utd. Since then though, they have only once exceeded a league average shot total (14 against Stoke) and haven't managed to exceed the same for shots on target (4.4) at all: swans1 
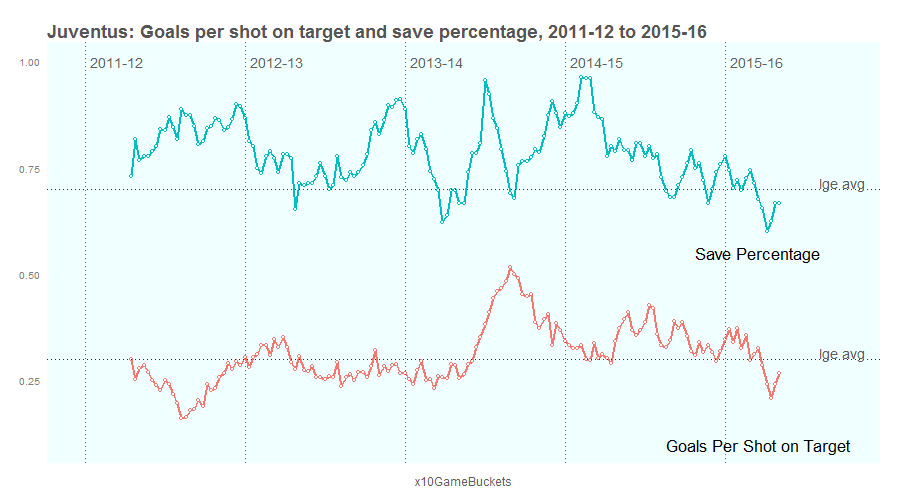
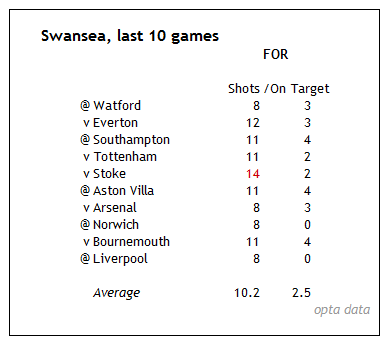
These are distinctly moderate totals against a variety of opposition and fascinating in their consistency.  In contrast their defensive numbers have been more erratic without being cumulatively bad. Swansea are a reasonably low event team (5th fewest) but their general shot ratios are okay and peg them as a slightly below average team, albeit one that is going through a rough patch. A significant driver is in their ~8% shot conversion which ranks them 19th with only Villa below.  There's room for improvement as there is in their 67% save percentage, a couple of clips down on league average. The upshot of all this is that Swansea are projecting to be a slightly below average Premier League team.  The factors that they have the largest degree of control over and that represent their true quality, largely related to their shot volumes, tell us this.  The factors that are far more prone to fluctuation and random effects, like the rate in which the shots are going in, tell us they have been on a downslope but there is little reason to presume that this is a long term structural issue. So why is Monk currently trading at a similar price as Steve McClaren in the "Next Manager to Leave" markets? Using a version of Team Rating, we can take a look at a points expectation for the years that Swansea have been in the league and compare it to their actual points gained: swans3
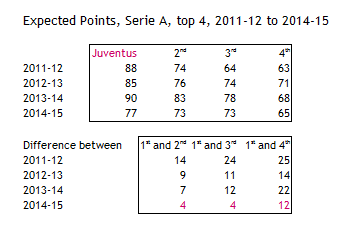
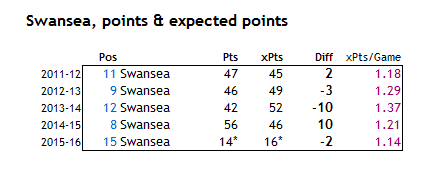
What this shows is that Swansea's actual performance levels are broadly in line with other seasons, or at least close.  Last season was a big overachievement both in points and position and some kind of reversion to a prior level was a plausible prediction. Where they previously landed at the top of an expectation, they are currently residing at the bottom.  Simple random variation is likely to cause a team to oscillate between a maximum and minimum level, neither of which is likely to exceed last year or cause any threat of relegation.  They have been a 45-52 point team since arriving in the league and it is probable that they will again land in a zone close to that projection- anywhere from 8th to 14th. Should Monk's job be under threat? Probably not, but it depends on his internal benchmark and the measures that are being analysed within. There are three reasonable scenarios that could be in play:

  1. If Swansea's board is taking a traditional view of performance by merely viewing the league table, then three wins in 14 games is exactly the kind of run that creates panic and causes chairmen to act rashly. In this scenario, he's in trouble.
  2. If the board is aware of the wider but relatively simple analysis (or similar) that has been done here, then there is little reason to have any concern with overall long term performance.  Monk hasn't effectively improved his team but nor are they in real decline. However:
  3. If within his remit he has been tasked with tangibly improving the performance level of his team, then he has had nearly two years in the job and has not achieved that. His future job security in this scenario would be under threat.

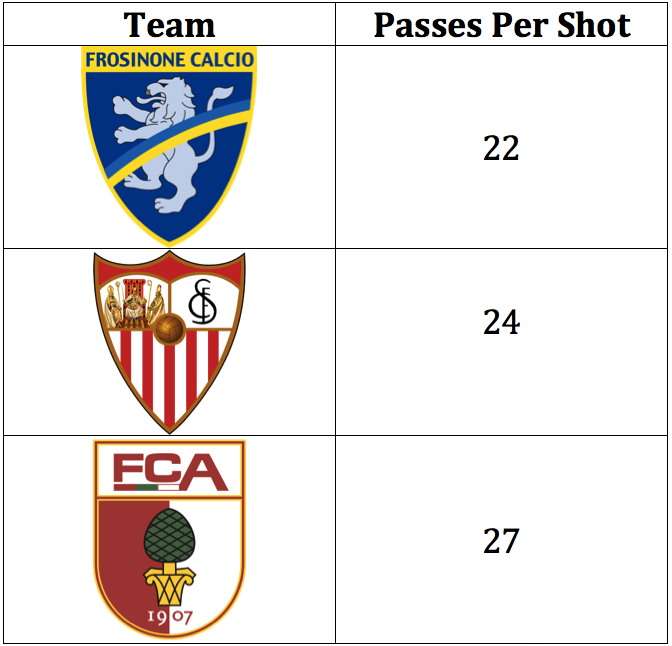
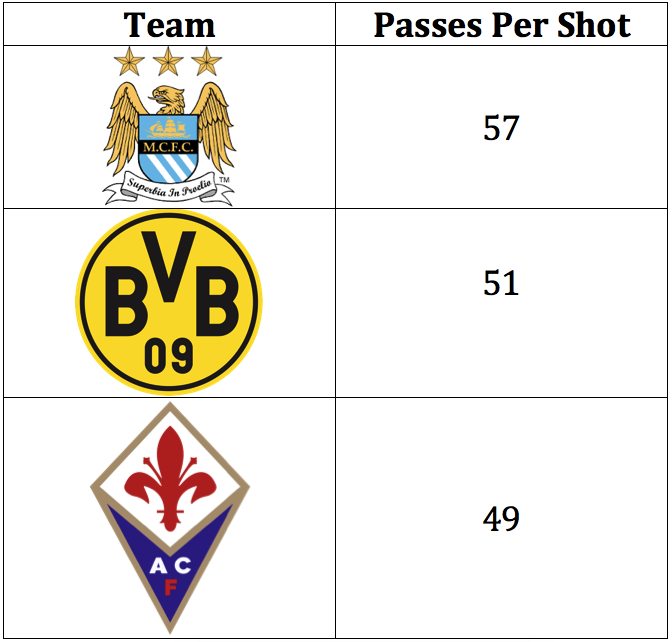
Of course there may be further non-performance issues around the club, as Dan Barnett discussed in a recent blog. The 8th place albatross that hangs around Monk's neck is largely irrelevant when defending or condemning him. Overperformance in one season followed by underperformance is a dangerous recipe for a manager's prospects, but in themselves, the random fluctuations of a team's outputs don't tell the full story. As Mark Taylor showed here it can take an extremely long time for a league position to be accurately representative and Garry Monk might well remind his chairman that at his next meeting. Newcastle Representing an entirely different kind of consistency we find Newcastle. Finishing off their tough early schedule by allowing Man City to annihilate them allowed room to breathe and it could be reasonably expected that recent weeks might have found a superior level of performance.  It hasn't really happened. The adrenalin high of the 6-2 victory against Norwich allowed hope to emerge briefly before they predictably choked the derby match, had the better of a 0-0 against Stoke, fluked a victory against Bournemouth and got successively crushed by Leicester and Palace. We can talk of this lunacy as consistency in the wake of John Carver's unforgettable "Mr Unlucky" run at the back end of last year, a plight which mirrored Pardew's pitiful late run overseen the season before.  What saved those two teams was their early season performances and goal getting, something that has been largely absent this time round. Having picked up 23 and 20 points respectively in these seasons on the way to final totals of 49 and 39, the ten points accrued thus far look an both an extremely thin cushion and arguably generous, especially when factored against truly dismal shot numbers. Nothing even suggests that they have been particularly unlucky and it's painful to recall that they were second highest net spenders in the league in the summer.  Quite what they got for their investment remains to be seen. In contrast to Monk, Steve McClaren's possible retention seems a dicey prospect: "they were bad, they spent money, now they are possibly worse" is a recipe that necessarily upends a sword for somebody to fall on, and where the board have been slow to act in the past, the financial carrot of Premier League survival may well prove decisive.  Sadly for Newcastle, famed firefighters Pulis and Allardyce are engaged elsewhere so McClaren may end up getting the time he desires to somehow pick up their game. The new target is unlikely to be mid table though, to be the best of the worst may be as high as they can aim for now. Reasons not to buy Aaron Lennon volume one The thought process is clear. The team needs an option on the flanks and a bit of league experience wouldn't go amiss. Looking at available players, a name appeals. The guy comes in on loan, he plays a few times and does okay. Why not make a permanent deal? At his best the player was top class, an international with speed and hard work, a threat. The player isn't old, he's got a few years left in him. This guy could work well in the squad! The key here is expectation.  I'm picking on Aaron Lennon here, but it could quite easily be Ibrahim Afellay or Morgan Amalfitano or any number of "could do a job" type signings down the years.  Often players that have a pedigree in the league or were formerly at a large club.  Their fee may not be huge but they will want the wages of an established professional. Specifically what i'm looking at here is the role of a wide player. Most times, at least part of the armoury of a wide player is an ability to dribble the ball.  So, if that is what you are expecting from your older purchase, you might be disappointed: pl contrib by age
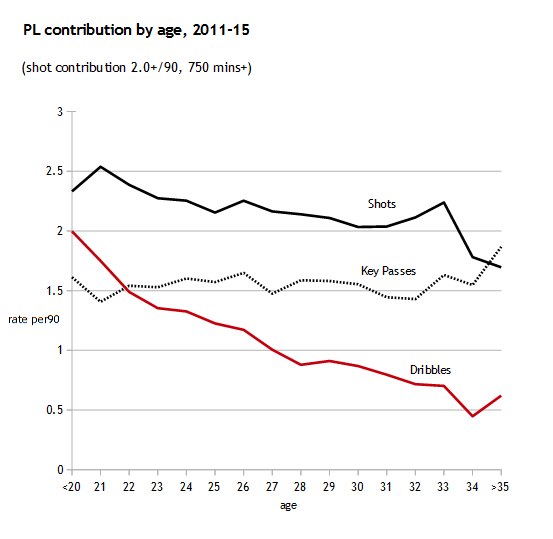
To ensure that we are looking at players that contribute to a team's attack the cutoff point has been set at a shot contribution of two or more per 90 minutes and the sample is most stable between 22 and 31 years of age. These trends persists however you slice the data in relation to shot contribution or time played.   Compare the possible difference in output between a 22 year old on a three year contract and the same for a 27 year old. If a club wants players to run with the ball it is likely to be cheaper and more efficient to employ one or two young prospects and allow them the chance to exist within your squad–with little potential downside–than to go out and purchase a typical older professional "squad man".  There is also a smaller but nonetheless noticeable trend within shots. Of course, these are just but three of many factors to consider. If you want a clue as to how efficiently your club is using the transfer market, look at the ages of the players they are signing. While a top player can perform strongly into their thirties, an average player may well have started a decline long before.  Again which is preferable? A 22 year old with value at the end of their contract and possibly their best years at the club or an older player, possibly hindered by prior injuries or in decline eating away at the budget, rarely playing and with zero long term resale value. lennon 
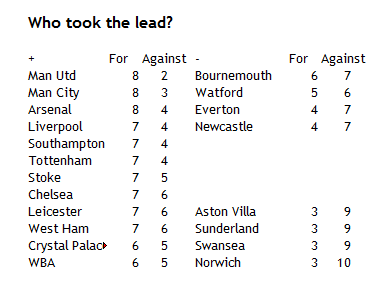
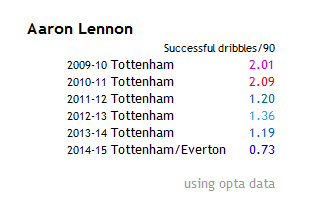
Aaron Lennon has played 202 of 1260 (16%) available minutes this season and has a three year contract taking him through to his 32nd year. Obligatory Tottenham section Another draw for specialists Tottenham. It's amazing to think that nobody told Jose that one point was insufficient for his team prior to kick off.  Maybe he's not big on projecting point totals?  Season low totals for shots, passing percentage and possession for Chelsea here did little to disguise the intent, though in fairness their general play wasn't so bad until they hit the final third.  Such a contrast to both the brilliance (in endeavouring to come back) and ineptitude (conceding five) they showed at the Lane last season. Tottenham, with Mason inexplicably starting ahead of Lamela, continue their long unbeaten run, though the fourth home draw of the season is a habit they must relinquish if they want to contend at the level their numbers imply they are capable of doing.  Liverpool lurk uncomfortably close behind for now, and one can't presume that Arsenal will continue to injure themselves with such regularity or that United won't continue to succeed despite themselves. Not losing is a great habit to get into though. The fanbase are universally happy and after a week in which title talk was mentioned, the more realistic suggestion of a solid crack at the top four has returned.   ____________   Thanks for reading!  

Stuttgart: The Team That's Always Behind

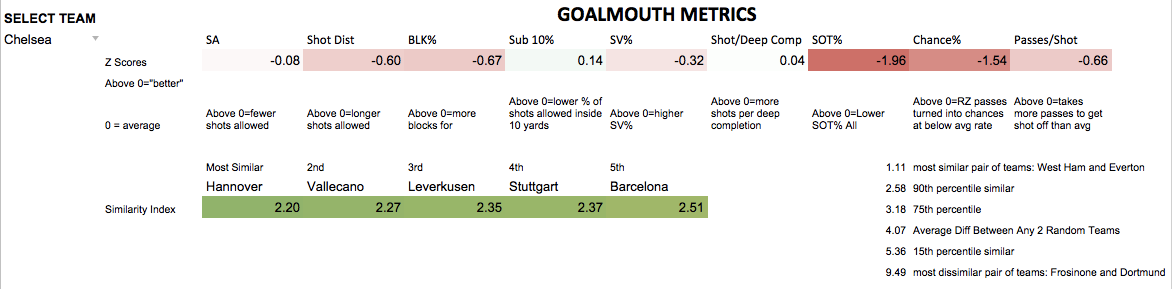
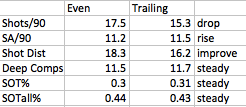
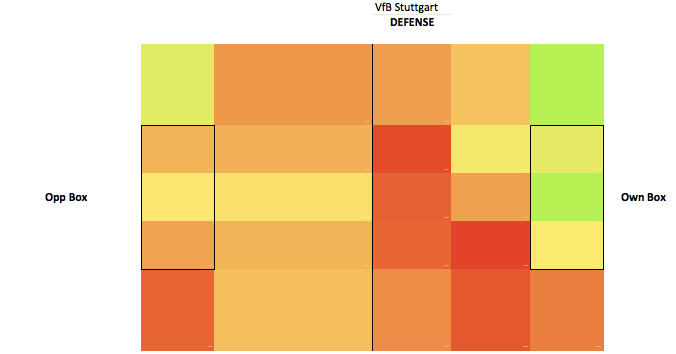
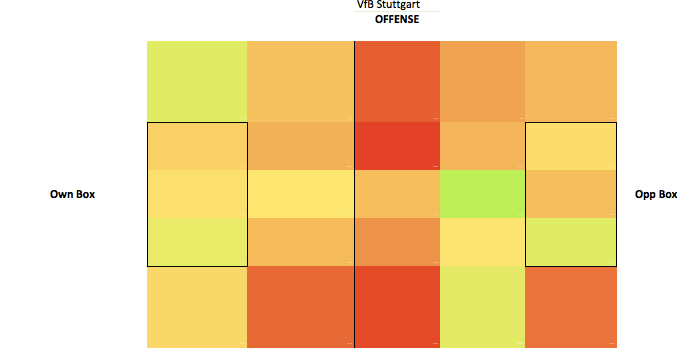
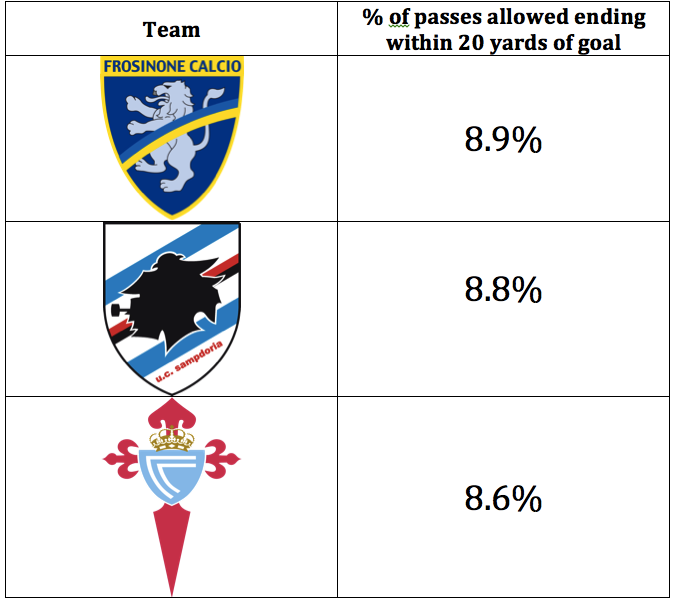
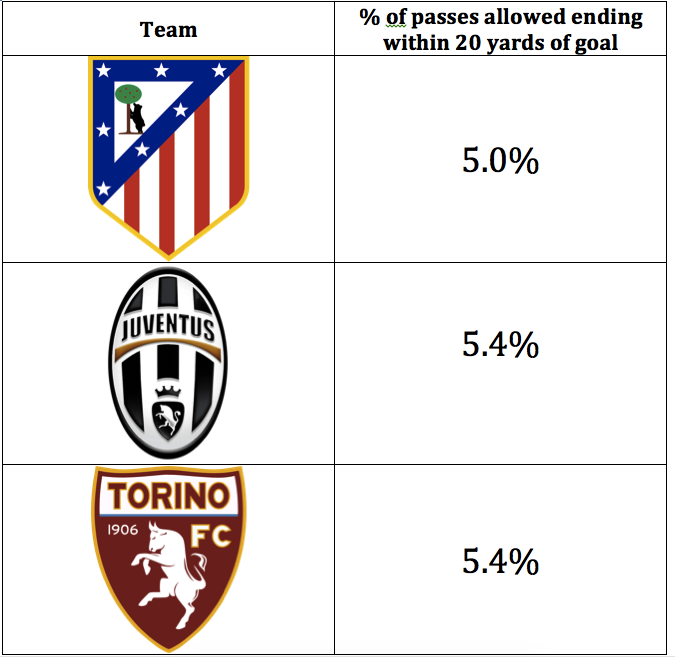
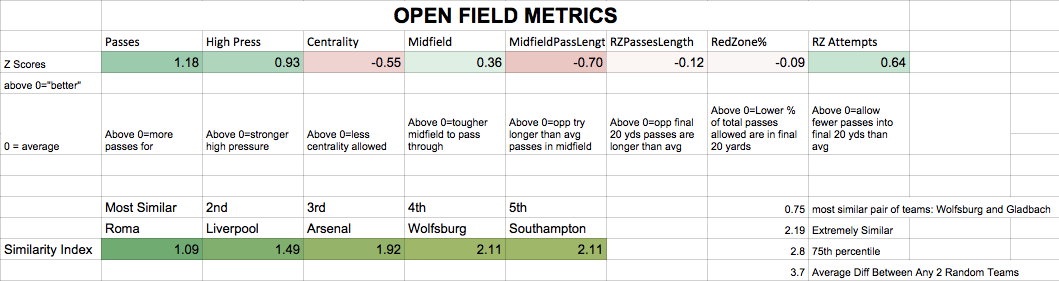
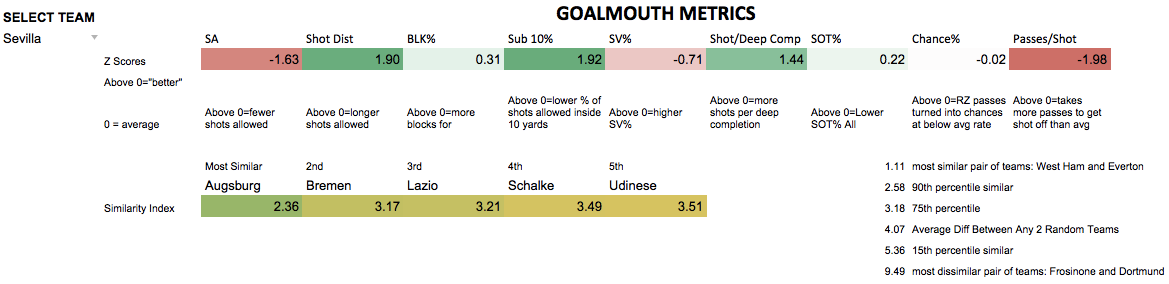
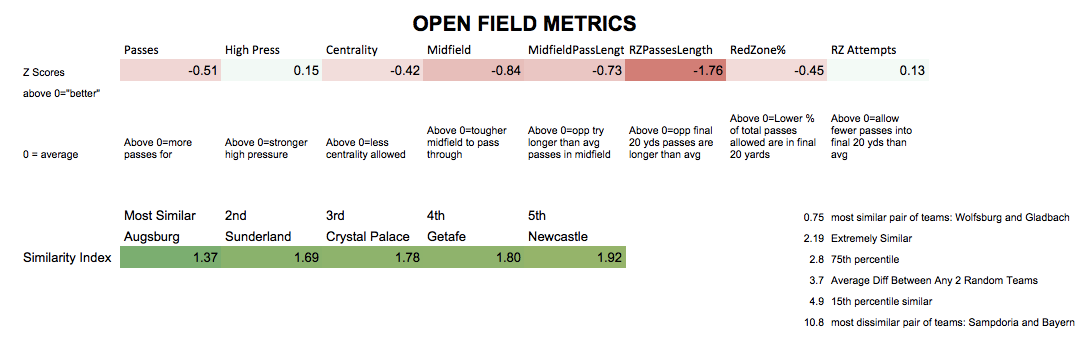
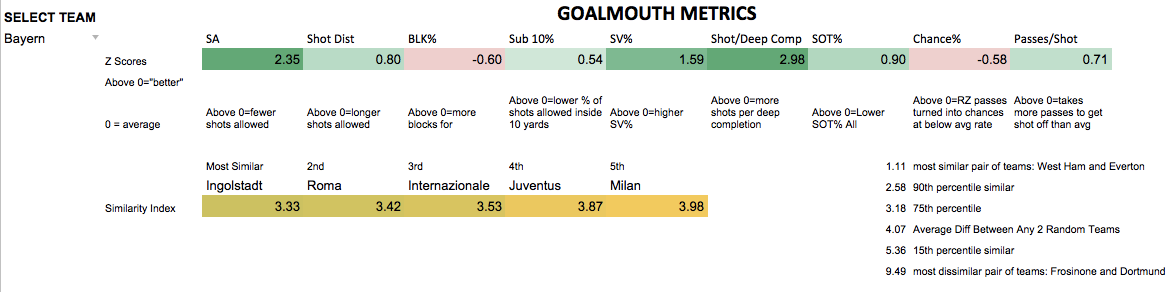
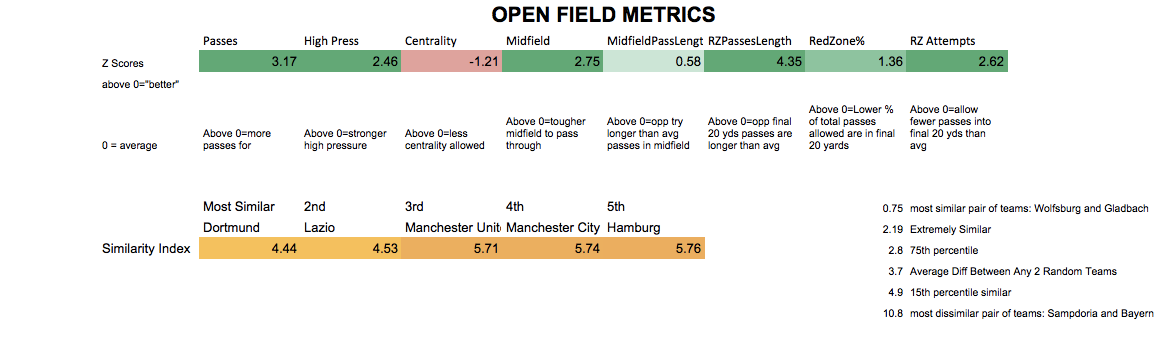
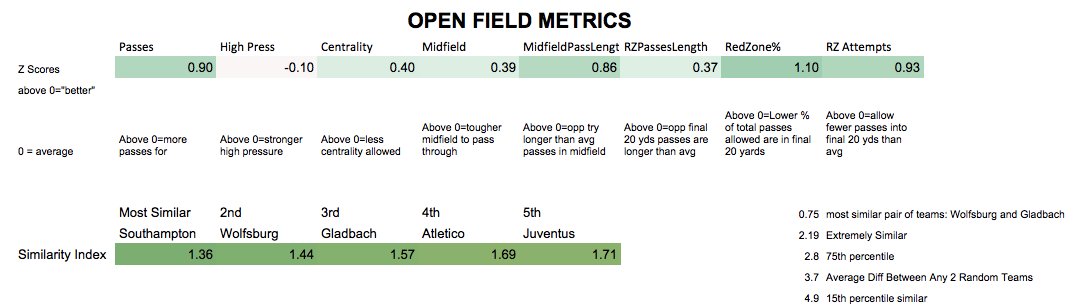
  Stuttgart have been quite the puzzle in the early season.  After a few games their underlying stats seemed to indicate a massive jump from last years team that just missed relegation, the only bother was a few unlucky losses. Now we are nearing the break and they are still in the bottom three and still have the underlying numbers that back a very good team.  A quick look at several different metrics shows the pieces that don't seem to fit: Snip20151126_2 xG is taken from Michael Caley's great resource.   The worst goal difference in the league with a points total to match despite Champions League level shot and territory statistics. Let's split it up: Snip20151126_3Snip20151126_5     Defense is where they have been by far the worst team in the league. No other team has conceded more than 25. There isn't really much here to explain: the underlying territorial and shot data suggest a very good team while everything that happens after the shot leaves the foot is horrible for Stuttgart. There is a lot more luck in shot conversion but there are a few worrying signs that suggest that while Stuttgart are not one of the worst teams in the league, they do have holes that are keeping them from performing like the European contender their shot and territory data suggests.  

  1. Box Density

This is a stand-in for defensive pressure. I've gone through each and every shot Stuttgart have taken and allowed from under 20 yards to chart the number of attackers and defenders in the box. Judging pressure on shooter, defenders in the way, and goalie position would have been great but I stuck to a basic, easy to count stat, and one that is the least open to interpretation. I've only charted around 200 shots but have noticed a big jump in conversion rate between 4 and 5 defenders in the box (not counting the GK). This makes some intuitive sense as if the defense is set enough to have the back four plus someone else in the box, it should be able to get some pressure. Snip20151126_12 Time permitting, every shot in the Bundesliga will eventually find it's way into my database and some sort of more statistically sound conclusion can be made but for now it's safe to say shooting into a packed box is less valuable than a thinly populated one. This metric is bad news for Stuttgart. When the game is tied, Stuttgart are taking 61% of shots against a packed defense while opponents take just 43%. This almost certainly undersells the gap a bit as a handful of Stuttgart chances allowed have looked like this: Snip20151122_24 Snip20151122_28 where the defense had decent numbers but was sliced open for an uncontested tap-in. Stuttgart have gotten one or two of these but their close-in chances tend to look more like this:   
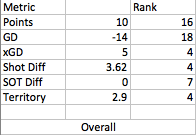
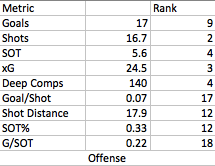
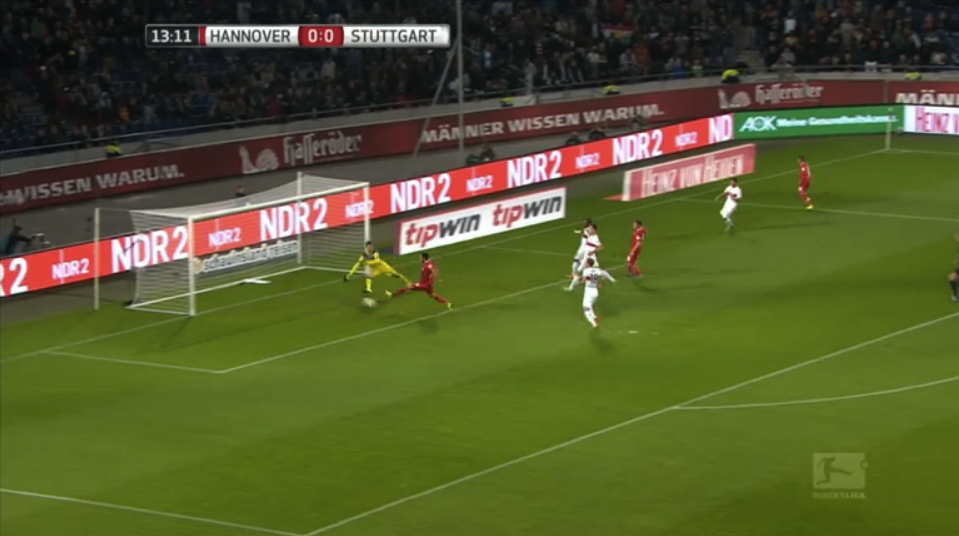
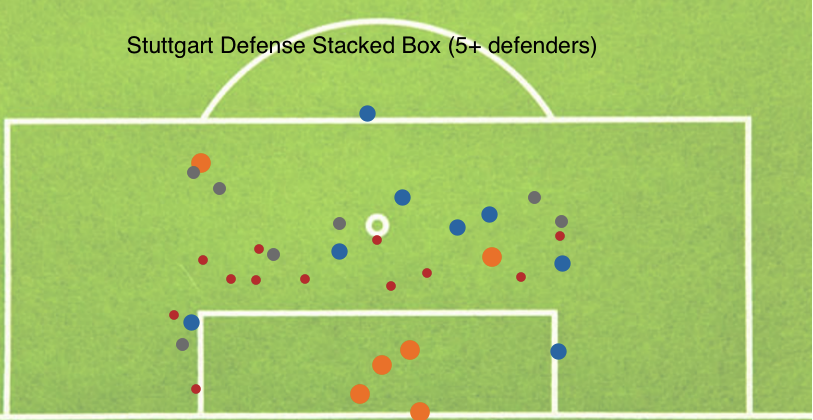
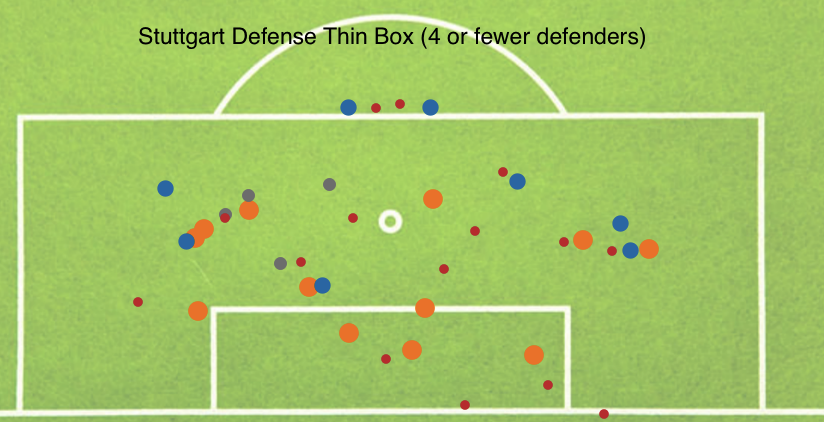
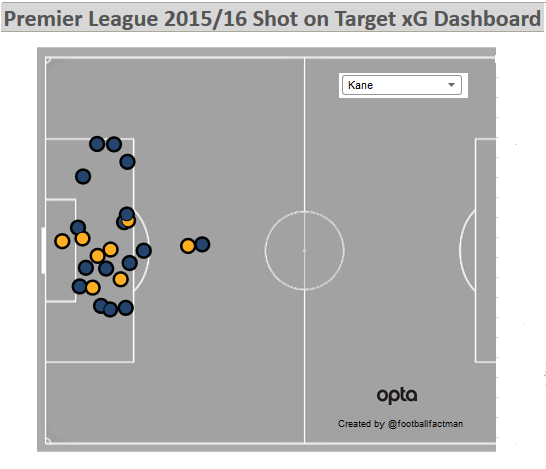
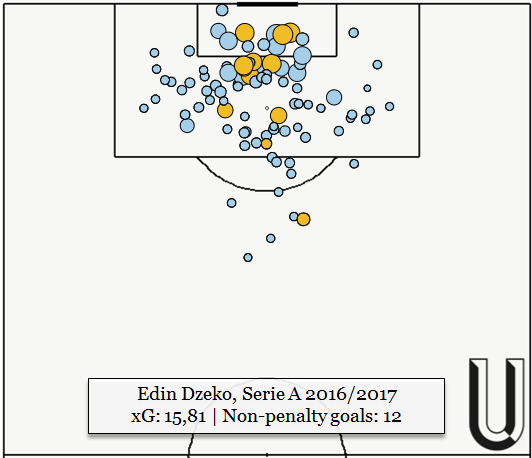
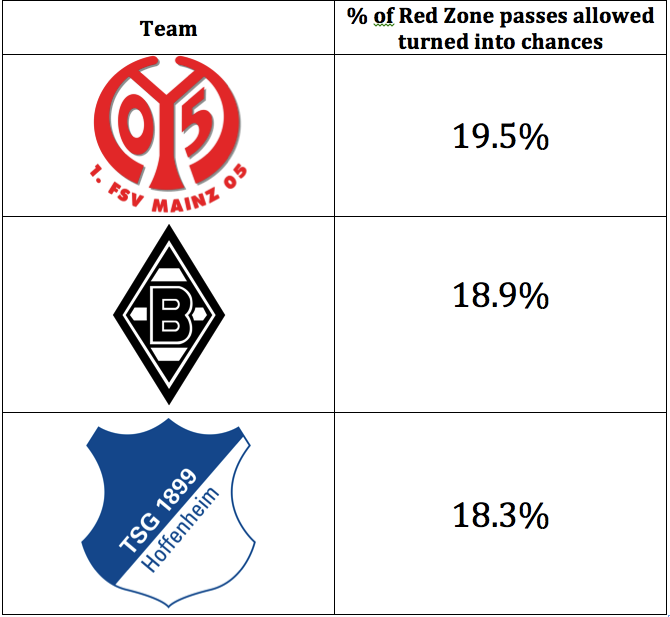
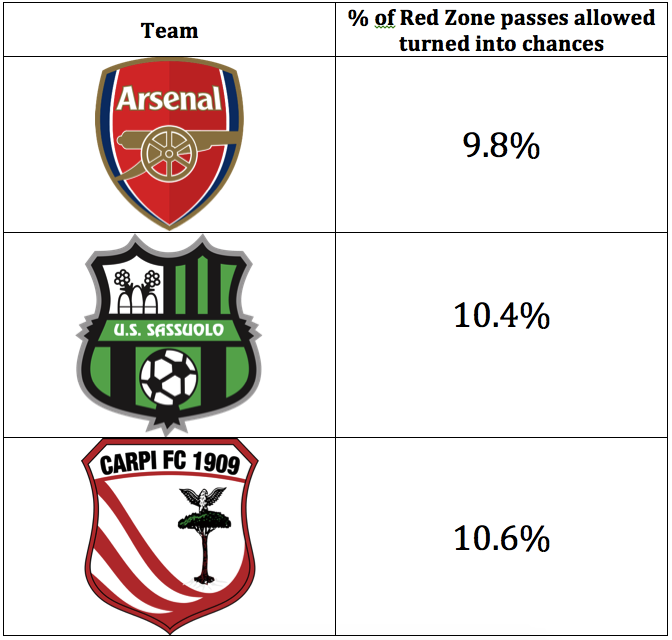
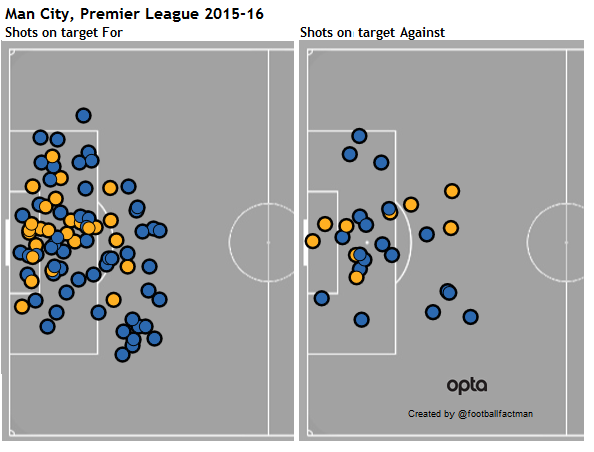
These are examples and not every single shot, but Stuttgart's close shots have been tougher than their opponents. When their defense is set, they aren't conceding goals at any crazy rate (except for the 3 tap-ins Bayern created) but when they can't get set the goals start flying in. orange=goal, blue=save, gray=block, red=miss. Snip20151126_10   Snip20151126_8   2. Game State As 11tegen11 reminded us this week, Game States always affect totals. Stuttgart have shown a huge skew. We know (thanks to Objective Footy) the average team spends a quarter of the time ahead, quarter behind, and half tied. Stuttgart have been behind early and often to the tune of 40% behind, 14% ahead. So we've found why their shot totals are so high, right? Wrong. Stuttgart show a fascinating pattern when trailing that flies in the face of what you expect. Snip20151127_25 The normal team sees shots for increase, shots against decrease, quality of shot decrease and quality of shot allowed increase when they go behind as they chase the game. For Stuttgart, none of that happens. This is strange and when put together with point #1 suggests that Stuttgart are essentially always functioning as a team who is trailing. They are aggressive with their pressing (only Leverkusen rates higher) from the get go, but don't turn it up higher when behind. They have the same amount of deep completions/90 when they are behind as when they are even and shots go on target both for and against at rates that mirror each other. This all points to a team that doesn't have another level to go to when they fall behind and can help explain some of their statistical strangeness. The territory and location numbers that reflect a Champions League contender are inflated through a play-style that provides plenty of opportunities to get the ball deep but each one of those to be a little less valuable than normal teams. They are facing packed defenses more often than their opponents and are caught out of position more, especially at even game states. This leads to bad goal% stats and passing charts that look like this: Snip20151127_19 Green represents areas where it is easier than average to complete a pass. Stuttgart is a high pressure team in the midfield and in the opposition half but you never want to see green in your own box. It is what you would expect for a team that is out-of-balance and overcommitting. If I could tell the team one thing going forward I would say to relax a bit and do not try to force the opening goal. We can't give them easy chances early in games in our haste to get a goal. Now if this isn't a Champions League quality team is it as bad as the table says? Almost certainly not. You knew that from the shot totals alone though. This is still a team that has had some bad luck, only 3/12 shots from inside 5 yards have gone in for example. It's a average to slightly above average team that on first glance can fool both the old-school table reader into thinking they are strong relegation candidates and the more advanced stat reader into thinking we are seeing a CL-quality team suffer.   Player Notes   Alexandru Maxim certainly deserves a run of starts over Filip Kostic if we are looking only at offensive statistics. Last season Kostic posted a 0.82 passer rating (a stat that compares actual completion% to expected completion% based on length of pass and starting location) and Maxim posted a 1.00. The non-Bayern attacking players who reached 1.00 were Reus, Kagawa, Kiyotake, Max Meyer, and Didavi. Kostic was near the bottom last year and is again with a 0.85 rating. Maxim has out of this world numbers, his 1.08 rating is in 2014 Robben+Ribery territory. Maxim also is involved much more (15 more passes/90) and takes more shots/90 with the caveat that he has only played 350 or so minutes. Maybe there are defensive problems but when you have a guy passing so well on the bench and the left side of your attack hasn't passed the ball extremely well: Snip20151127_22 I'd give it a shot.   Daniel Didavi continues to put up otherwordly shot totals: his 4.8 per 90 only trail Lewandowski for most in the league.   Martin Harnik was taking his shots from an average of just 13.5 yards out before going down with injury. Timo Werner is at 13.5 yards out on average as well over 26 shots. His goal rate should rise if he can continue to get those shots.   Here is the shooting map: size correlates to shots taken, darker color=higher SOT%. Snip20151127_27 Passing Map. Position indicates average position when they attempt a pass, size indicates passes/90 and color indicates passer rating. Snip20151127_24

The Race for the Top 3: Ligue 1's Frenzied Situation

Sigh Over a third of the season has passed in Ligue 1 and so far we know a couple of things. One, PSG are far and away the best team in France which we kind of already knew going into this season. Two, Lyon aren't the title challengers that some people had hoped for (which I said in my season preview). Even with the injuries piling up and some perplexing results domestically, there's a good argument to be had that they'll still end up being the second best team in Ligue 1. Outside of that, it's straight madness. Five points separate 2nd from 9th and seven points separate 2nd from 13th. Angers are somehow in the top five, Statsbomb endorsed Caen are 3rd, Monaco have slowly risen from their borderline farcical beginnings defensively and Marseille are in lower through some banter like unluckiness. Let's take a look at the Contenders and Pretenders. Third Place, Caen: The Continued Uprising I've said a lot about this team already so I won't continue to beat a dead horse to the ground. Caen have been damn good through 14 games and it would be amazing if in two years they went from a sure-fire relegation candidate to sneaking into the top three. A few things to worry about: their schedule has been kind to say the least as they've had the 2nd easiest schedule in Ligue 1 according to expected goals with their opposition being 5.5% easier than average. SoS Also, this is a small club and if injuries start to really pile up, I'm afraid of their performances dropping back to levels resembling last year. A bigger team in comparison to Caen, but Southampton two years ago were heading into the holidays with good underlying numbers and injuries ravaged them and they fell off the pace. Unlike some of the teams below them though, Caen look to be for the most part sustainably good and if they get through the rest of the first half of this season with their underlying numbers in the ~56-57% range and a relatively healthy squad, maybe miracles do happen. Fourth Place, Nice: Pretenders to the Throne I have to say that since I wrote about Nice's ridiculous goals/shots on target rate, they have raised their shot ratio numbers up to a point where a 6th-8th place finish isn't impossible. They're still converting at a ~45% clip which is preposterous but they rank 9th in expected goal ratio, 3rd in Team Rating (basically SoT ratio + PDO but heavily slanted on SoTR) and 2nd in expected points with 26.9 (my suspicion on their high expected points tally is that since their PDO is at 111.4, it's projecting their expected points to be probably around 3-4 points above their probable talent level). One thing to keep note, 44% of their shots have hit the target this season which is tied with PSG for the highest percentage in Ligue 1. Among other things, it's stuff like this that show the regression of Nice will happen but maybe their finishing spot is 8th instead of 10-11th a few weeks ago. Fifth Place, Angers: Defensive Solidarity and not Much Else Another shock alongside Caen are Angers who themselves have survived player departures in the summer and are hovering around the top three. Their defense has been remarkable for a club promoted, ranking in the top five in expected goals against, top 10 in danger zone shots conceded. 14 games is a decent enough sample size that I can say that Angers have an above average defense though it's helped that their schedule has been the easiest in Ligue 1. Their biggest problem is they can't create enough offense to supplement a better than expected defense. Only Rennes from 2007-08 over the last 10 seasons got into the top three with a season goal total of 38 or less goals and unless Angers start converting above their current expected goal per game output of 1.08, they'll start sinking back into the abyss known as mid-table. Sixth Place, Monaco: Defense? What Defense? Another team that has slowly but surely started to change since I wrote about them. This is a very talented offensive side who have been shambolic at times defensively though perhaps there is a light at the end of the tunnel. They've only given up an expected goal rating of 2.71 over their last three games and 10 shots in the danger zone, production more aligned with what we would expect from them. Perhaps Monaco have finally found something to work with and their matchup with Marseille this Sunday will show us whether their improvement defensively was just a small sample size mirage. And hey if it really was a mirage, they're one of the few teams in Ligue 1 who could spend money in January to try and fix those issues. Seventh Place, Saint Etienne: The Perennial yet Declining Underdogs There have been some decent Saint Etienne sides that have been unfortunate to not sneak into the top three. The 2012-13 side that featured Pierre Emerick Aubameyang finished only five points back of Lyon with 62 points. The next two seasons saw ASSE get 69 points but finished two points back each time of 3rd place (the 13-14 season in particular was rough because Monaco overperformed their probable talent level by ~12 points while Saint Etienne didn't even though they had better numbers than Monaco). I'd even go as far to say any of the past three ASSE sides would be favorites to finish third this season, another example as to just how unlucky football can be when it comes to peaking at the wrong time. The problem for Saint Etienne this season is that this is probably the weakest team they've had since 2011-12 and the competition isn't bad enough to compensate. For one, they lost their best striker in Robert Beric for the season with a knee injury, they're statistically on pace to be the worst ASSE side in the last four years and two trends are worrying me. The first trend is that their defense has declined. The mantra of Saint Etienne under Christophe Galtier is their defense will be the backbone to potential Champions League qualification. Last year through 14 games Saint Etienne had an expected goal against of 13.62 which was 2nd in Ligue 1; this season it's at 20.2 which ranks 13th. 15-16 Another trend is they've quite frankly sucked when played against any decent competition. They've had the 7th easiest strength of schedule and against Caen, PSG, Lyon and Marseille; Saint Etienne have posted numbers more aligned with bottom feeder clubs . In those four games:

  • Saint Etienne have been out shot 42-66 in total shots
  • Saint Etienne have been out shot 14-31 in terms of shots on target
  • Saint Etienne have been out chanced with a 3.14-10.23 xG differential.

If you include their 4-1 loss to Nice as well, those numbers get even worse. Point is: I don't think this Saint Etienne incarnation is good, the injuries to their defense core has weakened what was already a declining defense and Stephane Ruffier isn't good enough to make up for that. Combine that with quite frankly average attacking talent and the increasing evidence that they're outmatched against teams at their level or higher and this season has all the makings of a mid table finish. Eight Place, Rennes: Where Art Thou Gourcuff In one of the biggest shockers this season, Yoann Gourcuff's debut with Rennes will have to wait until 2016 because he's injured, Paul Georges Ntep has only played 424 league minutes this season, their big loanee signing in Juan Quintero from Porto has been a bit part of their squad and what's left of Rennes is probably another mid-table finish. Ninth Place: Lorient... Ha! Good joke, but no. Twelfth Place, Marseille: Perception doesn't Meet Reality Let's play a game, shall we. I'll give you two unnamed teams and you'll have to guess which team is which. To make this exercise fair, both teams are from Ligue 1 and Team A is from last season while Team B is from this season. The numbers used here are from the first 14 games of last season and this.

Teams Expected Goal Differential Shots on Target Differential Total Shot Differential
Team A 12.19 33 83
Team B 7.5 19 56

*Plays Jeopardy theme* So all right, here are the unnamed teams. Team A is... 2014-15 Marseille. This shouldn't be too big a surprise though I would assume PSG was everyone's first guess. After all, Marseille led Ligue 1 for the majority of the first 19 games last season playing an intoxicating high pressing game under Marcelo Bielsa. So who exactly are Team B. Well ladies and Gentleman it is... *drum roll* 2015-16 Marseille! Here's the point. It is obvious to everyone (including yours truly who happens to support Marseille) that this Marseille side isn't as good as they were last season when they were posting numbers that were title contending worthy. I mean, nearly everyone who played regular minutes for Marseille last season left in the summer and what's left is a very young mishmash team that even lost Bielsa after the opening game when he quit. Marseille's offense this year is a far cry from last year's club that led Ligue 1 with an xG for output of 31.08 after 14 games. But 12th isn't a fair reflection of how their play has been this season. They're posting numbers that should regularly have them either be in the top 3 or just sniffing around it. Their talent level this year using various metrics has them as a 23-24 point team instead of 18, which would have them on the heels of the two CL spots. Particularly against Caen/Angers/Lorient, Marseille have been terribly unlucky:

  • Against Caen on Opening day: 18-8 shot advantage, 2.3-1.1 xG advantage: lose 1-0
  • Against Angers on Sept 25: 18-7 shot advantage, 1.82-0.46 xG advantage, lose 2-1
  • Against Lorient on Oct 18: 21-6 shot advantage, 1.4-0.75 xG advantage, draw 1-1

That's 8 points lost right there. Of course you could do this exercise with a number of teams and say similar things but a 57-21 shot advantage and only gaining a solitary point is rather ridiculous. I think Marseille are still a good side and they're defensively better than they were last year in both shot suppression and suppressing quality of chances. Steve Mandanda is aging and resembling an expensive average goalkeeper, which is a problem. Michy Batshuayi has been very good this year but there are games where he's been lacking the type of service that he needs to be effective. Remy Cabella has been below average at times and at other times just terrible and Marseille have dearly missed Payet's chance creation from the #10 position. Even acknowledging those issues, this team will turn it around and be in the hunt for the European spots because even the most unluckiest of teams usually find some type of bounce back within the season if their resume is good enough (*Cough 14-15 Dortmund/15-16 Juventus/15-16 Gladbach Cough*) As of this moment, it is tough to know who finishes third and hell, maybe my faith in Lyon being the 2nd best team in France will be unwarranted soon and another CL spot is opened up. Every team has either a big flaw or dug a potentially deep enough hole that their season can't be saved. Your guess to who finishes 3rd and possibly 2nd in Ligue 1 at seasons' end is as good as mine, which shows just how chaotic France has been this season outside the all conquering PSG.

StatsBomb: Best of November

gascoigne Since the beginning of the season here on StatsBomb, we have managed to put out more than 40 distinct articles from a variety of authors.  With the nature of online publishing creating a naturally rapid turnover of content, it can sometimes be easy to miss good articles. Whether you were on holiday, busy at work, in prison or otherwise disposed, sometimes it can be hard to keep up with all that goes on. Therefore, i'm going to start doing an occasional round-up post such as this to highlight the best articles that we've featured over previous weeks. Have Chelsea been found out? by Bobby Gardiner Prior to a big transfer to rival outfit Analytics FC, Bobby used location data to explore the big topic of this year's Premier League, namely what the hell has happened to last year's Champions. Noting stark differences to last year in the areas in which Chelsea have shown vulnerabilities, he managed to show that among other factors, the opposition's ability to penetrate a once formidable defence had been key to their poor start. Leicester City and their trip to the kamikaze zone by Mohamed Mohamed The rise of Leicester was similarly unforeseen and in this article Moe looked at the incredibly high goal rate in their games, their direct play and wondered if what we'd seen was sustainable? Twelve Game Premier League 2015-16 Stat Review by James Yorke Comparing rates from seasons with recorded data (2009-10 onwards), I looked at trends and attempted to spot which teams were either performing to a solid and sustainable level or skewing off one end or the other and likely to revert to a more usual level over time. How to measure defence? by Dustin Ward The question that plagues football analytics like no other: how to measure defence? One imagines legions of analytics types nervously shuffling in boardrooms or club canteens when faced with a direct question related to this topic.  Here with typical creativity, Dustin splits measures into two sections, open play and goalmouth, builds dashboards to quickly compare and contrast rates of defensive play and offer a variety of further theories around the ever thorny issue. Pass me the ball! Serie A striker involvement 2015-16 by Flavio Fusi New contributor Flavio looked at Serie A's strike force by measuring how often they received the ball and how frequently they turned this into shots.  Using "passes received" allowed a broad analysis of their involvement and gave clues towards a player's efficiency. Game states and loss aversion by Peter Owen Returning to follow up his popular debut post on decision making, Peter turned his hand to looking at game states and attempted to identify a trend towards loss aversion from within the numbers. Since publication the post has been edited to include further paragraphs on 2015-16 Leicester.   Also this month: Why have Juventus struggled? by James Yorke Are Tottenham for real? by James Yorke Chewing on the Champions League by Dustin Ward Zlatan Ibrahimovic's Mortality by Mohamed Mohamed The Race for the Top 3: Ligue 1’s Frenzied Situation by Mohamed Mohamed   As ever, thanks for reading.    

Are Tottenham For Real?

ardiles With a litany of false dawns strewn liberally throughout their history, it's easy to adopt a "wait and see" attitude to the potential of Tottenham as a team that can contend at the top end of the table.  After the chaos that enveloped the on-pitch activity during much of last season, it was easy to presume that a new dawn was some distance from being realised.  Yet here we are in week thirteen of the Premier League and an unexpected threshold has been passed, one which makes it hard to deny that this Tottenham team, if not title contenders in this strange and democratic season, are certainly prime candidates for a top four slot: Tottenham currently lead the league for shots on target. They have 87, City have 86 and Arsenal have 81. A small explainer here is that they also lead the league in the rate in which their shots are landing on target, which is a good enough reason to not instantly proclaim the second coming and allow a genuinely warm but not piping hot appraisal. In itself, this is just one aspect of the game – albeit an important signal— but in a season that has seen Arsenal and Man City variously show extremely impressive attacking verve and deservedly lead projections for the title outright, this pitches Tottenham right among the contending pack as we enter the vital busy second third of the season: December, regular fixtures, no more international breaks, the tail end of European group fixtures, Christmas and beyond. Let's look at a few more numbers: A logical progression means that Paul Riley's Shot on Target xG model shows a close relationship between a top three:

riley 2(go here for charts and *new*: data)

I've got a bits and bobs variation of James Grayson's Team Rating that pegs them at third.  Old archaic metrics such as goals scored (=third), goals conceded (second) and goal difference (second) shape up quite nicely too.  This isn't Leicester miraculously landing on top spot having conceded twenty goals in thirteen games yet losing just once.  These numbers are solid and have been throughout the season. It's also an endorsement of this more cohesive Tottenham squad that they have managed to consistently out-shoot the opposition.  The only matches in which they haven't have been Man Utd, which featured a dour nine shots each, Stoke, in which they wobbled badly late on, and Man City, by which time it was irrelevant.  In no other game have they conceded more than four shots on target or thirteen shots, two significant numbers to maintain given they are roughly the average amount required that a team requires to expect to score once.  The league leading shot on target total hasn't been accrued by a handful of freak games either, it's it has been generated by consistency: on nine occasions have they managed six or more shots on target, more than Man City (8) and Leicester (7). Time More goodness exists here: only Palace (who have a game in hand) and Man Utd have spent less time losing all year and only West Ham, Man Utd and Arsenal have spent more time in a winning position.  In the few minutes spent losing they have a league high on target rate and a league low rate of conceding the same. Conclusions here aren't strong but on the rare occasions they've been behind they've shown fast form to reply and given the only defeat they've met was against the belligerence of Man Utd, no team has successfully taken a lead and dominated them. It's not as if the fixture list has been over generous either having faced four of last year's top seven rivals. Draws So why are Tottenham back in fifth and not elbowing Leicester off the top? All those draws. Back in around September, Harry Kane was down on his luck. To the tabloids he was "begging for a sniff of goal", his "confidence was shot to pieces by repeated failure" and he had resorted to "spending night after night barking "Why?" into a mirror before hauling his sorry but muscular torso back into Tottenham's forward line to limply fire three and half shots per game vaguely towards but not past a series of cackling and smug goalkeepers". Then it changed, almost as if confidence wasn't the real reason behind his brief barren streak, once more the net started to bulge and here we find a eight goal striker in November who leads the league in on target shots: kanne

(Find your favourite PL player here)

The upshot of this cold then hot streak has been six draws, at least half of which fall into the "frustrating" category.  When your (sole) forward isn't finding the net, results can be hard to come by, just look at Chelsea. So what is against Tottenham at this stage? Set pieces Tottenham are creating and conceding around 3.5 set piece shots per game so far this year: they've scored eight, which leads the league and have conceded only once.  This is once more an area where skill or random variation are typically related, insofar as there is very little that can be done to control the levels of conversion here.  It's perfectly conceivable to go through a season exceeding your opposition, and by some margin, what isn't possible to predict is whether or not that will happen or continue.  Tottenham are right on the sharp end of this going their way, and as ever, in a sport which averages well under three goals per game, a plus seven goal difference here in 13 games is clearly influential. Possible tiredness Anyone who has watched a Tottenham game recently will have noted the frenetic nature of the play. No space in midfield, hard pressing from the attacking midfielders and Dembele shielding the ball as if he's wearing armour.  It's pretty relentless stuff and in Pochettino's two seasons in the league his teams haven't managed to keep up this level through until May. Of course given that two is a sample of zero consequence and neither of those seasons were buoyed by the potential of qualifying for the Champions League, it's wrong to be definitive here. Though the squad look largely balanced, and the reinvigoration of players like Walker and Dembele has been welcome, the one glaring hole remains exactly as it was as the transfer window closed: back up for Kane.  When the drop off in quality from first to second choice goes from "very good" to "doesn't exist", it's a problem. There are memories tinged with "what might have been?" at Tottenham. Few fans have forgiven Redknapp for his half-baked coast towards the ultimately futile fourth place in 2011-12.  Early on in that season, that team looked set for much better as did the one full season from Villas Boas' once Bale had kicked in the turbos.  Each ended with a status of nearly but not quite but the hope this time is growing on almost a weekly basis.  The forthcoming Chelsea game, though shorn of darling of the week Alli, has the potential to define a perception already boosted by the widely seen destruction of West Ham.   Taking the lead Simple truths exist within simple measurements: took th eladAll defined from the first goal of the match, if indeed one was scored. Analysis can be short here, in fact it can be realistically rounded down to one word, which may be a record. Anyway: Swansea. City v Liverpool

As you can see some wiseguy decided he had noted a pattern in Man City's more dispiriting recent defeats: they keep getting turned over by teams that press them. That Klopp should be getting as clear a tune as he could have wished for from a strikerless eleven gave his methods a tidy endorsement but before anyone gets too carried away with what was an exhilarating first half demolition, it should be noted that this was one of those "nearly all the shots went in" starts to a game.  Man Utd did similar in a 3-0 win against Tottenham towards the end of last season and once a logically unassailable lead has been achieved, it's quite normal for games to take on a unique personality: either nothing at all happens or the strangeness continues. Man City were so bad here – and this kind of performance is becoming frustrating when held against their overall qualities – that it's hard not to frame it against the forthcoming crucial Juventus tie. Regardless, Pellegrini looked outsmarted once more and maybe felt pressure in playing at home. It had seemed that he'd learned how to deal with pressing in the non-event 0-0 against Utd last month, but at the Etihad, those tactics weren't employed and with such pragmatism absent, familiar concerns about the long term solutions to City's central midfield once more returned. Liverpool's quick resurgence has been powered by incredibly similar shot numbers between Rodgers' last five games and the five under Klopp: pool again Brendan got five points from that lot and Jürgen managed eight though he has had notably more difficult fixtures.  Now, with Firmino looking like he could be the £30m player that they hoped for and now two big victories away against money clubs, the ship looks like it's being steered away from the icebergs that Rodgers found at every turn. Regardless, it could have got no worse for Brendan, he left at a low point for goal prevention and the building blocks of a useful team were already in place. Klopp's arrival if followed by success, combined with still strong challenges from van Gaal's Utd team and Pochettino at Tottenham, offers a large enough cabal of teams to potentially affect the league and wider perception towards style.  With English teams ever conservative in comparison to the better teams on the continent, the rise of these pressing outfits could well be close to a tipping point.  We shall see.   ________________ Thanks for reading   @jair1970  

Pass Me The Ball! Serie A Striker Involvement 2015-16

icardi It's a fact: Mauro Icardi, the joint top goal-scorer of the 2014/2015 edition of Serie A (together with Luca Toni), is struggling to find the net this season. A Last season he recorded 0.56 non-penalty goals per 90 minutes, but for the early stages of 2015/2016 his scoring rate has dropped to 0.35 non-penalty goals per 90. His non-blocked conversion rate of 20% has stayed essentially unvaried compared to the 19% observed last season, but his shots numbers have literally nosedived in the 10 games he has played so far. A rate of 3.8 shots per 90 had decreased by 54% this season, to just 1.7 shots p90. Why has this happened? Apparently, the Argentinian himself knows the answer. On the 27th of October, Icardi scored the game-winning goal to enable Inter to beat Bologna 1-0, his third, and so far most recent, of the season. Straight after the game he was interviewed by Sky Sports Italia: “When my team-mates pass me the ball, I can score. Tonight Adem Ljajic assisted my goal, I will take him out for dinner!”. Other than the price of a dinner for two, these words cost Icardi a start; Mancini didn’t like his comments at all and decided to bench Inter’s captain for the following game against Roma. But was Icardi right? After 12 Serie A games, with a slightly bigger sample of games available, I thought that could be interesting to have a look at what the Argentinian said from an analytical point of view. Is he really under-supplied? And if so, by how much in comparison to other Serie A strikers? With these thoughts about Icardi’s situation, I examined Serie A strikers contribution from an slightly less usual point of view. Strikers are often chiefly judged by their overall scoring or shooting contribution, that could be analyzed both from a quantitative and a qualitative perspective. An aspect of a striker’s contribution which is sometimes neglected is their involvement in their team’s plays. For sure there are forwards capable of creating their scoring chance by themselves, but to depend on individual efforts to score goals is not usually a strategy that can be carried out in the long term, especially at the highest level of football. Indeed as a team relies on its striker to finish scoring chances, a striker relies on his team-mates to provide him with those chances; in practice this means it is best if possession can be turned into shots. In this piece I examined different metrics, all based on passes received by strikers. Strikers of Serie A First of all, we need to identify who are the “other Serie A strikers”. Until the 1990’s the striker of a team was identified by the iconic number 9 shirt, but in modern football, it’s rare to see a pure poacher à la Inzaghi on the pitch. Generally, strikers are still the main attacking threat in their teams, but their duties on the pitch are multiple, and not necessarily solely related to scoring goals. Nowadays every striker has to offer a contribution during the defensive phase by pressing the opposition or by tracking back to help their defence in their own half of the pitch. Moreover new roles are withdrawing strikers from their hunting territory, like the notorious false 9 role, fulfilled by Messi under Pep Guardiola, which a variety of managers are trying to employ, even if with results not nearly as good. During the summer transfer window almost every big Italian team acquired at least a no.9, although in the modern meaning of the role: Edin Dzeko moved from Manchester City to AS Roma, while another of the Bosnian’s ex-team-mates, Stevan Jovetic joined Icardi in Milan; the newly appointed Fiorentina manager, Paulo Sousa, explicitly asked the board to purchase Nikola Kalinic from Dnipro; the reigning champions of Juventus and AC Milan decided to double things up by acquiring a pair of strikers each: the Bianconeri brought in Mario Mandzukic and Paulo Dybala (who in Palermo played as the lone striker in Iachini’s 3-5-1-1), while Berlusconi’s team acquired Colombian Carlos Bacca and Brazilian Luiz Adriano. All these newcomers will feature in my analysis, in which I considered the volume of passes received by every forward, who, according to Whoscored, played at least 450 minutes in a central striker position, both as a starter or substitute. Since changes of position occurs often even during the same game, I considered the entire amount of time played by strikers who made the cut¹. This criterion excluded the likes of Alvaro Morata (this season he has a new role wide on the left) and every Lazio’s striker, since not a single Biancoceleste forward made the 450 minutes time cut². However excluding Pioli’s team, the 28 strikers population listed in the chart below, includes at least a single striker for every Serie A team. ¹In the entire population, only Edér played a significant amount of time in a “non-central striker position” (he played 423 minutes over 1052 wide in a 4-3-3), but still he spent the majority of his time on the pitch, playing centrally alongside Muriel in a 4-3-1-2 ²Filip Djordjevic 333 minutes; Miroslav Klose 272 minutes; Alessandro Matri 235 minutes Absolute involvement of strikers – Passes received per 90 minutes 2 12 games, and especially the first 12 games in a league, is certainly a small sample and so is difficult to play down absolute conclusions but when analysing players and certainly new players in a team, the process starts early on and a coach will be monitoring his players continually in order to maximise his team selections. As such these and the subsequent numbers offer an early insight about strikers involvement in their teams’ play in the most wide open edition of the Serie A in years. As you can see, Mauro Icardi –highlighted in the image - was right. He receives just 19.1 passes every 90 minutes, approximately 9 passes less than the league average for strikers of 28.1 per 90 minutes. What is even more interesting is the amount of passes that his team-mate Jovetic receives, who so far has started together with Icardi just four times. The ex City player, is the recipient of 43.6 passes per 90, twice the amount of Icardi, and the highest in this sample. Jovetic is a different type of striker, who likes to come deep to get the ball and who often roams a lot providing the necessary links with the rest of the team, while Icardi is more of a poacher (in the modern interpretation of the role), who puts goals above everything else and prefers to stay into the penalty box as much as possible. Yet the outcome confirms the main deficiency of Icardi’s style of play: he is not particularly expert in supporting the team overall, and he spends much time isolated on the pitch when Inter has the ball. I feel he has already partially improved this flaw, but he has still a lot of work to do, and he can’t blame only his team-mates for his lack of passes received. Overall the other only striker who receives at least 40 passes p90 is Paulo Dybala, who has been Juventus best striker so far (0.39 non-penalty goals p90) despite a difficult start of the season for the Bianconeri. Jovetic and Dybala, together with Théréau, Dzeko, Higuaín and Muriel, are the only attackers who receive at least 35 passes every 90 minutes. Curiously, we need to decrease the amount by more than 5 units to find the 7th most involved striker, Atalanta’s Mauricio Pinilla. It’s interesting to check how strikers’ pairs performed in this metric. Empoli’s attacking duo consisting of Manuel Pucciarelli and Massimo Maccarone receive approximately the same exact volume of passes p90: 29.7 for Pucciarelli and 28.9 for Big Mac. Also Meggiorini (30.0) and Paloschi (26.1), the starting forwards in Rolando Maran’s 4-3-1-2, are involved at a very similar rate in Chievo’s plays. The same applies to Torino’s Fabio Quagliarella (22.5) and Maxi López (18.3) although this is an outcome which makes him the least involved strikers of the 28 examined. Bacca and Luiz Adriano are no more a pair, since Mihajlovic has switched from the 4-3-1-2 to the 4-3-3, while Dybala and Mandzukic have played together just three games, so comparisons on these two strikers’ rates are less meaningful. Even if they started together just five times, the difference in passes received between the two Udinese’s strikers is the second biggest among strikers pairs examined: Théréau receives 16.3 passes more than captain Di Natale. Federico Dionisi’s 30.3 passes received p90 are around twelve more than the amount of his team-mate at Frosinone, Daniel Ciofani. Likewise, Luis Muriel is the recipient of 11.2 passes more than his team-mate Edér over the course of 90 minutes. In absolute terms, Icardi is third least in passes received per 90, but every team plays a different amount of passes during a game. What happens if we look at the percentage of passes he receives against the total amount of passes made by Inter every 90 minutes? Relative involvement of strikers – Percentage of passes received over total team passes per 90 minutes 3 Things get even worse: with just under 4% of passes received of the total, Icardi is the worst in Serie A. Cyril Théréau is the most involved in the entire league, receiving more than one pass for each ten passes played by Udinese. Federico Dionisi (9.4%) and Marco Borriello (9.0%) are just behind him. They play for two teams that are relegations candidates and the high percentage of passes received could be explained by the fact that they are both very strong in the air and so they act as the target men for their respective teams, to launch counter attacks or just to ease pressure from their team-mates. We could draw similar conclusion on the improvements in the ranks of Dionisi’s partner Ciofani, and Verona’s Giampaolo Pazzini. After years with Francesco Totti as the false 9, Roma are also exploiting the aerial abilities of Edin Dzeko: Szczesny, the starting goalkeeper this season, is attempting about 30% more long balls than De Sanctis last season (19.9 p90 vs. 15.4 p90). At the same time, the ranks here of strikers like Higuain and Kalinic have decisively diminished since they receive a lot of passes, but it’s also true that their teams are the two which play most passes per game (Napoli – 604.9; Fiorentina – 630.2). Efficiency of passes received So far we have analyzed the volume of passes received by strikers, but essentially they are supposed to score goals so what really matters is not the quantity but the efficiency of those passes, that is the amount of passes that lead to a shot in relation to the total amount of passes received. 4 Speaking of Inter's two strikers, passes received by Icardi are far more dangerous in terms of chance creation (7.2% of Icardi passes received led to a shot, against just 3.2% of Jovetic’s), but he and Jovetic receive the same amount of passes leading to a shot, 1.4 p90. Without knowing the quality of those chances we can’t say anything more, but ultimately this data confirms what I wrote about the difference between Argentinian and the Montenegrin. Icardi is a rapacious penalty-box striker, while Jovetic is a second striker, whose scope on the pitch is way bigger: on paper a compatible offensive pair. With data about both volume and efficiency of passes received, we can combine those metrics in a graph and divide them in four groups according to averages. The x-axis shows the strikers’ absolute involvement via passes received p90, while the y-axis has the combined amount of assists and key passes received p90; all the shots that were assisted. Colour represents the relative involvement of every striker (the percentage of passes received over total team passes per 90 minutes). tab (*Click the image to take you to the interactive Tableau) Higuaín, Dzeko and Dybala and the strikers in the top-right quadrant have been recipients of a high volume of passes and those passes have often led to a shot. Jovetic and Empoli’s attacking duo of Maccarone and Pucciarelli have been involved a lot in the play of their team, but not much in finishing chances. This makes sense considering that both under Sarri and now Giampaolo, Empoli forwards have the tendency to move wide to open up space for the runs of their team’s main attacking threat, offensive midfielder Riccardo Saponara. Strikers in the top-left quadrant like Quagliarella, Gilardino, Pazzini and Pavoletti have not been very involved in possession but are a concrete option to finishing their team’s plays. Players in the bottom-left quadrant have not been involved at an high rate and the passes they have received were not necessarily dangerous but so far this hasn't prevented them from scoring, since Edér is currently Serie A joint top-scorer together with Higuaín (both scored 9 goals), while Bacca has already found the net six times so far. Once again quality wins over quantity. Strikers are often judged by their direct contribution, like goals, assists and shots they make but they constitute the furthest layer of a team, so in their performances is equally important how and how much they are supplied by the rest of their team-mates. How many times have we seen a striker moving to a different team and radically altering his level of performance? With further advanced data, we could examine for example how far from goal a forward is supplied on average or also measure the quality of chances they have thanks to shots based and non-shots based expected goals models. This piece was just a synthetic look at strikers’ involvement but I hope it could represent a decent starting point for another layer in the analysis of a striker’s contribution. Thanks for reading.

How To Measure Defense?

Offense is always easiest to figure out. In Moneyball (the book, not the ever-vaguer Idea) the A’s essentially ignored defense to take advantage of an easy-to-measure offensive stat that was undervalued. Baseball didn’t really even have reliable defensive stats until the past few years and the public ones still come with much larger error bars than offensive ones.

The NBA is probably moving the quickest toward defense being accounted for but it’s still an area where we don’t really know nearly as much as scoring the ball. The analytics community in soccer has made great progress looking at strikers and team shooting as a whole but the opposite side hasn’t seen similar progress. This is mainly because offenses dictate the game in a way defenses cannot and simple shot totals get you a lot of the way there on offense (.55 R2 comparing shots to goals) while on defense the gap remains large (.33 R2). A tweet from StatsBomb founder Ted Knutson about trying to find what good defensive teams actually do sparked this dive into trying to find that out.

SPOILER: I haven't solved defense, but there is incremental progress and interactive stuff below so don't leave, please. If you want to just see leaderboards and then check your team on the defensive dashboard, you can jump ahead to the end.

The Holy Grail of a Single Number Is In the Future

The main result of trying to find the single thing that explains defense is quickly you see there is no secret sauce to judge a teams defense on right now. I thought teams that force teams into a high ratio of shots per deep passes would allow a low goal/shot because it indicated opponents had few options but that didn't really work out. I then thought the % of deep passes completed would be a clear indicator that teams couldn't cope, but it's messy as well. Shots from inside 10 yards? The ability to stifle a midfield? All explain bits and pieces but there are generally exceptions to everything and these categories are subject to wilder swings than offensive numbers. For now, a wider, more descriptive view of a teams defense is better than trying to find the single number to describe a team.

Takeaway #1: Team defense can take many forms, to get a feel for how a team is playing multiple metrics should be involved

They Can't Score Without the Ball

Dividing the two sides of the ball is complicated and possibly counterproductive in a sport without clear-cut possession changes. In football, baseball, and basketball the other team can possess the ball much more cleanly and evenly and your defense generally has to do the same amount of work as your offense. In soccer this clearly isn’t the case which is why if you want to avoid conceding goals, your #1 priority should be possessing the ball.

The more passes and completions your team makes the lower the chances of conceding which is a pretty obvious statement, but one that is almost impossible to get around statistically. If you want to make a good model for goals allowed using any kind of metric you want, passes for is going to be hard to displace as one of the most significant variables. Interestingly, passes for have a stronger relationship than passes allowed. I’d guess that the more passes you make, the more you push the opponent back out of position for the attack, and tire out their legs. It's common to disregard possession nowadays as kind of a useless stat, which it may be, but it's still one of the best ways to judge a teams defense.

This will be the only offensive factor I look at in this article but I think the interaction between the two is a rich area for research. Something like Deep xG's look at attacking width and length can easily be expanded to see where teams offensive possessions tend to end and how a defense can be constructed to play off that. A team like Ingolstadt is ending possessions further upfield than most Bundesliga teams, this isn't "defense" per se but forcing the other team to cover extra yardage can only help.

Takeaway #2: The more you have the ball, the fewer goals you allow.

Splitting the game up?

I found one of the best ways to see how a team is working is to split up defense into two categories: open field and goalmouth. Things that happen out in the wide expanses of the midfield generally rack up huge sample sizes and stabilize quickly. It's easier to see a teams philosophy when looking at open play stats like how intense their high press is, how much they have the ball, how strong their midfield D is, the length of passes they force their opponents to play, and what proportion of passes are played into the red zone (20 yard radius of goal).

Snip20151118_13 Snip20151118_12

As always enjoy Sampdoria's amazing logo, best in Europe.

At the goalmouth we can look at more familiar metrics like shot distance, % of shots inside 10 yards, % of dangerous passes turned into chances, SV%, SOT%, BLK%, and a few like shots allowed per deep completion and total passes per shot that either stabilize very quickly or are very descriptive. I kind of view the open field category as what teams set out to do (stop their opponents before it gets too dangerous) and the goalmouth as how they deal with the dangerous situations.

Snip20151118_15 Snip20151118_14

Arsenal's rate of chances allowed stands out as unsustainable. I expect a higher rate of chances conceded going forward if they face the same amount of passes.

Takeaway #3Looking at how teams defend in different segments of the field can be revealing

Technical notes: which of these things are controllable?

Let's start with maybe the most interesting pair: shot distance and % of shots inside 10 yards. Shot distance correlates year on year with a R2 of .48, showing that teams generally exert a solid amount of control over shot quality. However, % of shots inside 10 yards correlates at an R2 of just .22. Why is this important? Shots inside 10 yards account for 40% of all goals despite being just 15% of all shots. The lower R2 could indicate that teams who allow more than their share of these shots are a little unlucky. Taking Leicester as an example: this year 28% of their shots allowed have come inside 10 yards which is more than 3 St Dev's above the average of 14.6%. Their average shot allowed doesn't come from super close in which makes me suspect they have been the recipient of some bad luck. A chunk of those chances that were something like .35 xG could have easily been .15 or so.

Shot distance is obviously related to % of shots inside 10 yards and it's equally related to shots per deep completion. This is simply a measure of how many shots a team concedes for each pass completed inside the 20 yard radius of the goalmouth. It is a very consistent ratio from half to half of a season (.7 R2). Teams with higher shot/deep completion ratio (last years top 3 in the EPL: Chelsea, City, Arsenal) tend to allow lower quality shots. It's a number that quickly tells you what kind of shots this team faces, a low number means there are lots of passes played around the box for each shot and a high number means teams are firing on sight.

Passes per shot is a way of showing how hard teams have to work to get a shot off. Man City opponents need an average of 56 passes to get off a shot while Champions League rivals Sevilla allow a shot per every 23 passes. This is another stat that can quickly conjure up an image of a defense. Sevilla are basically handing opponents a clear lane to the goal while City make you really earn each shot.

Snip20151118_11 Snip20151118_10

Takeaway #4: I might be wrong, heck I am probably wrong

I did something similar to this last summer and it was a very useful exercise. It identified Sarri while he was at Empoli as a coach to watch simply through their style of play and gave a much clearer picture as to what teams did things well. I said then that it wasn't any sort of final classification and it wasn't, the metrics used to evaluate a teams style are better now. I've tested them more, split them up, removed some, and added more. This is a more meaningful exercise than that was but there is plenty of room to improve further. Next week I'd probably do things a little differently than now, but I feel comfortable that this way of looking at a defense gives me more info at a glance than anything else.

Defensive dashboard info

Click here for the dashboard. See all your teams metrics and how they stack up with others around the Top 4 leagues.

You need to make a copy so you can edit without messing with others.

You can choose your team from the dropdown menu in the top left. That will bring up the z score for each team in a number of metrics described above. These are separated into goalmouth and open field. There will be a list of the 5 most similar defenses in each of the two categories. This similarity score is similar to what Baseball Prospectus does for their player projections and 538 does for their NBA player projections, just applied to teams. To get these this I used agglomerative clustering to find the Euclidean distance between each team. The distance with a legend is on the sheet as well. Green is generally "good" for a metric though there can be reasons why something is red and of course some metrics are more important than other. All the info is there though so you can get a fuller picture.

A few of my favorites.

Chelsea

Snip20151118_3 Snip20151118_1

Chelsea look fine in the open field, keeping pass attempts into the red zone well below average, pressing well and holding the ball. This is reflected in their similar teams of Roma, Liverpool, and Arsenal. In the goalmouth metrics we see a lot of red. Those pass attempts are turning into chances and those chances are going on target at crazy rates.

Sevilla

Snip20151118_4 Snip20151118_5

Augsburg, Sunderland, and Newcastle are not what a Champions League team should see in their similarity scores. Sevilla are not contesting anything in midfield, opponents are playing their dangerous passes from extremely close in and we can see from the goalmouth metrics that they are allowing an incredibly high amount of shots per pass. Their problems seem much harder to fix and more widespread than Chelsea's.

Bayern

Snip20151118_6 Snip20151118_7

Sometimes similarity scores don't tell you much. If you can see the legend, you can see that Bayern has essentially no comparable teams. And if you see RZ Passes Length you can see they are a staggering 4.4 st devs above average.

Snip20151118_9

You can imagine the benefit that comes from opponents passing from Bayern's origin (highlighted line) vs the majority of the Bundesliga, which is significantly closer.

Who is the Sarri of this year?

By this years Sarri I mean a manager who is taking a small side and having them play like a team with a much larger budget. The best candidate in the early going in Eddie Howe at Bournemouth. James wrote about them some here, showing their outrageously low SV% through 12 games. That probably involves some bad luck, but Howe has his team playing like a top team out in the open field.

Snip20151118_16

So how do we measure defense? Uh, a lot of different ways. Keeping the ball, making opponents work hard for shots and dangerous passes, forcing shots from further average distances and keeping opponents from making lots of passes for each shot are all pretty reliable ways to stop other teams. Blocking shots, saving shots, keeping shots off target, allowing few sub-10 yard shots, and allowing a low chance% on passes into the Red Zone are not as reliable but reliable enough that we need to look at them. So, that's all cleared up right? Who's up for rating individual center backs?

Game States and Loss Aversion

It’s human nature to want to avoid risks and losses, whether it is financially, emotionally, or even in our beloved sports, yet it can often be sub-optimal for us to do so.  Golfers often putt better when putting for par compared to putting for birdie. The prospect of a gain from a birdie is weighted less important than avoiding the loss from a bogey, so when accounting for difficulty, about 3.6% more par putts are made than birdie putts. American football teams punt too frequently on 4th Down since a turnover on downs is considered a major loss by the offence whereas a punt is considered an avoidance of this "offensive loss". These two completely different sports are affected by the same psychological behaviour and it won’t surprise you to hear that football is just the same.

Game States

So how can we distinguish loss aversion in football? If loss aversion was a part of football you would expect teams to perform worse when they have a lead, or “something to lose”. To check whether loss aversion is prominent we can see how teams perform in different game states, if teams perform worse than expected when they're a goal up  then it would seem that loss aversion is indeed prominent . There have been a few different posts about game states 1 2 3 4 which I’d recommend reading if you haven’t already. Most of them seem to focus on how it affects shot numbers and conversion, but don’t really explain how it actually affects game outcomes, so that's what I'm going to attempt to do.

I'm probably going to be writing about different game states a lot so I'll define some basic shorthand.

GS(0) = Team is drawing with opponent

GS(+1) = Team is leading by 1 goal

GS(-2) = Team is losing by 2 goals etc.

Ben Woolcock’s research shows that teams that were up by a goal  in the premier league between 2010 and 2014 scored 50.6% of the goals from this game state. But does that mean teams that go up by a goal are playing optimally since they are scoring more goals, or would you expect them to be scoring a higher proportion since the team in GS(+1) is often the superior team.

Using bookmakers odds (I used the 13/14 and 14/15 EPL seasons) and assuming a Poisson distribution for goalscoring rates we can calculate the proportion of goals you would expect each team to score in a given match, assuming that they don't change their style of play depending on game state. From this you can also calculate the proportion of goals you would expect from a team in GS(+1) which I’m going to refer to as EXP(+1)%.

You can assign “p” (the proportion of goals the home team would be expected to score from bookmakers odds) to be the probability the home team scores any given goal, and “q” the probability the away team scores any given goal. There are a couple assumptions we're going to make when calculating our expected proportion of goals scored from GS(+1):

  1. I'm assuming that every game during the 13/14 and 14/15 EPL seasons only had 1 goal from GS(+1). This means games that ended with 0 or 1 goals are counted and games that had multiple goals from GS(+1) are only counted once. Since close games tend to be lower scoring this would mean that games with a EXP(+1)%  near 50% will probably be weighted higher than they should be, so overall EXP(+1)% will most likely be higher than the value we will calculate.
  2. I also assumed that each game had a goal rate that followed a Poisson distribution with expected number of goals = 2.67, which was the average number of goals per game over the the 13/14 and 14/15 seasons. Although the best estimate for expected number of goals will fluctuate slightly around 2.67 from game to game, this shouldn't have too much of an affect on the p and q values.

Calculating EXP(+1)%

At the start of a match in order for a team to go into GS(+1) and then score again it has to score 2 goals in a row so let's work out the probability of this. The probability that the home team scores to go into GS(+1) and then scores from GS(+1) can be calculated by  p2 (or p*p) and therefore it can be calculated as q2 for the away team. If we add these two together we get the expected proportion of goals that a team in GS(+1) should score

EXP(+1)% = p2 + q2

Therefore if both teams were even then, p=0.5, q=0.5 and EXP(+1)%=(0.5)2 + (0.5)2 = 0.5

Or if the home team was expected to score 65% of goals then EXP(+1)%=(0.65)2 + (0.35)2 = 0.545

Also EXP(+1)% is the same for constant p and q no matter which type of GS(+1) you are in (1-0, 2-1, 3-2 etc.) the more mathematically inclined can figure out why for themselves if they fancy a little exercise.

I calculated p and q values for every premier league game over the past 2 seasons and averaged out the EXP(+1)% of each game, with the assumptions previously stated. It turns out that based on the 13/14 and 14/15 EPL seasons the average proportion of goals you would expect from a team in GS(+1) is 55.3%, which is much higher than the 50.6% figure found by Ben Woolcock in the EPL as well as the 49.2% figure found by 11Tegen11 in the Eredivisie. So when teams get a lead they tend to perform worse than expected and consequently the team that falls behind performs better than expected. This is a pretty big drop in performance which seems in line with my original assumptions of loss aversion being significantly prominent in football.

Expected results from different Game States

So it seems like we've found a good indicator of loss aversion in football but how else can we show it's prevalence? When you’re leading by a goal the main incentive isn’t to maximise your chances of scoring the next goal, it’s to maximise your chances of winning the game which can be achieved without any more goals being scored. This is the reason why shelling is so prominent during GS(+1) situations. To account for this we need to look into how teams perform over the rest of the game when up by a goal compared to when level.

I used the win expectancy chart from American Soccer Analysis to see how teams played in different game states during different periods of games over the last 5 MLS seasons.

When in GS(+1) the priority of the team is to either win or draw the rest of the game, in order to win the game outright. I looked at the rate at which teams in GS(+1) won/drew the rest of the game compared to how often teams in GS(0) did the same.

Or in other words, assuming the score goes back to 0-0 after X minutes, how often did teams entering the Xth minute in either GS(0) or GS(+1) win/draw the rest of the game.

Remember that in general you would expect the team that is in GS(+1) to be the superior team, so even if the win/draw percentages were the same then that would be an indicator of loss aversion taking place.

HOME GS AWAY GS2

In fact what we see is completely against intuition, that teams in GS(0) actually outperform teams in GS(+1)  over the rest of the game. Now this doesn't tell us whether teams were actually shelling or just became too defensive without any structure but the fact that teams in GS(0) actually play better than teams in GS(+1) (especially the away teams) is a sign that playing defensively when up by a goal may in fact be a pretty bad idea. Another argument may be that shelling isn't bad but teams perform better when a goal down because they attack more aggressively, if this is the case then the conclusion is still the same, teams just generally aren't being attacking enough.

Practicality

But can you teach a team not to be loss averse in order to improve performance? If Liverpool's 2013/14 season is anything to go by then I'd like to think the answer is yes. Okay, that season will forever be remembered for Gerrard's infamous slip that handed Man City the title, but Liverpool far exceeded any preseason expectations and their attacking style of football was the reason behind it.

Liverpool scored 101 goals and conceded 50 that season so on average their proportion of goals was p=0.67 and opposition goals q=0.33. Liverpool games had an average of 4 goals, whereas all other games had an average of 2.5. So how many points would Liverpool expect to have if their games had a league average rate of goals? We've seen how being defensive decreases the proportion of goals a team scores but let's assume for now that the p and q values stay the same.

I can't really account for loss aversion affecting performance but I can account for the number of points earned from winning matches instead of drawing them just by playing attacking football. Using a win probability model and calculating the difference between games with 4 goals and games with 2.5 goals, Liverpool gained an extra 0.185 points per game or just over 7 points over the course of the season, the difference between them challenging for the title and finishing behind Arsenal in 4th.  I must add that this would only really work for top half teams although this is without taking into consideration the positive performance effects that attacking play seems to have.

Just like golf, American football, and a whole array of other sports, football is subject to loss aversion. So for the benefit of the teams (and the benefit of the fans) let's hope we see more attacking football from clubs in the near future.

Edit

Not really sure how I forgot to mention Leicester but they are another prime example of the success of playing more open, attacking football (especially against teams that are considered inferior) and minimising loss aversion. Similar to Liverpool in 13/14 Leicester have been aggressive going forward, leading to their games consisting of a league high 3.7 goals per game and helping them defeat teams that they probably would have drawn against in low scoring games (3-2 vs Villa, 4-2 vs Sunderland, 3-2 vs West Brom).

It will be interesting to see how Leicester adjust with a difficult run of upcoming fixtures, since you would usually want a lower number of total goals against teams that you consider better. You could argue however that with the boost in general performance that this attacking style has brought, Leicester may even consider themselves as favourites at home to the likes of United and Chelsea, and with the way in which each of these 3 teams have been playing recently it'd be difficult to argue otherwise.

Why Have Juventus Struggled?

pogba A good price? Of the big five European leagues last year, Juventus won their league by the largest margin. By creating a 17 point gap over Roma in raw point terms they were more convincing than Bayern (ten point gap), PSG (eight points), Chelsea (eight points) and Barcelona (two points). Onto this season and around the top European leagues you might expect a coin flip in Spain and at least that in England, but the other three leagues seemed far more likely to return the incumbents to their throne. Yet, during pre-season we had disparity in bookmakers' prices. Both Bayern and PSG started their seasons at prohibitively short odds of around 1.10 (1/10) where Juventus were significantly longer at 1.66 (4/6). Why would this be so? Juventus had won the four previous titles, and had a ridiculously solid defence that hadn't conceded any significant volume of goals throughout (20, 24, 23, 24).  Their attack had also scored more than adequately each year (68, 71, 80, 72). Fresh from a Champions League final, surely they looked set to continue their dominance? This was a team that had dominated its league, so why were we looking at a set of odds that could tempt? If we do a calculation to derive an expected points total from shot and rate numbers over their title streak we find this: exp points serie aMethods here can vary but by calculating this rather than using the actual point totals we find a more reliable method of understanding the true quality of a team. Here we have some insight into the difference between what might have seemed to be generous odds from the bookmakers and a more casual perception that a team that had just won it's league by 17 points should be a prohibitively short price.  The 2014-15 Juventus team was the best team in it's league, it just wasn't worth +17 points against its rivals or in front of the second or third rated teams by a very large margin in comparison to previous years. Still, understandably they remained favourites for the title throughout pre-season and there was a clear onus on other teams to improve to stand a chance of dethroning them; Roma have had good sides in previous years, as have Napoli and teams such as Lazio, Inter or Fiorentina could have some hope to build.  What they may not have expected was the weird chaos to envelop early results of the bianconeri and as we reside here in mid-November, Bayern and PSG are coasting along leaving a trail of debris in their wake and Juventus are er... 7th. On the surface there may seem to be similarities with another malaise stricken European giant but where Chelsea's performances have broadly pegged them at a position similar to where they reside, Juventus can consider themselves to have been somewhat unfortunate to have found themselves on the lower fringe of contention. Shots good, conversions bad So what's happened to them?  This is a team that had only lost ten matches in four seasons and has now been defeated four times in just twelve games.  If the 2014-15 side was the weakest of their championship winning teams, then how strong is the 2015-16 iteration? There are a variety of expected goals models floating about but Michael Caley produces a variety of advanced stats for the big European leagues and his model places Juventus first.  We can also get a broad understanding from their shot totals and looking at them we can see they rank first for shots +/- and third for shots on target +/-.  Whichever way you choose to look at their shooting numbers, the implication is clear: at worst this looks like a top four team, at best they are good enough to lead the league.  Where we have found a new Juventus is in their current inability to rebut shots and a high level of their own wasteful shooting: juve plotNow these metrics are known to regress over time and do not intrinsically represent the true quality of the team. We can see here that it is extremely rare for Juventus to perform at below league average levels for both metrics at the same time, as is the case in the early weeks of this season. Indeed the last time it occurred was in the early stages of 2013-14 and it was followed by the most extreme skew in the chart for both metrics.  That year they won 33 games, got 102 points and managed a 12 then later a seven game win streak.  It's worth remembering that these less consistent metrics can run extremely hot, as described here and extremely cold, as we are now seeing. Also  throughout the Championship seasons those strong defensive numbers were assisted by a series of high save percentages: 2011-12: 81%, 2012-13: 78%, 2013-14: 81% and 2014-15: 76%. Through twelve games in 2015-16, Juventus' have conceded almost half as many goals as they had in each of the last four seasons and their save percentage is significantly lower at 67%. They have been heavy shooters this year- but primarily at home.  In six games at home, they have an incredibly high +100 shot differential over their opponents.  That they have failed to convert this absolute dominance into more points seems somewhat of a quirk- conceding five times to only twelve shots on target here hasn't helped and only 6.5% of all their shots have gone in- a low total. Away from home they have faced their three most difficult fixtures, at Napoli, Roma and Inter, and have gained only one point from what transpired to be closely matched games. With these games combined with their other fixtures, away from the Stadium they have been only a par shots team. Groups Juve's fixtures can be broadly grouped into three: routine wins- of which there are five, the aforementioned away games against rivals and four superficially baffling results against lesser teams.  This last group is most interesting here as it is the least obviously explainable: juve weird fourIn each of these games they have dominated yet conceded and failed to win.  To have scored twice from 97 shots here is a phenomenal underperformance. Beyond this, they have only managed clean sheets in three of their opening twelve matches (compared to 9/12 last season). Defense coherence So what kind of goals are Juventus now conceding? Is there anything within their construction that can prove informative? Having turned to the video, it's possible to create an argument that they have been conceding a combination of brilliant free kicks and defensively questionable goals, the first of which, in themselves are hard to counter, the latter implies that this defense hasn't the solidity of prior years:

  1. v Udinese: deep cross, untracked runner on back post converts, keeper no chance
  2. @ Roma: Free kick, keeper rooted, unstoppable
  3. @ Roma: looping cross, defender outmuscled, close header, keeper no chance
  4. v Chievo: deflected cross, defence all run in, lands at feet of unmarked runner 25 yards out, clear shot, swerved away from keeper
  5. v Frosinone: corner, scorer pushes defending man to make space, close header, keeper no chance
  6. @ Napoli: no pressure on attacker, one-two to edge of box, clear shot slotted past keeper, keeper maybe slow to ground
  7. @ Napoli: ball breaks cheaply in midfield, attacker advances simply into left channel under no pressure, powerful shot touched but not kept out by keeper
  8. v Bologna: ball over defence, entirely untracked runner, finish straight at keeper, unable to keep out, error
  9. @ Sassuolo: Free kick, keeper rooted, unstoppable
  10. v Torino: Free kick, blocked by wall, lashed in by taker with other foot
  11. @ Empoli: hurried sliced clearance falls to attacker who advances unchallenged to edge of box then finds corner.

By my reckoning, that's three free kicks- including the rebounded effort- and eight goals that can be simply criticised from a defensive standpoint.  Arguably, to concede free kicks in possible scoring positions is a similar failing. So, where Juventus have conceded a small volume of shots, those that have been conceded and caused greatest problems have implied issues within the structure of the team. Why so? An unsettled side This is the team that started the Champions League final against Barcelona earlier this year: cl final juve It doesn't take advanced analysis to work out that losing the three players highlighted might have an impact on a team.  None of the three need any introduction but suffice to say that Pirlo and Vidal joined Juventus during the same summer in advance of the title runs and were huge contributors to each of the four Scudetto seasons. Not only in their general play and numerical contribution but in the key central part of the team as tempo setters and influencers.  Even as Pirlo's in-game influence may have declined, it is reasonable to assume as a highly decorated and respected professional, he would have been a presence around the club and involved with wider team issues.  Organisations can often take time to readjust after big contributors have moved on, football is no different. Tevez, ever infusive and a genuinely elite striker had two seasons in which he averaged a shot contribution of over six per game, a goal contribution of around 0.9 per game and a goal scoring record of around 0.6 per game.  These are numbers that are difficult to replace. Of that front six above, only Pogba has contributed significant minutes this season (96%).  Indeed, Juventus have struggled to get a consistent first team onto the pitch: he is the only midfielder or forward to have featured for more than 65% of available minutes.  The team has been far from settled: juve forwards The defense is aging- but the players that have inhabited the zone in front of the centre back have been various and likely inferior to the peak 2014-15 team.  Bar one start against Chievo, Marchisio has only featured more recently as form and results have improved, as has Khedira. Early disappointments seem to feature Pogba + Sturaro or Lemina or Hernanes.  This looks to have been a team in transition, with personnel issues.  Lots of squad men, hard to choose starters. Nobody has managed to get on a run of scoring either, Dybala has three non-penalty goals, Mandzukic has two,  others no more than one and it follows that conversion rates are generally poor.  Again the question is: who is preferred? Alongside this it appears a variety of formations have been tried.  Allegri hasn't been afraid to experiment, but in chopping and changing personnel and formation, he has allowed vulnerabilities to creep into the team's play. Shot Structure We can see some of the changes in subtle differences in the shot structure of the team.  Juventus' in-box shots are finding the target at a rate of only 40% (down from 58% last year and well under league average of 46%).  The rate in which the opposition is finding the target- 32%- is around league average, however the percentage is the same both inside and outside the box meaning a huge rate of long range shots are finding the target.  And they have been going in. One of the starkest contrasts I found was that Juventus scored 22 times from outside the box last season and conceded only four (three for and one against were direct free kicks).  This year they have already conceded six times from range while scoring only three (0:2 for direct free kicks).  Only Milan have conceded as many and only they have a worse save rate for such shots.  This is where I find an analytical quandary, because typically you might expect that this high rate would cool off and a more balanced profile would emerge, but having analysed the goals conceded, I feel that there is a likelihood that the rotation of personnel has had an impact on turning what was a solid defensive unit into what we see now- a good team but one with vulnerabilities. This is where there is a need to find a balance.  Some factors can be solidly attributed to a numerical dissection, whereas others require more nuance. Here we see the benefit of looking at a variety of influences to form an analysis, multiple factors are involved in the success or failure of a team's methods and it's simply not sufficient to conclude that "Juventus are the best team in the league, but have been unlucky or affected by random variation". And so... It is most likely that Juve will find a stability in team selection as time goes on and it will help their results, indeed they are 3-1-0, and have looked generally more solid with Khedira, Marchisio and Pogba starting together as a unit and this is all within the last five games.  Their two hardest fixtures- at Roma and Napoli- are behind them and they were competitive in each.  They are unlikely to fail to win many more matches in which they take 25+ shots and it is unwise to be negative about a squad that has such wide talent within the league.  Also unlikely to continue, at least at the rate it has been up until now, is the rate in which they have fallen behind.  Having taken the lead in only four of twelve fixtures and fallen behind in seven- and five times within half an hour- they have been faced with frequent deficits to overcome. To some degree this has powered what appear to be extremely strong shooting numbers, a bias that cannot be ignored. The Scudetto might be beyond them this time, and the slight caution from the bookmakers may well have been shrewd.  This Juventus team remains a good one, but it probably isn't as great as those that went before.  The Serie A title race looks to be one of the more open that we have seen in recent years and all the better for that.   __________ Thanks for reading   Find me on twitter here: @jair1970  

StatsBomb Podcast: November 2015

[soundcloud url="https://api.soundcloud.com/tracks/232565617" params="auto_play=false&hide_related=false&show_comments=true&show_user=true&show_reposts=false&visual=true" width="100%" height="450" iframe="true" /]   If you are an iTunes user (or want to subscribe to the pod via a different player) this link should help: Stats Bomb podcast …and the pod is downloadable directly from Soundcloud or in this link on the player: share       Plenty of ways to listen, stats fans! Share widely, spread the word! One day it might end up on iTunes... Hosted by James Yorke (@jair1970) and Benjamin Pugsley (@benjaminpugsley)

Leicester City and their trip to the Kamikaze Zone

  Imagine your standard online game on FIFA. It starts out with the two players feeling each other out but at some point, it just degenerates into an end to end contest more reminiscent a basketball game than anything else. It can end up the footballing equivalent of taking an acid trip and more than anything, after the game ends you almost want to forget about it as much as you want to bask in how wild it was. Leicester City resemble that FIFA match. In many ways, Leicester City also resemble the stereotypical ethos of the English Premier League: a quick athletic club that will concede just as much as they will convert. At their current pace, Leicester City could end up with a season that features 79 goals for and 63 conceded. That is unheard of. The closest comparables I could find for teams finishing a season with at least 60 goals scored and 50 goals conceded in the PL since 1999-2000 are:

  • 1999-2000 Newcastle (finished 11th)
  • 2001-02 Newcastle (finished 4th)
  • 2007-08 Tottenham(finished 11th)
  • 2013-14 Liverpool (Finished 2nd)

I scoured through 16 completed seasons of English football and I could only find four teams that completed this feat.  Where the four teams finished probably doesn't matter too much considering the rarity of the event though I do enjoy the fact that the swashbuckling Liverpool side that probably choked away a title were one of the four teams that fit the criteria. The rarity of the teams that fit the 60/50 criteria is pretty fitting because Leicester are a rare team even by PL ethos standards. It's not rare for a team to play primarily on the counter- Crystal Palace for example- and counter attacking football in general has seen a rise in recent seasons. But to the degree of which Leicester play with pace is astonishing. For reference I checked Michael Caley's Premier League's advance stats page and going into last weekend's games, Leicester ranked 2nd in shots coming from counter attacking moves and tied for 5th last in conceding shots of the same nature. In a similar nature according to Mark Thompson, Leicester rank 1st in the amount of "attacks" per game this year on both ends. In comparison to the likes of Manchester United and West Brom whose games have often resembled paint drying, watching Leicester have a unique and thrilling quality. Last season Leicester played directly, but not to this degree. Thanks to info provided by DeepXG, Leicester going into the most recent week of games were playing at the highest pace in the PL and in Europe, they ranked 4th in pace. The three teams in front of them? Villareal in 3rd, SV Darmstadt in 2nd and... *drum roll* It's Caen! Yes, the same Caen that if you follow me on Twitter will know that I espouse the virtues of many of times. It's probably one of the more niche comparisons you'll ever see with a PL team but in many ways, the trajectory of both Caen and Leicester mirror each other to a scary degree. Both teams looked like relegation candidates midway last season and both got out of the relegation zone (albeit Leicester had the more remarkable escapes between the two). Last season both teams played fast with Caen ranking 7th in pace in Europe and Leicester ranking 15th but it wasn't of the 99th percentile. This time around, both teams have cranked it up and are arguably the most direct teams in Europe. They're appointment viewing TV and they revel in how against the grain they play. Even looking at the construction of both teams makes the comparison very apt. Both have a speedy striker that wrecks terror on defensive lines. Both have classy playmakers. Hell, N'Golo Kante played in the high tempo system from Caen last season so coming into this Leicester team was a seamless transition. Both have defenses that have a bend but don't break vibe, though Leicester's has been worse than Caen's. And to top it off, both teams are better than last year's version of themselves by a decent margin (albeit I would argue Caen relative to Ligue 1 have been more sustainably impressive than Leicester in the PL but we'll get to that). The thing that makes Leicester so interesting is that they're an improved version of themselves this season. Whether using Caley's expected goal data or other versions (like the one's on Statsbomb provided by Paul Riley), Leicester grade as an slightly above average team. Caley's data has Leicester City as a 2.6 xGD club while Riley's data has Leicester in the 0.5 range, a bit closer to average. That's a big improvement seeing as Leicester had an overall -10 xGD last season. Leicester's current PDO of 105.6 symbolizes that there has been an element of luck to their season so far and if West Ham has taught us anything, it's that what goes up will probably come back down to normalcy. Leicester aren't as good as their position and conversations about them finishing in the top 4 or even the top 6 need to be taken with a McDonald's Big Mac worth of salt. We've seen four teams in the last 16 seasons of English break the 60/50 club and it's a crap shoot where they finish if they make it to the esteemed club. Having said all that, I quite like the construction of Leicester. Riyad Mahrez is the latest French player to take the PL by storm (and with added variety, he came from Ligue 2), Kante has been a hand in glove fit for being able to transition from a defensive action to a counter attack. Jamie Vardy is following the succession plan of Grant Holt to Rickie Lambert to Charlie Austin in terms of English players from lower leagues who have killer seasons in the PL for small clubs with reasonably sustainable shooting numbers. When he's played, Shinji Okazaki has functioned very well as a support striker for Vardy and even Marc Albrighton is having a solid season. Also I will always root for Claudio Ranieiri because rooting against him is like rooting against your grandpa who makes you pizza when you do well. This season Leicester have been one of the best attractions in football and very much like Caen, Leicester have found a way to make their gimmick of turning football matches into basketball games more sustainable. Their underlying numbers are decent, which is a huge step up from the calamity numbers they posted last year. 3rd place is not a true indicator of their talent level and in post match interviews, you still hear Ranieri talking about the magical 40 point target for safety. Even when Leicester likely regress, the cushion they've built with their start leaves them a world away from relegation. There's a genuine question about just how long can a team play total counter attacking football over an entire season to the degree in which Leicester are playing but who knows, if they keep posting slightly above average xG and SoT ratios, a top 8 finish might just be in the cards.

Twelve Game Premier League 2015-16 Team Stat Review

The First Annual Twelve Game Premier League Stat Review

Last year I took a dig around some stats at the twelve game point to try and quantify what Southampton were doing. They had extremely good underlying numbers at that point, to such an extent that I felt they had a good chance of a run at the top four.  It didn't come to pass but by doing that piece of work, it meant I had built a database of numbers at this point in the season.  It is useful as a reckoner for identifying teams that have been performing at levels that may be at historical extremes, either good or bad and also whether they have been exceeding or undershooting both metrics that indicate quality or those that are likely to regress over time.

Twelve games also takes us over the 1000 minutes point which at least allows some degree of smoothing for variable fixture strength and we have a sample that is large enough to have some confidence in conclusions drawn.  Plus: it's interesting.  In particular outliers are informative and taken together, the relationships between shot metrics and various conversions and save rates paint a picture of team strengths that you don't get by focusing on single metrics.  The public data available for such analysis exists from season 2009-10 onwards (The Enlightened Era) which means we now have a sample of 140 12 game starts to compare and contrast with.

The Good Let's begin with a team that has shown extremely strong form at both ends of the pitch.

Man City It's kind of ironic that I'm writing this on a day in which Man City have failed to beat or even score against the league's bottom team, Aston Villa, but through twelve games, Man City have created shot numbers that peg them as an extremely dominant side.

Total Shot Ratio (TSR): 71%, 1st/140

Shot on Target Ratio (SoTR): 75%, 2nd/140

Shots For: 18.3 per game, 11th/140

Shots Against: 7.7 per game, 1st/140

Shots on Target For: 6.9 per game, 5th/140

Shots on Target Against: 2.3 per game, 2nd/140


MAN CITY SHOTS ON TARGET(Chart Credit: Paul Riley, yellow=goals, blue = shot on target, go check out the entire league)


Rightly favourites for the title, this looks a team with few real weaknesses; only Aguero and now Bony's fitness casting a shadow over their current form.  In particular, and despite first class attacking numbers, their defense has resisted shots with remarkable effect.  In only one game have they conceded over ten shots-the defeat at Tottenham- and are currently on a run of conceding only 25 shots in five games.

None of their quality here is potentially inhibited by more fluid metrics which are running happily within "normal" parameters, so it is entirely reasonable to predict that their dominance should continue.  But what of Arsenal?

Arsenal

The only team that has consistently shown form anywhere near that of Man City is Arsenal.  Aspects of their play, specifically on the front end have been very impressive, indeed they have currently taken one more shot than Man City.

Shots For: 18.4 per game, 10th/140

Shots +/- : 7.5 per game, 13th/140

That shots plus/minus figure is only Arsenal's 4th best on the list, which shows how often Arsenal have created solid shot numbers over these years.  Indeed the strangely moderate numbers of 2013-14 that didn't eventually hinder their run to the top four, have been left far behind in the Ozil/Sanchez era. The red flag in Arsenal's numbers is in their save percentage.  Arsenal recorded an extremely high save percentage throughout the second half of 2014-15 (80%) and have continued this season, in fact, they've actually increased to 83%.  This is enough to rank 2nd/140 in the list and as such is likely to be unsustainable.

Arsenal's against shot numbers are nowhere near as strong as City's yet Cech has managed to fend them off at an extremely high rate.  Whilst he is usually regarded as one of the better keepers in the league, it is not possible to be confident that Arsenal will continue to resist their opponents shots at this level going forward.  As a bare minimum, one would expect three percent to come off that total as the season draws on, and likely more.  This potential cooling off is likely to impact their results at some point in the not too distant future.

The amount of their opponents shots are hitting the target as a percentage of total shots is also high (40%, 5th/140) and the pure rate in which their opponents are getting shots on target is far more in the realm of average too: 4.3/game compared to City's 2.3/game.  As we can see in the chart the dominance isn't as stark:

asrenal ag

As an aside, there is a fascinating gap between a line through the penalty spot and outside the area in which they are conceding very few accurate shots.  I would presume that this means they hold a line on the edge of the box quite effectively but a visit to the video booth would be required to ascertain if this is borne out.

Also Good

Tottenham and Southampton are both running strong shooting numbers so far.  Both have a shot on target ratio of 65% which ranks them joint 10th/140.  Where they differ is at each end: Southampton's repression of opposition shots on target is very similar to the good total they recorded last year (2.8 to 2.9) whereas Tottenham have taken off on the front end here and are only just behind Arsenal  with 6.3 on target shots per game (enough for 11th/140).

Southampton's problem is that they are struggling with a low save percentage and this is undermining these very solid shooting numbers.  They look well set to maintain a top seven challenge once more and with a slightly deeper squad and a smidgen of reversion in this metric, could go well under the radar in attempting to improve on last season's final position.

Interesting for Tottenham is their +10 goal difference.  Until Southampton broke the run last season, the last 25 teams with a plus ten goal difference after twelve games had all made the top four, stretching back to Portsmouth in 2007-08.  One note of caution is in their shot ratios. Objective Footy noted that maintaining a season to season leap of above ten percentage points as they currently are is extremely rare:


Man Utd have a defense almost as limiting as City's- 8.8 shots conceded per game (4th/140)- and given their truly sub-par attacking figures, must be hoping that this will be enough to power their charge.  The only praise I can give Liverpool is also defensive, they are repressing their opponents shots on target at a solid level (3.3/game, 13th/140).

Running hot

There is little I can add here to Joel Salamon's video deconstructing West Ham.  He was right: they were liable to revert to a lower level of scoring and have already fallen from scoring 50% of their shots on target to *just* 44%, a mark which is still high enough to register as 2nd/140 in our chart.  There is plenty of room for them to fall further here but none of their underlying shooting numbers imply anything but an average side being powered by a temporary positive fluctuation in conversion.

The Bad

There are likely more than three "bad" teams in the league this year but it's hard to not be drawn by the three teams that have provided distinctly unimpressive shooting numbers thus far: Sunderland, Newcastle and Aston Villa.  Each of these teams is running a big shot or on target deficit, to a level that pegs them as distinctly bad. Here we see Sunderland's on target inadequacy (7th/140 worst SoTR; ~tied with Villa):

SUNDERLAND SOT

However, in terms of just raw shots six teams are milling around the historically bad ten per game mark, the aforementioned three, Man Utd, West Brom and Stoke. I think it's possible to find a degree of understanding towards the ghosts of Pulis past and present creating little, although Stoke are a potentially interesting case of underperformance here,  but for a team that has spent as widely and freely as Man Utd to be running an attack that challenges league minimums for shot creation is verging on the criminal.

On the other end, three teams are currently exceeding the fabled "Knutson line" of 16 shots conceded per game, often a big hint towards a battle against relegation: our pals in the North East and Crystal Palace. But Palace are doing well aren't they? Well, the opposition conversion rate of ~6% is 2nd/140, so extremely low and is currently helping them resist.

Newcastle have the distinction of having created the two least proficient shot games in the league this year; their ten man, one shot salvo against a then rampant Arsenal and this weekend the miracle two shot 1-0 victory at Bournemouth.  Only Remi Garde's Villa debut (three shots) prevents them from rounding out a dismal top three here.

Running cold

Over the early years of advanced public data, Wigan, managed by Roberto Martinez repeatedly underachieved against their numbers, struggled yet somehow survived.  Dismal save percentages and rates of scoring were commonplace and as a method of creating success, they seemed to exist as a yin to Tony Pulis' yang.  This season, we have a new contender.

Bournemouth

It's easy to feel sorry for Bournemouth.  Not only have they been plagued by injuries dreamed up by the devil, but despite Heurelho Gomes' recent efforts to get noticed at Watford, they have been suffering severely from "clown keeper syndrome".  The knock on effect from this is despite very impressive shots against numbers of 10.1 per game (12th/140!), where the Lord giveth, he also taketh away: a save percentage of 47%- the lowest on record- has thoroughly skewered them:

bourne f

We can see just how many of their goals conceded have come from ideal shooting positions and they are currently conceding 21% of all shots they face, around double league average and for the technically minded among you, nearly four standard deviations away.  Blackburn 2011-12 bottom out the full season numbers with save percentage of 59%, so on the positive side there is a huge room for reversion and it hasn't relegated them yet.

Final Quick Notes

  • Chelsea's main problem is in the rate in which their opponents are getting shots on target: 43%, 1st/140, and the resulting concession of goals. This implies they are conceding good quality chances but is prime for reverting to a lower level.  Beyond that their underlying numbers are merely very bad by their own standards.
  • Man Utd, West Ham and Everton are all running high PDOs, Liverpool, Bournemouth and Norwich are notably low.
  • Sunderland and Villa's current points totals are very low. In this 6 season sample only QPR 2012-13 (4 pts) are lower.
  • The difference in which the rate Southampton create shots on target per shot and prevent the opposition from doing so has them ranked 2nd/140. The only team more effective in the sample? Southampton 2014-15. Maybe Koeman's system has hit on something here?
  • Leicester's 20 goals conceded is huge for a top 4 residing team, the last club to do the same at this point was Man Utd 2001-02, and they promptly lost their next three games.  Otherwise, their goals per shot on target rate is at 40%, very high- but not West Ham high.  Their platform seems shaky, although 25 points after 12 games usually indicates a top seven finish and 20 points or more pretty much guarantees top half.

Thanks for reading!   Find me on twitter @jair1970