
We have reached 1000 Twitter followers (1017 as of the time of writing), and as promised, here are the details of the kit giveaway. Here at StatsBomb, we have had really strong support from a variety different clubs. We are thankful for all the team accounts that have spread the word about our work (like ChelseaStats, The Tomkins Times, Arsenal Column and LeGrove, Bitter and Blue, Executioner’sBong and probably a hundred others), but we honestly have no idea team in our audience of readers has the greatest following. That’s where you guys come in. I have posted a poll below. Your task is to a) vote for your favourite team and b) tell your friends to follow us on Twitter and come vote as well. [polldaddy poll=7436375] Since I’m a gamer, this contest has multiple levels or stretch goals, based on final voting in the poll, as well as additional follower count. If @StatsBomb reaches 2000 Twitter followers, 1 free jersey/kit will be given away to a random follower with the team affiliation that wins the poll. If @StatsBomb reaches 5000 Twitter followers, 2 free jersey/kits will be given away to a random follower with the team affiliation that is in the top 2 when the poll closes. If @StatsBomb reaches 10000 Twitter followers, 3 free jersey/kits will be given away to a random follower with the team affiliation that is in the top 3 when the poll closes. I will pay for the kits and I will also pay for the shipping to whatever people win it. Winning accounts will need to respond to DMs, so please don’t create a bot army of Twitter followers, because that would be awkward. Prizes Based on the criteria above, X Random followers will receive an official kit of the following statistical all-stars for the team they identify with. Arsenal: Ozil Liverpool: Sturridge Tottenham: Eriksen Chelsea: Mata Manchester United: van Persie Everton: Barkley Manchester City: Aguero There you have it. The poll will close at midnight London time on Friday, October 4th 2013 and we will announce the winner(s) the following week. Tell your friends to follow @StatsBomb on Twitter, and to vote in the poll above! --TK
Month: September 2013
Newcastle's Shots Allowed

Before tonight's Premier League game away to Everton, Newcastle sit 16th in the Premier League table on 7 points with a Goal Difference of -3 (5 scored and 8 conceded).
Only 4 Premier League teams have conceded more goals than Newcastle this season. At face value this is surprising given that they have conceded the 3rd fewest shots in the league at 51 (excluding penalties).
In giving up those 8 goals they have allowed the opposition to score with 16% of all attempts faced. This concession rate of 16% is the highest in the league (coincidentally they share it with their North East rivals Sunderland), so they've been pretty unlucky to concede 8 goals?
I'm afraid the answer to that is a resounding "No". Have a look at where Newcastle have conceded their 51 shots from in their opening 5 games this season:
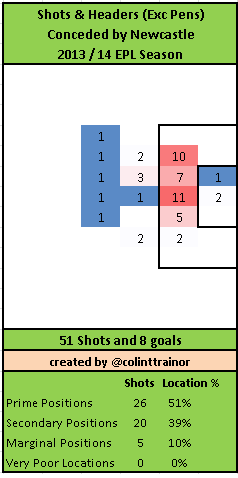
For some (not very smart) reason, more than half of all shots Newcastle have conceded have come from Prime Positions. By permitting 90% of all shots to be taken from the two most favourable zones you can see why the Geordies have conceded a goal in almost 1 of every 6 shots they have faced.
90% of shots coming from those two most dangerous zones is by far the worst performance in the League; the next greatest offender (Swansea) only allows 79% of their conceded shots to be struck from those zones.
Obviously no team sets out to give up chances in these very dangerous areas, so it will be interesting to see in tonight's game whether they can keep Everton (who can pile on the pressure when required) out of the danger zone with greater effect than they have managed in their previous 5 games so far. If not, they can expect the goals against column to keep increasing at a rapid rate.
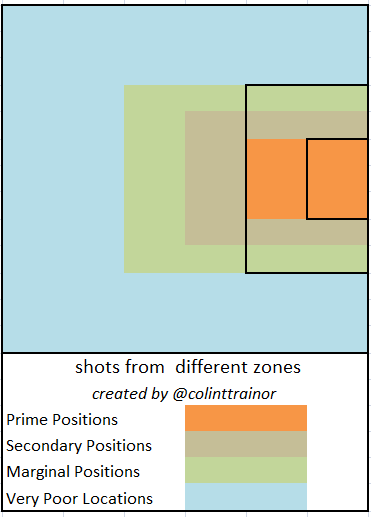
EDIT - as requested, below is an outline of the 4 zones. Apologies, for the omission in my original posting.
StatsBomb Podcast #3 - EPL Rankings, CFC v. Spurs and more
In today's podcast, Ben and Ted cover the initial EPL model rankings, talk about some goals vs. assists theory, and preview Chelsea vs. Spurs and Swansea vs. Arsenal. [Note: We apologize for the extra noise on this cast - it was unexpected and we couldn't find a way to filter it out. Rather than not do it, we posted it anyway, but next week we have some workarounds.]
Shots and Key Passes are Better than Goals and Assists
By Alex Olshansky (@tempofreesoccer)
Overview
The two most ubiquitous stats for attackers are goals and assists. And why shouldn’t they be? After all, goal differential explains ~85% of the variance in a league table. Creating goals is a very valuable skill. But how repeatable of a skill is it? After scoring 11 goals in his first 19 EPL games for Newcastle United in 2010, Andy Carroll was sold to Liverpool for a staggering 35 million pounds. Carroll would score only six times in his next 44 EPL appearances before he was loaned out and subsequently sold to West Ham. I do not bring up Carroll because I think he was a poor acquisition for Liverpool, I bring him up because he exemplifies the variable nature of goalscoring. When it comes to goals and assists, what is the signal and what is the noise?
Key Passes are better than Assists
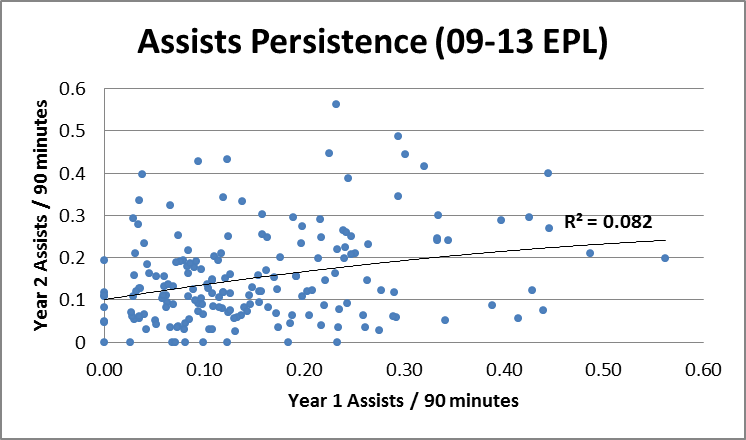
The original intent of this piece was to test the persistence or repeatability of key passes. To the uninitiated, key passes are passes that directly lead to an attempt on goal. There has been some legitimate criticism of the fact that key passes don’t take proper account of the quality of the chances being created, but for now it’s the metric we have. I looked at every player in the EPL who averaged over 0.7 key passes per 90 in any season from 2009-2013. I then looked at the year over year relationship for key passes: how well do year 1 key passes predict year 2 key passes (n=184)? Quite well, it turns out. While not overwhelming, the relationship is evidence that key passes are a somewhat repeatable statistic.

Next, I took the same sample and looked at how well year 1 assists predicted year 2 assists. There really isn’t a relationship. Assists are basically random from year to year.
On a hunch, I looked at how well year 1 key passes predicted year 2 assists.
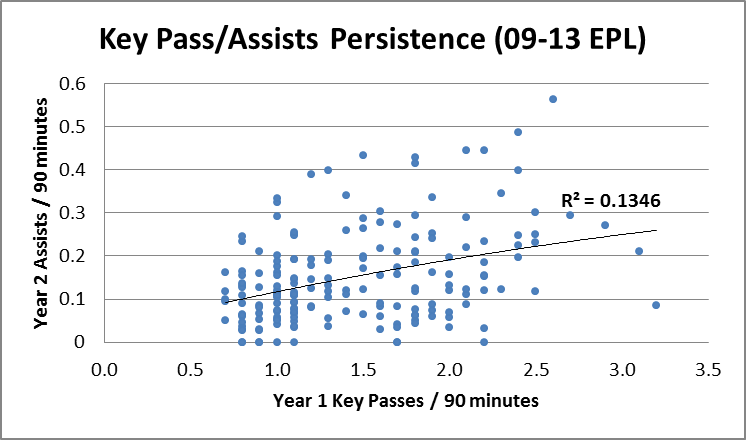
Granted, this is not a great relationship either, but it is significant that key passes actually predict assists better than assists. And, unlike assists, key passes have some degree of repeatability.
Shots are better than Goals
Earlier this year Ben Pugsley undertook a similar study, but he primarily looked at shooting statistics. The statistic with the best predictive relationship? Shots per 90.
Ben also found no year over year relationship for assists (although his r^2 differed slightly from mine) or goals (below).
Ben was kind enough to, as I had done with key passes and assists, run a regression comparing year 1 shots to year 2 goals. 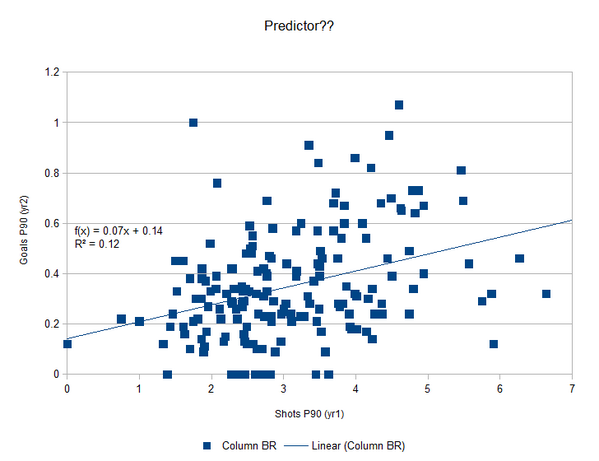
As with key passes and assists, shots predict goals better than goals predict goals. Of course an r^2 of 0.12 is hardly predictive, but at this point in soccer analytics knowing what does not work is just as important as finding out what works.
Expected Goals Created Model
So if goals and assists don’t work, what might? Key passes and shots, taken at their face, are not nearly sophisticated enough. Luckily, much work has been done on shot location/type and expected goals (here and here and many other places). As far as I know, adjusting for shot location/type hasn’t been attempted yet for shots resulting from key passes, but that is a logical next step. Theoretically, an expected goal and expected assist model would be the best predictor.
Goals and assists are the unpredictable results of a more repeatable underlying process. By understanding and quantifying this process, we can move towards the signal and away from the noise.
StatsBomb Predictive Models - EPL Through Week 5
By Ted Knutson [I wrote this intro for my initial predictive model piece, but I’m guessing most people haven’t read that one, so it bears repeating here.] I work for a very large internet bookie. Because of this, I’m heavily restricted in what I’m allowed to write about. So despite the fact that I’m a subject matter expert in English Premier League betting, I ain’t writin’ about it, no way, no how. You’ll see me occasionally discuss my opinions on Champions’ League matches or College Football on Twitter, but that’s about it. (I don’t actually work on the Champions’ League product and used to bet College Football professionally before working at Pinny.) Anyway, I do other stuff at work too, including dabbling in predictive models. I can’t produce weekly picks for you, but one of the things I can do is discuss some point-in-time power rankings. Most of the models I’ve looked at become active after week 5, including the latest iteration of my own. For fun, I’ll post the initial rankings on StatsBomb for most of the European leagues as they come online, and you guys can argue about them until your heart is content or filled with hatred. Either way. Why Should I Care? You probably shouldn’t. This model is just stuff I play with during my spare time, and I’m certain it doesn’t have the brainpower or man hours put into it as something like the European Club Index from Infostrada. On the other hand, the most recent version of this model has been in play since June, and has done a good job picking out the good and bad teams in Brazil and MLS very quickly. Simpler versions of this model also predicted Augsburg would pick themselves up off the bottom of the Bundesliga and escape relegation last season, which they did. Sadly, it also thought Deportivo would save themselves from doom in Spain, but missed that one due to three losses in their last four matches. Ya win some long shots… A quick note on methodology: These rankings know nothing about the league table. They don’t care what team is in first and what team is in last, and operate on an entirely separate statistical methodology. They are highly predictive of future league places in the table, but variance exists. I would not post them if I didn’t believe they were pretty good. Additionally, these are very early rankings. Things tend to settle down a lot after week 10, so expect some volatility between now and when we next check back on them. EPL Rankings After Week 5
|
1 |
Tottenham |
|
2 |
Manchester City |
|
3 |
Chelsea |
|
4 |
Everton |
|
5 |
Arsenal |
|
6 |
Swansea |
|
7 |
Southampton |
|
8 |
Manchester United |
|
9 |
Hull |
|
10 |
Liverpool |
|
11 |
Aston Villa |
|
12 |
Newcastle United |
|
13 |
Crystal Palace |
|
14 |
West Bromwich Albion |
|
15 |
West Ham |
|
16 |
Stoke |
|
17 |
Norwich |
|
18 |
Cardiff |
|
19 |
Fulham |
|
20 |
Sunderland |
Predicted League Champ: Tottenham Fighting for CL slots: City, Chelsea, Everton, Arsenal, Swansea, Southampton (United – See Below) Relegation candidates: Cardiff, Fulham, Sunderland Before you start spewing hate at myself and the model, a few things to note. These are not mathematically adjusted for schedule strength. Manchester United have had a very difficult start to the season. Everton have had a fairly easy one. Thus there is strength of schedule skew involved, and while I think I’ve solved some early season SOS issues, the solutions are not ready for primetime. Additionally, teams will move through the course of the year. Sunderland were dead bottom for about 30 matches last season, but drug themselves out just in time to not get relegated. Last year, the bottom 3 in EPL according to the model were West Ham, QPR, Reading. In Bundesliga they were Hannover, Fortuna Dusseldorf, and Greuther Furth. It's not perfect, but it gets pretty close. Arsenal and Swansea are where they are by virtue of redonkadonk shooting percentages. For Arsenal, this is known as, “The Mesut Ozil Offect.” For Swansea it’s known as, “Michu ain’t regressing yet.” Probability says both will cool down a bit as the season goes on. Probability has also been known to lie. Sunderland I mentioned how Sunderland were really quite bad most of last season. This season, they were so bad they broke the model. Basically they did everything poorly except for the shots battle, and Crazy Paolo had no idea what he was doing. He’s gone now. What does that mean for the rest of Sunderland’s season? I have no idea. No one does. I don’t think this team is as bad as their coefficient looks but… Thus far they have been putrid at doing things that matter. That could change quickly. Or it could stay that way the entire year. It may take quite a while for even a good manager to figure out what he has and how to play them. Their upcoming run of games mean things won’t look much better for some time. Cardiff Schedule issues make them look like relegation candidates (Everton, City, Spurs is a tough three out of five). I think they are better than this, but my eyes don’t always know the whole story. The next five games will go a long way toward telling us where they will likely be at the end of the season. A note for both Cardiff and Fulham: Only creating 8 shots a match will get you relegated. Period. In fact, no team in the last five years of the Premier League has posted fewer than 10. You’re going to need to step it up. Tottenham  At the top, Spurs have the best coefficient by some distance. On the other hand, they have had some easy matchups in Crystal Palace, Cardiff, and at White Hart Lane against Norwich and still have trouble scoring. Swapping in Lamela for Andros Townsend will increase their goal expectation considerably. Aside: Townsend is terrible at choosing where and when to shoot the ball. He has 22 shots already this season and zero goals, and that’s not really a fluke. He has been a stone cold killer of attacks so far this year, and someone needs to sit him down and coach him out of it, fast. “Repeat after me, Andros: You are not Gareth Bale.” Do I think they will actually win the league? *Kicks some pebbles and shrugs* Probably not? But I feel pretty strongly they will take a Champions’ League spot this season and the model does too, which means someone important is getting pushed out. The gnashing of teeth when that happens will be epic. Liverpool I wrote about this in detail yesterday[LINK]. “I gotta ask, Brendan… where’s the tiki-taka?”
Defending in the EPL
Follow @colinttrainor Football the English Way For as long as I can remember the British football pundits, media and commentators have talked about how the English game was faster / more physical / had less space (delete as appropriate) than the football that was played far away in a land named Europe. I have often wondered how they arrived at that conclusion. The hard pressing, high line tactic that has started to make its way into England in recent years has its roots firmly established in Europe. All other things being equal, this gradual acceptance in England of the hard press should therefore mean that when in possession, players in England should have more time on the ball than their foreign counterparts. In this piece I’m going to use my Expected Goal data to demonstrate that it really is much tougher to score from any given shot in the Premier League than in any of the other Big 4 European leagues. This assertion is based on the 2012/13 season – it is limited to last season due to a lack of prior data.  Can we demonstrate that it is more difficult to score in England? In order for the numbers to “prove” that it is more difficult to score in the Premier League we are going to have to make just one assumption. I am fine with this as I think it is a reasonable assumption to make, but I’ll let you decide. The one assumption required for these numbers to hang together is that “Strikers in the EPL are on average no worse than those in the other Big 4 leagues”. I certainly think this is the case. For every Bale and Ronaldo that have left the EPL at the height of their powers we have an Aguero, Negredo, Navas, Soldado to replace them. The money that permeates throughout the Premier League means that this assumption is perfectly valid in my opinion. Remember, the quality of the strikers doesn’t need to be better than the other leagues, just no worse on average. On this basis I think we are OK to proceed. Regular readers of my pieces will know that Constantinos Chappas and I have developed a model that assigns a goal probability (ExpG) for each shot. The probability is based on the location, the type of shot and a few other factors, and was developed using shot information from across the 5 leagues. The summary ExpG, shots and goals table for 2012/13 for the Big 5 leagues is shown below: [table id=29 /] The ExpG values are a work in progress - this explains why I now have the EPL at 84% efficiency (Goals / ExpG) whereas I had mentioned 90% in a previous article - as we tinker and fine tune them. Note that Own Goals are excluded from the goals totals shown above. For the 2012/13 season, the quality of the average chance attempted was marginally higher in England than in the other leagues at 0.114 Expected goals per shot. Germany and Spain followed closely behind at a clip of 0.11 goals per shot. However, look at the Goals / Shot ratio. The Premier League only actually recorded 0.096 of a goal per shot, which is at just 84% of our expected rate. On the other hand, the Bundesliga teams recorded 0.112 goals per shot. So from what appeared to be less productive shots the German teams managed to score much more goals per shot than the Premier League and indeed, in absolute terms, more goals than our model had expected them to score. Ligue 1 is also interesting. This league is notoriously low scoring, but this is due as much to the lack of shooting (less than 24 shots on average per game) as it is the average shot quality. Please keep in mind that for this exercise we are not interested in the total number of goals or shots achieved in each league. We’re interested in the average shot quality in each league and then the subsequent conversion of those average shots as I look at how our ExpG efficiency, which is an objective measure, varies by league.
  Possible explanations for the EPL under achievement I can come up with a few reasons why our model has seen goals in England converted at just 84% of the rate that we had expected:
- Defensive Pressure
- Better standard of Goal Keeping than in other leagues
- Our model, although good, is missing other certain ingredients to capture exactly the rate that any given chance is converted
- Chance or random variance
Most of those possible explanations are fairly wide ranging, and ones that I’m not sure how to tackle at this stage. But using an idea that Sam Green posted in an Opta blog in 2012 I have come up with a method of evaluating the amount of the shortfall in shot conversion that is due to defensive pressure, and it’s this that I want to investigate. Introducing ExpG2 Up until this point, our Expected Goal model looked exclusively at the factors present at the point that the shot was struck. We have used a similar framework to create an Expected Goal model which is based on where the shot was aimed for, and I’m using this article to introduce this metric. In order to differentiate these two different Expected Goal values we will now refer to the expected goal probability at the point the shot was taken as ExpG1 and the value after the shot has been taken as ExpG2. A shot that is off target or blocked has an ExpG2 value of zero as those shots have no chance of resulting directly in a goal, whereas a shot that is arrowed right for the very top corner will have a high ExpG2 value as the likelihood of a goal is strong. An extreme example would be a penalty that is aimed at the top corner; such a shot would have an ExpG2 value of approx 0.96 with an ExpG1 value of approx 0.75. ExpG2 values Let’s have a look at what the ExpG2 values looked like for each of the 5 leagues last season, and most importantly how they compare with their respective ExpG1 figures. [table id=30 /] I’m ignoring the actual goals scored for the purposes of this exercise, and instead am concentrating on the differences between the ExpG1 and ExpG2 values for each league. For four of the leagues the differences between the two sets of values are small, at 2% or less. But the difference between the ExpG1 and ExpG2 values for the Premier League last season are extremely significant in comparison at 10 percentage points. Let me step you through exactly what this means, and the significance of this. Looking at the situation at the point when the shots were struck (ExpG1) our model had expected to see 1201 goals in the Premier League last season. Here’s the important bit. When we then take account of where the shot was aimed for the expected total goals dramatically reduce to 1083. Remember that the other four leagues showed comparatively little movement between the two measures. This suggests that, on average, the other four leagues all exhibited similar tendencies on average in terms of the change in probability of a shot being scored after it has been struck compared to before the shot took place. But for some reason, the English Premier League reacted totally differently. Let’s now remind ourselves of the assumption that I made earlier in this article. If we assume that the quality of the average striker in the Premier League is no worse than the average of those appearing in the other four leagues then the low Expected Goals total that has been calculated after the shots have been struck can only be due to defensive pressure. As we’re happy that EPL players are no worse at shooting, and we have normalised the quality of the shots, there is no other reason to explain why such a large proportion of shots are blocked, miss the target or are aimed towards the centre of the goal. This same amount of defensive pressure simply seems not to be present in other leagues. As we have normalised for shot location and are ignoring whether the keeper actually saves the shot or not, we are left with the defensive pressure as the only remaining explanation for the large drop in goal expectation in the EPL between ExpG1 and ExpG2. In my opinion it’s not important that we break down the reasons for this low ExpG2 totals between missed shots and blocked shots. It’s enough to know that this heavy defensive pressure insures that the probability of a goal being scored in England from any given shot is much lower than our original model predicted, and indeed lower than in any of the other main European leagues. Due to the lack of proper defensive measures we were always aware of the fact that our model didn’t take into account defensive pressure, but for the first time thanks to the introduction of the ExpG2 metric we can demonstrate the impact of defensive pressure that is epplied in the Premier League. I am aware that this conclusion is based on just one season of data, but due to the size of the difference in the EPL, the defensive styles that tend to be played in England and the fact that there were almost 50,000 shots in this sample I would be confident that this phenomenon will hold true in other seasons. Why Go To All That Bother? Having done the work to demonstrate this, I now find myself asking if I needed to go to so much work in proving something that summary stats could have told us. For example, Germany, Spain and France all had more than 34% of their shots on target last season; it was just over 31% in England. This alone tells us that defensive pressure was greater, right? Likewise, only 9.6% of all shots were scored in the EPL last season compared to 11.1% in the Bundesliga, 10.7% in Spain and 10.2% in the traditionally low scoring Ligue 1. Again, I could have just used those stats and said “Due to lower percentage of shots on target and goals I conclude that there is greater pressure on attackers in England than anywhere else”, right? However, although that would have been a short cut it might not have been correct. The difference in shot on target percentage could have been due to shot locations, ie on average EPL shots were attempted from less advantageous shooting positions, alternatively the lower scoring percentage could have been due to the same reason combined with better performances from goalkeepers in the English league. This detailed analysis has ruled both of those possible explanations out – hence why I feel it was required in order for me to be able to definitively conclude that the pressure exerted on the player shooting is at a much higher level in the Premier League than in other leagues. Quantifying the Impact Over the 380 game 2012/13 EPL season the Expected Goals fell from 1201 to 1083 on the ExpG1 and ExpG2 measures respectively. This amounts to 0.31 goals per game, or just over 1% for each shot as there was an average of 28 shots per game last season. At this point we reach the take away message from this piece: Any specific shot in the EPL is scored at a rate of 1% less than the other four European leagues due to the pressure applied to the shooter, or due to other general defensive pressure A 1% reduction in scoring per shot doesn’t sound like a huge amount, but when shots are only scored at an average rate of approximately 10%, that extra defensive pressure soon makes a difference to the number of goals that are actually scored. Reasons for the Phenomenon The central finding in this piece may come as a surprise to many, and indeed will be contested by quite a few, as conventional wisdom would hold that players in the continental leagues have less time on the ball due to the high pressing game that would be prominent in those leagues. In fact only yesterday, a German based reader made this exact point in a comment in relation to an article where I made the point that our ExpG1 model over-estimated the number of goals that should have been scored in the Premier League:
You´re saying that there is a lot more defensive pressure in the PL than in other leagues e.g. the Bundesliga or Primera Division or even League 1. Well I don´t think that’s true. When Ozil moved to Arsenal, Fabregas said Ozil will enjoy PL because of the space OMs get in the PL. Then Ligue 1 is considered the league with less goals than other leagues. Furthermore the defensive compactness is definitely higher in the PD and the Bundesliga than in the PL. The athleticism may be higher in the PL but as our teams had to learn last year that doesn’t cover the fact that they are almost always split in two parts (an offensive and a defensive one) whereas other teams such as Dortmund, Valencia, Donezk and of course Bayern are defending with 11 men (even barca is defending with 10) and attack with 11.
I would suggest that although the hard press, high defensive line used in Europe certainly reduces space in the middle third of the pitch and leaves it more difficult for teams to be in control of the ball, once those defensive lines are breached the attackers are then faced with easier scoring chances. The defences are not as well set on the edge of the box and there certainly won’t be as many bodies between the striker and the goal. A perfect example of this was AVB during his time at Chelsea. He attempted to play the high defensive line, perhaps his players weren’t ready for it, but once that line was breached they were powerless to prevent the opposition converting the chances they created.
Tied for 3rd, but Reasons for Concern - Liverpool After 5 Games

by Ted Knutson [The Scene: Your typical movie half and half frame with two guys talking on telephones. In this case, the guys are Liverpool owner John Henry and manager Brendan Rodgers. In real life, John Henry sounds a lot like he does in this scene from Moneyball [LINK], but he also kind of sounds like Crispin Glover’s George McFly from Back to the Future. Brendan Rodgers sounds like Brendan Rodgers.] John Henry: Hey Brendan, how are you? Brendan Rodgers: I’m fine John, how are you? JH: Great. Brendan, I’ve been having Bill James look over some of the stuff at Liverpool in his spare time and I wanted to chat with you about it. BR: Bill James? JH: Yeah, he’s an American stats guy that helps us with the Red Sox. The Sox are in the playoffs again and he’s been bored, so I had him look at what’s going on in your neck of the woods. BR: (suspicious) Okay… JH: Anyway, he likes stats and he did some stuff that I wanted to show you. Are you near a computer? If you check your email, I sent you the files so you can follow along. BR: Sure. Let me just *click* 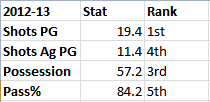 JH: Okay, this first one is what you guys looked like last season across the whole year. I know you didn’t have a true forward for the first half of the year and you lost Suarez for a while, but Bill said these numbers look really good. BR: On the form we had in the second half of the season, we probably would have made the Champions’ League. JH: Bill agrees with you. In fact, he said that the way you guys played football last season had all sorts of statistical significance in producing great results. 1st in the league in total shots, 3rd in possession, 4th in shots against, and 5th in passing success. Those are all great numbers. We probably made some mistakes in the summer before that season, but that’s on us. You guys did great work on the field. BR: Well thank you, John. JH: Now look at the next slide. This is Liverpool through the first five matches this year. I want to preface by saying that the results so far this season have been very good.
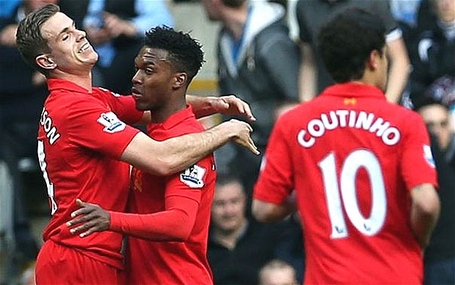
  JH: However, I’ve been talking to Bill, and he says the fundamentals are bad. BR: I don’t understand. We’re tied for 3rd in the table right now. JH: Yeah, but the league table doesn't tell the whole story... We’re 10th in the league in shots per game, and creating an astonishing seven shots less a game than last year. We’re also fourteenth in the league in shots conceded. BR: Well, we’ve played some tough teams, John. We’ve also had some injuries. JH: I know you have, and I respect that United, Swansea, and Southampton were a struggle. That said… 80.4% passing completion? 49.5% possession?!? That’s simply not what we’re going for, is it? It’s certainly not what you guys delivered last season. These are the stats of a midtable team, and you posted better numbers with worse talent at Swansea. JH: I can hardly believe my eyes here, but the team right behind us in Shots, possession, and passing is Stoke. Stoke! We are not Stoke. We are Liverpool. Football. Club. JH: I gotta ask, Brendan… where’s the tiki-taka? [End Scene.] If you follow me on Twitter, you know I have expressed some concern recently about how Liverpool have been playing #secretfan. Their defensive shelling has proven pretty effective at keeping other teams from scoring once Liverpool gain a lead, but one of the side-effects of shelling is supposed to be better and more frequent chances from counter-attacks for the team that is ahead. That has definitely not been happening (and I watched this closely prior to Coutinho’s injury), which means Liverpool are ceding one of their strengths - creation of shots in possession - for nothing more than better defensive cohesion. Liverpool have solid results so far, but as you can see from the stats above, the football they are playing is a) quite a bit different from last season, and b) flipped to the point where Liverpool’s Shot Dominance is inverted (below 1), meaning they give up more shots than they take. If you do that for an extended period of time, results will suffer. There’s just too much math and probability working against your team to prevail. The thing is, Liverpool used to defend via sitting on possession, like Barcelona. And before Liverpool, Rodgers did the same thing with Swansea. So what happened? What changed? Where’s the tiki-taka? I honestly don’t know. I can tell you that it’s not the absence of Chompy McBiteyface that’s causing this, because he was gone for large parts of last season and Liverpool didn’t play like this. Also, the stats were different before Ashley Willliams thugged Pip Coutinho (who I have named and shall refer to as “Pipinho” and you can’t stop me). While Pip’s injury is problematic on multiple levels, it’s not the underlying cause of the style change. Johnson played three matches before getting injured, so it’s probably not down to Glen’s absence either. Maybe someone should ask Rodgers? The Southampton Match I mentioned during the Swansea match that Aspas just was not working out when deployed centrally. In fact, Liverpool had enormous problems transitioning from attack to defense for almost the entirety of the second half of that match. Swansea are good, but they aren’t Barcelona good. The loss of Coutinho hampered what was already an issue, and it was made abundantly clear that Aspas was not an effective solution (during that match and in general). Thus, I was disheartened to see the lineup Rodgers ran out for Southampton, likening the battle to last season’s Stoke vs. West Ham (helloooooo Under). Four centerbacks meant no overlapping runs to create on the offensive end. It’s somewhat understandable given the injury to Johnson and the fact that Lambert and Osvaldo are both powerful and not terribly quick. Even so, Liverpool’s issues recently weren’t defensive – stopping goals is the one thing they have excelled at. My real frustration, however, came when I saw the midfield and attackers. Sturridge is obvious. Given his talents and Coutinho’s current injury, Moses is as well. However, there are massive problems when you combine the other four. Give me just a moment and I will explain. What do you know about Southampton? They like to press. They are defensively sound. They also have serious issues creating on the offensive end, and their attackers outside of Adam Llalana don’t have a ton of pace, but they do get a boost from their fullbacks. Split that out. 1) They are defensively sound. Breaking them down will be difficult. Even though Liverpool are at home, they may need to emphasize attack more to create goals. 2) They have serious issues at the offensive end (four matches, two goals scored!). Thus Liverpool’s defense – one that had just shut down Manchester United – should be able to contain the Southampton attack, especially if it is setup the way it was the week prior versus West Ham. (It was.) 3) They like to press. This one is really important. When you face teams that like to press, you have to take certain things into account. The first one is that they are usually pressuring the ball in the center of the pitch and in the offensive end, hoping to create turnovers there so they can get easy chances on goal. Liverpool should be familiar with the concept because they’ve done it themselves plenty, but not every team does this aggressively. In Liverpool’s case, it’s an even bigger deal because of a new addition this season: Simon Mignolet. You know your opponent has a goalkeeper who isn’t very good at distributing the ball. What do you do? Pressure the defenders and force back passes to the goalie! That’s exactly what Southampton did and very successfully, I might add. I also don’t think LFC were prepared for it, because they struggled with it. From Liverpool’s perspective, you have a GK who doesn’t pass that well and your defenders are getting pressured to pass back to him, how do you help your team out a bit? Add better passers, especially in midfield! This is a much bigger issue without Coutinho around as a release valve. Example: Dortmund pressed the living bejesus out of Real Madrid last year in the Champions’ League, with special focus on Xabi Alonso because they noticed that Real’s attack built from Xabi Alonso distribution. In response, Mourinho added Luca Modric into midfield. He realized that they needed an additional passing option to get the ball forward to Madrid’s incredible attackers, and added a second passing pivot to help bypass the press. Knowing that he had GK distribution problems and Coutinho was out, what did Rodgers do? Started the same guys as always! There are lots of issues with this. Lucas is great at what he does, but not an excellent passer. Gerrard is a good passer, but doesn’t have the legs that he used to have and can’t be relied on to dribble through pressure either. Henderson is quite industrious, but isn’t a +EV passer or a good dribbler. He completes few long balls a match and zero through balls. And Aspas is… well, through five matches, he’s not very good. He’s playing wide forward and only has two shots. Not per game. Total. He doesn’t dribble well, and his dispossession numbers aren’t great despite not seeing a ton of the ball. He is not making up for that on the defensive side of the ball either. It’s a little early to call him out as “bad,” but I will say he’s having a damned hard time getting comfortable. It’s possible that he’s as thrown off about the way Liverpool are playing this season as I am. Yet this is the fearsome foursome of players Rodgers went with against Southampton. In my mind, BR had to play Luis Alberto centrally. Another good passer on the pitch was an absolute necessity – one who could create a little time and could guide them through transitions despite Southampton’s press. Instead he came on a goal down in the 72nd minute and didn’t do much. Sterling and Moses could have been lined up as the two wide men (both can pass fairly well, even if Sterling’s first touch is about as subtle as a brick to the face), Sturridge up top, Alberto central, with either Lucas or Gerrard dropped. (This all assumes Joe Allen is still too injured to play and that there’s no one else who can pass and play midfield for Liverpool that I am forgetting.) I also would have played Enrique at least, because despite how frustrating he can be, he can also pick out a longer ball and create overlaps (remember, LFC need help to break down Southampton). Anyway, this match was a mess. Rodgers whiffed tactically and personnel-wise, Pochettino came in with a good game plan, and Southampton stole points at Anfield. What Happens Now? Now Suarez comes back, which means Liverpool either play him as a central, crazy distributor (I am on the fence as to how well he’ll work in the hole), or stick him wide right and terrorize defences with three of the fastest, most problematic attackers in the Premier League. The problem is… that doesn’t solve the transition issues that have existed all season. How does the ball get from defense to attack? Who bypasses any pressure? What the hell do they do if the opposition makes them keep passing the rock back to Mignolet? These are all questions Rodgers hasn’t answered this season, and teams will watch footage of that Southampton match and force Liverpool to deal with it. Through five matches, Liverpool’s stats look exactly like a midtable side. If they stay like that, Liverpool will likely be a midtable side at the end of the season, when last year suggested they are so much better. What happened to the high possession, high shots team Liverpool had last year, with or without Luis Suarez? Playing and producing like that team is damned important. I know the schedule hasn’t been a cakewalk thus far, but all I am saying is that there are signs that are a little troubling. The single most important question for the rest of Liverpool’s season might just be: Where is the tiki-taka?
Saturday Morning Ramble: Liverpool, Chelsea, Previews.
@BenjaminPugsley Statsbomb was due to record a podcast at some point midweek but September schedules, work, laziness and drinking got in the way. Oh, and some renovation work to a property next door also got in the way. That renovation work sounded like this: So, with no podcast this week I decided to ramble some on the topics that we were due to talk about.
Coutinho
 @sportsanalysis posed a question to the statsbomb podcast which went a little like this: What has happened to Coutinho's form and why hasn't he created a chance for his team-mates in 2 or 3 games? It's split the answer into two parts: Team Effects Liverpool have shown excellent early form which was built on getting into the lead (early) and tightening their defensive shape and 'shelling' (LINK & LINK). Liverpool have led for an average of 65 minutes per game which, due to the extensive tactical shelling, has led to Liverpool having only 48% ball possession, a 48% TSR (Total Shots Ratio) and a 50% SoTR (Shots on Target Ratio). Once leading, Liverpool haven't had much of the ball and chance creation - Coutinho's main skill - hasn't been required as often due to the aforementioned shelling and a virtually useless counter-attacking threat when shelling. Liverpool, for over 66% of their game time, have been playing pretty defensive and this naturally will knock Coutinho's creation numbers. The Player Is....now injured for six weeks. Liverpool will miss him, but the lay-off may not be such a bad thing for the player. A short lay-off, some rest and a lot of game video may not be such a bad thing. We must remember that Coutinho is a very young player, yes he is fucking brilliant, but young players can suffer wild peaks and troughs in form as they begin to figure out the game at the very highest level. Another issue I had with expectations regarding Coutinho was the lack of a history of performance. I don't think last season's minutes played were sufficient to judge what his true talent level is. You know, maybe he is that player from last season - the creative whirlwind, the next scheming superstar - but I want to see a much larger body of work before we anoint him with the world class tag at the tender of age of 21. Given time, Coutinho will get there and be a pretty special player. But he may not be consistently excellent until 23 or 24. Chelsea
  TKnutso/mixedknuts/Ted seems to think something is up with Chelsea. I'm slightly inclined to agree. I wasn't as bullish as some people were at the start of the season about Chelsea, but the people that were bullish about Chelsea probably know more than I do about these things than I do. From this very early point in the season it seems like Chelsea are having issues with controlling games and creativity. But hey, maybe these things are to be expected when integrating new players and a new tactical system. It takes time for things to bed in and this makes evaluating teams with new managers mighty hard. It's going to take time for Tottenham's new players to bed in, it will take time for City's players to get used to Pellegrini's schemes and it is going to take time for Chelsea's players to get used to Mourinho's systems. My issues with Chelsea:
- Age of some of the players and can Chelsea smartly rotate to prevent injuries like they did last year?
- What of Chelsea's strikers? Is there enough firepower; can they score by committee?
- Is Chelsea central midfield good enough for the title?
We'll only know the answers in time. There are issues for Chelsea and Mou to work through but that's the same with nearly every club at this stage of the season.
Previews
Norwich v Villa Meh. two teams who don't really know who they are yet. I like the attacking options of both of these teams, the difference between the two is while Villa are converting their chances (33% sc%) Norwich aren't (~9% sc%). Both of these teams are sub-par shots teams but it's Norwich who are struggling the most with the 18th ranked TSR in the division. Liverpool v Southampton Southampton should be a good opponent for this impressive Liverpool team. Saints are ranked 5th in TSR and 4th in SoTR in the early season shots rankings (which will change a LOT) and they keep the ball well enough for this fixture not to be a walkover for Liverpool. Without Coutinho and Suarez I do wonder about creativity if they come up against a defensive Southampton team or if they fall a goal behind. Southampton have spent just 1 minute in a winning position this season. That will have to change at some point. Newcastle v Hull Newcastle are the best team in the league in open play TSR, which is, well, mind blowing. Hull, who have faced some pretty strong quality of opposition have some sub-par underlying numbers. Newcastle with injuries to their key players are shit. Newcastle with healthy key players can out-shoot the opposition, but also have the individual quality to out-score the opposition. West Brom v Sunderland Give a shit. Two teams who are struggling mightily. West Brom can't generate offense. Sunderland can but an ~87.3 PDo is a giant anchor that is weighing them down at the moment. West Brom should pick up their home form at some point. PDC could be incandescent after this game if Sunderland lose. Chelsea v Fulham Fulham are the worst shots team in the league so far, Chelsea are the second best shots team. Chelsea's speed vs Fulham's non-speed should produce only one outcome. Could get ugly if Chelsea score early and try to work on their attacking game. Arsenal v Stoke Hughes has been impressive in the first four games going 2-1-1 but Arsenal have a lovely habit of dismantling the challenges of sub-par shots teams:
...we see the extent to which Arsenal creamed the weaker opponents. Arsenal had a record of 20-2-2 against teams with a SoTR(%) of less than 50%. That is simply an incredible record and works out to 2.58 points per game against sub-par SoTR teams.http://www.theshortfuse.com/2013/6/27/4472282/arsenal-and-the-race-for-4th-place-in-2012-13
 Stoke are probably going to be a sub-par shots team. Arsenal will likely pass them to oblivion and win. Palace v Swansea Palace are struggling by the TSR count and struggling in final third passes. home form is going to be key against a Swansea side who were very good against a shambolic Valencia on Thursday night. Thursday-Sunday games are a problem and we don't know how big an effect it may have at this early stage of the season. Swansea may have too much for Palace. Cardiff v Tottenham See above. Tottenham had no added travel miles. City v United Good luck calling this one. CIty are truly dominant at home, United have RVP and Rooney. Both clubs have new managers who are figuring things out but it's City who look mighty good by the underlying numbers. It'll be interesting to see if City match power with power of if Pellegrini will be crafty and line Milner up on the right to thwart United's strong left flank. Will Toure be given licence to roam like he did in the CL to such effect? Will City line up with a 3 of Garcia holding and the big beasts of Fernandinho and Toure given licence to blitzkrieg? Who knows. It's going to be a fascinating match-up though. I'd lean City but I have a slight bias in this one. Thoughts?
Under Center, Above Suspicion
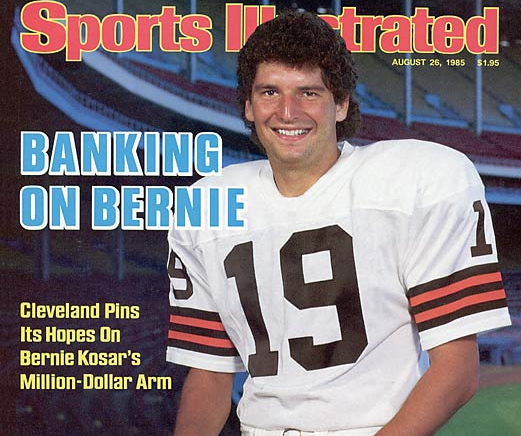
By Jon Corpora 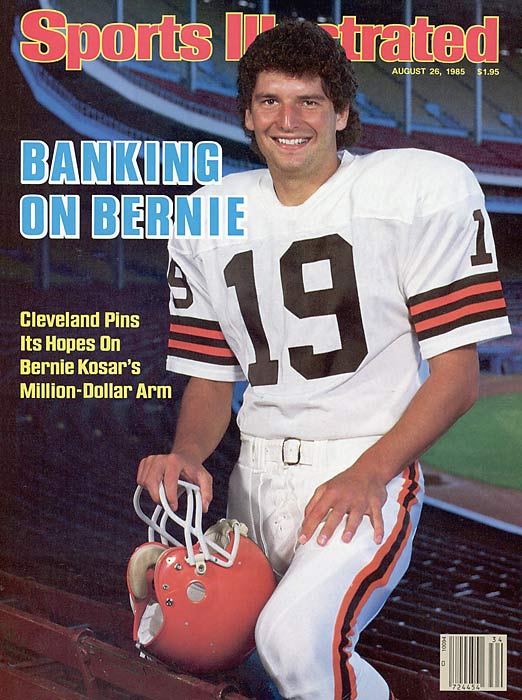 I was having a conversation with a friend the other day about what makes a loser loveable, as opposed to just a loser. We came up with a few ideas, chief among them that you can’t have a team with 100% consistent missteps and sadness and find them endearing for very long. (Think teams with absolutely no light at the end of the tunnel, like the Raiders and Jaguars.) Without the highs, you’ll eventually become inured to the lows, they’ll lose all their feeling, and you’ll find yourself watching defeat after crushing defeat with the occasional joyless win. A loser is loveable when they put themselves into position to do relatively well, yet seem to always come up short. The Cleveland Browns’ run as the Kardiac Kids was a particularly fun one to watch, even if the ultimate outcome always seemed somewhat predetermined in favor of whomever Cleveland’s opponent happened to be. Since the days of Bernie Kosar, however, the Browns have been relocated, rebranded, and subsequently born anew, and the continued misery of these Zombie Browns has only been punctuated by the fact that the original Browns - now the Baltimore Ravens - have won two championships since the relocation. In other words, the current iteration of the Cleveland Browns have been shit on more than a Boston mailbox on St. Patrick’s Day, and there is no end in sight. After losses to the Dolphins and the Ravens and a sprained Brandon Weeden thumb, it was announced on Tuesday that Brian Hoyer would be the starting quarterback for the Browns. Let’s take a look at the Browns’ depth chart at QB:
- Brandon Weeden. Confirmed Horrible. Owner of a 56.7% Completion Percentage, 15-20 TD-INT
- Josh Campbell. Confirmed Mediocre. 82.5 Career QB Rating. Victim Of Both Dan Snyder And Al Davis
- Brian Hoyer. Confirmed Human Male. Candidate for 2008 Johnny Unitas Golden Arm Award. Released By Three Teams. One Career Start
There is a weird tipping point where sports fandom stops being a labor of love and starts being a goddamn slog through treacle, and boneheaded moves like this are a great encapsulation of that point. Trying to figure out what the Cleveland front office is thinking here is like trying to deduce why your dog eats the trash – sure, you might figure it out, but at the end of the day, you’re trying to reason with a lesser life form and there’s still shit all over the floor. In 2013, the Browns have reached the tipping point, and we’ve only played two goddamn games. Do I think Cleveland’s front office realized something about Brandon Weeden in two games that they didn’t already have figured out from watching him in the preseason and all of last year? No, I do not. Do I think Cleveland was looking for any reason at all to bench their 29-year old 2nd-year quarterback? Of course. Do I think maybe Browns GM Michael Lombardi shut Brandon Weeden’s thumb in a car door repeatedly, laughing maniacally the whole time? I can’t prove that he didn’t! Here’s the part I can’t figure out: why have Hoyer leapfrog Jason Campbell on the depth chart? Being an NFL quarterback is hard, but Jason Campbell at least has the added upside of experience. Why roll the dice on a non-entity whose last remarkable achievement was Honorable Mention – All Big Ten? These games count! It’s really very odd; most teams don’t go this deep into the tank until at least week 5. Here’s what we do know about Brian Hoyer:
- He has been in the NFL for more than twice as many seasons as Brandon Weeden, but is two years younger
- Has a 59.4 completion percentage despite only 96 career attempts, while Jason Campbell sports a 60.8% completion rate in 2,186 attempts.
- Excelled at holding clipboard well enough to stay on New England’s roster for three seasons
- Grew up in Cleveland, just in time to replace LeBron James as the city’s favorite son
- Has seen snow before
- Cannot tear a telephone book in half
- Wears face paint for no reason, despite pleas of equipment manager
- Favorite drink is the Sidewinder: 1 part orange juice, 1 part warm milk, 2 parts Cognac
The Browns visit Minnesota on Sunday. It’ll be interesting to see if Brian Hoyer can right this ship. Somehow I doubt it. [At least we'll always have this from the Weeden era - Knut] 
StatsBomb Predictive Models – Bundesliga and Ligue 1, Week 5

By Ted Knutson As I mentioned last week [LINK], we’ll be posting the predictive model rankings for each team across the leagues, every five weeks or so. This week both Bundesliga and Ligue 1 came online, so we’ll look at the current rankings there and add some descriptive elements plus caveats on why some things aren't quite as clear as they should be. Since I am pretty well versed in the teams in these leagues compared to the ones I reviewed last week, I also noticed an issue with strength of opponents across the first five matches that appears in certain leagues and not others, which I will also highlight below. Bundesliga – Through Week 5
| Rank | Team |
|
1 |
Borussia Dortmund |
|
2 |
Bayern Munich |
|
3 |
Augsburg |
|
4 |
Bayer Leverkusen |
|
5 |
Schalke 04 |
|
6 |
Hertha Berlin |
|
7 |
VfB Stuttgart |
|
8 |
Hamburger SV |
|
9 |
Hoffenheim |
|
10 |
Wolfsburg |
|
11 |
Hannover 96 |
|
12 |
Borussia M.Gladbach |
|
13 |
Braunschweig |
|
14 |
Werder Bremen |
|
15 |
Mainz 05 |
|
16 |
Nurnberg |
|
17 |
Freiburg |
|
18 |
Eintracht Frankfurt |
League Winner: Dortmund, Bayern Champions League Places: Augsburg, Leverkusen, Schalke Relegation: Nurnberg, Mainz The league winner fight is exactly as expected. Thus far in the season there is basically nothing to separate Dortmund and Bayern (which is saying a lot about Dortmund) – they are both out-of-this-world good. A very large caveat about these rankings. Through five matches, there is no strength of schedule correction (at least partly because in other leagues, it’s hard to tell who is good and who isn’t before the season). Thus if you played Dortmund or Bayern, your stats are skewed in a bad way. Leverkusen are also good enough to give a slightly unfair negative skew in the coefficients. If you somehow were unlucky enough to play BOTH Bayern and Leverkusen AWAY, like Gladbach did, well, you are probably a lot better than your current coefficient looks. (Freiburg also had the same double dip, but one of those was at home. Frankfurt had Munich and Dortmund, both at home. Facing a couple of hugely talented opponents when others have not skews things a lot right now. There are solutions to this type of problem, but they all have their own issues.) Looking at the Champions’ League spots, you will see a very surprising name in there: Augsburg. The same Augsburg that was bottom of the table last winter and barely avoided a relegation playoff. The simple fact is that they have been playing good football for the entire year, and have the lowest shots conceded number in the league. I checked last year’s stats, and they were considered the 6th or 7th best team then, despite exhibiting relegation form for half a year. They are real and they are not likely to go away unless an injury crisis hits. [Also, if any team out there needs a new manager, take a long, hard look at Marcus Weinzierl.] As for relegation candidates, I am giving Freiburg and Eintracht Frankfurt a pass for now because of their strength of schedule. Mainz doesn’t get that pass. They have yet to play any of the big three, and their fundamentals are quite poor. The good news for them is that they won their first three matches, but I expect heavy regression before the winter break. Nurnberg are also in here based on poor fundamentals. They did face Bayern in Munich, but have been absolutely dreadful otherwise, giving up the most shots against in the league by far. Corrected for schedule, they are far and away the most likely team to get relegated this year. Ligue 1 - Through Week 5
| Rank | Team |
|
1 |
Paris Saint Germain |
|
2 |
Monaco |
|
3 |
Marseille |
|
4 |
Lorient |
|
5 |
Lille |
|
6 |
Lyon |
|
7 |
Rennes |
|
8 |
Evian Thonon Gaillard |
|
9 |
Reims |
|
10 |
Guingamp |
|
11 |
Valenciennes |
|
12 |
Nantes |
|
13 |
Saint Etienne |
|
14 |
Sochaux |
|
15 |
Nice |
|
16 |
Montpellier |
|
17 |
Ajaccio |
|
18 |
Bordeaux |
|
19 |
Bastia |
|
20 |
Toulouse |
League Winner: PSG Champions League Places: Definitely Monaco. Then two of Marseille, Lorient, Lille, Lyon Relegation: Bastia. Ajaccio? Lots of uncertainty here so far. I know PSG are technically in third and Monaco lead the league, but at the end of the year I don’t think the race will be that close. PSG are miles ahead of anyone in the league in terms of quality (both perceived player quality and coefficient quality), and are much more aggressive in trying to destroy teams than they were under Ancelotti. Blanc has let slip the dogs of war and they will maul most of the league at one point or another this year. Monaco are also very good, and likely will go from promotion to 2nd in the league this season. After that, you have lost of the usual suspects for Ligue 1, with Lorient pitched in the middle. There are some questions about whether Marseille and Lorient can sustain their form, but for now they appear to deserve their markings. At the bottom end of the league you have Bastia, who are awful. They haven’t played anyone good yet and have a terrible coefficient. It’s just going to get worse from here out. Toulouse and Ajaccio might also be awful, but I’d want a few more games to be certain. Bordeaux is probably not awful, and are only hanging out down here in the French sewers because of opposition strength. They’ll get better, but not enough to challenge for Europe. Conclusion So there you go. After five games, we can make some very early conclusions. Dortmund, Bayern, and PSG are all incredibly good, again. Monaco are immediately reflecting their summer spending spree (and Ranieri was actually a statistically solid manager at his many past teams). Bastia and Nurnberg are both very bad, and excellent choices to be relegated. We’ll check back on these teams in another five games and see how much movement there is in each league.
Where Have All The Goals Gone?
 There has been a lot of chatter around the exceptionally low goals total during the first 4 weeks of the 2013/14 Premier League. Smart articles such as this one from Mark Taylor discuss, using statistical methods, just how much of an outlier the start to the season has been. I wanted to employ my methods to see if I could shed any light on where all the goals have disappeared to during the first 40 games of the 2013/14 Premier League season. TheExpG values quoted in this piece are the result of the work that that Constantinos Chappas and I have undertaken. Using all the available shot information, we assign a probability of each shot being scored; we term this ExpG. A little more detail can be found in this introductory article I will compare the start of this season with the opening 4 Game Weeks from last season.
 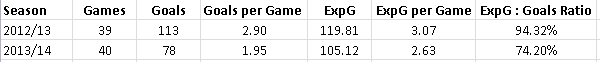 At this stage last season 39 games were played and this resulted in a very healthy goals total of 113, or an average of 2.90 goals per game. Fast forward 12 months, and after 40 games have been played and we are seeing less than 2 goals being scored per game – hence all the discussion around our lack of goals. The 2.90 goal average at the start of last season was slightly high, and this regressed to a more normal 2.80 as the 2012/13 season progressed. However, at this stage I’m not really interested in directly comparing the 113 goals last season with the 78 goals scored this season. In medical terms, this shortfall of 35 goals could be described as the symptom; I’m interested in seeing if I can uncover the cause. Last season is a good base to compare the current season as its goal total at this stage was just 2 or 3 goals ahead of what a typical Premier League season is likely to have experienced. The important figures in the table above are last three columns which are the expected goals that the shots taken should have generated, the average per game, and finally the actual goals viewed as a ratio of the ExpG value. ExpG Values What the ExpG values tell us is that, although the shots that are being taken this season are less threatening than we saw last season (and I would assume from before that as well), the shot selection doesn’t explain nearly all of this season’s impotence. Actual goals are only being scored at 74% of the clip that our model would expect them to be scored at based on the quality of the shots attempted. As seen in the introductory article referenced above, the Premier League finished last season with actual goals being scored at approximately 90% of the rate that our model had expected. The reason that this is not 100% is that the model was fitted with data from Europe’s Big Leagues and it is well documented that, presumably due to defensive pressure, it is much more difficult to score or get shots on target in the Premier League than it is in Germany. A Typical Start to the Season Let’s set out what a boringly average start to the season would look like. A normal, run of the mill, start to the season would have seen approximately an average of 2.80 goals per game. So after 40 games we would have expected (all other things remaining equal) to have seen 112 goals; and for those 112 goals to have been scored I would have expected our model to be showing an ExpG total of 124 (this allows for the 90% efficiency in the EPL). Our shortfall in actual goals scored so far is 34 (112 – 78) and this variance can be broken down into its constituent parts, ie the amounts being due to insufficient ExpG (Shot Selection) and the amounts arising as a result of the shots that were taken not being converted at the expected rate (Shot Conversion). Variance due to Shot Selection For the 2013/14 season to be on track at this stage we should have seen 124 ExpG being converted at 90%, but instead there have just been 105 ExpG. So the variance due to shot selection, or lack of, is: (124 – 105) * 0.90 = 17 goals Variance due to Shot Conversion Based on a normal ExpG conversion ratio of 0.90 for the Premier League, the shortfall in goals due to poor conversion of the shots that have actually been taken is: 105 * (0.90 – 0.742) = 17 goals Distribution of Goals Shortfall So, we have demonstrated that the 34 goal shortfall experienced at the start of this season in comparison to a “normal” Premier League season can be attributed equally, 17 goals each, to the shots that are (not) being taken and to how those shots are being converted. Or shot selection and shot conversion. The first component of the shortfall, the shot selection or lack of, may be due to playing styles. Possible explanations of this include the Liverpool shelling during the first 3 games, prudent Moyes taking over at Man United and Mourinho playing some pretty conservative football. Perhaps those tactics may well continue into the season, and thus we will continue to see lower ExpG values than we are used to in the Premier League. Alternatively, perhaps the lower ExpG values are primarily due to small sample sizes and / or chance with the result that the deficit being caused by shot selection will unwind itself as more games are played. Whatever about the shot selection component being due to chance or otherwise, I am certain that the conversion part, which is also responsible for 17 goals, of the shortfall is entirely due to chance and this will quickly correct itself as the number of games played increases. Why the low conversion rates this season? The table below excludes Own Goals (3 last season and 1 this season) and presents the data by ExpG bands which have been rounded to the nearest 0.05 of a goal.
 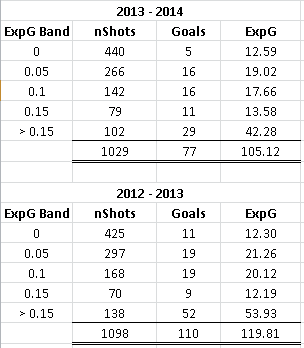 The two bands which are the biggest outliers this season in terms of Actual Goals versus Expected Goals are the shots that had a goal probability of more than 0.15, ie the best chances and the very speculative shots which each have a goal probability of less than 0.025. There probably isn’t much point in analysing why the 440 shots with the lowest scoring probability have scored 6 less goals that I would have expected, but the shortfall within the best chances band is interesting. Within this banding, the 42 ExpG translates to 38 actual goals if the 90% EPL efficiency is adhered to. So the 9 goal shortfall out of 102 very good chances is interesting. 23% of these shots were saved this season; this compares with a saving rate of just 14% last season. I’m all for giving goalkeeper’s credit when they pull off great saves, but this large increase in saving rates of very good chances gives further credence that the goals shortfall, that is at least attributable to the poor conversion rate of chances attempted, will be temporary. In my opinion, the part of the goals shortfall that is due to the number and type of shots being taken is also likely to regress to more normal levels. However, for this component there is always a chance that the change in playing styles observed this season within the league may ensure that the shots attempted continue to be less than we would expect.
StatsBomb Editorial – Status Report September 2013

StatsBomb has been alive for a little less than two months, and I wanted to just give a heads up of where we are at, what we’ve learned, and what we’re working on. For those who missed my introduction to the site, you can find it here[Link]. For starters, I know the site needs work. I wanted to get everything up and running before the season, so that we could do season previews and the like, and I was incredibly happy with what we produced for those. Now that we’ve kind of bedded in though, we’ve all noticed a number of niggling things about the WordPress theme we’re using that are annoying (LIKE INVISIBLE LINKS GODAMMIT and the fact that somehow the theme author’s pagination into the archives doesn’t work), so we’ll fix those and make the site more user-friendly and accessible in the process. I’m an idiot when it comes to actually making/fixing websites and I have absolutely zero cycles to spare learning it, so I’m paying someone to do it. It will just take a little time. I’ve also heard some valid criticism that Football/Soccer stats writing isn’t accessible (enough), including stuff here at StatsBomb. This is fair. On our site, you’ll usually find guys go out of their way to make even complex stuff approachable compared to other hardcore stats authors, but I personally need to do some organizing of the site and make more introductory pieces available. We’ll have a highly visible glossary with links up by early next week. We’ve already started writing more intro pieces on specific topics (like Defensive Shells [LINK] and Per90s [LINK]) and there will be more. I’ve also wanted to do a more comprehensive introduction to football analytics since I started reading about it, but things change so much and so quickly that it’s hard to make something currently relevant that won’t be outdated within a couple of months. Additionally, there are a lot of things from just a few years ago that are buried under a mountain, and you need to know the right people to even be aware they exist. However, as part of making our own stuff more accessible for new readers, I may take a crack at making sure people know some historic work exists as well. I’m at least nine months better read than when I first wanted to write the piece, so it has at least a chance of succeeding now. What Have We Learned? This isn’t about the game itself, but more about the site and the audience. First, I think a surprising number of fans are ready for this stuff. The Numbers Game by Chris Anderson and David Sally had very solid reviews in the UK and has now spread to the US as well, and I know they’ve been doing fairly prominent press for it. That said, football analytics is an infant. We just got extra years of detailed player data two months ago. Good public data has only been available for two league seasons now, and the whole discipline is still in the process of figuring out what data matters, as well as trying to get data providers to give us data in a way that is clean and useful. Americans faced with this immediately shout, “What the fuck?!?” because their sports culture has been stats obsessed for some time. Europeans often first shout “Shut the fuck up!” because they don’t think stats matter, or that they ruin the purity and sanctity of the beautiful game. Obviously the Americans are right, but it will take a good many years before we get anywhere near the level of data availability and acceptance that say NBA has right now. (And that sport has only seen a popular analytics explosion in the last five years or so.) Adam Bate (@ghostgoal) is writing some good analytics stuff for Sky Sports and Mike Goodman (@theM_L_G) has been able to work in some strong analytics intros to Grantland, but I wouldn’t describe the use of analytics for football writing to be widespread or mainstream. I think there are some sites and guys that are comfortable with doing a little bit of it, but it’s not a daily thing by any means. On the other hand, this type of stuff is now widespread for other sports. Grantland is the best sportswriting site in America, and they are very happy to have guys like Bill Barnwell and Kirk Goldsberry producing analytics material for NFL and NBA almost every day. I’ve reached out a little to The Guardian to see if they want stuff on analytics like they get on tactics from Michael Cox and Jonathan Wilson, but it hasn’t happened yet. For now, they run pretty infographics from WhoScored, which is something new and at least in the ballpark. Any of our writers would be open to branching out and testing the major media waters, so get in touch if you are interested. Speaking of which, WhoScored, Squawka, and EPLIndex have shown explosive growth in the last year. People are interested in the stats and what you can do with them. The harder analytics community may grouse about some of their written pieces (which can be rough or just completely miss the point sometimes), but I’m happy to see them grow and delighted for the stats they are delivering. Fantasy sports are a natural hook, and so are providing stats on hot transfer targets. I also feel like match recaps will see massive changes in the next couple of years in that the narratives will focus on and use the statistical details much more than just telling a story. Where Are We? On a normal publishing day, StatsBomb gets about 2000 hits. Good, team specific articles can get closer to 5-7K during their lifespan, depending on what ReTweets they get on Twitter and who is kind enough to publicize them. Honestly, that’s what we live by. Some bigger Liverpool, Arsenal, and Chelsea accounts have been kind enough to promote our team-specific work, and that’s how we get more fans and more followers. If you like our work, please tell your friends and their friends, and post links on busy forums or on Reddit, etc – that’s the best thing you can do to help us grow, which in turn means we’ll keep writing. (And thanks to guys like ArsenalColumn, Tim Stillman, 7AMKickoff, ChelseaStats, and everyone at The Tomkins Times for being supportive of our stuff.) It sounds silly, but I used to write for Magic the Gathering sites and would get 10K hits per article without trying (and it’s a lot bigger now). Football has a much larger potential audience, but stats and analytics inherently limit it. You kind of sub-select smart people by picking this topic to explore and write about. On the other hand, we get quite a few more readers on average than most guys would get on their blogs, so in that sense we’re succeeding. Honestly… the site has only existed for two months and it’s gradually growing. I wish we’d grow a little faster, but I’m not putting a lot of effort into it and neither is anyone else, so whatever. The bulk of “effort” goes into the writing and the research. The @StatsBomb twitter account itself hasn’t broken 1K followers yet. This is despite promising we’d announce a kit giveaway once we reached that mark (and we totally will. You know… when we get there). My own account has 3100, but has grown quite a bit since earlier in the year. Additionally, I know at least 5-10 first team analysts from major football clubs are actively following what we produce on StatsBomb, so the research is interesting some very specific people who view it as important, even if it’s not got a broad following as yet. The aforementioned Goodman produced one piece on the site, started a conversation with Grandtland’s Chris Ryan, and now writes for them. Good things are happening. On the other hand, good, team specific Twitter accounts I see have 30, 50, 80k followers. Crappy ones have 15k. Our guys are doing great work, but nobody knows about them yet. Will we ever reach the point where someone has 100K plus like friends of the site and TV faces Janusz Michallik and Gabriel Marcotti? Doubtful, but who knows? I’ll be honest – if I cared about hits, I’d be writing entirely different stuff. Instead, I care about the writing and the research, which is why we produce what we do. I do want to start producing more graphics and prettier data explorations, but that takes time to learn in and of itself. There’s no pay in running the site or writing for it. We’re not monetizing the site right now either. (I could, if I didn’t work for who I work for, but for now it’s better than it grows organically.) On the other hand, we want our work to be read and be popular. I also want the discipline itself to grow. We can satisfy both by making things more accessible and doing some low-key, low-cost marketing, so expect to see a bit of that in the next month or two. So that’s where we are at. Statsbomb will get a better user experience soon. The site is growing, but slowly. Football analytics is growing rapidly in some areas, but is still in its infancy compared to what is going on in other sports, and also in its usage in major media. Fans are definitely ready for it, though. We do get some really amazing compliments from you guys. If you like our work, tell your friends, and help us get the word out. Thanks for listening, --TK