StatsBomb, the fast growing football data company, has signed a multi-year deal with English Premier League Champions Liverpool FC. As part of this deal, Liverpool will become the first major customers to benefit from StatsBomb’s revolutionary new data product, StatsBomb 360.
Liverpool FC, for many years one of the world’s leading proponents of data led analytics in football, has switched to StatsBomb for standard event data for over 80 competitions, adding StatsBomb 360 data for 38 of those.
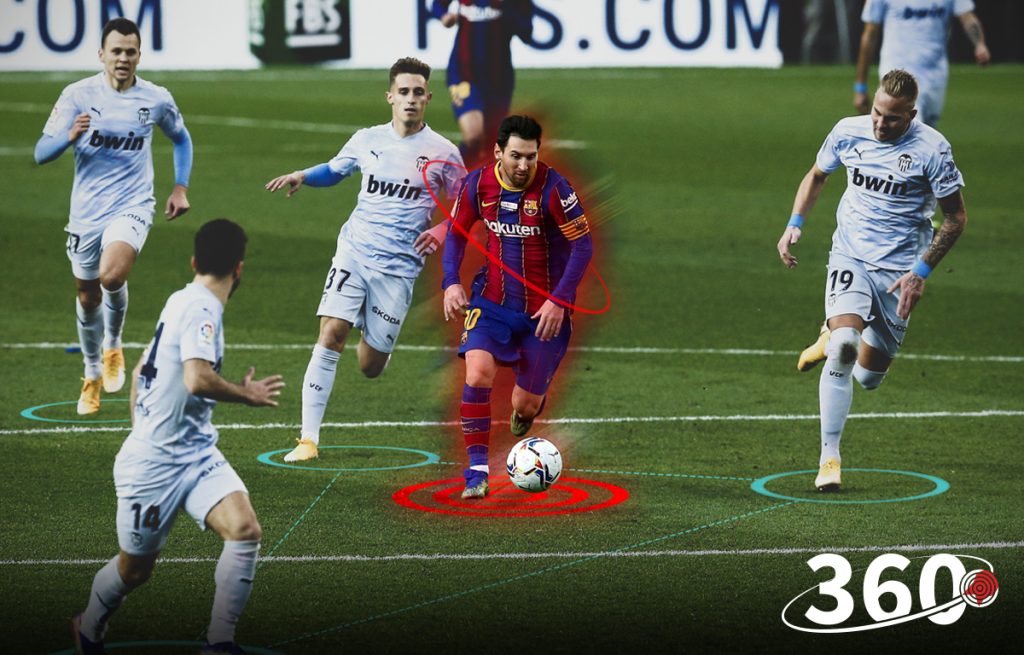
Launched at the StatsBomb Evolve online event, StatsBomb 360 adds a snapshot of player locations around every on-the-ball event during a match. This provides extra context to the 3,300+ actions collected as part of StatsBomb’s market-leading core data set. This extra information enables teams and betting operators to conduct deeper analysis than ever before possible using event data, and surfaces insights around defending, team shape and individual player performance without the need for complex and inconsistent tracking data.
Since its launch in 2018, StatsBomb has grown to become one of the fastest growing sports data suppliers in the world, with teams and betting companies from over 20 countries switching over to utilise StatsBomb data for predictive analytics, performance analysis and player recruitment.
Speaking of the deal, StatsBomb CEO Ted Knutson said:
“We are delighted to be working with Liverpool FC. They have been known for years to be at the forefront of the analytics revolution in football, and it is tremendous validation for StatsBomb that they have put their trust in us to deliver the data that will form a critical part of their data-driven infrastructure. We have been working on StatsBomb 360 for several months, and to have such a high profile client at launch is a sign of just how significant a step forward this product will be for the football world”
StatsBomb 360 is Contextual Event Data that gives the location of all players on the pitch for over 3,300 events per game, and represents a further upgrade to the most accurate and granular data in the market. If you would like to hear more about how this data can help you achieve your objectives, contact us here.
In early February, we pulled back the curtain to announce the impending release of our brand new data product StatsBomb 360, as well as revealing details of our upcoming #StatsBombEvolve event on March 17th to launch it into the world. We're one week out from the event, so let's recap all that's been going on since the announcement. In the initial announcement, we explained the concept behind StatsBomb 360 Data and gave a glimpse of the information that was previously unattainable in existing data, but would now be unlocked by 360. "StatsBomb 360 is contextual event data. What that means is that we are now collecting a freeze-frame showing all players on camera for every event we collect - approximately 3300 events per match.360 is also going to allow us to uncover a host of new information about the game that was either difficult to see or completely hidden in basic event data. We will now be able to deliver things like:
Line-breaking passes
Ball receipts in space
Distance to all defenders in the frame
Passing lanes
Defensive Island Events (DIEs) - a new event looking at when teams leave/create 1v1s with defenders by themselves, far from defensive help
Defensive shape around every event
All delivered straight into the event API.And honestly, that’s barely scratching the surface for what will be possible with StatsBomb 360." Our customers first heard about 360 back in January to allow them to prepare for launch, and got their hands on sample 360 data a couple of weeks ago. The questions and feedback we've had since then have only reinforced our belief that 360 data will dramatically change what can be possible with event data. It brings us one step closer to "football reality". It won't just be 360 that will be unveiled at Evolve. There'll be talk of StatsBomb LIVE ahead of it's release in mid-2021, updates on the latest innovations coming out of our Data Science team (including information about our On-Ball Value (OBV) model enhancements), plus insight from our Collection and Quality Assurance teams to hear more about how we keep our data at the top of the industry. StatsBomb Evolve will be taking place online and is free to everyone to attend. All you have to do is sign-up here.
In the lead up to the event, we've been taking a look back on how we changed the football data industry when we launched StatsBomb Data back in May 2018. The launch of StatsBomb Data represented a serious upgrade to the quality and granularity of data that was already out there, and introduced a host of new datapoints and metrics to the industry. Since then, our data has empowered our customers to deliver greater insights within their analysis framework. We exampled a few of those in our StatsBomb Data Case Studies series, with a few excerpts from each piece below:
Pressures
Full piece here. In a season where teams across the world are looking to conserve energy just to survive the condensed fixture schedule, Leeds have barely taken their foot off the gas, continuing to press and engage the opposition all over the pitch. Wherever the ball is, Leeds are going after it. We knew that adding pressure data to our data specification back in 2018 would introduce significant context that was previously missing when evaluating a team’s approach out of possession, allowing for a deeper level of analysis and a more complete picture of the game. For example, here’s Leeds’ defensive activity map this season, relative to the rest of the Premier League, without pressures included: As you can see, it would suggest that Leeds are fairly active off the ball, but not significantly more than other teams in the league, particularly in the opposition half where they appear to be a shade above average. Including pressures tells a different story. Now we can see an accurate reflection of just how active Bielsa’s side are out of possession. To read the full Pressures piece, click here.
Actions Under Pressure
Full piece here. With attacking teams regularly employing a counterpress after losing the ball in the attacking third these days, having players that can handle the ball under pressure when building out from the back straight after a turnover is vital. We're looking for players that receive the ball under pressure in the defensive half and examining whether their next actions are successful in retaining the possession, either through a dribble, carry, or pass. Julian Baumgartlinger takes the crown this season, having kept the ball 100% of the time when receiving under pressure in his own half, though he has only registered 1.9 under pressure receipts in the defensive half per 90. Contrast that with Paul Pogba who receives the ball under pressure nearly twice as often at 3.4, but has retained the ball only 78% of the time. Despite a mixed few seasons since his 2017 move to Chelsea, Tiémoué Bakayoko’s control under pressure sees him second only to Baumgartlinger with a retention rate of 97%, and this coming from more pressured receipts than Baumgartlinger too. This is a consistent strength of Bakayoko's having been similarly reliable when receiving under pressure last season as well. Whilst at AS Monaco in 2019-20, Bakayoko had the best retention rate in Ligue 1, keeping the ball 97% of the time from 2.7 under pressure pass receipts per 90. To read the full Actions Under Pressure piece, click here.
Pass Height And Pass Footedness
Full piece here. So, Wolfsburg are the only team in the top European leagues that make more passes with their left feet than right. To better visualise this, we can compare the average pass locations of their players, as well as the footedness of those players, with those of the most right-footed team in the Big 5, AS Roma. It’s stark that even Roma left wingback Leonardo Spinazzola is predominantly right-footed, whereas Wolfsburg have a perfect balance between left and right footers, allowing wide players Renato Steffen and Josip Brekalo to swap wings with regularity, or rotate for Bote Baku on the right wing if the team needs a little more width. To read the full Pass Height And Pass Footedness piece, click here.
Freeze Frames And Defender Locations
Full piece here. On the defensive end, we can look at teams who get bodies behind the ball to stifle the opposition, by applying pressure on the shot taker or by defending space. Teams that defend higher up the pitch and apply pressure to the opposition backline have to work hard to recover their positions, whereas teams that look to stand off and regain their defensive shape tend to have more defenders in a position to defend the box once the opposition advance into their territory. Liverpool and Manchester City are again worth looking further into here. Both apply a lot of pressure on the opposition backline and look to keep the game in the opposition territory as much as possible, but looking at this it would appear that this season Manchester City have been able to recover their positions more effectively, averaging a higher number of defenders behind the ball when their opponents shoot in the box. That’s not to say Liverpool’s press isn’t effective though as they, like Barnsley in the Championship, press aggressively high up the pitch in order to suppress the number of opportunities the opposition are able to create in the first place. Barnsley have the fewest defenders behind the ball on average when conceding shots in the box, but the efficacy of their press means they only concede 2.8 footed shots in the box per game. To read the full Freeze Frames And Defender Locations piece, click here.
That's just a sample of the unique datapoints and variables, without even mentioning Shot Impact Height (the height of the ball at the time it was struck), that already make StatsBomb Data the best in the industry. But we'll never be content with standing still. We will continue to innovate. Always. We've changed the game once. In one week, with the launch of StatsBomb 360, we're going to do it again.
Join us at StatsBomb Evolve on March 17th 2021 to discover how we're going to change the football industry, including the launch of our new data product, StatsBomb 360. To find out more, click here.
Since our inception as a data company back in 2018, StatsBomb has been doing whatever we can to support the Women’s game. We have collected Women’s data on the same full spec as the Men’s since the very beginning, but we also recognised early on that there was more we could do to address the barriers around cost and expertise for Women’s teams.
After similar offerings in previous campaigns, we’ve this season been supporting performance and recruitment analysis departments across the Big Five Europeans leagues by providing free access to our StatsBomb IQ analytics platform to ALL teams competing in those leagues, covering the FA Women’s Super League, Division 1 Féminine, Frauen-Bundesliga, Serie A Women, and Primera División Femenina.
We have been thoroughly enthused to see the integration of data analysis into the internal processes of many teams across those divisions, enabling coaching and support staff to use objective, industry-best data in their tactical match and opposition analysis.
Thanks to this offering, we can now be confident that the off-field processes across the FA Women’s Super League are nearly as good as the product on the pitch!
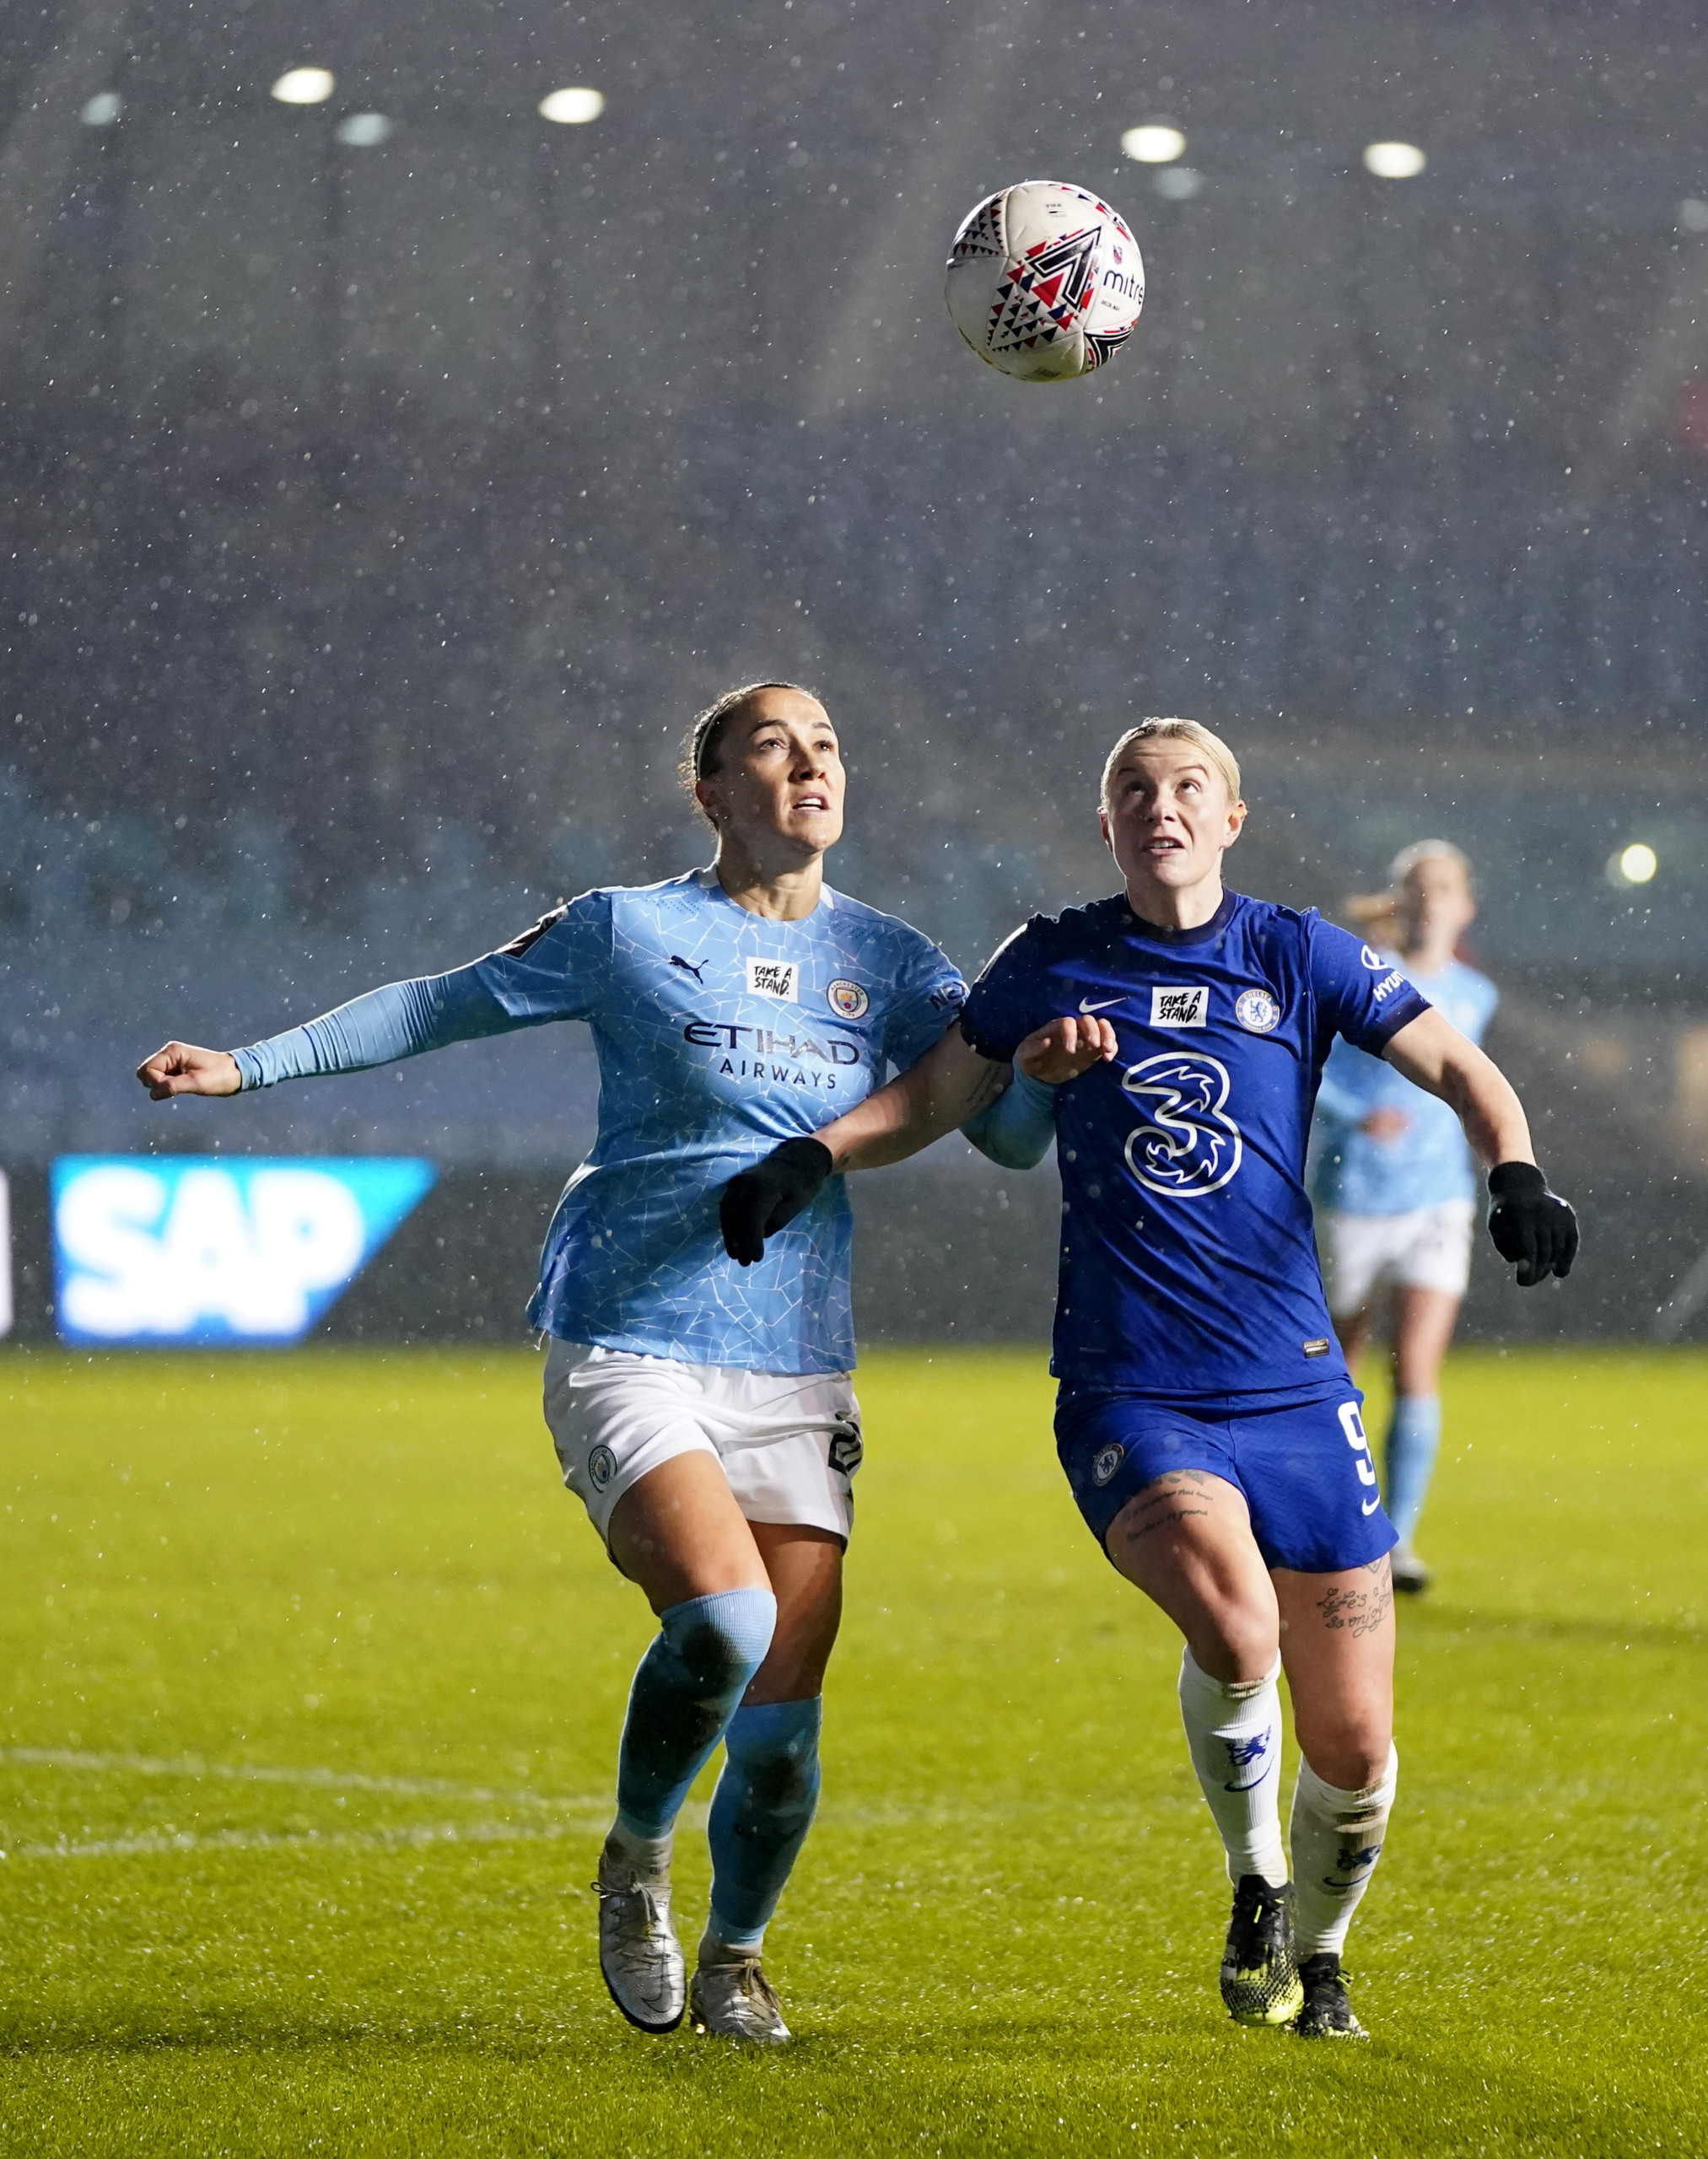
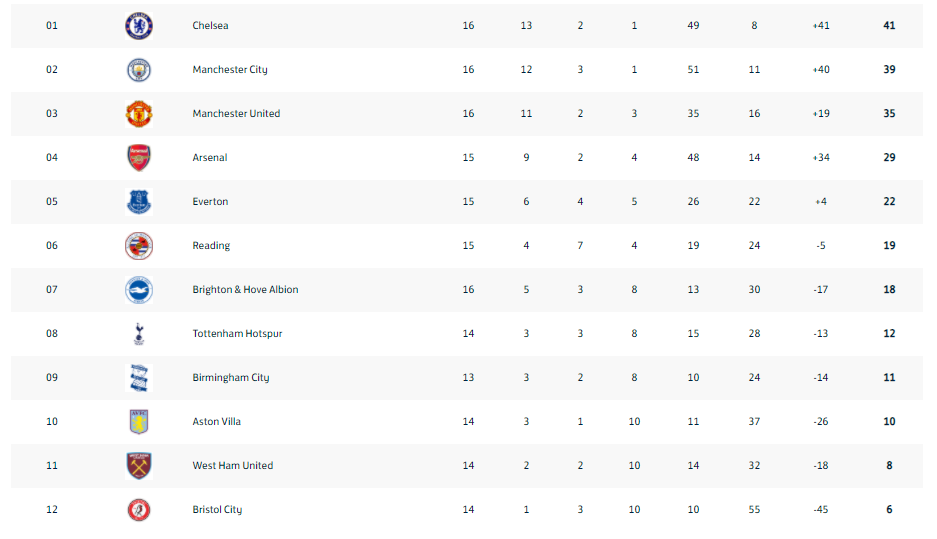
For the second season in a row, there’s a nail-biter of a title race as we enter the home straight of the season, with Chelsea just edging out Manchester City at the time of writing.
Table courtesy of https://womenscompetitions.thefa.com/
We’re going to focus on the battle at top and what can now be tentatively suggested to be the league’s 'Big Four', having seen the same teams occupying the top four positions last season too.
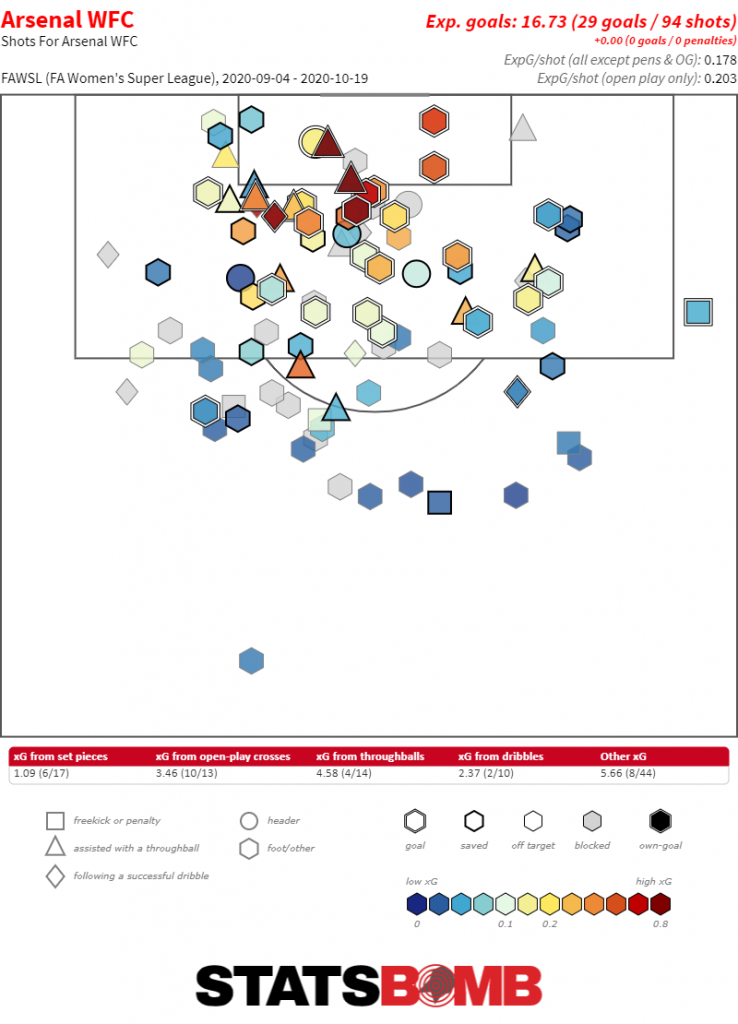
Arsenal find themselves adrift now, but were very much in the conversation back in October after winning all five of their opening fixtures at an aggregate scoreline of 29-4. Vivianne Miedema, league top scorer in 2018-19 and 2019-20, scored 10 goals in those opening five to go a long way towards securing the accolade for the third season running, ably supported by Netherlands compatriot Jill Roord who netted back-to-back hat-tricks from central midfield in Arsenal’s opening two fixtures.
The Gunners scored at nearly double their expected goals, but racking up 16.7 xG in five games – a rate of 3.34 per game – put a warning out to the rest of the league.
As always in the WSL though, it’s results against your rivals that make the difference between a title challenge or not and Arsenal dropped points to all of Chelsea, Manchester City and Manchester United in three of the four fixtures immediately following that start, losing to the two Manchester clubs and hosting a London derby stalemate with Chelsea. Further defeats to City and Chelsea in the return fixtures have cut them adrift.
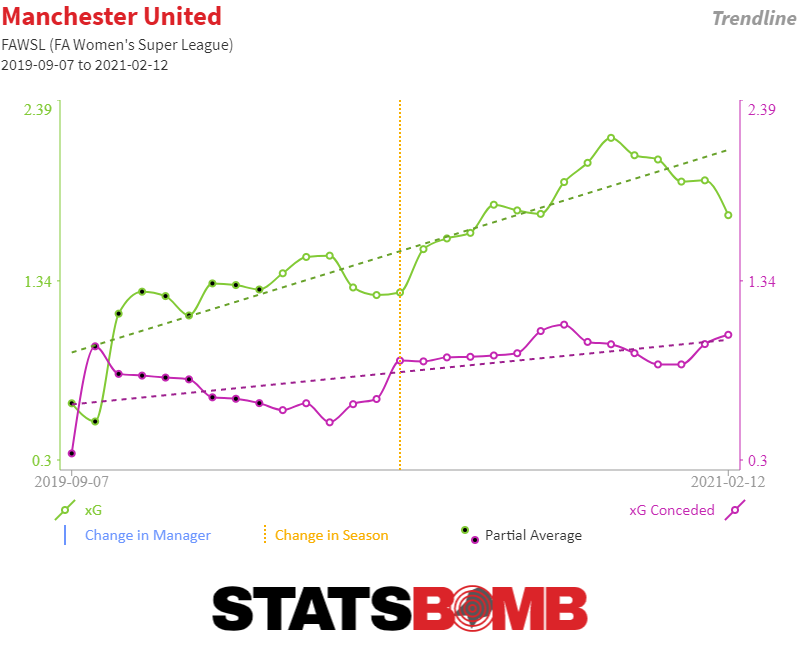
After a fourth-placed finish in their inaugural top flight season in 2019-20, there's been a discernible progression in Manchester United.
Casey Stoney’s side were closer to mid-table than they were the title race last time out, but an uptick in their attacking output has seen the team emerge as stronger contenders in 2020-21.
There’s an element of chaos around United games this season with the side leading the league for both High Press Shots, shots generated within five seconds of a turnover in the opposition half, and Counter Attacking Shots, shots generated within 15 seconds following a turnover in the team’s own half.
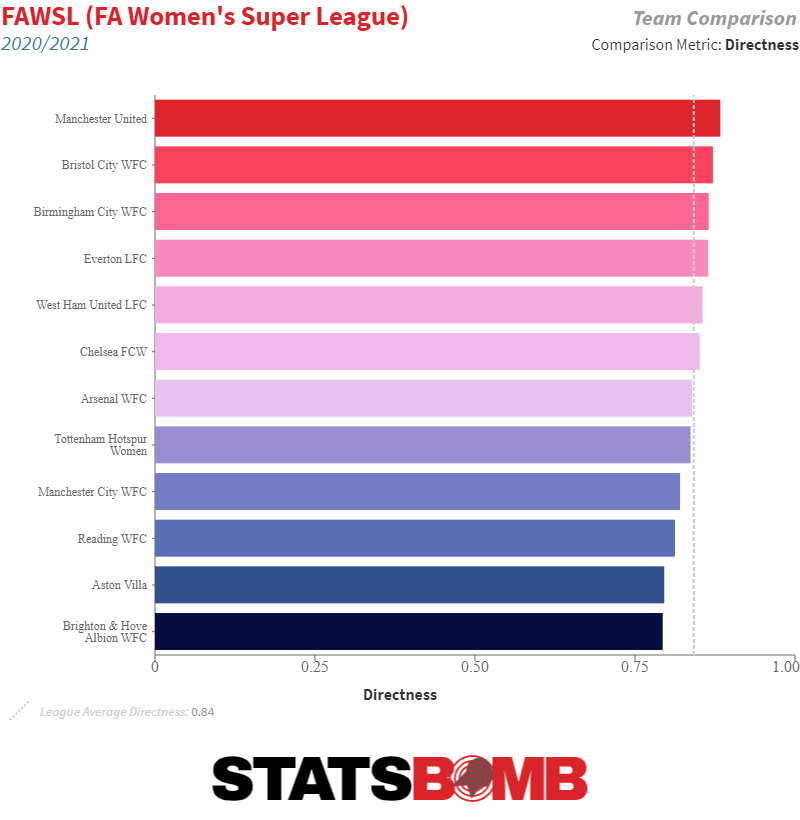
United also come out on top in StatsBomb’s Directness metric, a ratio of the distance to goal from the start of a possession that ended in a shot, divided by the total distance travelled in the build-up to that shot. In layman’s terms, United look to play forward and towards goal when on the ball.
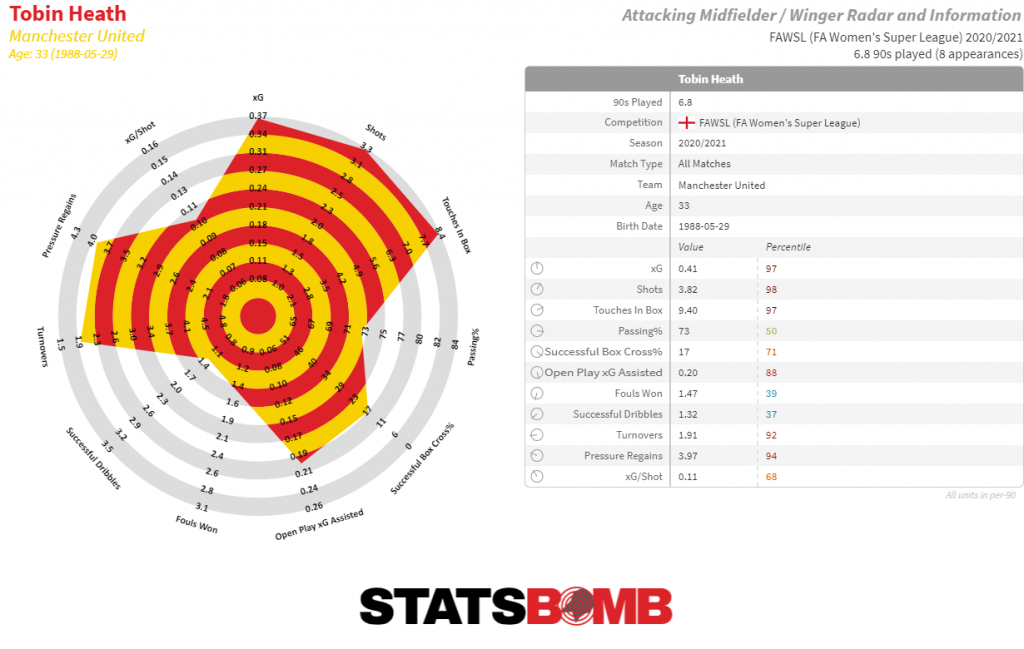
Two-time World Cup winner Tobin Heath’s form had been living up to the marquee-status greeted by the signing, providing a direct goal threat and creativity from the wing during United's 10-2-0 start to the season that had them firmly in the title race.
Heath’s January injury coincided with back-to-back defeats in the first two rounds of February, which, along with a defeat to Chelsea a few weeks prior, has seen the Red Devils lose touch with the top two with six games to play.
After missing out on the title by points-per-game last season, Manchester City’s summer recruitment drive was hailed as one of the best in the division, seeing Rose Lavelle, Sam Mewis, Alex Greenwood, Chloe Kelly and Lucy Bronze join the club.
Bronze returned to England following a trophy-laden spell with Lyon in France including three consecutive Division 1 Féminine and Champions League doubles, as well as a host of personal honours, including winning ‘The Best FIFA Women's Player’ in 2020 (Bronze wins Gold, etc, etc...)
Ex-manager Nick Cushing ended his seven-year association with the club for a role with New York City FC in MLS, so management-rookie Gareth Taylor was promoted from a role in the Manchester City academy to take on the mantle.
It's so far, so good for Taylor who, results-wise, has picked up where Cushing left off. A rocky start saw them go 3-3-1 in their opening seven fixtures, but Taylor has swiftly steadied the ship and that run has been followed up by a steamrolling nine game winning run. City now look set to go at least as close to regaining the title from Chelsea as they did in the last campaign, with City currently two points off top spot.
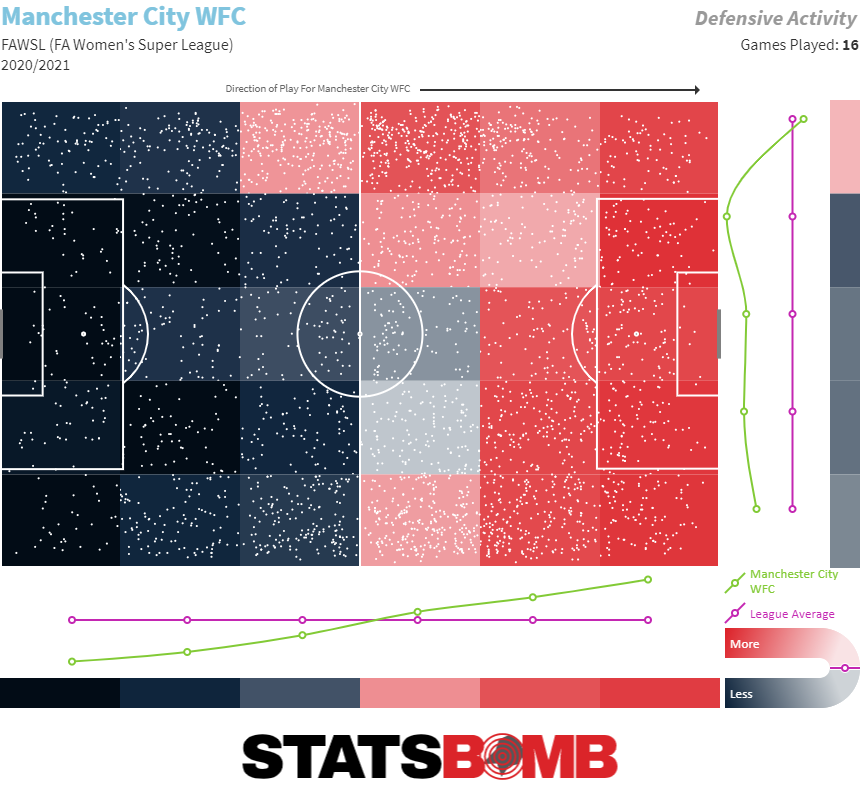
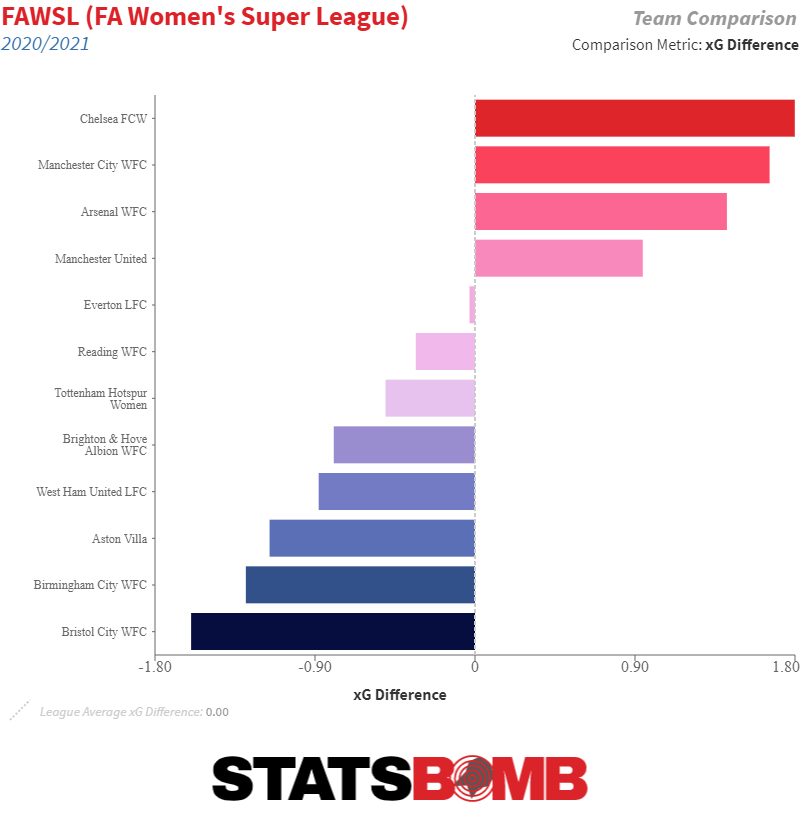
Taylor’s tinkered with the setup to great effect, with the surface-level metrics looking even stronger than last year. xG per game has shifted up from 1.94 to 2.22, their xG conceded has dropped from 0.83 to 0.56 – and the changes in process that has led to those upgrades is evident.
For starters, City are now pressing higher up the pitch. Their PPDA – Opposition Passes Per Defensive Action – has dropped from 10.30 to 6.30, and their Defensive Distance – the average distance from a team’s own goal from which it makes defensive actions – has increased by nearly five(!) metres, up from 48.9m in 2019-20 to a league-high 53.6m in 2020-21. For context, Chelsea have the next highest in 2020-21 at 49.9m.
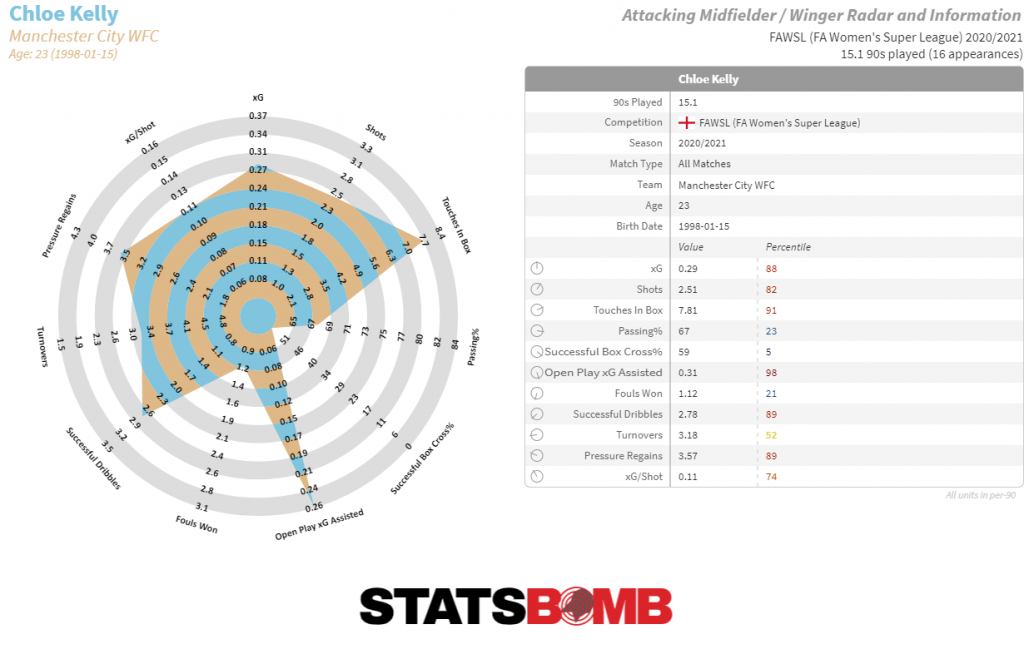
City are looking to keep the play in the opposition territory as often as possible and ideally in possession of the ball themselves – possession has risen from 55% to 65% - in order to utilise the creative talents of Georgia Stanway, Lauren Hemp, and Chloe Kelly.
Kelly has transferred her Everton form into City colours after her summer move, completing the most dribbles in the division so far (2nd only to Chloe Arthur or Aston Villa on a per 90 basis) and creating the third-most xG assisted in the league from the right-flank.
Looking to retain their title and in pole position to do so are leaders Chelsea.
Despite the improvement in Manchester City’s metrics, it’s still the Blues who look the strongest side in the WSL this season, with virtually nothing between this season and last in either their 'xG For' numbers in attack or 'xG Conceded' numbers in defence.
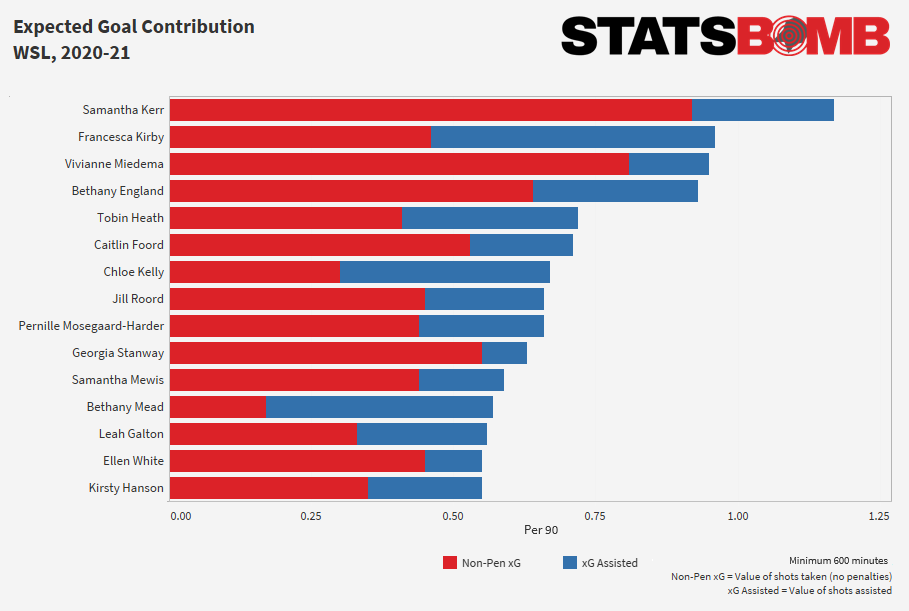
2019-20 WSL Player Of The Season and Player’s Player of the Season Beth England signed a new four-year deal in the summer and has picked up where she left off, supported by the returning Fran Kirby, world record signing Pernille Harder, and speedster Sam Kerr. The form of all four has powered Chelsea to the top of the table with each of them registering at least 10 goals and assists combined by the three-quarter stage of the season.
You get a clearer sense of how devastating the Chelsea frontline have been when you consider than three of the top four players in the league for expected goals and expected goals assisted come from the London club.
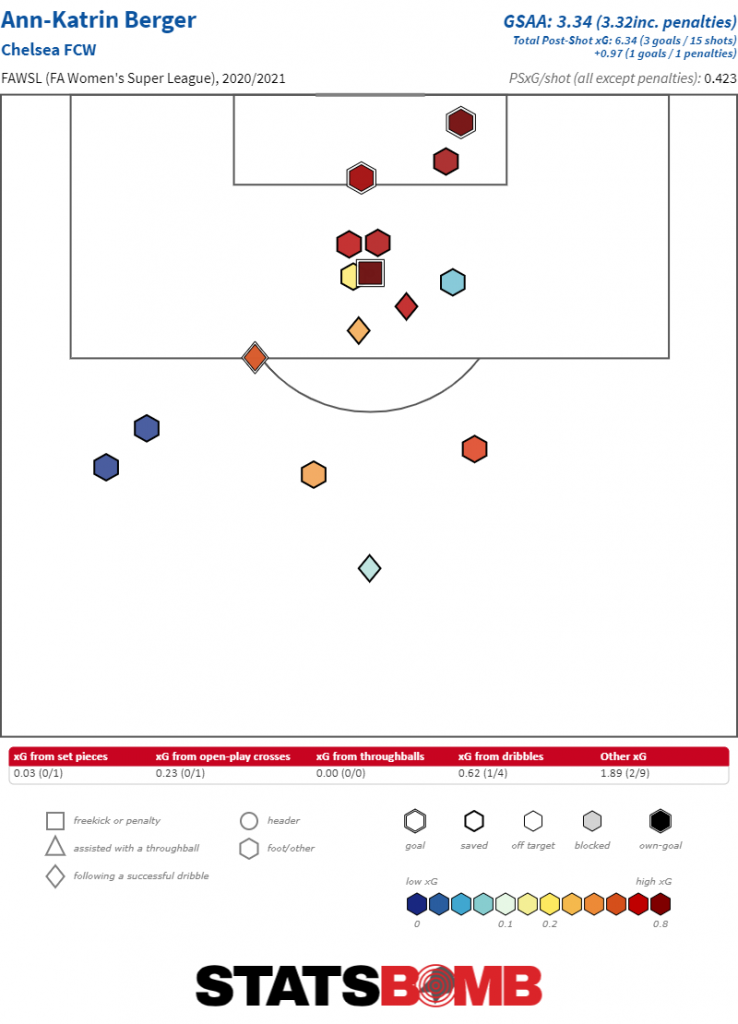
It’s not just the attackers that deserve credit, though. Defensively the Blues have been imperious too., conceding just 8 goals in 16 games, a total that just about tallies with their xG conceded of 8.8.
The form of the defensive unit as a whole has been high but on the rare occasion they do get breached, goalkeeper Ann-Katrin Berger has been there to bail them out. Berger has faced just 15 shots on target in her 12 appearances this season, shots that have a post-shot xG value of 6.3, taking into account the shot location and shot placement. So on average we'd expect Berger to have conceded between 6-7 goals from the shots she's faced - she's conceded just three (plus one penalty and one own-goal).
Assuming neither side slips up elsewhere, all eyes are on the top of the table clash between Manchester City and Chelsea on April 25th, which at this stage looks to be the title decider. You don't want to miss it.
Join us at StatsBomb Evolve on March 17th 2021 to discover how we're going to change the football industry, including the launch of our new data product, StatsBomb 360. To find out more, click here.
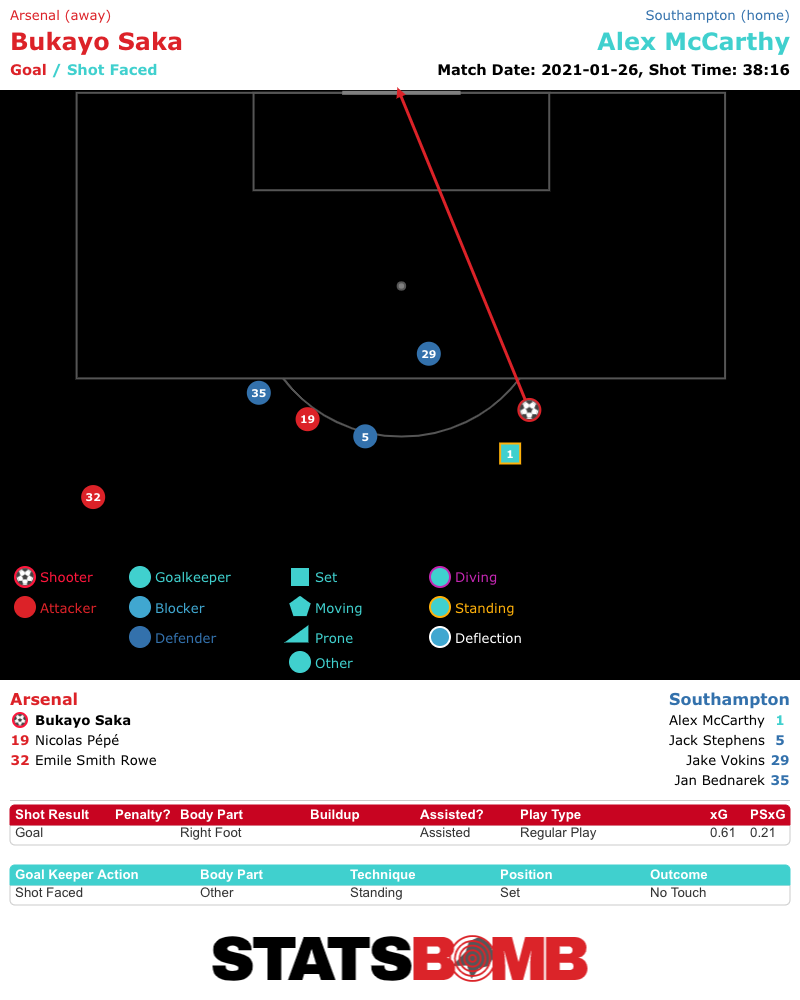
It was in May 2018 that StatsBomb began to offer precise defender and goalkeeper locations for all shots in the form of our ‘Freeze Frames’ – a snapshot taken at the moment of the shot that captures the location of all players involved in the event. This enables us and our customers to more accurately evaluate the context around each shot and measure the impacts of things we know to have an impact on the outcome of those chances, such as defensive pressure, answering one of the biggest questions posed in the football data industry in the process.
On March 17th 2021, we will bring you the latest innovations to come out of StatsBomb at our free online event StatsBomb Evolve, including upgrades to our current dataset and the launch of our revolutionary new data product StatsBomb 360. In the build up, we’re looking at some of the unique data points that already make StatsBomb Data the clear best in the industry, and the obvious choice for smart clubs and analysts.
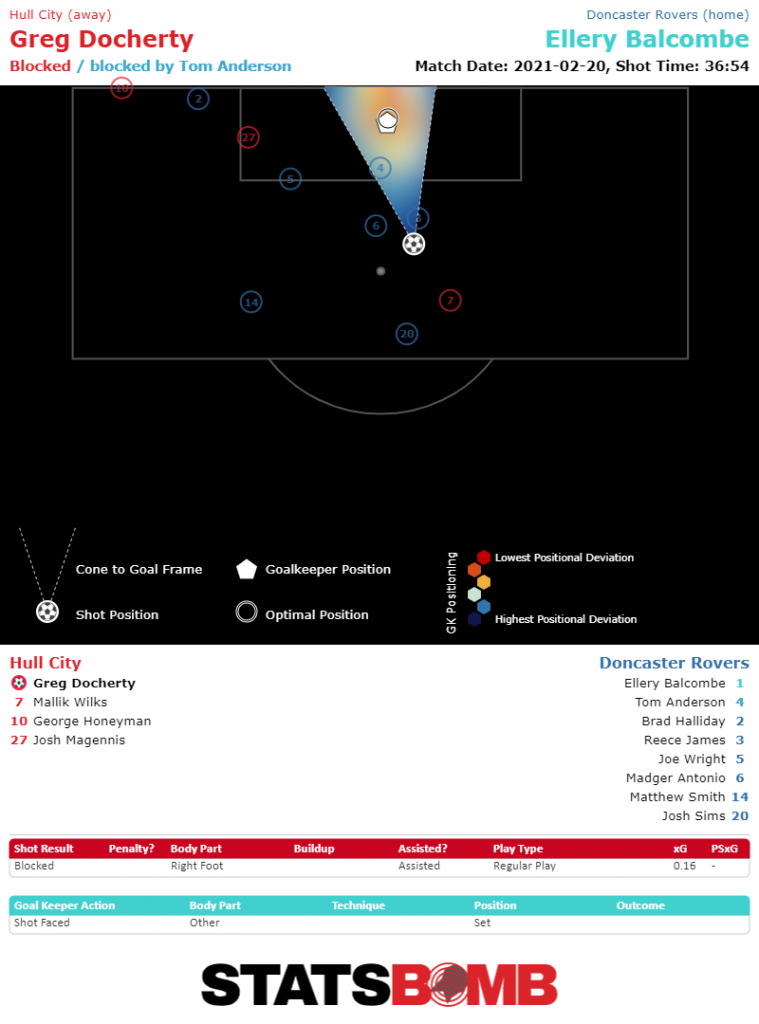
Every shot recorded in the StatsBomb Database has a Freeze Frame attached to it, revealing the location of all players, attacking or defending, within the camera frame, as well as the goalkeeper’s position. Knowing where the goalkeeper is located has huge implications for the accuracy of our expected goals model.
As does the location of defenders. Shots from central areas in the penalty area are typically easier to score, unless the defending team has covering defenders in position to make a block, for example, thus dramatically reducing the likelihood of the shot hitting the target let alone resulting in a goal.
Of course, no model is perfect, but we believe that Freeze Frames, along with the addition of Shot Impact Height, means we have significantly more information around shots than that of other data providers, giving us a closer representation of reality and greatly enhancing the precision of our models. Besides being good for data integrity, Freeze Frames also give us the ability to derive a ton of other metrics around shooting. We’re going to look at a few of those today. For example, having more attacking players in the box is regarded as a worthwhile strategy when trying to score goals. So it'd be really cool to know how many players a team pushes into the box when they're shooting on goal, wouldn't it? Let's evaluate how this season's Premier League and EFL teams perform in this aspect.
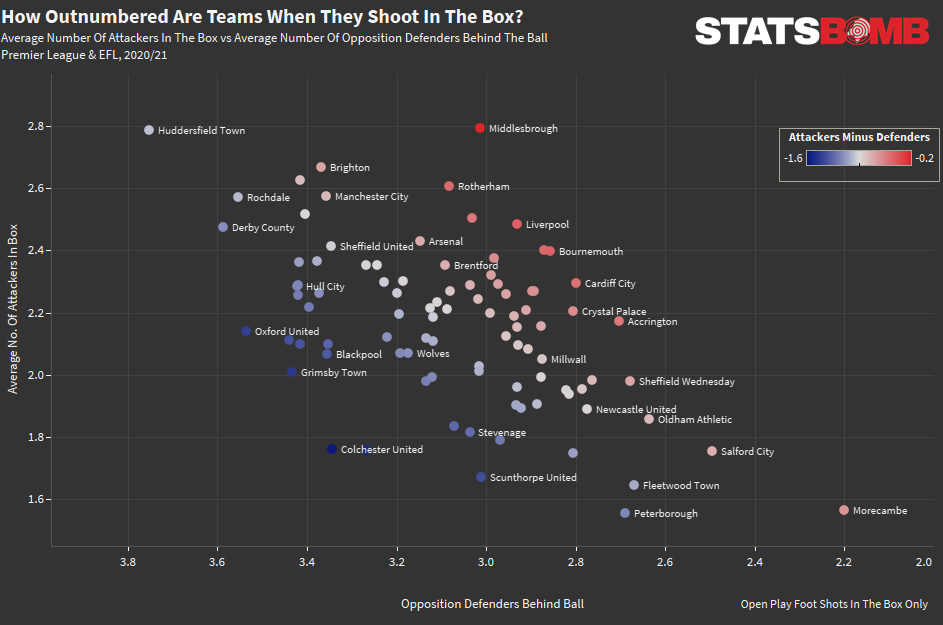
Predictably, Manchester City and Liverpool generate the most shots in the box from Open Play and tend to have a large number of attackers in the box when shooting. We regularly see both of these teams build pressure on the opponents and urged forward by their attack-minded coaches, so it's no surprise to see them towards the top end in both of these metrics.
Though generating nearly half as many shots in the box as the Premier League pair, both Middlesbrough and Huddersfield average a higher number of attacking players in the box, committing bodies to the attack when in opposition territory. However, the trade-off between committing a large number of attackers is that there is often the same amount of defenders covering, usually more. It’s valuable to get bodies forward, but there’s also value in creating opportunities where you outnumber your opposition regardless of whether it's two or six players you have in the attack.
*(Defenders Behind Ball calculated as Defenders with an x-coordinate closer to goal than the shot location. It does not necessarily mean they were in a position to block the shot)
So, despite both committing a high number of bodies forward, Manchester City tend to face more defenders in the box when shooting than Liverpool. This is likely down to City preferring to focus on positional play in the attacking phase whereas Liverpool tend to favour quick transitions. Indeed, Liverpool have registered more counterattacking shots this season than their rivals, so this seems a likely explanation. Neil Warnock's Middlesbrough are a standout here.
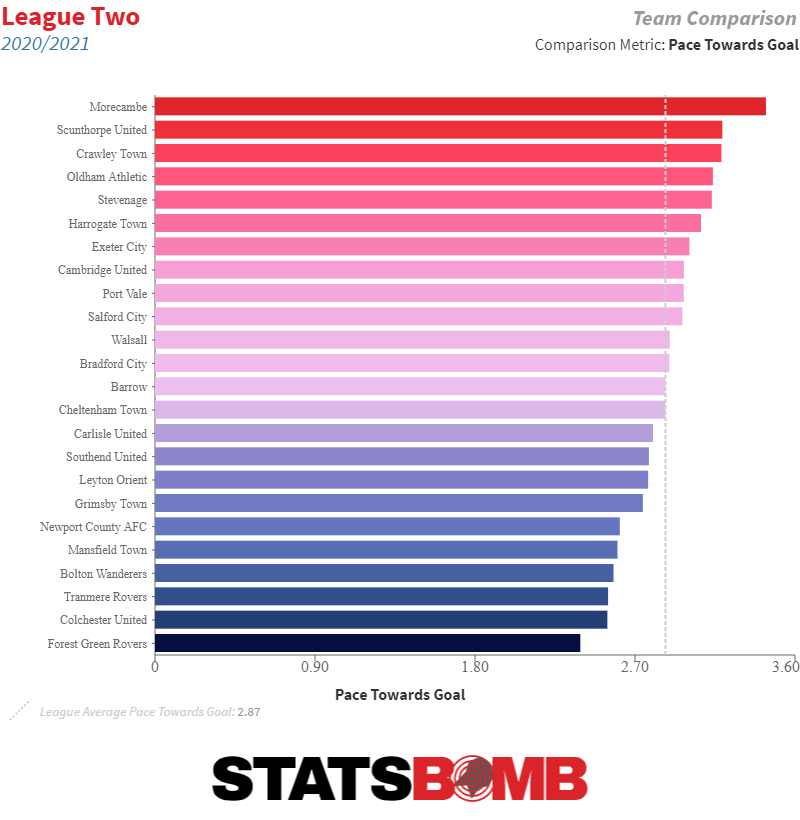
Whereas Huddersfield match them for the number of attacking bodies they have forward when shooting in the box, the Teessiders are shooting against defences that are less tightly packed. Boro's box shots have an average of 3 defenders deeper than the shot location, whereas Huddersfield's have 3.75. League Two Morecambe are another major outlier in that they have the lowest average number of attacking players forward when shooting in the box, but also the fewest opposition defenders.
Indeed, there's an average of only 3.8 attackers in the box plus defenders behind the ball for Morecambe's box shots, contrasted with Huddersfield's 6.5, not far off twice as many bodies. The big clue as to how Morecambe are doing this lies in their Pace To Goal - the average speed (in m/s) of build-up for possessions that end in shots. Morecambe's Pace To Goal is the fastest in League Two, implying that they play forwards and transition quickly, finding space in the opponents half before their opposition are able to recover their positions.
Contrast that with Colchester United, who rank 23rd in the Pace To Goal metric. The League Two strugglers seemingly combine a slow attack with a conservative approach to committing bodies forward. Their 1.7 Attackers In The Box vs 3.3 Defenders In The Box mean the opposition have nearly twice as many bodies defending when Colchester try to create chances in the penalty area. On the defensive end, we can look at teams who get bodies behind the ball to stifle the opposition, by applying pressure on the shot taker or by defending space.
Teams that defend higher up the pitch and apply pressure to the opposition backline have to work hard to recover their positions, whereas teams that look to stand off and regain their defensive shape tend to have more defenders in a position to defend the box once the opposition advance into their territory.
Liverpool and Manchester City are again worth looking further into here. Both apply a lot of pressure on the opposition backline and look to keep the game in the opposition territory as much as possible, but looking at this it would appear that this season Manchester City have been able to recover their positions more quickly, averaging a higher number of defenders behind the ball when their opponents shoot in the box.
That’s not to say Liverpool’s press isn’t effective though as they, like Barnsley in the Championship, press aggressively high up the pitch in order to suppress the number of opportunities the opposition are able to create in the first place. Barnsley have the fewest defenders behind the ball on average when conceding shots in the box, but the efficacy of their press means they only concede 2.8 footed shots in the box per game.
League One Doncaster average the highest number of defenders behind the ball when the opposition shoot, with nearly an entire back four's worth (3.9) of defenders, plus the goalkeeper, positioned behind the ball when the shot is taken.
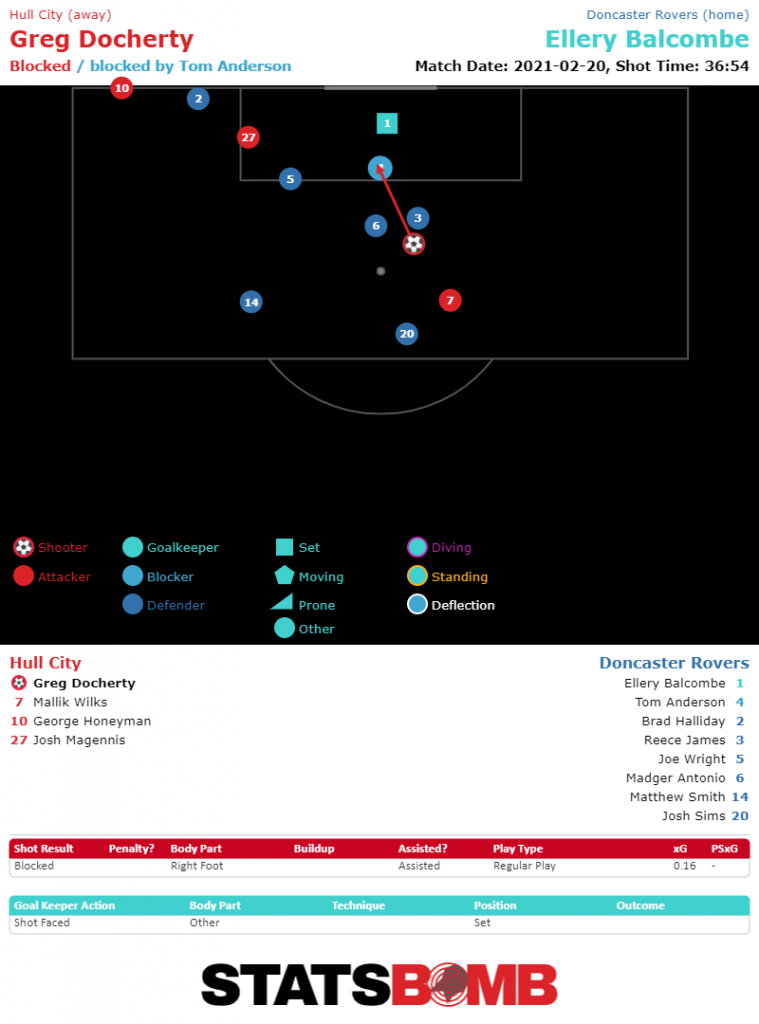
It's also no surprise to see Championship promotion chasers Swansea show up well in this metric, having conceded the fewest goals in the second tier so far, succeeding in both getting bodies behind the ball and in suppressing the shooting opportunities of their opponents in the box. StatsBomb’s Freeze Frames also feature the ‘Keeper Cone’ – a cone drawn between the shot taker and the goalposts to highlight the amount of goal the shot-taker is able to see. This allows us to evaluate the goalkeeper’s position but also whether there are any covering defenders in position to block the shot.
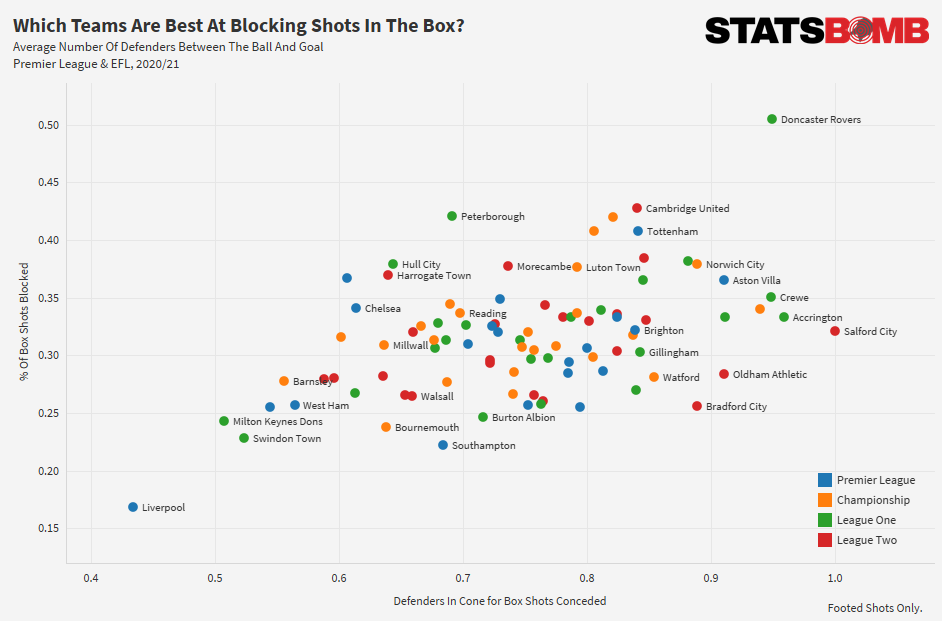
Defences that are able to get bodies between the ball and goal will naturally stand a better chance at blocking the shot and preventing it from even testing the goalkeeper, so let’s look at how regularly teams are able to get defenders into the Keeper Cone, and how effective they are at blocking shots in the penalty box.
As we've seen, Doncaster tend to have plenty of covering defenders and are regularly able to get one of them between the ball and goal to reduce the likelihood of the opposition scoring. As a consequence they're blocking half of all their opposition’s box shots with feet, at least up to this stage of the season. In general terms, close-range shots with feet are regarded as the most dangerous chances a team can create.
By making sure only 1-in-2 of them test the goalkeeper, Doncaster are doing all they can to make it difficult for their opponents to score, evidenced by having the second-best xG per Shot Conceded in League One. There’s plenty more analysis that can be done with Freeze Frame data, but hopefully this has provided a snapshot of what’s possible when you collect more contextual information around shots, and a glimpse at the insight that can be gleaned into a team’s attacking or defensive game.
Join us at StatsBomb Evolve on March 17th 2021 to discover how we're going to change the football industry, including the launch of our new data product, StatsBomb 360. To find out more, click here.


 "StatsBomb 360 is contextual event data. What that means is that we are now collecting a freeze-frame showing all players on camera for every event we collect - approximately 3300 events per match. 360 is also going to allow us to uncover a host of new information about the game that was either difficult to see or completely hidden in basic event data. We will now be able to deliver things like:
 There'll be talk of StatsBomb LIVE ahead of it's release in mid-2021, updates on the latest innovations coming out of our Data Science team (including information about our On-Ball Value (OBV) model enhancements), plus insight from our Collection and Quality Assurance teams to hear more about how we keep our data at the top of the industry. StatsBomb Evolve will be taking place online and is free to everyone to attend. All you have to do is
 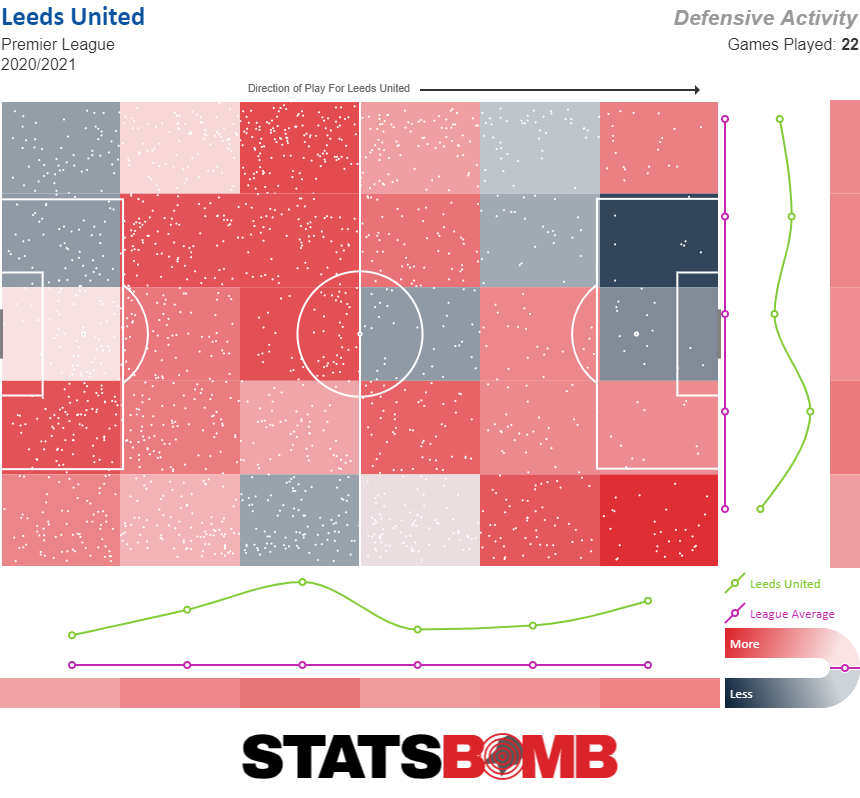 As you can see, it would suggest that Leeds are fairly active off the ball, but not significantly more than other teams in the league, particularly in the opposition half where they appear to be a shade above average. Including pressures tells a different story.
 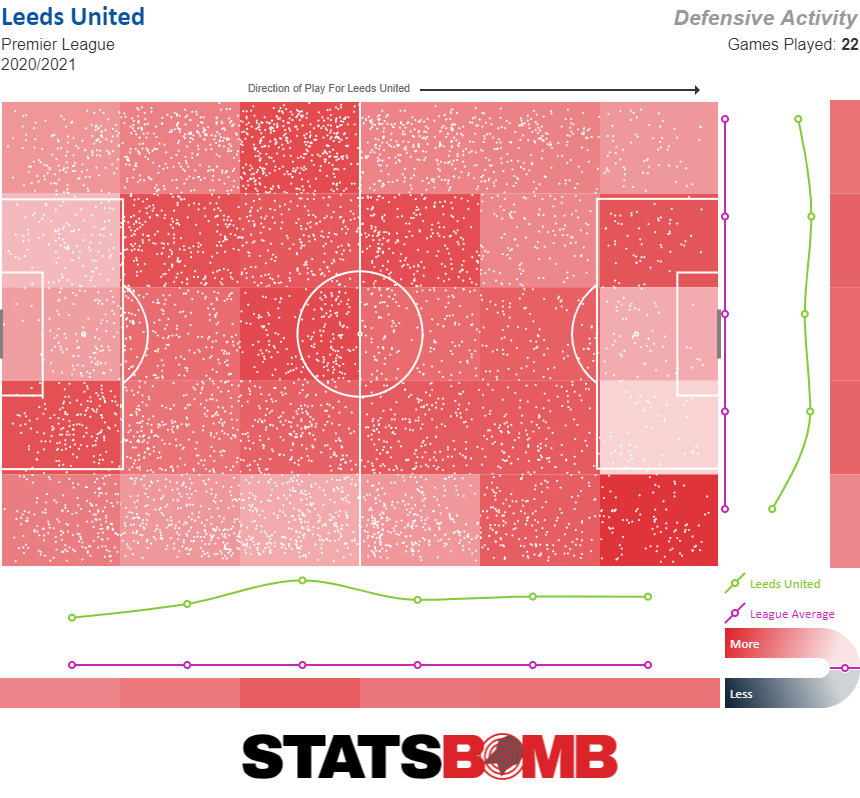 Now we can see an accurate reflection of just how active Bielsa’s side are out of possession. To read the full Pressures piece, click
 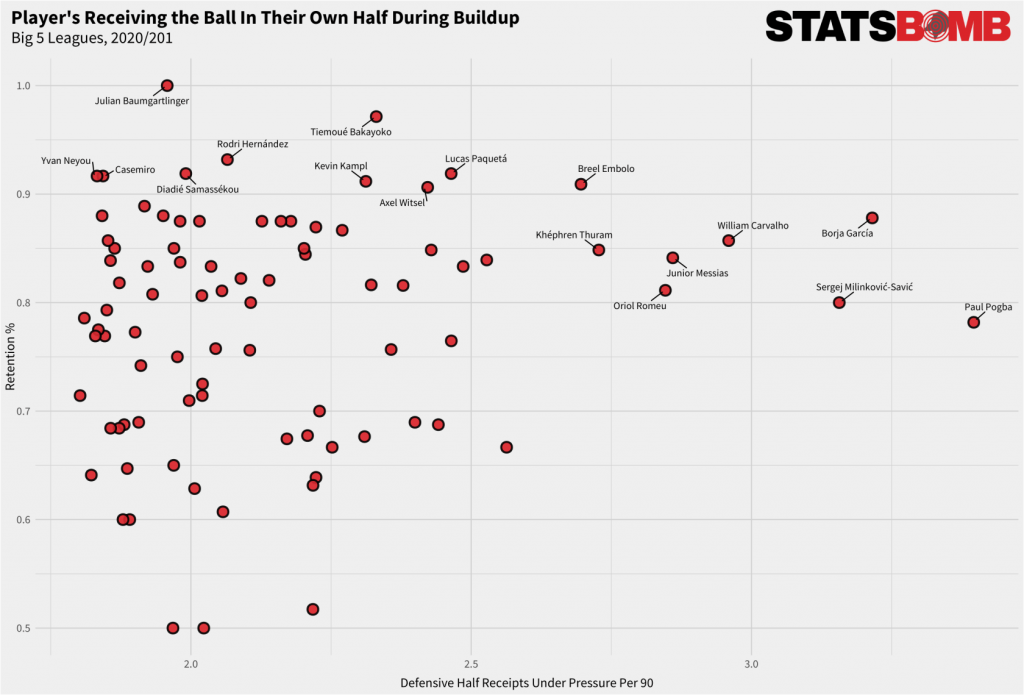 Julian Baumgartlinger takes the crown this season, having kept the ball 100% of the time when receiving under pressure in his own half, though he has only registered 1.9 under pressure receipts in the defensive half per 90. Contrast that with Paul Pogba who receives the ball under pressure nearly twice as often at 3.4, but has retained the ball only 78% of the time. Despite a mixed few seasons since his 2017 move to Chelsea, Tiémoué Bakayoko’s control under pressure sees him second only to Baumgartlinger with a retention rate of 97%, and this coming from more pressured receipts than Baumgartlinger too. This is a consistent strength of Bakayoko's having been similarly reliable when receiving under pressure last season as well. Whilst at AS Monaco in 2019-20, Bakayoko had the best retention rate in Ligue 1, keeping the ball 97% of the time from 2.7 under pressure pass receipts per 90. To read the full Actions Under Pressure piece, click
 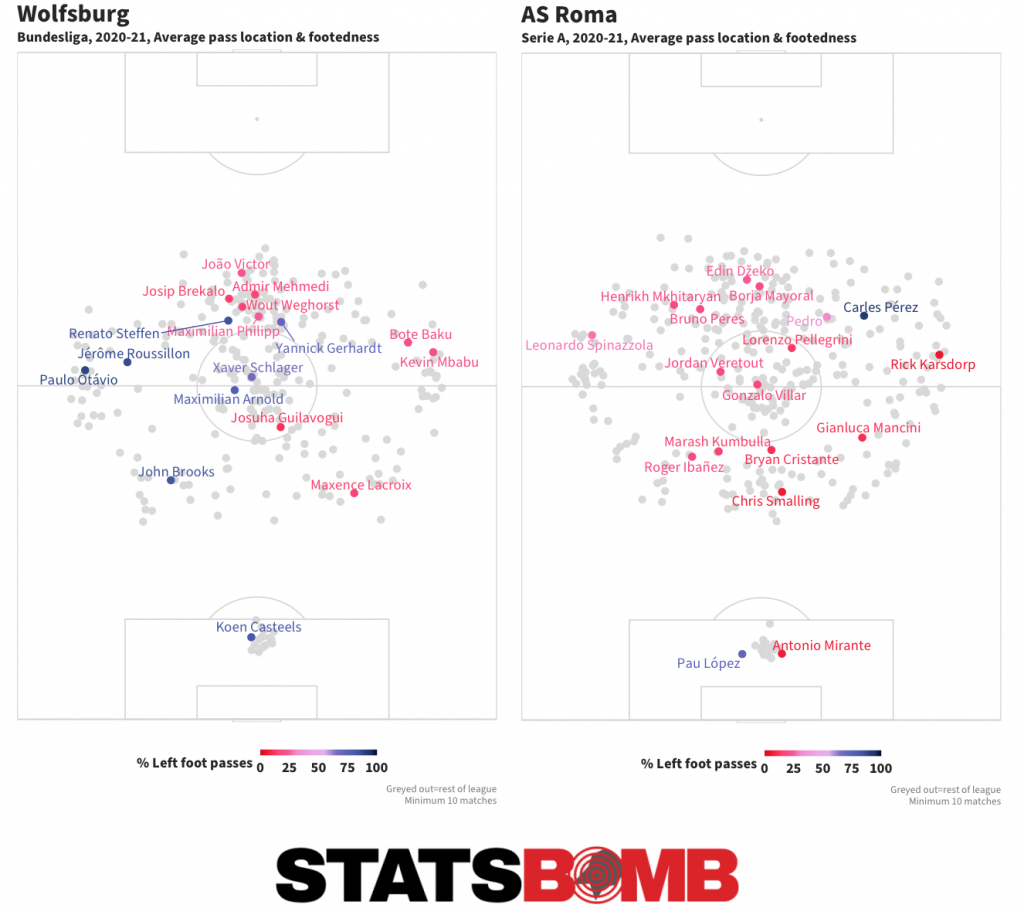 It’s stark that even Roma left wingback Leonardo Spinazzola is predominantly right-footed, whereas Wolfsburg have a perfect balance between left and right footers, allowing wide players Renato Steffen and Josip Brekalo to swap wings with regularity, or rotate for Bote Baku on the right wing if the team needs a little more width. To read the full Pass Height And Pass Footedness piece, click
 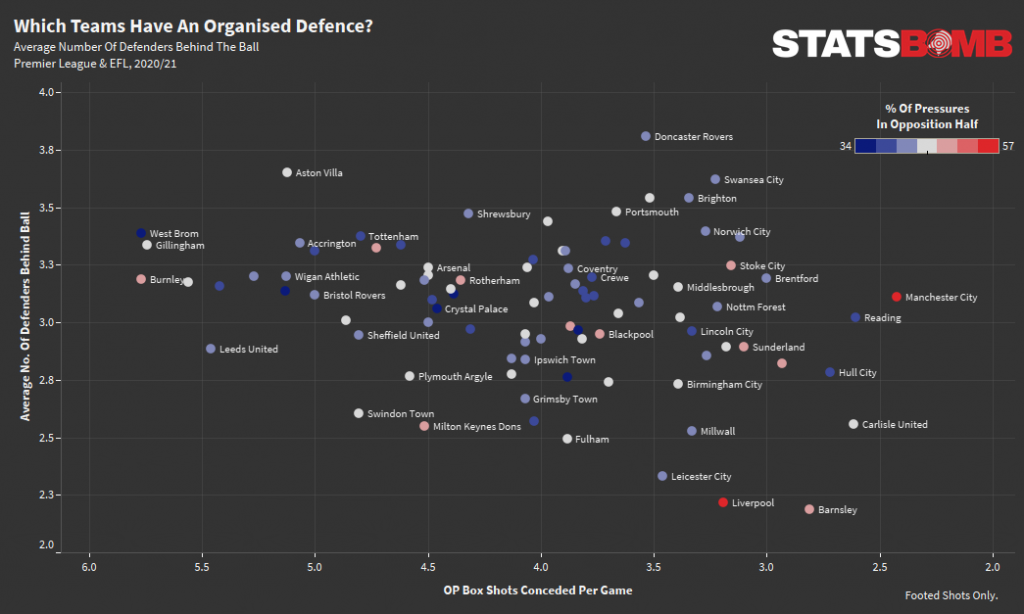 Liverpool and Manchester City are again worth looking further into here. Both apply a lot of pressure on the opposition backline and look to keep the game in the opposition territory as much as possible, but looking at this it would appear that this season Manchester City have been able to recover their positions more effectively, averaging a higher number of defenders behind the ball when their opponents shoot in the box. That’s not to say Liverpool’s press isn’t effective though as they, like Barnsley in the Championship, press aggressively high up the pitch in order to suppress the number of opportunities the opposition are able to create in the first place. Barnsley have the fewest defenders behind the ball on average when conceding shots in the box, but the efficacy of their press means they only concede 2.8 footed shots in the box per game. To read the full Freeze Frames And Defender Locations piece, click