
[soundcloud url="https://api.soundcloud.com/tracks/309952778" params="auto_play=false&hide_related=false&show_comments=true&show_user=true&show_reposts=false&visual=true" width="100%" height="450" iframe="true" /] Ted Knutson and James Yorke talk about the top four race, relegation and the Champions League Downloadable on the soundcloud link and also available on iTunes, subscribe HERE Thanks!
Month: February 2017
Feb Mailbag - Arsenal's Next Manager, Bertrand Traore, Perry Kitchen and More.
Mailbag time. This is when readers ask me burning questions and I attempt to answer them without being too sarcastic, mean, or using the word [REDACTED] everywhere. We'll see if I succeed this month.  The short answer is to write and apply the shit out of the stuff you are working on. 98% of the people that will read your work DO NOT CARE ABOUT YOUR METHODOLOGY. This is not grad school, so don't spend your audience's entire attention span explaining all the little things you did as part of your study. Slap them in the face with your results. Explain why these results are interesting/relevant/just plain wrong, and then way down at the bottom in the Appendix, that is where you include all the gritty details for the methodology wonks. On the other hand, feel free to completely discount my advice in this area. I have only had the one permanent job with clubs, and the rest of my paid work has been consulting, so I'm not exactly an expert in the How Do I Get Employed By Football Clubs genre.
  I thought Conte would be a really interesting change of pace/palate cleanser, but obviously he ended up across London. I think the most obvious candidate out there is Tuchel. He's switched on toward analytics and knows that he doesn't know it all, which means StatDNA's work should get incorporated reasonably well. Tuchel also brings a combination of attacking style that isn't a total break from Wenger's legacy plus he brings a pressing expertise that Arsenal desperately need at this point. The question is how much do they have to re-tool the squad to play his style? Slightly further off the beaten path is Julian Nagelsmann at Hoffenheim. I think he would need a couple more years of seasoning for Arsenal to make that leap though. Luciano Spalletti has done a great job at Roma since coming back to Italy and would be another interesting candidate with a fun, high tempo attacking style. Then on the other end of the spectrum you end up with guys like Jorge Sampaoli and Roger Schmidt. VERY different managers stylistically who are bright and have had past success, and might potentially be available under the right circumstances. I think Arsenal will be fine in the post-Wenger years. They actually have a lot of infrastructure set up behind the scenes that already helps Wenger in various areas, and is ready to completely take over when he decides to move on.
 ![]() The same thing everyone else does: figure out how to marry it to my event data. Tracking data is super useful, but if I have to choose either tracking or event, then I'm taking the richer event data set. The marriage between the two in a way that doesn't throw bugs everywhere is a big deal, and important to move the sport forward.
The same thing everyone else does: figure out how to marry it to my event data. Tracking data is super useful, but if I have to choose either tracking or event, then I'm taking the richer event data set. The marriage between the two in a way that doesn't throw bugs everywhere is a big deal, and important to move the sport forward.  I thought they would be better at this point. All is clearly not sunshine and rainbows behind the scenes, and they've definitely missed Jedinak. The fact that Amavi has really struggled post-ACL tear is also a long-term worry because he was so good before then, and is a tough position to replace. On the other hand, and I know this sounds weird, Steve Bruce is an actual expert in getting clubs promoted from the Championship. This season is a write-off, but they probably stand a good chance next year if Bruce gets a chance to make moves in the summer.
  One of the things working at Brentford and Midtjylland gave me was a looooooot of experience looking for centre backs, and I think we did pretty well in that area. One big trick is knowing what you can and cannot use the data for re: the position. Once you do that, you then chuck everyone into a big scouting queue with the traits you are looking for clearly defined, and watch a lot of film. It's not terribly sexy and it takes a lot of work, but it is effective if you have good scouts.
  The only way Kitchen is anything more than a fringe USMNT player is if someone makes a horrible mistake and then keeps making it. I have him as an average MLS midfielder and nothing more.
  Baseball, definitely. The NBA now as well. Beyond that, everyone else has teething issues. It's funny because people look at my work and think that I am a huge stats guy, and I guess that's true, but it would be far more accurate to say that I'm a data champion. This includes a lot of qualitative work like the entire set pieces program, or video technical analysis. I am holistic about this because it's the right way to run a club and a business. Take a look at what Driveline Baseball is doing to integrate technology, biomechanics research, and technical improvement in baseball and you get a glimpse of how I see the future of football training. The vastness of what we don't know about technical training, coach training, medical diagnosis and recovery, set pieces, youth development, WHATEVER in football is incredible. This is what you need an R&D budget for, and you need this to be guided by people who understand the sport and how to guide the application of the research back into the real world. Maybe there are some smart clubs out there already doing this and we just don't know about it. Southampton is leading the way in some areas of youth development for certain. However, the pool of potential knowledge is enormous, and my experiences around football make me doubtful anyone is really pushing the boundaries much across the board. Basically, if I were Director of Football at a Premier League club, the organization would get a lot smarter, faster, and you'd end up with a practical university environment around the club as part of the process. The trick, however, would be lasting long enough for all of that to pay dividends. Would StatsBomb ever accept unpaid summer interns? - Einar Tricky because there are strong social reasons that make me really dislike the concept of unpaid internships in general. If StatsBomb Services succeeds, then we will likely start an internship program, potentially as early as the end of this summer. However, my condition there is that people would still need to be paid for their time. My other condition would be that someone else would need to run the internship program, because I am unlikely to be around enough to be useful.
  The answer the world seems to agree on is Kante plus anyone is good enough. Add Cesc when you need to unlock a defense, while Matic is pretty much an all-purpose midfield battleship. I think Baker is decent, but not anywhere near the level required to break into the Chelsea squad right now. He's probably ready for a loan in a tougher defensive league than the Eredivisie next year, but I'm not sure he's even good enough for lower PL right now. (And to be fair, he's still very young.)
  The Red Rising series by Pierce Brown. Brian Staveley's finale The Last Mortal Bond was pretty good. The Undoing Project by Michael Lewis. Ben Aaronovitch's Rivers of London is good pulp. I also thought Richard Morgan's fantasy that starts with The Steel Remains was weird and pretty enjoyable. And the long way to a small angry planet by Becky Chambers was really quite lovely.
  Sir Bertrand of Traore, lately also of Ajax.
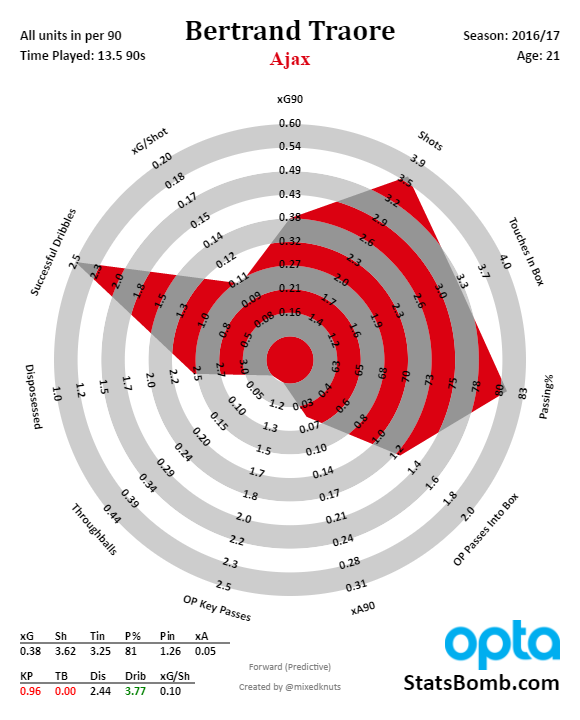
 TamTam Abraham, currently on loan at Bristol City.
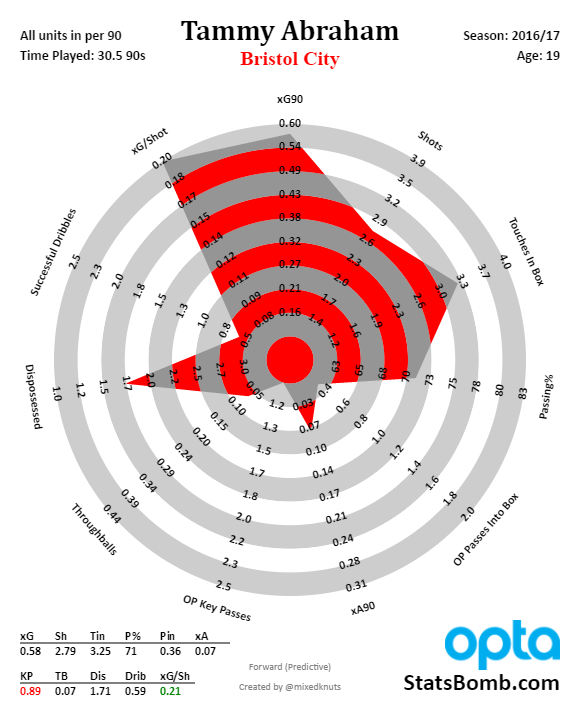
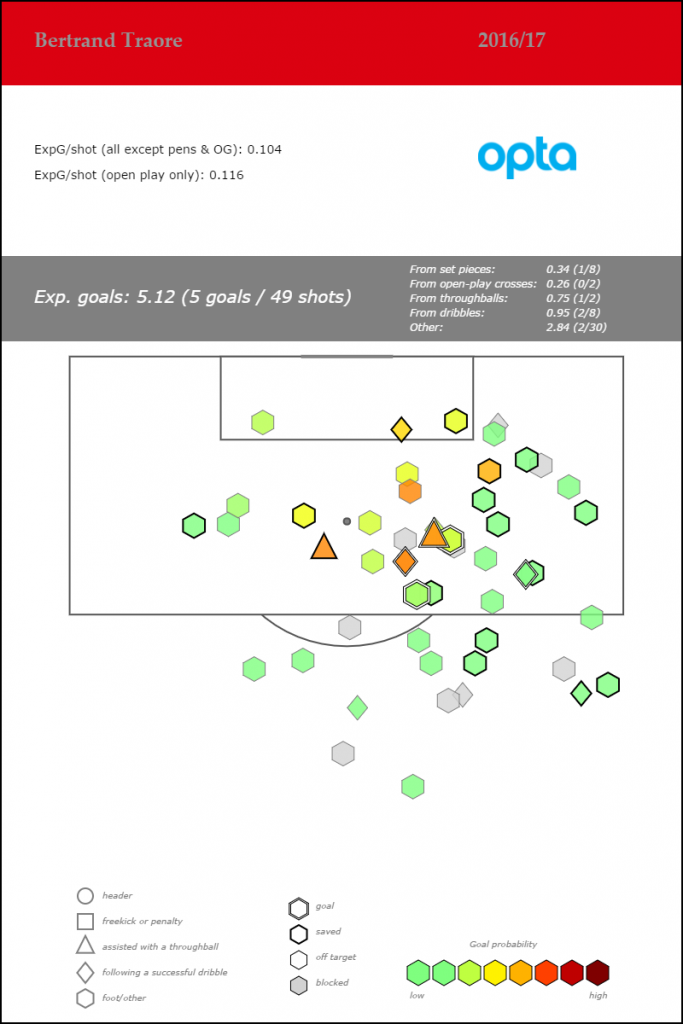
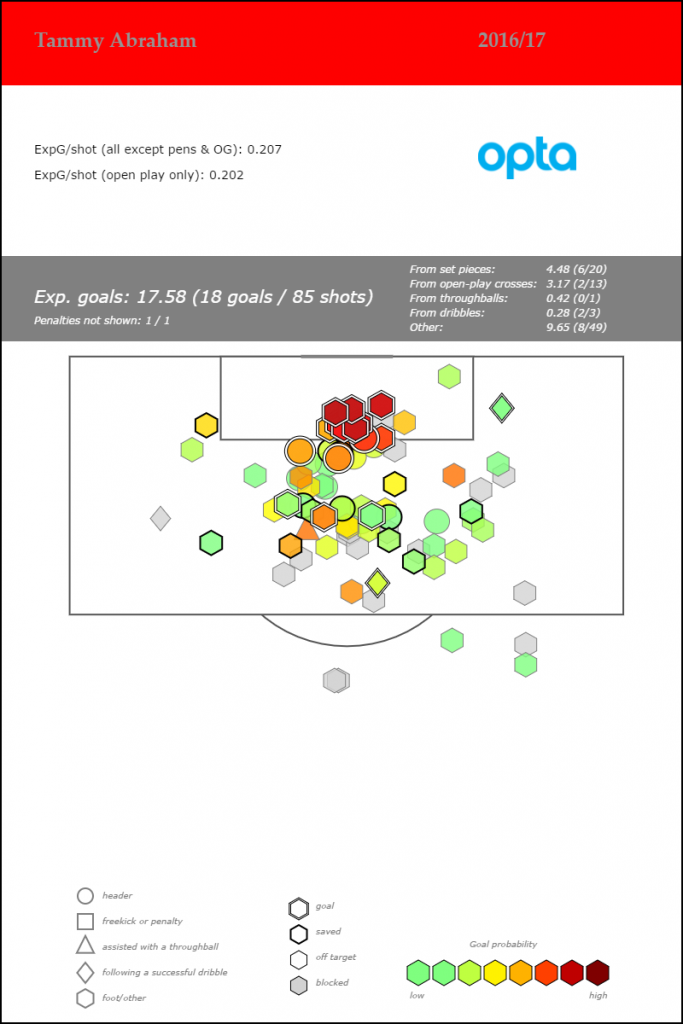 I like them both, and I'm pretty sure I like them both as center forwards, which isn't exactly what Traore has played this season at Ajax - he's mostly been playing wide right. This explains the shot locations a bit. Both players are extremely quick, but Tammy is much taller and stronger, despite also being the younger of the two. I think Abraham's ceiling is clearly higher right now, though I wish Traore had gone to a more defensively stout league and played CF so we'd have a better data point. Can he put up top 5% dribble numbers as a center forward? That would be incredibly valuable. As it is, both are big assets for Chelsea, but the only one likely to make their squad regularly is Abraham. I suspect Traore will need a restart somewhere else, but could still end up being good enough for the Champions League.
  This seems like a good spot to wrap it up. Until next month, please enjoy your Pee-not No-ir.
Changing How the World Thinks About Set Pieces
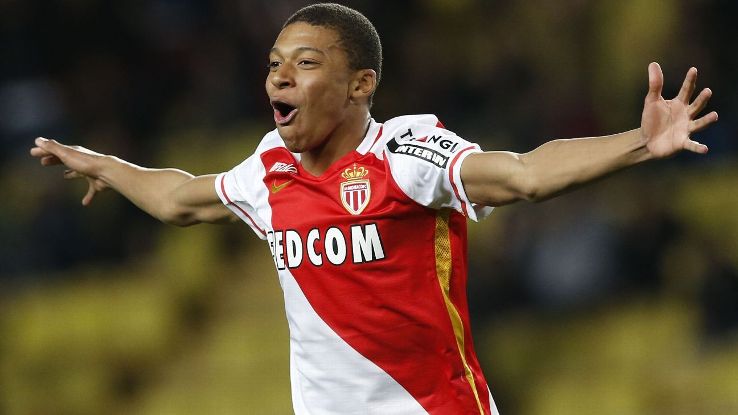
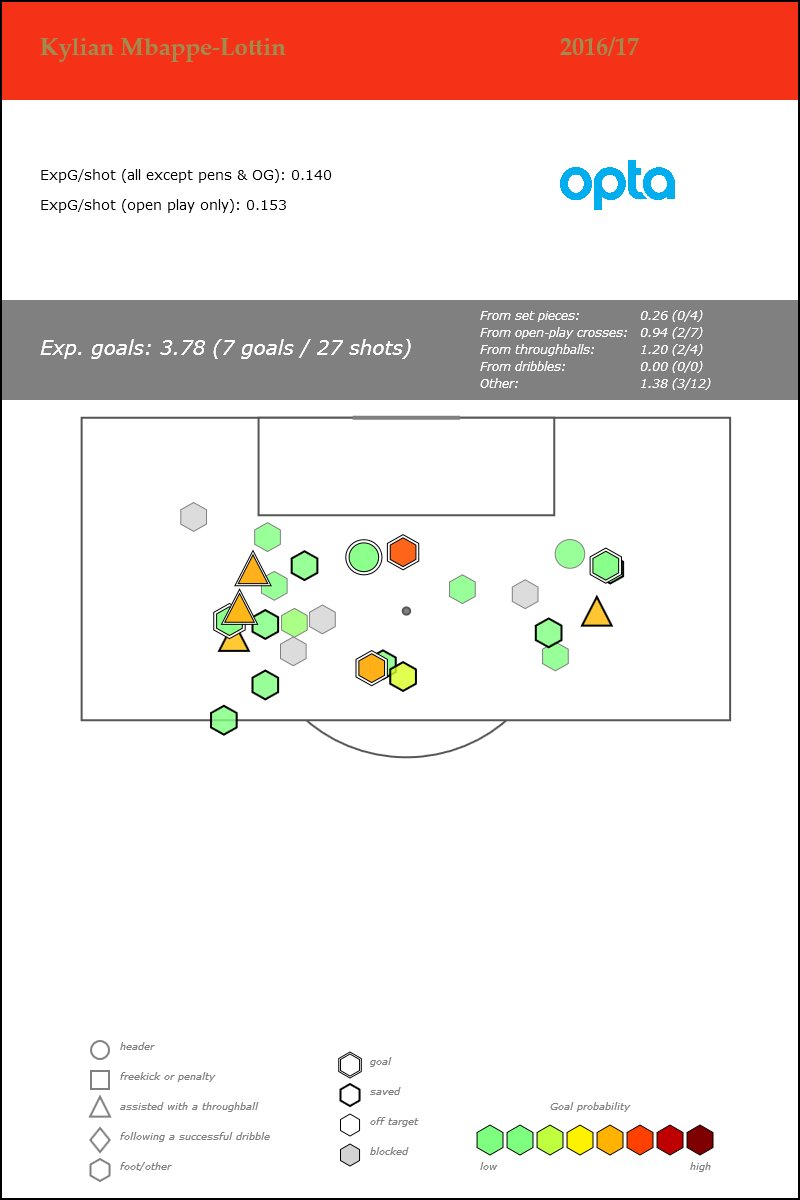
Identifying Ligue 1’s Next Big Breakout Talents #3: Kylian Mbappe-Lottin
Truth be told, this project could be based solely on prospects from Monaco. Out of all clubs in France, Monaco are the one most stocked with high upside youngsters. We’ve gone in depth over Thomas Lemar, Bernardo Silva has been one of the most entertaining players in the league since arriving in 2014, Benjamin Mendy is an athletic and creative LB while their midfield has workhorses in Fabinho and Tiemoué Bakayoko who can also do accomplished things on the ball. The last couple of years have seen Monaco cultivate an immensely exciting batch of young players, with others that can barely sniff any game time.
It’s almost a rite of passage for young attackers in France to at one point in their development be compared to Thierry Henry. We’ve seen it with the likes of Alexandre Lacazette and Anthony Martial when they broke into Ligue 1, and currently the next one in line is Kylian Mbappe-Lottin. The man has been scoring or assisting bucket loads of goals on a Monaco team that’s on pace for a remarkable 111 goals this season. It's unlikely they will keep up this pace til season’s end, but he’s been an exciting part of the preeminent Ligue 1 goal scoring machine.
One thing you notice with Mbappe-Lottin in the Monaco setup is frequently he doesn’t have to do much when it comes to taking on defenders and creating attacks for himself. A lot of that work is done by the likes of Lemar and Silva, so he’s not had to do much dribbling this season unless he has found himself with 10 yards of space. Consequently a lot of the things he does revolve around working off the blind spots of centre backs. He is usually stationed in the left half space when Monaco approach the final third because of how high up the fullbacks operate. When that doesn’t happen, he tends to move to the left wing and will hug the touchline and wait for a teammate to link with.
Something that could help Mbappe-Lottin down the line is that he doesn’t lack the confidence to take shots with his weaker left foot, and that two-footedness could allow him to have a fairly scarce advantage in terms of creating shots inside the area. This is more anecdotal than quantitative since 76% of his shots are coming from his right foot, but there’s immense value to having an attacking player who can’t be shaded a certain way by the opposition.
The one move he does have that reminds you of Henry is combining both his ability to find space in between the left back and left centre back--whether in build up play or in non-structure scenarios--and his raw pace.
It is not hard to understand why so many people are salivating at Mbappe-Lottin’s potential. Strikers at his age who have this kind of rough outline get hyped to the moon and when you add in that he is already showing good decision making plus some noted passing chops, we find very tantalizing prospect.
It does help that he plays in such a fluid team that allow many passing options, particularly playing with Silva who can present himself as a crossing option despite his rather diminutive size. Previous iterations of Monaco were never this smooth offensively and I do wonder how Mbappe-Lottin would fit in on less fluid sides. Plus, this version of Monaco has speed and quickness to kill at so many positions where others didn’t.
As the most recent breakout star from Monaco, comparisons between Anthony Martial and Mbappe-Lottin have been made, both in an athletic physical sense and that their breakout seasons occurred at the age of 18-19. This is purely subjective but I still think Martial was a better prospect when he left Monaco in 2015 compared to Lottin now but when Martial left, he was about a year older than Mbappe-Lottin so it could very well be that I’ll be singing a different tune by next winter.
For the most part Monaco have been protecting Mbappe-Lottin and matches he has heavily featured in have been ones against lower opposition. To date, these are the teams that he’s played at least 45 minutes against in Ligue 1 this season:
- Montpellier (x2)
- Saint Etienne
- Lorient
- Caen
- Bastia
- Metz
This is a smart play from Monaco. They’re allowing Radamel Falcao and Valere Germain to suck up the majority of minutes while still giving enough time for Mbappe-Lottin to potentially beat up on worse teams, which he’s done extraordinarily well.
It’s the type of strategy that more teams should use with young talents but it does make me sound a small note of caution against his nonetheless impressive outputs. Maybe it’s just a negligible amount but it's hard to exactly quantify a prospect who has been sheltered to this degree. Caen, Metz, Lorient and Bastia are terrible, and both Montpellier and Saint Etienne grade out as mid-table sides both in their underlying performances and just the general amount of talent in their squad.
Also, Mbappe-Lottin is just overshooting all his metrics in general, which basically every attacking player on Monaco is doing this season. His NPG per 90 rate is around double his xG per 90 and though the shot quality has been very good considering both his age and his shot rate, it still can’t be denied that a portion of his output looks like it is being pushed by variance. We can also see that he is yet to get the really solid up close central chances that fuel top strikers' goal tallies. That he is working alongside Falcao this season could well be a huge benefit to his learning here.
Given all the information above, we can start to ask the following questions about Kylian Mbappe-Lottin:
- Is the kid a good prospect?
- Is the kid a knockout prospect?
The answer to the first question is obviously yes. His xG+A per 90 rates him with the best strikers in France this season and is among the highest in the 18-22 age group of Ligue 1 players over the past few years. He’s shooting a lot as well and physically looks like he’s holding up just fine. He’s much closer to Kelechi Iheanacho than he is Marcus Rashford on the spectrum of teenage goal scoring strikers. And he's just 18. That he is even on the pitch in a decent team at this age is a huge indicator in itself.
In terms of the second question, I’m not prepared to say yes quite yet. In my three years of extensively watching Ligue 1, I’ve seen three under-22 attacking players who I thought were absolute Grade A talents: Ousmane Dembele, Anthony Martial, and Nabil Fekir. I just think there’s enough questions with Mbappe-Lottin that he’s not quite at the same stratosphere as these three and between some team effects and mad variance on Monaco's attack, he's been ideally positioned to prosper. Compare this to Dembele who was just doing everything and anything for a mediocre Rennes side or even Martial on a Monaco team that wasn’t nearly as fluid in their attacking structure.
I know some of this article will come out as me being Buzz Killington about Mbappe-Lottin and I’m really trying not to sour on this kid’s potential but rather be cautiously optimistic. Whether you care for Ligue 1 or not, it’s still probably the 5th best league in the world and is having the most competitive season since 2014-15.
If you can hold your own as an attacking player in a decent league at such a young age, you probably have a bright future and he’s doing that already. Mbappe-Lottin has been very productive this year in the minutes he’s played and if his underlying numbers are a genuine indicator of his true talent level, then the surreal hype around him could well be justified. There's a long way to go--and scoring on his first visit to England will do no damage to the hype around him--but he also has a lot in his favour, and could well still turn out to be Monaco’s finest forward prospect since Thierry Henry.
This is part three of a series on promising players in Ligue 1: Part 1: Corentin Tolisso Part 2: Thomas Lemar
Burnley: Doing it Differently?
If you just look at their shot numbers, you would think that Burnley were a very bad side, perhaps deserving of relegation. Were you to have their style of play described to you, you may also feel the same. On average, they are outshot by a large 8.4 shots and 2.4 shots on target per game, stats which are most readily comparable with Sunderland or Hull. Those two teams are are mired in a relegation battle while Burnley are looking like they’ll finish the season safely in mid-table, with a small chance at the top half. What's the difference?
The Defence
Essentially, Burnley play a well-drilled version of a typical counter-attacking 4-4-2, on both sides of the ball. Their defence has either been pretty good or pretty lucky, or more likely a bit of both – their opponents have converted just 7.8% of their shots (league average around 10%), and just 25% of their shots on target (league average around 33%). These are both the 2nd best rates in the league.
Data from Stratagem, counting men between the ball and the goal when a shot is struck, make Burnley stick out like a sore thumb and adds a layer to explain here. In Stratagem’s sample for this Premier League season, around 14% of shots have fewer than two defenders between the place the shot is taken and the goal, and another 14% has more than 4 defensive players. All the other shots (72%) fit between these two parameters and have two, three or four defenders between the shooter and the goal.
For Burnley, they’re rarely caught short, with only 9.3% of the chances they concede occurring when there are fewer than 2 players between shooter and the width of the goal. On the other side of things, they’ve packed the defence with 5 or more players on 19.38% of occasions. The closest team to them on this count is Manchester United, on 15.68%; Burnley are leading by a distance.
However, when this is divided up by the area that the chance is taken from, something strange happens. Though Burnley are still at the head of the pack for percentage of chances conceded in the danger zone with a packed defence, their lead is slashed. Sean Dyche’s side are packing the box against chances 10.14% of the time (nearly double the league average of just over 5%), but they’re closely followed by Sunderland on 9.09% and Southampton on 8.97%. It looks as though these are just teams who play a deep defensive line and have decent defensive coaches at the club.
Where Burnley stand out as truly bizarre are shots from the wide areas of the box, outside of the width of the six-yard box. On average, and probably to do with the angle these shots are taken at, the league has five or more men between shot and goal on 4.37% of occasions. The second highest rate belongs to Middlesbrough, on 8.33%.
Burnley’s figure is double that at 16.67%. Sixteen.
Similarly, in terms of getting caught short, Burnley are freaks again – getting only one or no men in place for a potential block just 1.67% of the time, far below the league average of 14.33%. The figures are just too wildly different to purely be chance, and while part of it may be due to the tight narrowness that the back four often takes when they move back towards their own box, this is a common enough feature of Premier League sides. Burnley may do it better than the rest – their wingers do work exceptionally hard, allowing the full-backs to keep narrow – but it seems like there’s likely something else at play here too. As we can see here, Burnley look like they’ve worked on blocking shots at training – or, to be more precise, they look like they’ve worked on taking deliberate actions to make the frame of the goal as small as possible to opponents >>>> Burnley frame squeezing from EveryTeamNeedsARon on Vimeo.
(Video shows several examples of Burnley defenders moving within the line of the post as opponents shape to take shots)
The theory is that Burnley are positioning themselves in places which direct shots towards Heaton, with keeper and defenders deliberately working in tandem to make lives easier for themselves rather than trying to throw any body possible in front of the shot. If executed properly, this method could also cut down on the chance of deflections past the keeper while and gives Heaton more time to see the shot coming and react quickly.
The huge disparity between the 17% figure for Burnley and the rest of the league, who are hovering more than ten percentage points further down, heavily implies that something deliberate is happening. It could also be true that this may also be in play for more central shots, but that it isn’t quite being picked up in the data, and that this may be something not picked up in the expected goals data too.
The conversion rate for shots Burnley concede from this area is certainly low enough, at just 13.58%, with the league conceding at a rate of 18.53%, and it's in this central area where Burnley’s overall defensive skew is coming from, as they concede at a roughly average rate from the wider areas of the box.
There are a couple of other features which are relevant too. Tom Heaton is obviously a good keeper who has a good understanding with his defence and is quick to move off his line to collect a loose ball when he has to. It may also be worth noting that Burnley’s back five combined, have played 95.53% of available league minutes this season. A level of understanding built from consistent game time can be a great benefit.
As well as being virtually ever-present, Burnley’s defence is also clearly well-drilled. While their frame-squeezing techniques are a feature, it goes wider than this, and the fact that they are 2nd in the league for the number of offsides played (2.7 per game) is an illustration. The teams they are behind or roughly level with here are Manchester United, Manchester City, and Arsenal, all sides who play a significantly higher line than they do.
The Attack
While Burnley’s attack is converting shots at virtually a dead-on-average rate for both shots and shots on target (10.76% and 31.76%), they’re still ahead of expected goals. James wrote in a recent round-up that
‘...they are scoring from range at a rate over expectation higher than any team in the Premier League this decade. If I tell you Liverpool and Manchester City 2013-14 are ranked two and three in this list, it becomes clear what kind of attacking overperformance this is: spectacular and unsustainable’.
As if to spite him, Burnley got their next goal against Chelsea direct from a free-kick.
Closer to goal, perhaps Burnley are doing something a little more sustainable. Per Stratagem, Burnley are taking shots in the danger zone with fewer than two men between the shooter and the goal for 33.3% of the time, which is the third highest rate in the league, behind only Manchester City and Tottenham Hotspur. The volume isn’t high, but it looks like efficient counter-attacking.
They have an uncanny knack of picking up second balls and, after receiving them, finding a teammate under less pressure – both giving them room to breathe in attack and helping prevent giving the ball up and returning to the back foot again. There are probably other little things Burnley do to maximise their attacking chances, but one can only bear to watch so much of them for unpaid (or even, probably, paid) analysis.
When Sean Dyche goes on his rants for respect, he generally draws attention to the fact that he’s made his players work harder and run more, and they’re doing the same kind of things that in-fashion foreign managers like Klopp get their team to do. I think this is deflecting. For one, although running data aren’t publicly available for high-intensity analysis, if Burnley were running faster, harder, and longer than anyone else then I suspect it would have been brought up by now. For the other, Dyche seems like he has intelligently worked on techniques to coach the best out of a fairly run-of-the-mill 4-4-2 and fairly run-of-the-mill players. And while they have probably got a bit of unsustainability going their way on both sides of the ball, there is enough about their play this season to suggest that their style and methods are making a genuine impact.
Additional Time: Spain's Missing Minutes and Other Findings
The rules of football are very clear. Law 7, “The Duration of the Match” states that “A match lasts for two equal halves of 45 minutes”. The rules also make an “Allowance for Time Lost”, in which they list the following scenarios where allowance should be made for all time lost due to:
- substitutions
- assessment and/or removal of injured players
- wasting time
- disciplinary sanctions
- stoppages for drinks or other medical reasons
- any other cause, including any significant delay to a restart (e.g. goal celebrations)
It appears that, according to the rules, no allowance is to be made when the ball goes dead (ie. out for a goal kick, corner, throw-in or for the award of a free kick), unless the referee deems that there has been a significant delay to the restart. It therefore follows that the rules makers never intended there to be 90 minutes of actual play, but due to the combination of a varying number of dead ball events, differing interpretations of what represents “a significant delay to a restart” as well as the leniency (or otherwise) of the referee with respect to time wasting we are now in a position that the amount of actual playing time from one game to the next can fluctuate wildly. These fluctuations can be seen between one league and another, but they can also be seen from game to game within the same league.
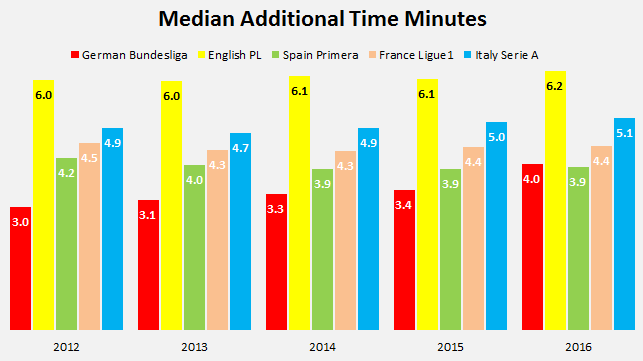
The image below shows the median time, in minutes, that the ball was in play for in each of the traditional Big 5 European leagues since the 2010/11 season:
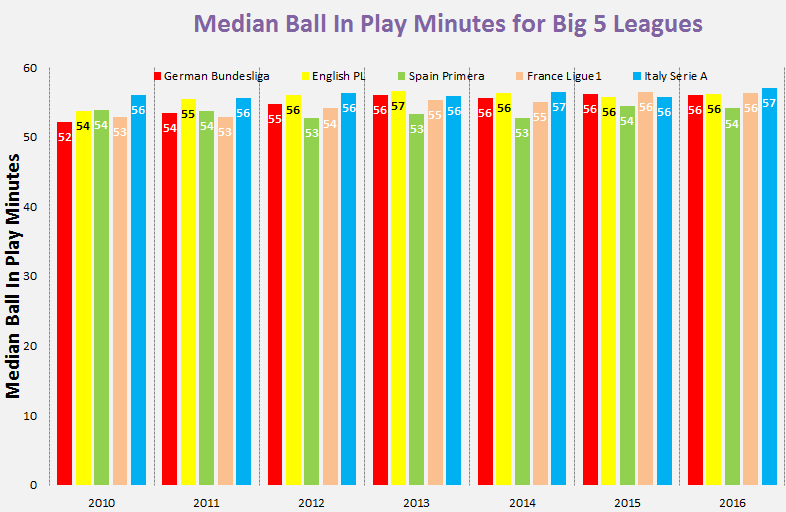
The first thing to note is that the median Ball In Play (BIP) value across all leagues never exceeds 57 minutes (the minutes values displayed on the chart are rounded to the closest minute).
Almost 90% of games have an effective BIP duration of less than 60 minutes. That, typically, more than 1/3rd of the allotted playing time per the rules of the game witnesses no action on the pitch isn't very intuitive. Is that what the rules makers intended when the laws of the game were laid down?
If we look at the last two or three seasons we see that the Spanish Primera Liga is an outlier in terms of the actual time played when compared to the other leagues. While the other four leagues have a median observed BIP time of 56 – 57 minutes the Spanish league typically sees 2 – 3 minutes less actual playing time per game.
How Much Time is Actually Added On?
Although, excluding Spain, there is a certain consistency in the actual minutes of football played between the leagues, the leagues follow a very different path in arriving at their typical 56 – 57 minutes of action.
The chart below shows the median amount of time that is played over and above the mandated 90 minutes. Note that this is not the time that the fourth official displays on the board, but the actual time that is added on.
To give an example: A fictitious game sees the first half end with 46mins 20 secs gone on the clock and the second half end at 94mins exactly. The amount of additional time actually played in this game was 5mins 20 secs (or 5.33 minutes).
We can see that each of the last 5 seasons follows a similar pattern in terms of additional time played across the leagues.
Games in the English Premier League consistently see much more additional time played than in the other leagues. It’s interesting that despite, on average, playing one more minute additional time than the other leagues, the English Premier League doesn’t actually see a greater amount of playing time. This additional amount of time added on is merely needed to match the other leagues in achieving a BIP time of 56 minutes.
Following the EPL, we see that Italy consistently has a median value of additional time of approximately 5 minutes per game, with France following slightly behind with about 4.5 minutes.
The amount of additional time added on to Spanish La Liga matches is revealing.
We saw in the first chart that Spanish games consistently see the lowest amounts of time that the ball is actually in play. So, unlike in England, the Spanish referees are not adding on sufficient amounts of injury time at the end of each half. In comparison with the other leagues, it would appear that the Spanish arbiters should be playing another couple of minutes additional time per game.
Despite less additional time being played in Germany, fans of the Bundesliga haven’t witnessed (at least for the last 3 or 4 seasons) less minutes of actual playing time than their European peers. By definition, this can only be due to a lower duration of stoppages during the regular 90 minutes.
1st Half Additional Time
I wanted to take a look at how the additional time is apportioned over the two halves.
The chart below shows the distribution of time that each league has added on at the end of their first halves over the last 5 seasons. For display purposes, the amount of additional time has been rounded to the nearest minute in the following charts.
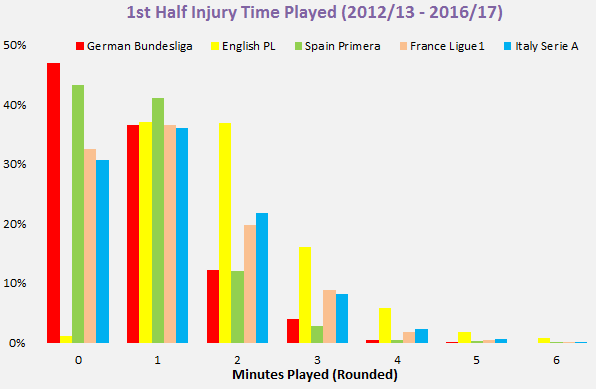
47% of German Bundesliga games had less than 30 seconds added on to the end of the first half; this compares with just 1% of English Premier League games. Here we can see the first part of Spain’s issue re the lack of additional time; 43% of Spanish games has less than 30 seconds added on at the end of the first half. In fact, 85% of Spanish games had less than 1.5 minutes of first half additional time; this compares rather unfavourably with England’s equivalent figure of just 38% of games.
The Spanish whistlers also seem loathe to play more than 2.5 minutes of first half additional time. Only 3.6% of Primera league games seen its clock tick round to 47mins 30secs. Even the German Bundesliga has a greater percentage of first halves lasting longer than that; and almost 25% of EPL games seen additional time of at least that duration.
No matter how we slice this, it’s clear that playing a fairly short amount of added time is just a thing that the Spanish top flight does.
2nd Half Additional Time Below is a similar chart, this time looking at the 2nd halves of games:
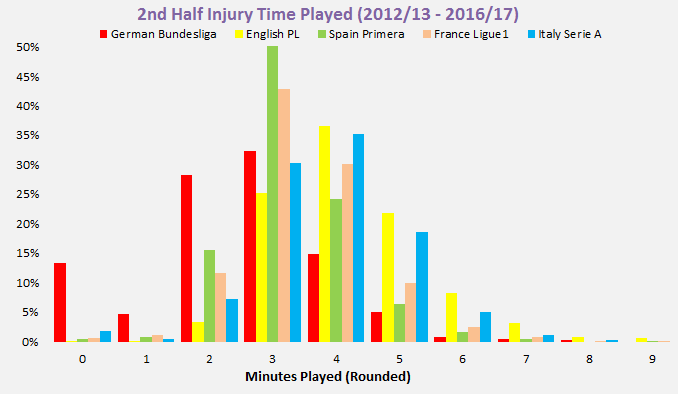
I have previously read on my Twitter timeline of the default 3 minutes additional time shown the end of games in Spain. The analysis undertaken for this article has shown this assertion to have considerable merit as just over 50% of Spanish top flight games had 3 minutes (rounded) of additional time played at the end of the second half.
The German Bundesliga displays similar 2nd half tendencies as we seen earlier when looking at the 1st halves. I was somewhat surprised to see that 13% of Bundesliga games had less than 30 seconds additional time played at the end of the game. In fact that we find that almost half of all German Bundesliga games play less than 2.5 minutes of additional time once the 90 minutes are up; compare this with only 1 in 30 EPL games having less than 2.5 minutes 2nd half additional time!
England and, to a lesser extent, Italy are the two leagues where its spectators are most likely to see more than 3.5 minutes of additional time played in the 2nd half. This analysis would suggest that Spanish fans deserve to see longer periods of additional time played at the end of each half, but for whatever reason they just aren't getting it.
English Premier League
Thus far, I have implied that English Premier League referees are doing a pretty good job (compared with the other leagues) with their timekeeping as they generally play the greatest amount of additional time. This ensures that the typical EPL match sees as much actual ball in play time as the other main European leagues. I have favourably compared it to Spain where the referees do not seem to be as fastidious in their as their English counterparts in adding on sufficient additional time at the end of each half.
However, even within the EPL there are significant differences in how much actual time is played from game to game.
The chart below shows the distribution of actual in play minutes in the Premier League over the last 5 seasons:
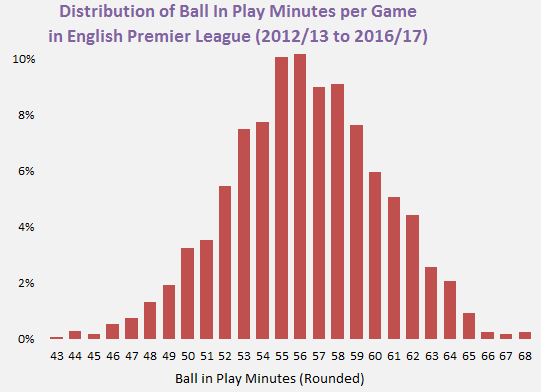
It’s no surprise, that we see that 55 and 56 minutes are the BIP minutes that have been most common in the Premier League, but that there have been games with BIP minutes ranging from as little as 43 to as much as 68 amy surprise some readers. It would seem barely plausible that two games played under the same rules in the same league could differ in their actual playing times by such an order of magnitude.
Swansea in November
Earlier this season, during last November, Swansea played a couple of games at home that could hardly have been more different in terms of actual playing time; and I have taken a look at those two games in some detail.
On November 6th Swansea hosted Man United at the Liberty Stadium, lost 3-1 but the fans at that game gorged on 64 minutes of seeing the ball move around the pitch. However, just three weeks later the Swansea fans experienced a totally different experience when they beat Crystal Palace in a barnstorming, never to be forgotten, 5-4 thriller. However, (according to my methodology) that thrilling game experienced just 44 minutes of actual moving footballs!
For the two games mentioned above I went through each Opta action in chronological order and produced a summary showing the approximate number and duration of each stoppage that occurred in the games.
The following charts categorise the stoppages. Note that there aren’t separate categories for the issuing of cards or making substitutions as those delays are built into the stoppage where the event happened.
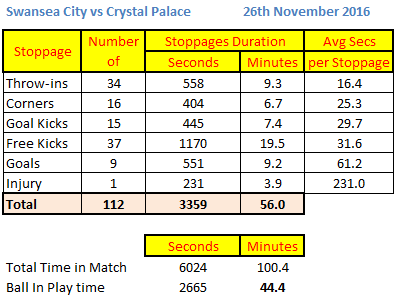
Remarkably, even though more than 100 minutes of time was played in the match, we can see the stoppages that resulted in less than 45 minutes of actual ball in play time.
In total, I calculated that there were 112 stoppages. We can see that, unsurprisingly, the length of break in play is largely dependent upon the type of stoppage. Before we look in depth at the various stoppages, let’s compare Swansea’s game versus Crystal Palace with their game played three weeks earlier at the same venue against Man United:
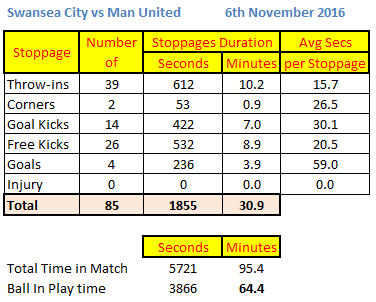
The Man United game had only 95 minutes of playing time, but that still resulted in approximately 64 minutes when the ball was in play.
Across the two games we can see patterns emerging in terms of how much inactivity we can expect to see as a result of a given dead ball situation:
- Each goal results in approximately 60 seconds of no action
- On average, each time the ball goes over the end line (either for a corner or goal kick) we see a break in play of about 30 seconds
- Throw-ins take about 15 seconds on average to restart play
The average duration of breaks in play arising from free kicks differed greatly in these two games. The average free kick in the Crystal Palace game took 31 seconds out of the game, while the equivalent was 10 seconds less in the Man United game. I ascertained that a large part of the reason for this is that in the Crystal Palace game Gylfi Sigurdsson had two direct free kick efforts at goal. The first one was struck more than 2 minutes after the free kick was awarded (some screen caps are included below). As well as the usual spray painting by the referee there was some messing about in the wall which resulted in Yohann Cabaye being called out from the defence and receiving a lecture. The second one was struck 50 seconds after the foul. In contrast, there were no direct shots at goal from free kicks in the Man United game.
In terms of providing a rough ready reckoner for how we can have 64 minutes of play in one game, and then only 44 minutes in another I would reduce the 20 minutes less football played in the Crystal Palace game to:
- 5 additional goals = +5 minutes
- 5 fewer throw-ins = -1 minute
- Additional delays attributable to free kicks = +10 minutes
- 14 additional corners = +6 minutes
What should be done in such instances?
That we can have two games in the same competition where one sees 44 minutes actual play, and the other 64 minutes doesn’t seem equitable. Obviously the example I have used here includes two fairly extreme cases, one at either end of the scale, but they are real, not illustrative.
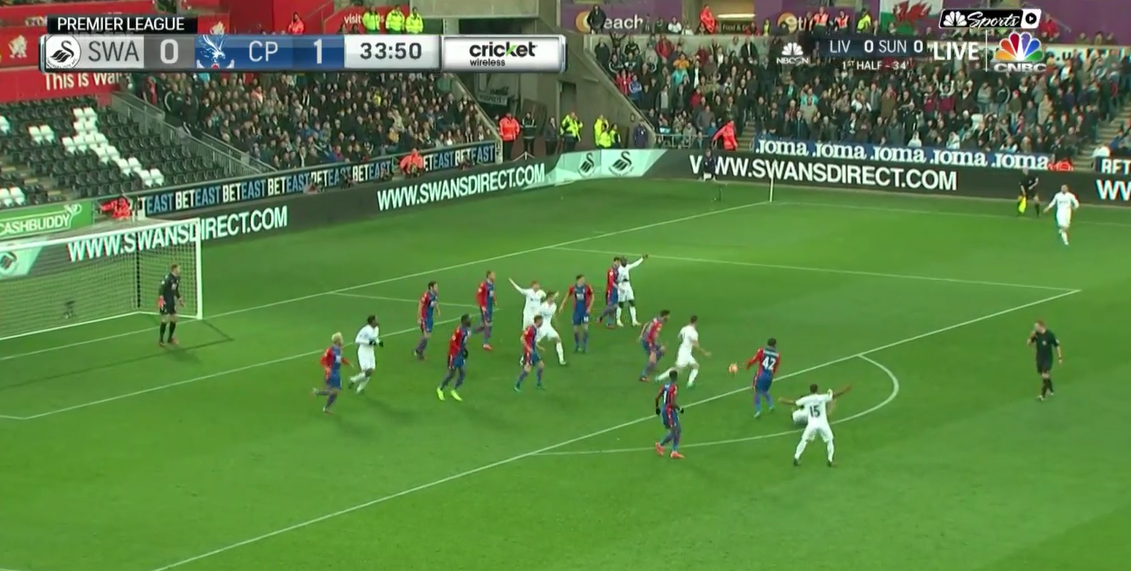
The first half of the Swansea v Crystal Palace game had less than 3 minutes additional time. However, one series of events shows just how inadequate that additional time was. From the screen cap below we can see that Jack Cork was fouled on the edge of the opposition’s penalty area at 33mins 50secs.
Gylfi Sigurdsson scored directly from the subsequent free kick, which was taken at 35mins 57secs, after a delay of 127 seconds.
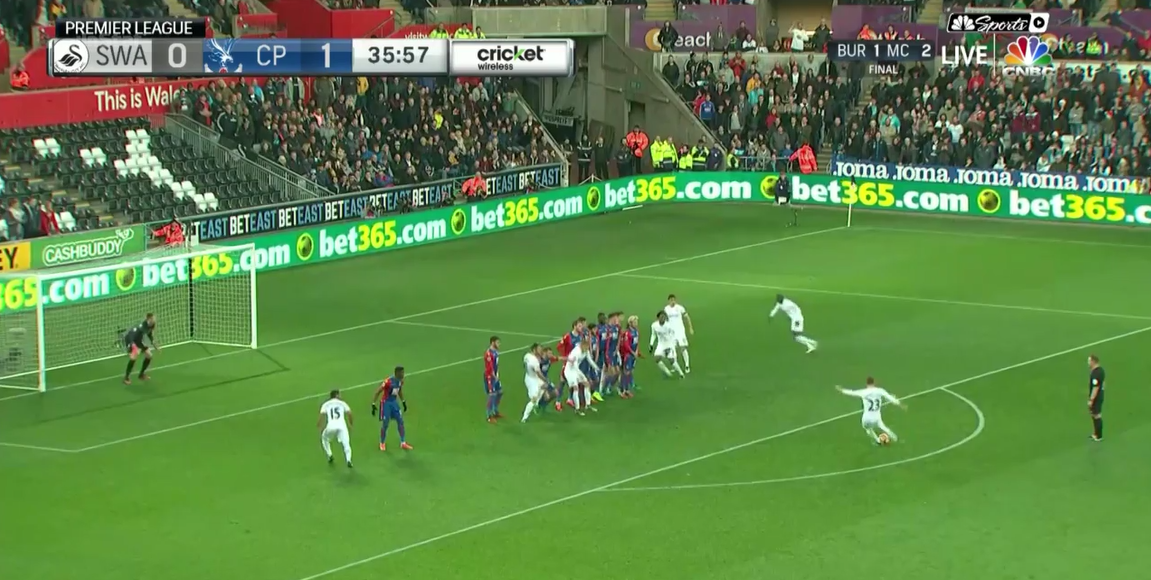
Crystal Palace took the restart following the goal, after another full minute expired to allow the celebrations to pass. So, over a period of about 3mins and 5secs the only action that took place was Sigurdsson striking the free kick. That one series of events from the 33rd to the 36th minutes had longer stoppages than the additional time played at the end of the half!
Given the considerable differences in playing time it does seem like one possible solution would be to operate a 60 minute stopped clock, instead of the current “we’ll call it 90 minutes but there is no telling how long we’ll actually play for” duration. Such a change from the status quo would see more football being played in almost 90% of games; but the main advantage would be that all teams would be on a level playing field. What is there not to like about that idea?
Timewasting would not continue to be rewarded, as the perpetrators would know that every second the ball wasn’t in play we would see an equivalent amount of time being added on at the end. Right now, this definitely isn’t the case.
I appreciate that such a move to a stopped clock will not be easily made, however the Liga de Fútbol Profesional (LFP), the organisation that runs the Spanish Primera league, have a much easier change to make. Armed with the information in this analysis they need to have a look at their lack of additional time in comparison to the other big European leagues and instruct their referees to add a little more additional time than they currently play.
By doing that, the Spanish football fans will begin to see as much football as their peers in the other European countries.

The Wisdom of Crowds: a census of EPL forecasts after gameweek 24.
Introduction We're nearly two-thirds of the way through the 2016/17 EPL season, which seems a good time to try to predict what might happen. Chelsea’s nine-point cushion and relentless form make them clear favorites for the title; not since Newcastle in 1996 have a team blown such a lead. Just five points separate second from sixth as the remaining superpowers battle for Champions League places: who will miss out? Perhaps the mantra ‘most competitive EPL season ever’ is best reserved for the relegation fight, though. Six teams, two points and an ever-changing landscape. Amongst them: last season’s heroes, Leicester. Too good to go down? Most TV pundits are definitive in their predictions, indeed they are typically paid to be so. Others prefer to let the numbers do the talking. Football analysts around the world build mathematical models to measure team strength and calculate the probability of match outcomes. Rather than saying “team A are likely to beat team B”, they'll say “I estimate that there is an 85% probability that team A will win”. There is no agreed method for designing a forecast model for football. Consequently, predictions vary from one model to another. However, there is also strength in diversity. Rather than comparing and contrasting predictions, we can also collect and combine them to form a consensus opinion. Last January, Constantinos Chappas did just that. Following gameweek 20, he collected 15 sets of predictions, averaging them to produce a ‘consensus forecast’ for the outcome of the 2015/16 EPL season. His article was published on StatsBomb here; we’ll return to the success of last year’s predictions at the end. First, I’m going to repeat the exercise for the 2016/17 EPL season. What do the combined predictions say this time around? Participants In total there were 15 participants this year, many of whom offered up their predictions in response to my twitter appeal. A big thank you goes out to (in no particular order): @8Yards8Feet, @petermckeever, @goalprojection, @11tegen11, @cchappas, @SteMc74, @fussbALEXperte, @SquawkaGaming, @EuroClubIndex, @opisthokonta and Sky Sports (via @harrydcarr) To these, I added forecasts from the FT and FiveThirtyEight; I haven’t been in contact with them personally, but their forecasts are publicly available. I also added a bookmaker’s average, calculated by collecting the odds published on oddschecker.com and averaging the implied probabilities. That’s 14 - the final participant was myself (@eightyfivepoint). The Predictions Before we get into the results, a little bit about how they’ll be presented. I’ve followed last year’s article and presented forecasts as box-plots. These are a simple graphical representation of the distribution of forecasts for a particular outcome. The height of the shaded area represents the interquartile range: the 25th to 75th percentiles. By definition, half the forecasts lie within this range -- it provides a decent estimate of the variablity of the predictions. The black horizontal line in the middle is the median (50th percentile), I’ll sometimes refer to this as the consensus forecast. The ‘whiskers’ extending out vertically from each box show the 5th to 95th percentiles. All but the highest and lowest forecasts for a given outcome will lie within this range. On each plot I've also plotted the individual predictions as coloured points. They are identified by the legend on the right. So, without further ado, here are the forecasts for this 16/17 EPL season. The Champions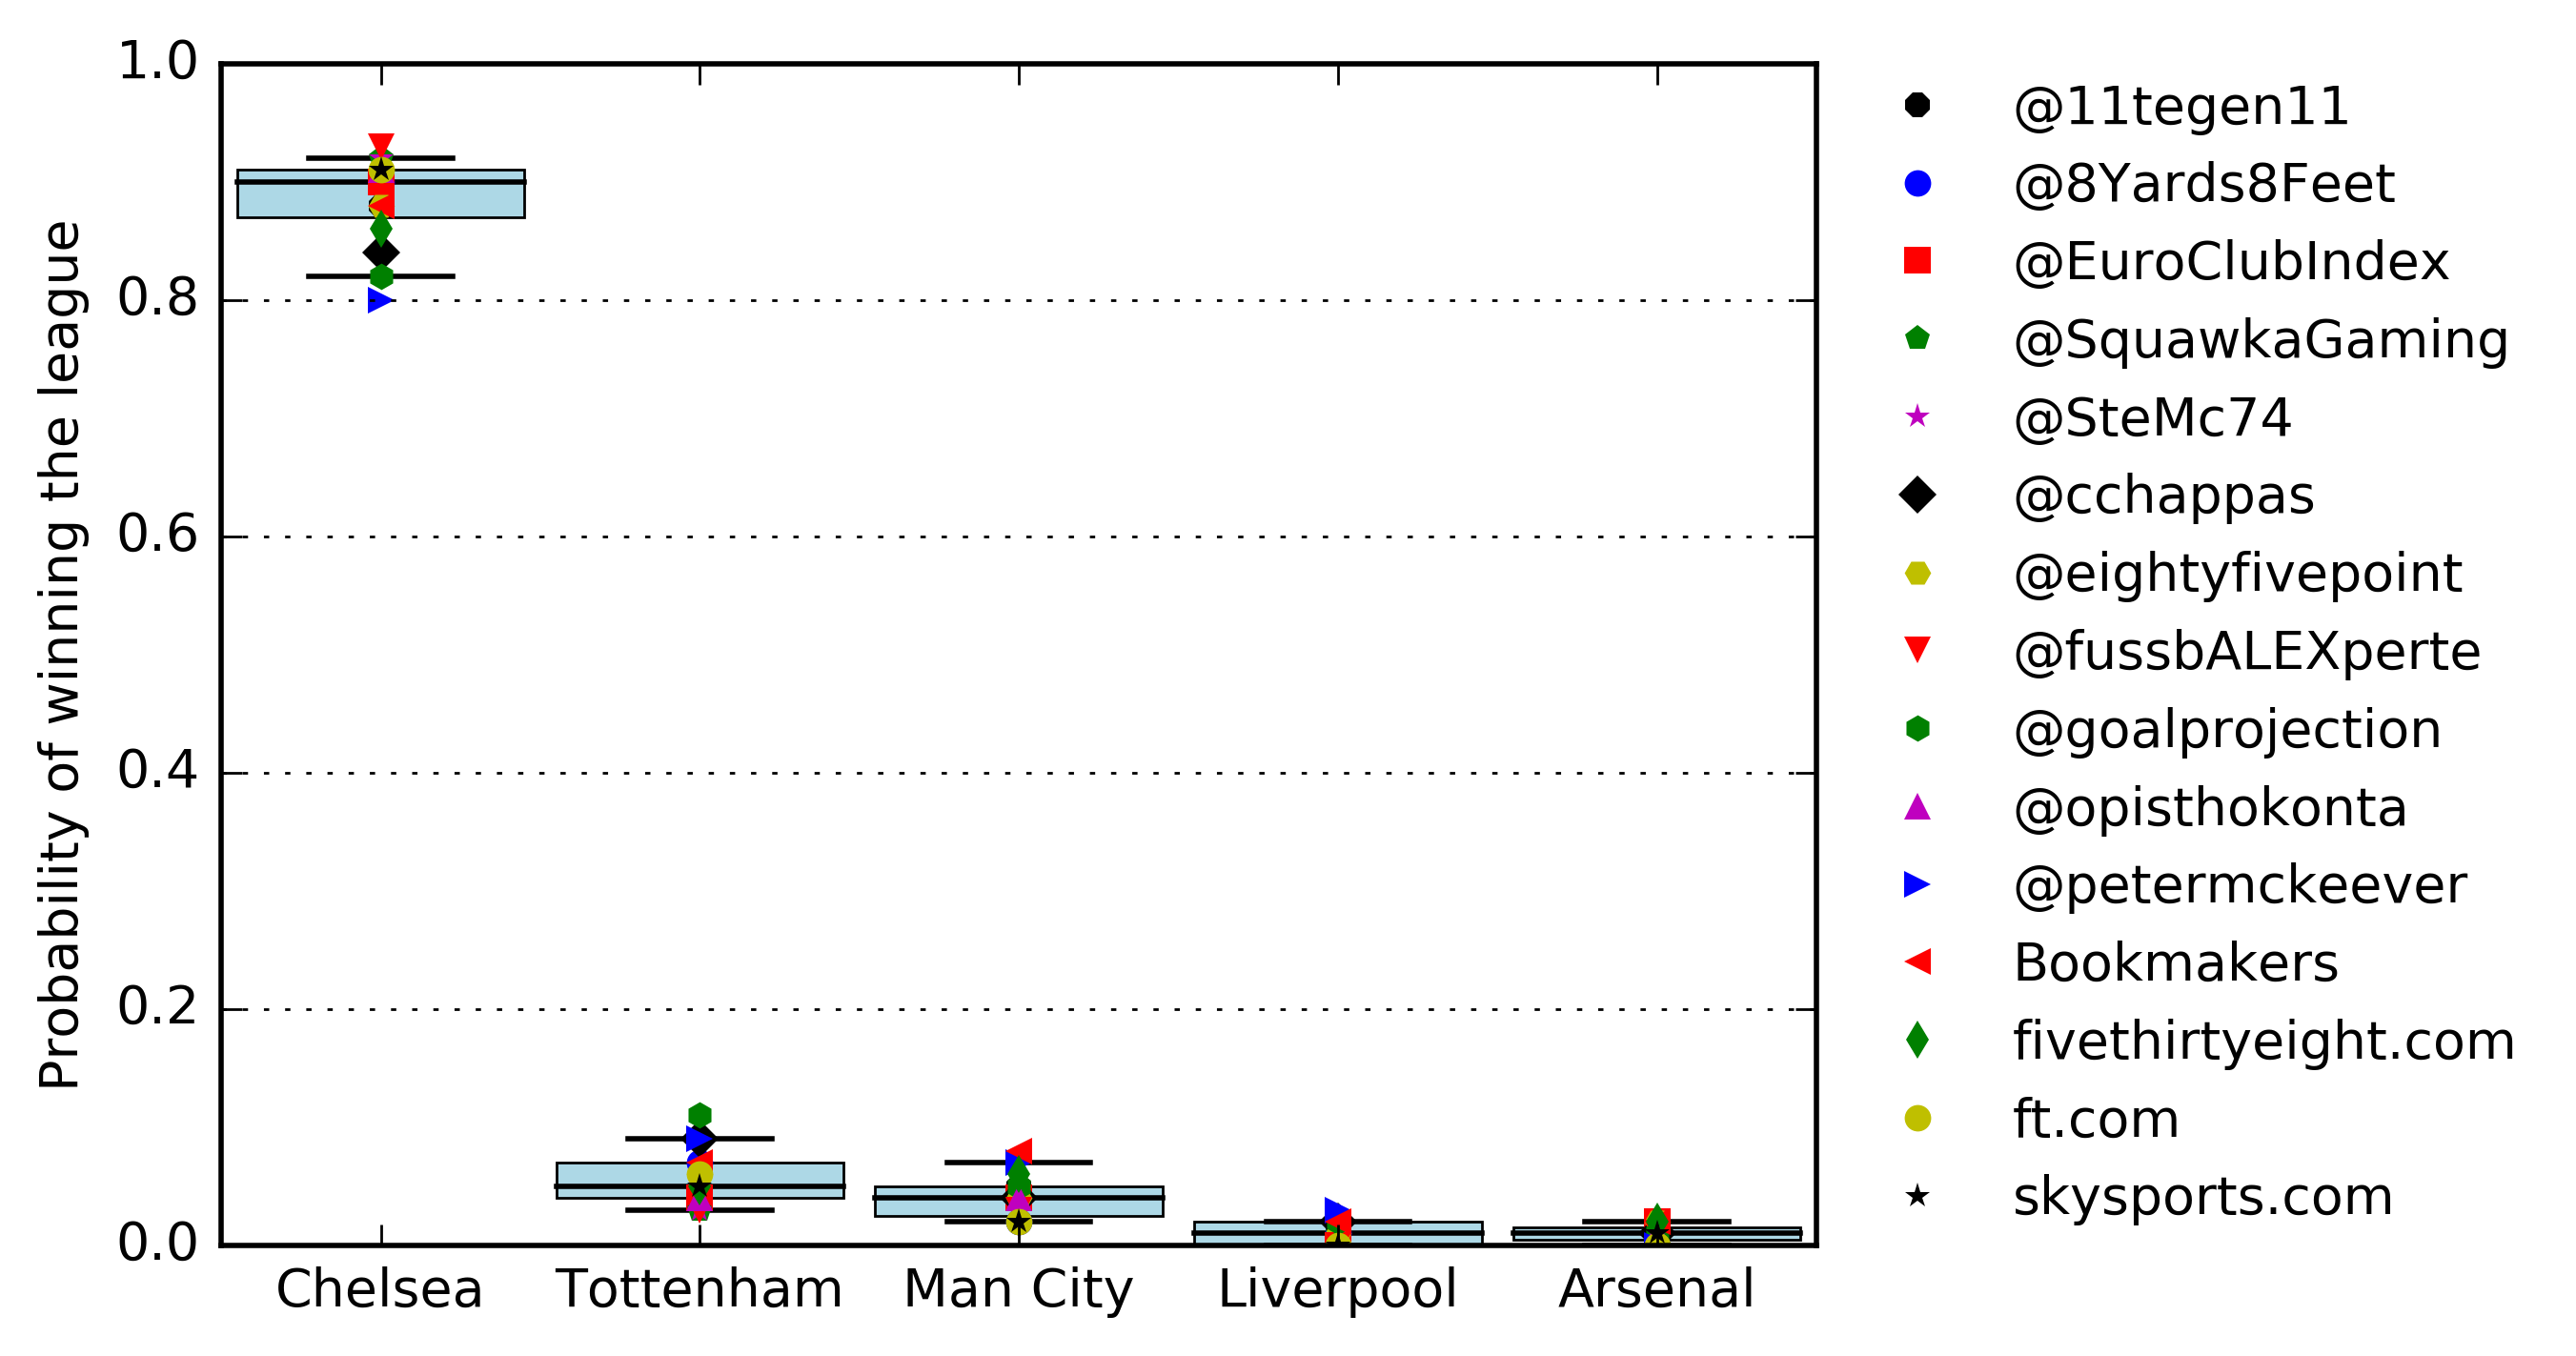 Not surprisingly, Chelsea are the clear favourites: the median forecast gives them an 88% chance of winning the league, as do the bookmakers. There’s not a huge amount of variability either, with the forecasts ranging from 80% to 93%. If Chelsea do suffer some kind of meltdown then it’s probably Spurs or City that would catch them, with median predictions of 5% and 4%, respectively. Liverpool and Arsenal are rank outsiders and any of the other teams finishing top would be an enormous surprise. The Top Four
 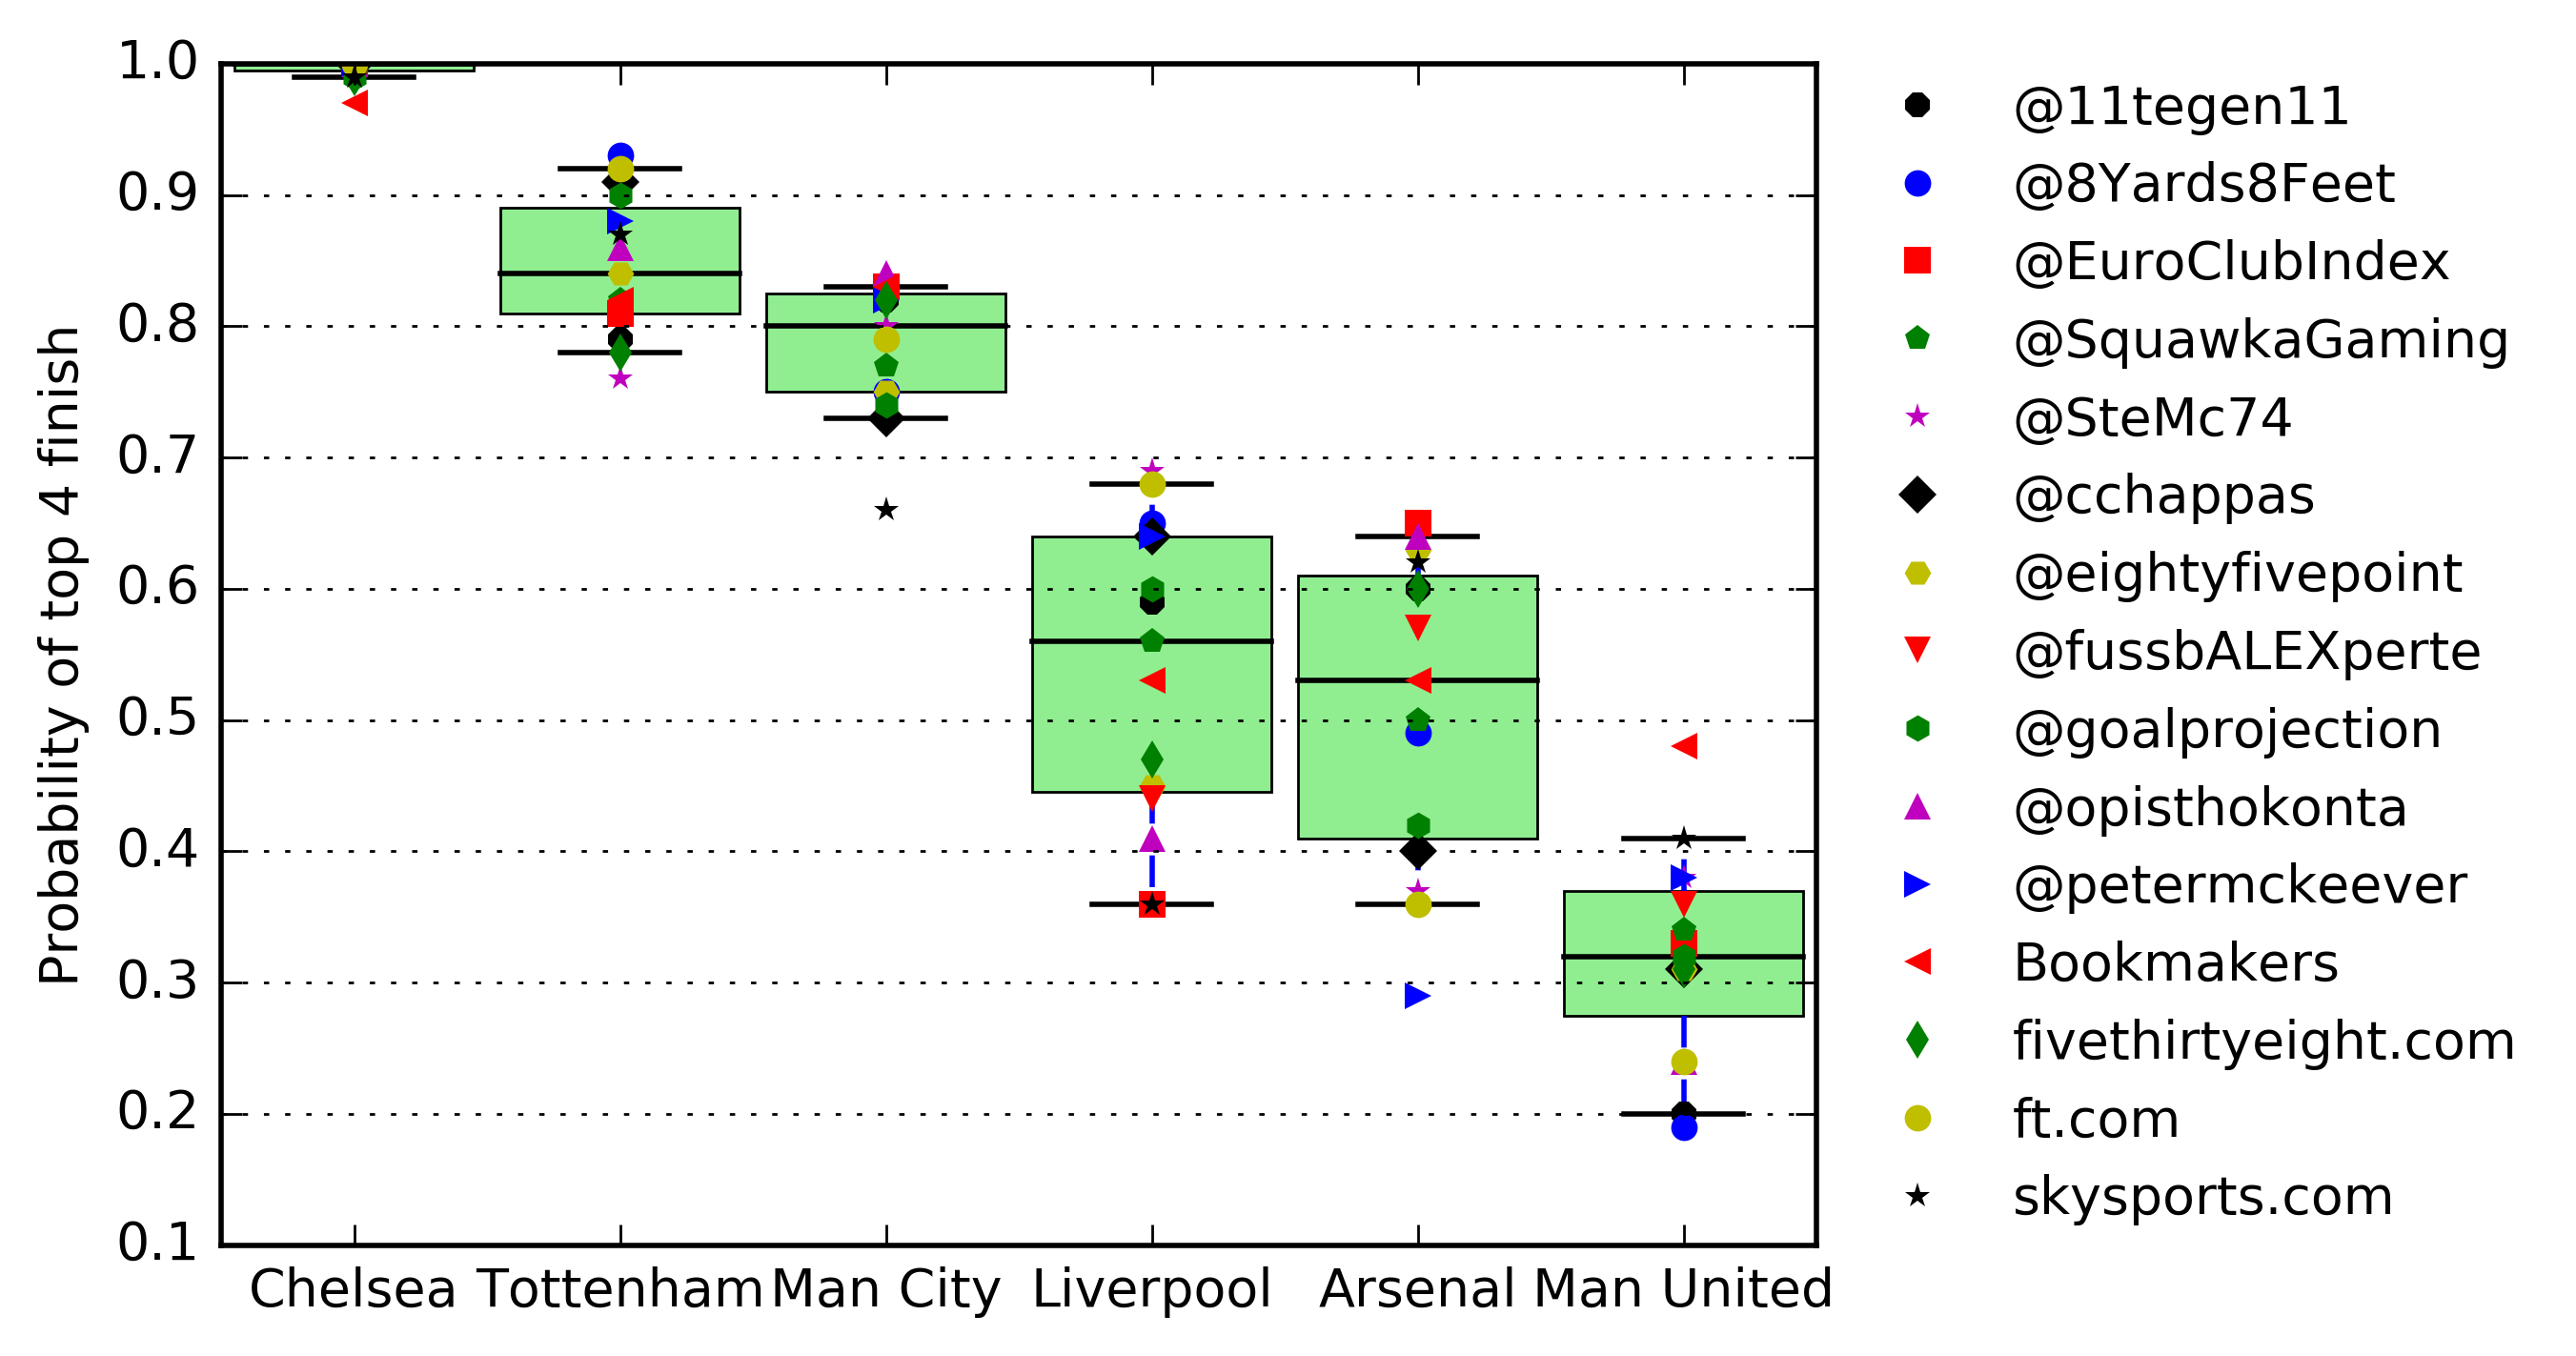 Now this is where things get a bit more interesting. Chelsea seem almost guaranteed to finish in the Champions League places, which leaves five teams fighting it out for the remaining three. Tottenham and Man City are heavily favoured: both have a median probability of at least 80% and the whiskers on their box-plots do not overlap with those of the next team, Liverpool. The real fight is between Klopp and Wenger. Statistically they are almost neck-and-neck, with their box-plots indicating that the individual predictions are broadly distributed. Look closely and you see an interesting negative correlation between them: those that are above average for Liverpool tend to be below average for Arsenal (and vice-versa). You can see this more clearly in the scatter plot below. The reason must be methodological; to understand it we’d have to delve into how the individual models assess the teams' relative strength. Note that the bookies are sitting on the fence - they've assigned both Arsenal and Liverpool a 53% chance of finishing in the top four.
 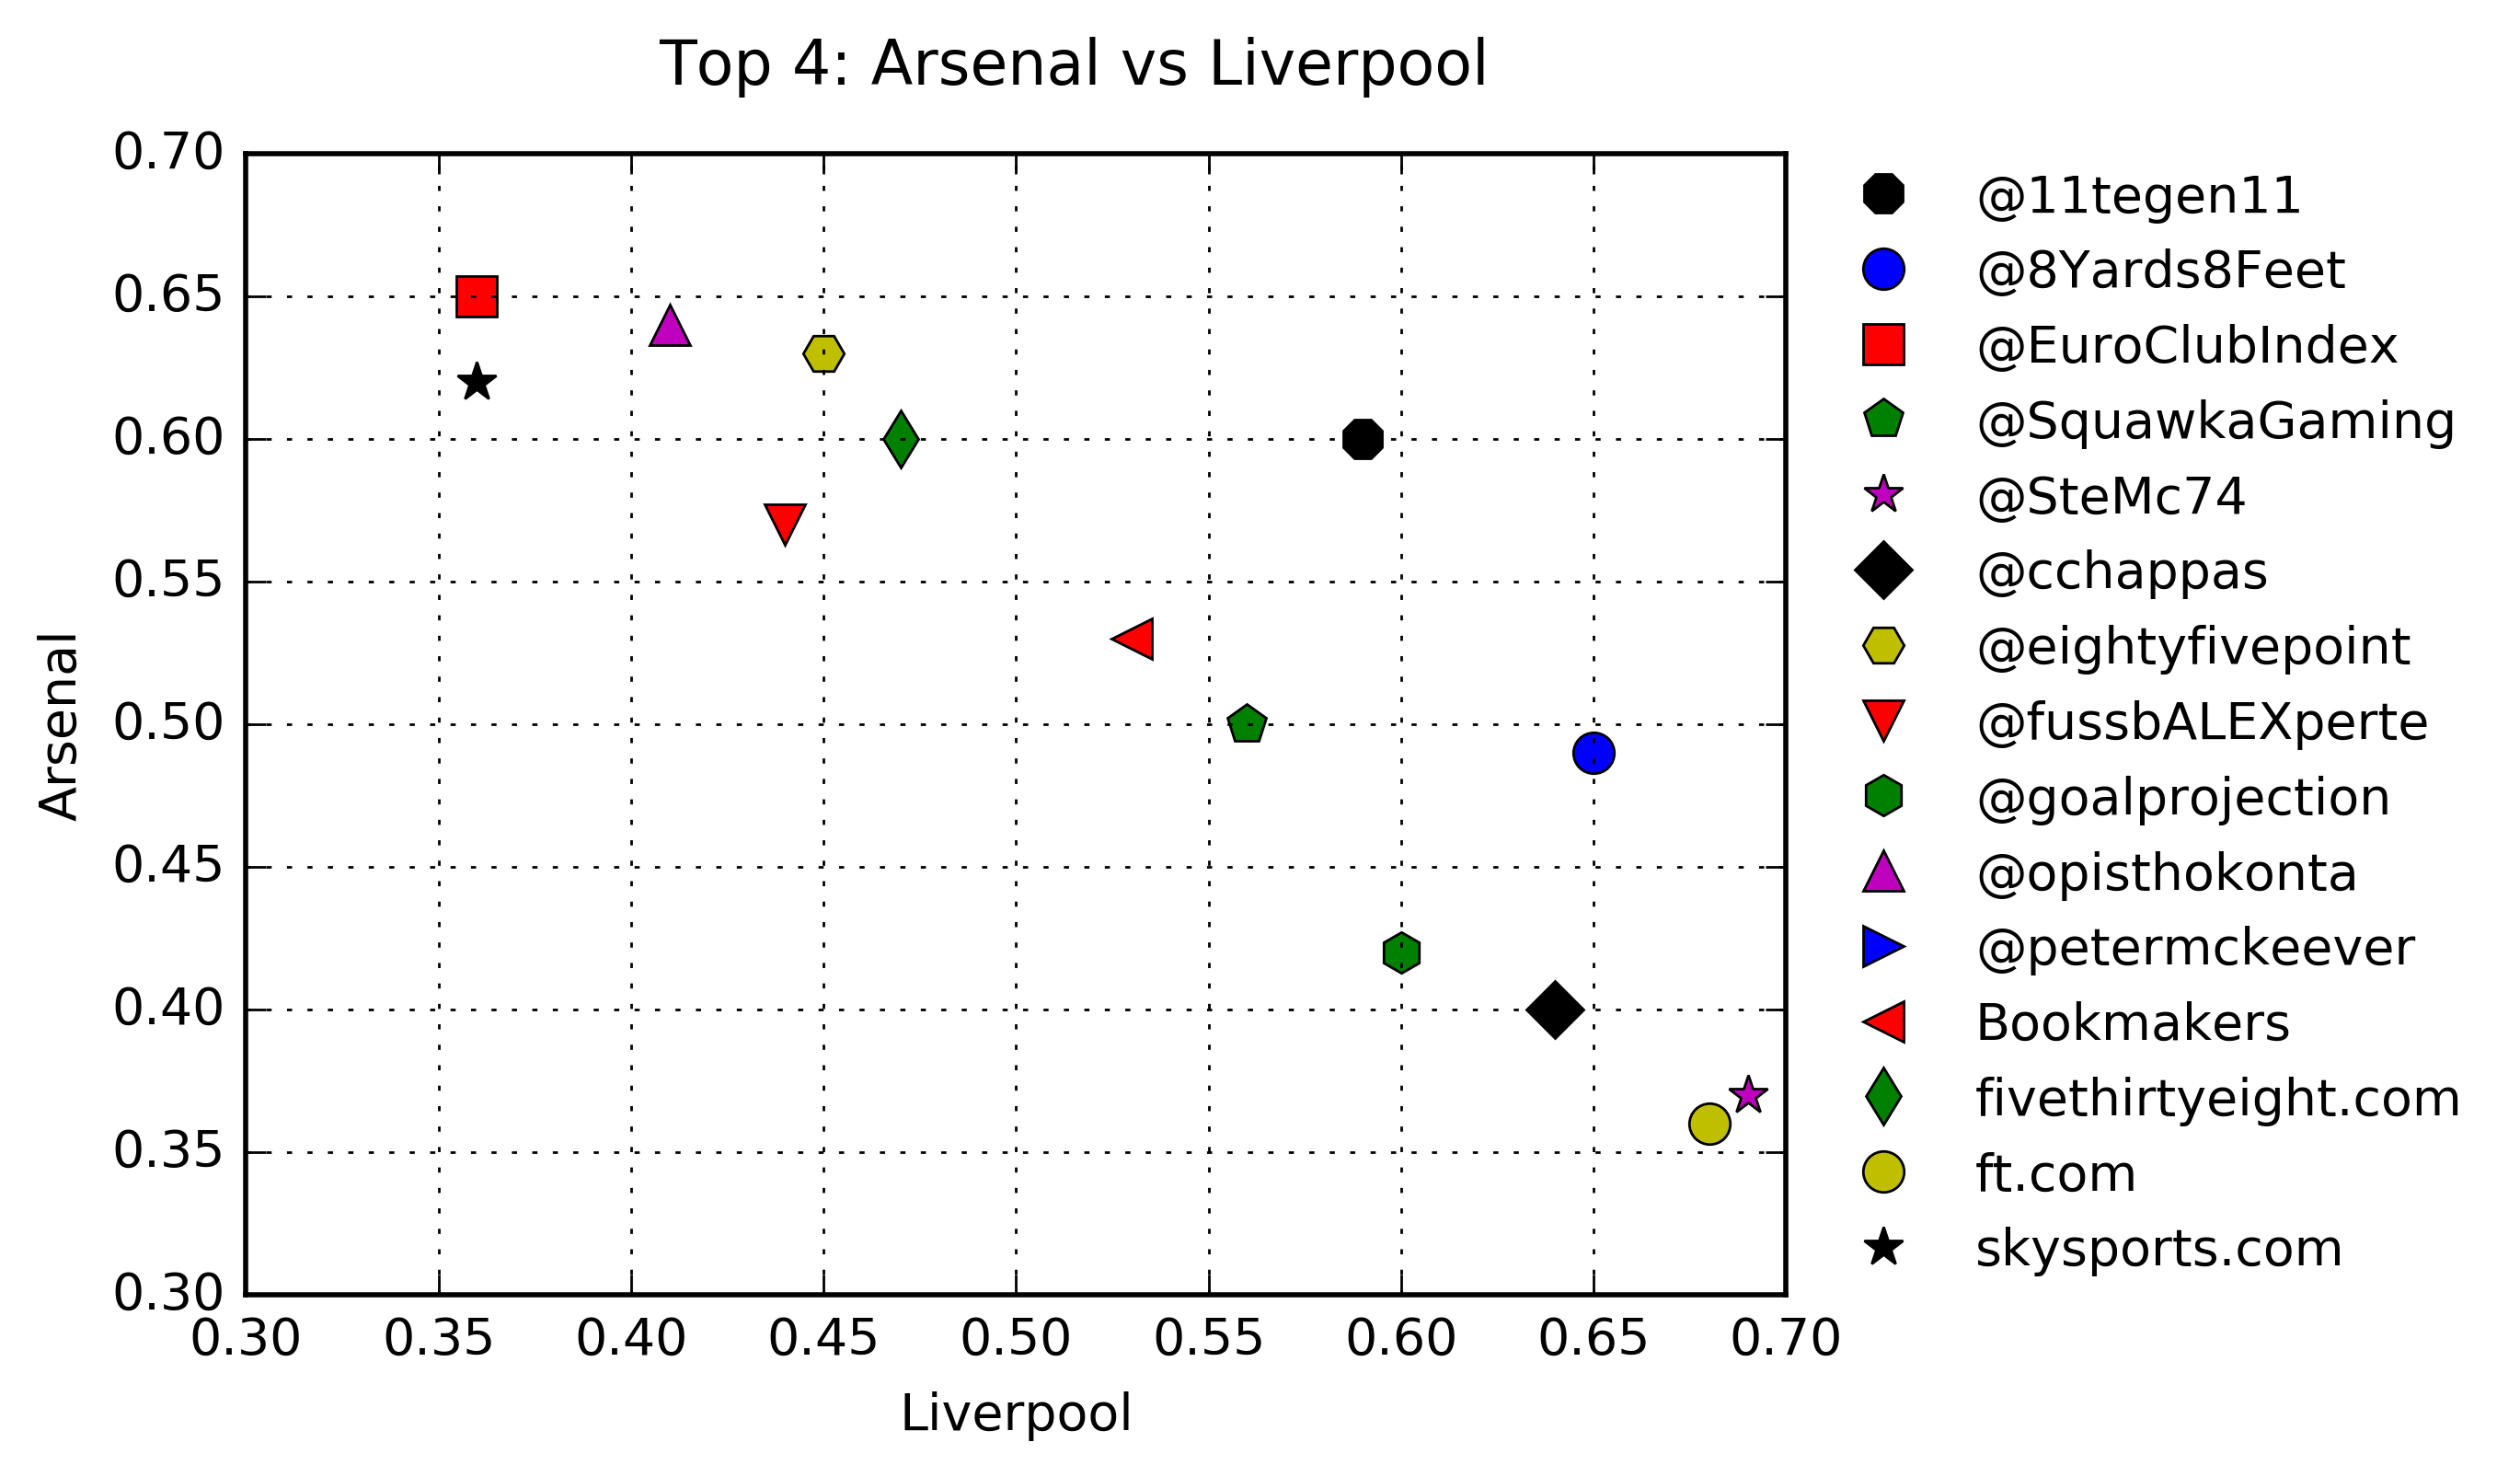 Man United are outsiders, but the consensus forecast still gives them about a 1 in 3 chance of sneaking in. Interestingly, the bookmakers odds – which imply a 44% chance of United finishing the Champions League positions - are way above the other predictions. Perhaps their odds are being moved by heavy betting? The Relegation Candidates
 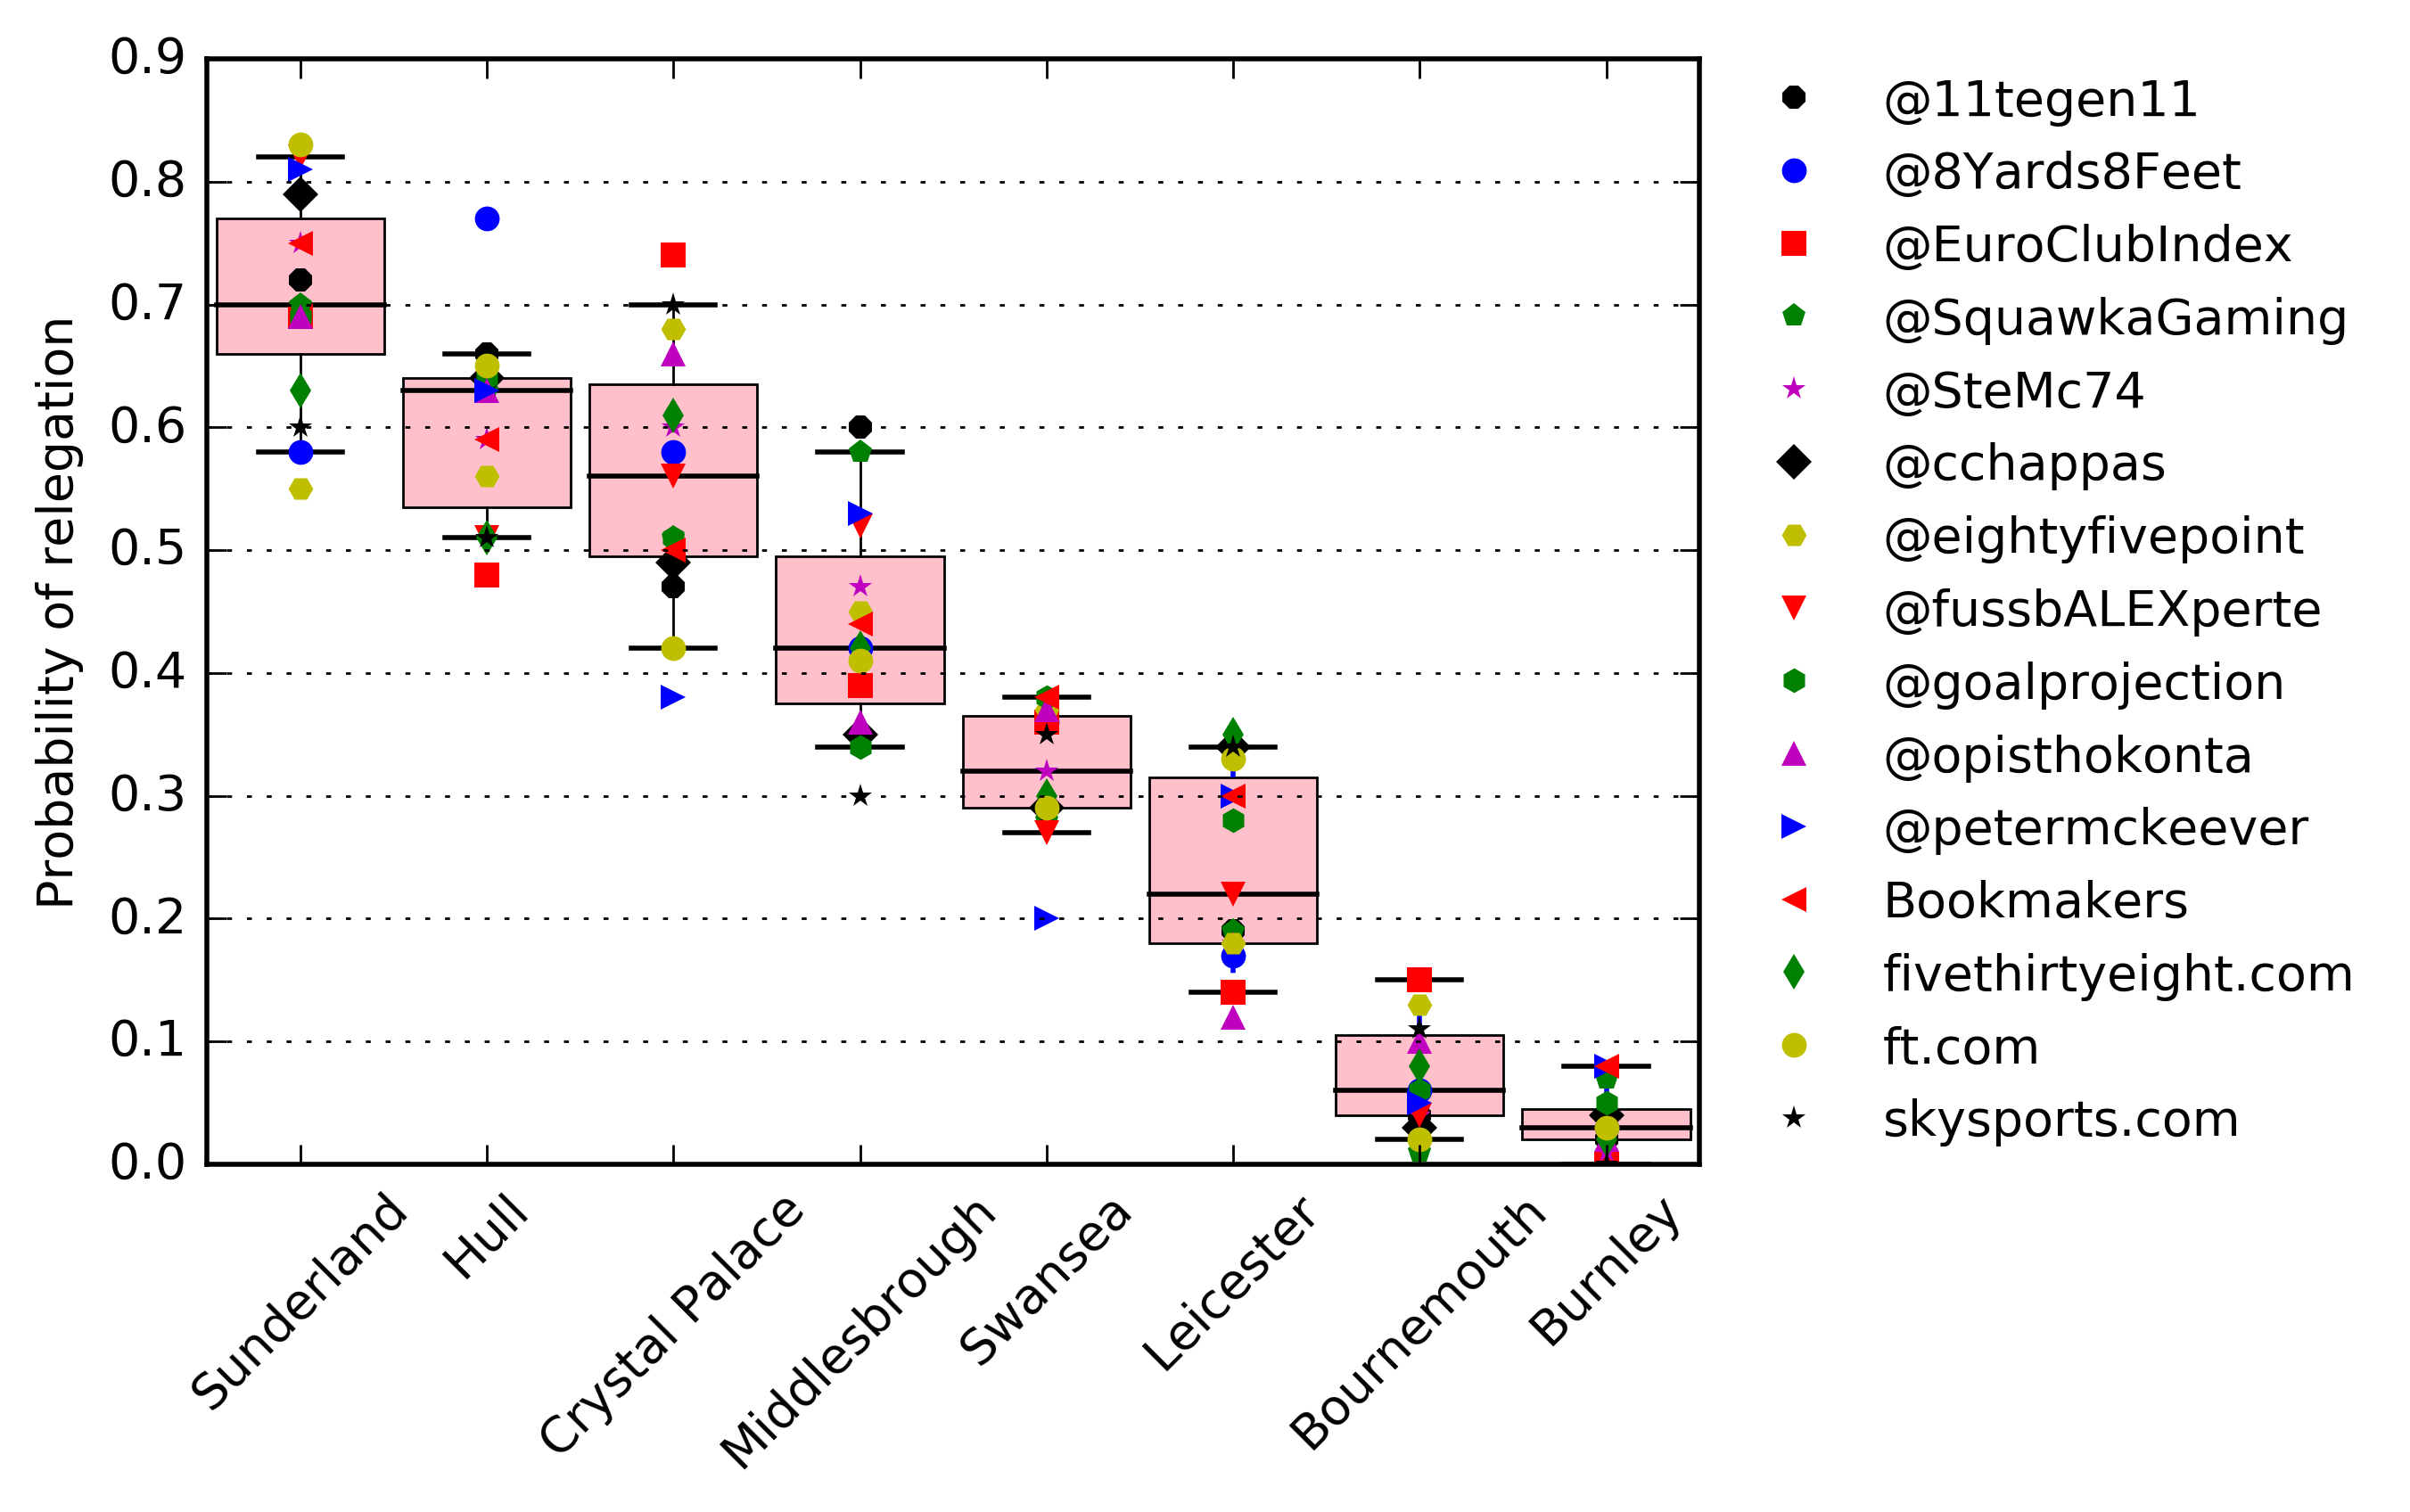 Two weeks ago it looked like Sunderland and Hull were very likely to go down. Since then, the relegation battle has been blown wide open. The first six teams seem set for a nervous run-in and neither Bournemouth nor Burnley will feel safe. The principal candidates for the drop are Sunderland, Hull and Palace, all of whom have a median prediction greater than a 50% chance of relegation. There is clearly a lot of variability in the predictions though, with the Eagles in particular ranging from a 38%-74%. You can certainly envisage any one of them managing to escape. The next three clubs - Middlesbrough, Swansea and Leicester - are all currently level on 21 points, yet the median predictions imply that Middlesbrough (42%) are nearly twice as likely to go down as Leicester (22%). I suspect that this is because some models are still being influenced by last season’s results (for instance, Leicester's forecasts appear to bunch around either 15% or 30%). The amount of weight, or importance, placed on recent results by each model is likely to be a key driver of variation between the predictions. What about <insert team’s name here>? The grid below shows the average probability of every EPL team finishing in each league position. Note that some of the models (such as FiveThirtyEight, Sky Sports and the bookmakers) are excluded from the plot as I wasn’t able to obtain a full probability grid for them. Blank places indicate that the probability of the team finishing in that position is significantly below 1%. An obvious feature is that Everton seem likely to finish in 7th place. The distribution gets very broad for the mid-table teams: Southampton could conceivably finish anywhere between 7th and 18th.
 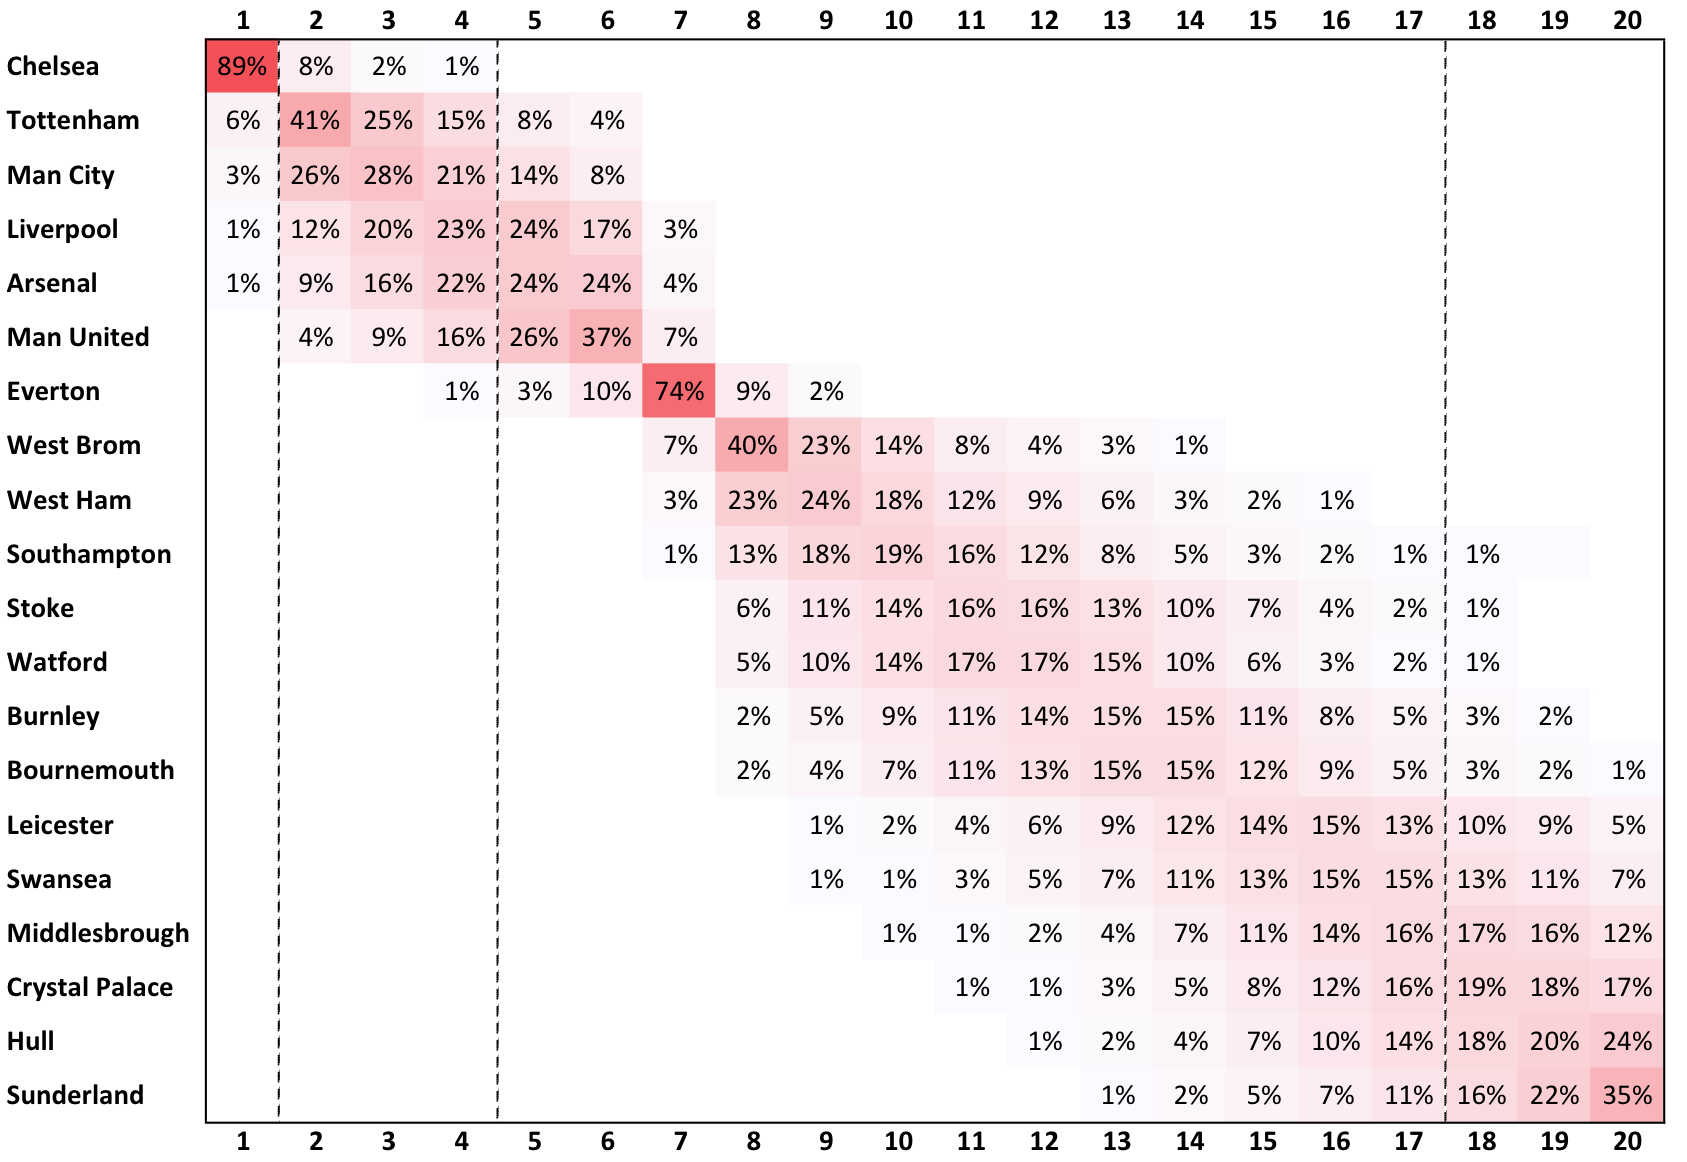 Last year’s predictions. So how did last years’ predictions pan out? Leicester won the league, but the median forecast predicted only a 4% chance of this happening (compared, for example, to a 40% chance that they would finish outside the Champion's League places). However, the top four teams were correctly predicted, with a high probability of finishing there having been assigned to each of Leicester, Arsenal, City and Spurs. Down at the bottom, both Newcastle and Villa were strongly expected to go down and they did. Sunderland were predicted to have only a 15% chance of staying up, yet the Black Cats escaped again. Instead, Norwich went down in their place having been 91% to stay up. Other surprises were Southampton (7 places higher than expected), Swansea (5 higher) and Crystal Palace (down 7). How good were last year’s forecasts, overall? This is a tricky question and requires a technical answer. The specific question we should ask is: how likely was the final outcome (the league table) given the predictions that were made? If it was improbable, you could argue that it happened to be just that – an outlier. However, it could also be evidence that the predictions, and the models underlying them, were not particularly consistent with the final table. We can attempt to answer this question using last season’s prediction grid to calculate something called the log-likelihood function: the sum of the logarithms of the probabilities of each team finishing in their final position. The result you obtain is quite low: simulations indicate that only about 10% of the various outcomes (final rankings) allowed by the predictions would have a lower likelihood. It is certainly not low enough to say that they were bad, it just implies that the final league table was somewhat unlikely given the forecasts. A similar result this time round would provide more evidence that something is missing from the predictions (or perhaps that they are too precise). A final caveat.. Having said that – models are only aware of what you tell them. There are plenty of events – injuries, suspensions, and managerial changes – of which they are blissfully unaware but could play a decisive role in determining the outcome of the season. Identifying what information is relevant – and what is just noise – is probably the biggest challenge in making such predictions. I will continue to collect, compare, combine and publicize forecasts as the season progresses: follow me on twitter (@eightyfivepoint) if you'd like to see how they evolve. (Edited on 10/2/17 to include Sky Sports' predictions)
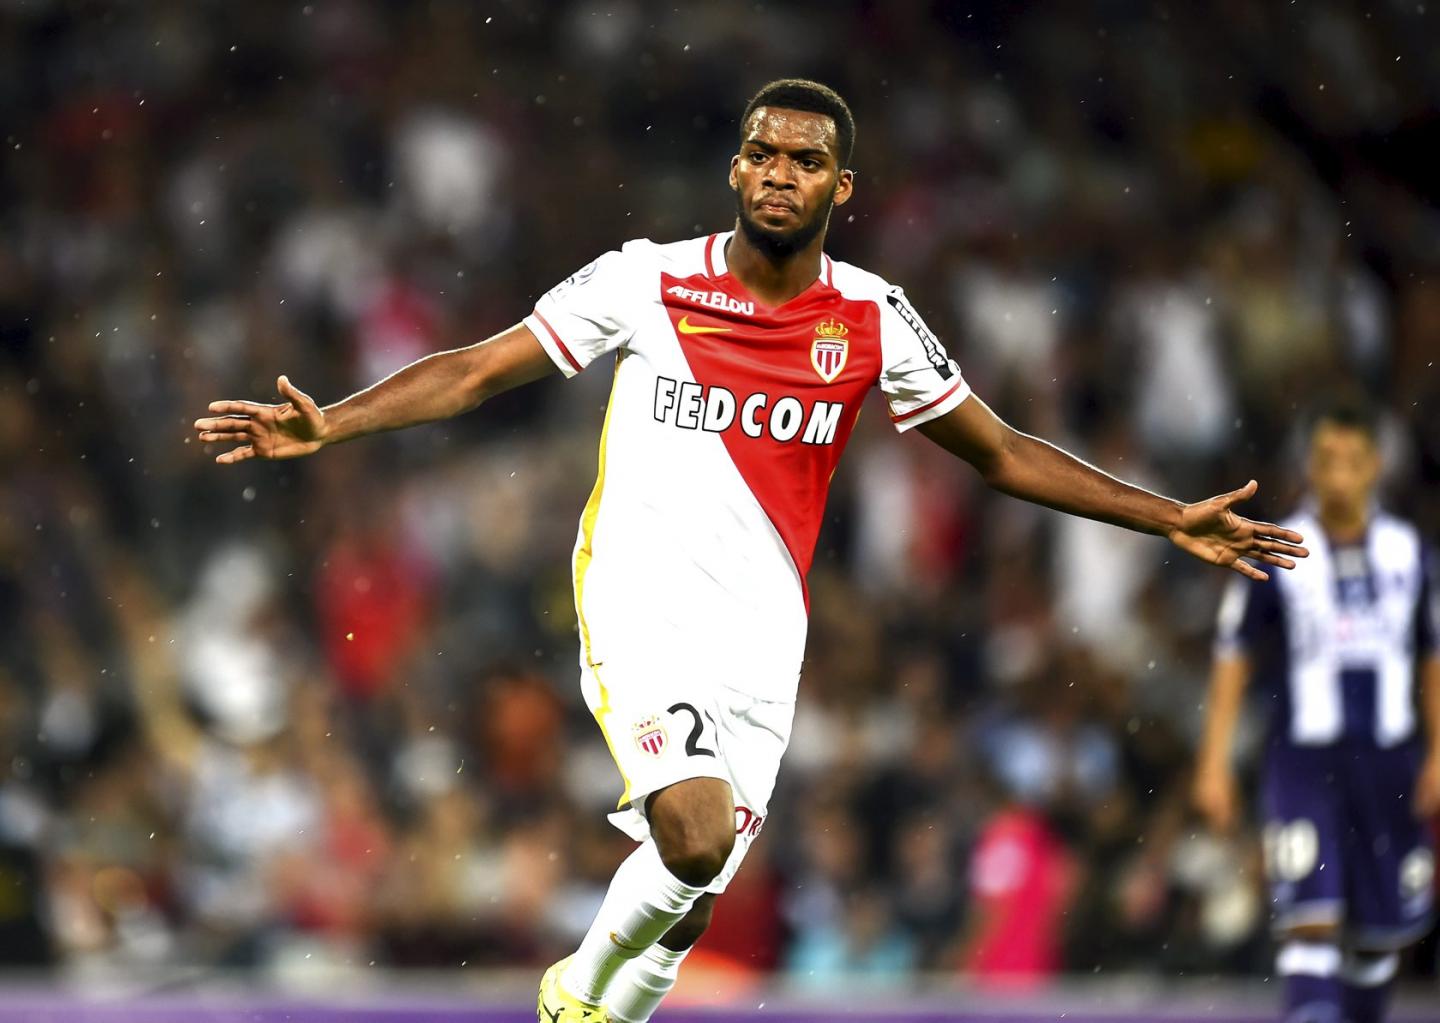
Identifying Ligue 1's Next Big Breakout Talents #2: Thomas Lemar
There have been two different versions of Monaco ever since money was pumped into the club a few years ago: the first iteration was the wheeling dealing one where they tried to outspend PSG, looking to become a continental power in the process behind pseudo global stars. Obviously, this strategy had massive flaws and quickly they reverted to their current iteration which has consisted of of buying young and selling high and mixing that alongside some later peak age players. And for the most part, it’s been a successful reboot. Monaco have been good in two of the last three seasons, highlighted by a Champions League run in 2014-15 and their current domestic title push. Sure, there could be legitimate quibbles about just how good Monaco really are, but they’re clearly the 2nd best team in the suddenly competitive Ligue 1.
One of the guys who symbolizes the new age Monaco project is Thomas Lemar. Bought at only £3M in the summer of 2015, he was part of Monaco’s first attempt at buying a ton of youngsters and hoping a couple of them would hit big. We’ve already profiled him previously on the site as the type of talent that could be had for relatively cheap but those days are probably gone. He first broke onto the scene as part of that weird Caen side that were known for one gear and that was blistering counter attacks, something that suited him well. The first thing you notice with Thomas Lemar is just how shifty the man can be, especially in the middle of the pitch. He doesn’t quite have the top end speed nor the sheer amount of tricks in his repertoire of say Ousmane Dembele, but he can definitely skip past 1 or 2 players with some level of comfort by using his low center of gravity to his advantage. This was evident when he got his opportunity at Caen two years ago and still is now on a Monaco side that play almost diametrically opposite.
With the way Monaco set up in their two striker system, the fullbacks on either side like Benjamin Mendy and Djibril Sidibe occupy the width so it can allow players like him and Bernardo Silva to occupy the half space areas so they have a number of options. When the buildup play begins, the 4-4-2 can suddenly turn into 3-5-2/3-1-4-2 with the two creative engines stationed as nominal midfielders, a back three consisting of the CBs + Fabinho, and the fullbacks basically playing as wingers.
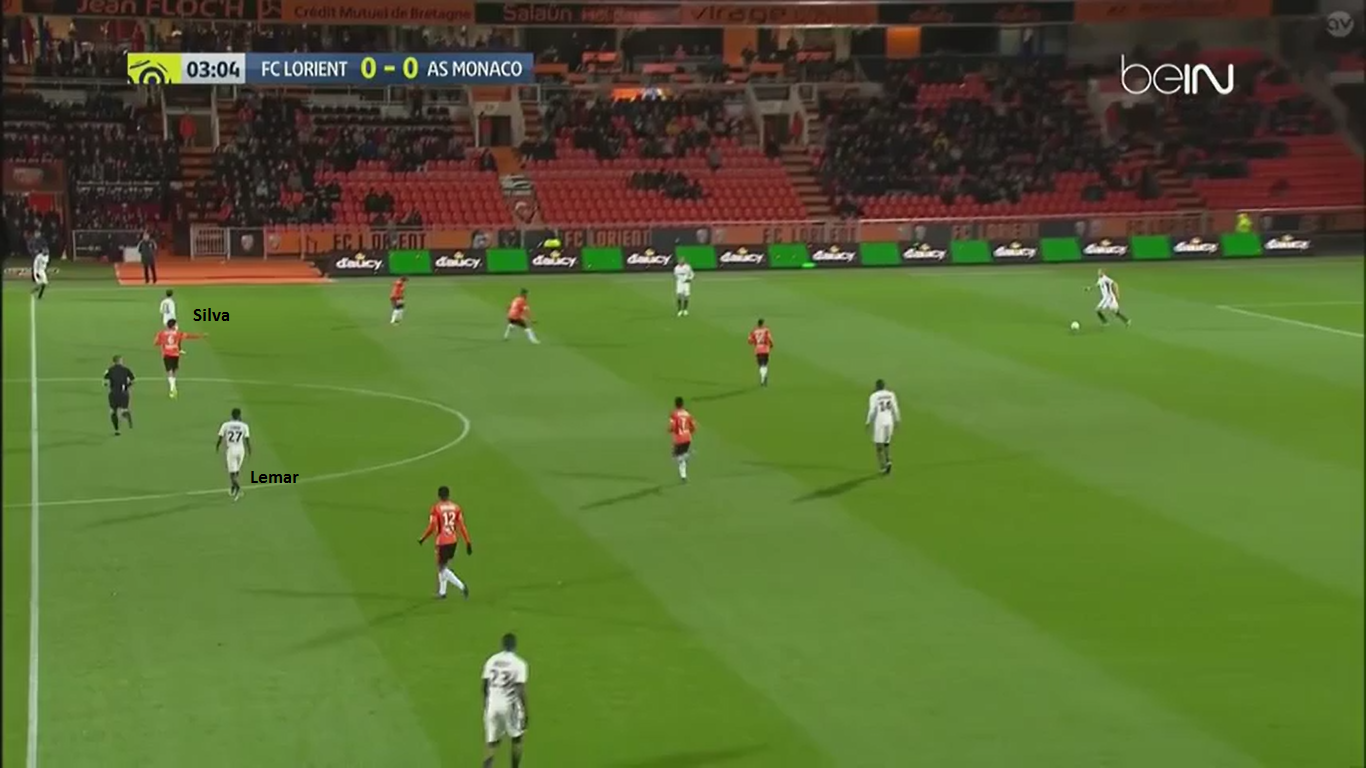
There are multiple ways for players to break defensive lines. Generally, you could classify it through either passing (see: Julian Weigl) or dribbling (see: Mousa Dembele). Lemar is closer to the latter than the former. A lot of times he’ll position himself for a pass in a way that will allow him to gain a head of steam. Often it works because by the end, Monaco can transition to the next stage of their attack.
Where I find Lemar most exciting though is whenever Monaco transition into counter attacks. Because of how central his positioning is, when Monaco want to turn it loose, Lemar can become part of the action. He has the technical ability to make the difficult passes that really open up an unorganized opposition and even when he’s not directly involved, he occupies the correct spaces so that he can receive the ball and keep the counter going.
On a team with pacier strikers, these types of sequences could lead to throughball opportunities which would be an even deadlier asset to Lemar’s game. For a guy who’s first instinct is to dribble, his decision making is decent and he generally knows when he has to end his dribbling sequences and pass it to a nearby teammate. If he could add occasional throughballs to his game it would raise the ceiling on how good a prospect he is because it makes him even more versatile as an option, and it compliments his ability to connect on crosses and long balls from deeper areas.
You add all of this together alongside capable set piece abilities and what you have is an interesting package. He’s got the speed and acceleration of your typical winger, but his dribbling works best in the middle of the park, which is something you expect more so from central midfielders. His statistical outputs mirror this as it portrays an unorthodox talent:
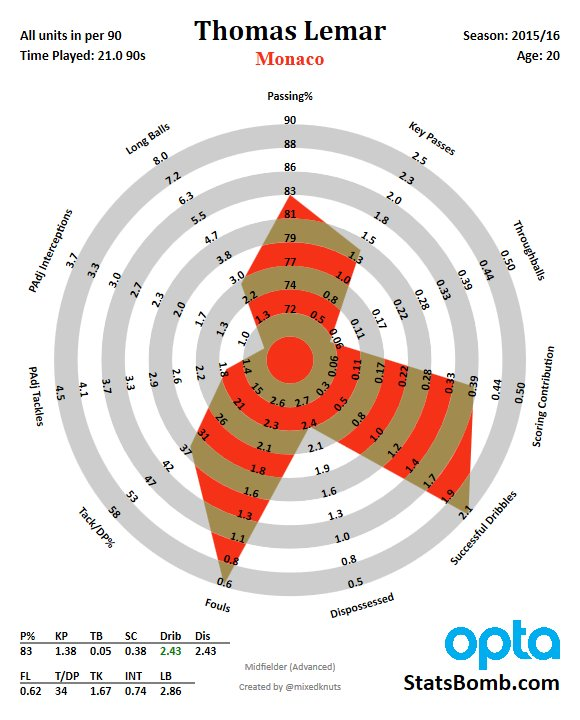
One of the worries with Lemar is he’s just not anywhere close to a potent shot taker. It’d be one thing if he was such a high-level creator that he was tipping the scales massively in his favor regardless, but he’s not quite that. To this point he’s been fine as a playmaker and that’s been the case since his days at Caen, but if you top out as something resembling a solid creator with middling shot numbers, there’s probably a ceiling to how good you’ll as a player. A team thinking of buying Lemar in the near future with much more information to go through has to think critically of this. If you’re expecting him to be the type of attacking player to regularly contribute towards 15-20 goals, at this stage of his development I would be very hesitant as he’s over shooting all his expected goal numbers (both shooting and creating) by nearly double. However if you imagine him as someone who can contribute towards say ten to twelve goals but be super important in being able to create transition opportunities or simply moving the chains from the defensive third to the final third through his dribbling and passing, then that’s a different case and he could definitely perform that type of role.
Player development a lot of times isn’t a linear progression when you go from young talent -> good -> very good and perhaps I’m underrating what 24-year-old Lemar will be. He is still an intriguing prospect, quite young and doesn’t turn 22 until November. While players on average peak around their mid 20s, this is by no means fixed. All we can control is the process and make educated guesses going forward, and to this point, I’m just not willing to put him in the realm of former Ligue 1 prospects like Dembele, Anthony Martial and pre-ACL tear Nabil Fekir where as a big club you would not think twice about splurging money for potentially world class players. He rarely gets himself into opportunities that he can shoot, and when he does it’s not like the shot quality is anything to boast about. In a more attacking role, does he grow into that or will he long term be more of a cog behind more natural attackers?
Don’t get me wrong, Lemar will make Monaco a huge profit when he inevitably moves on from France. His ability to drive his team into the final third with his dribbling is an asset, he has the athletic ability to survive in a higher-octane league, he’s got a wicked left foot for set pieces/crosses and he’s a capable passer. He seems an interesting fit for teams that have somewhat unconventional ways of creating attacks, especially ones that like to have a wide player that can drive play through the middle. In many ways, the variance that’s driving his high goal and assist per90 clip obscures what makes Thomas Lemar a genuine prospect, and it will be in the best interest of his next club to sort out that noise from reality.
Premier League Mega Round Up: Top Six Slowdown? Leicester. West Ham. Burnley
Top six slowdown? The January malaise that has struck towards the top of the table has taken subtle but different form for each club. What? Malaise for the top clubs? Well, perhaps except Tottenham and it might not even matter for Chelsea. Let me explain. Earlier in the season the league had a very clear structure. The big six were annihilating the rest of the league while the bottom sides were posting truly historically dreadful shot numbers (in a variety of forms) and suffering for it (Hull, Sunderland, Swansea) or unexpectedly prospering (Burnley). More recently, results have slowed up significantly for Liverpool and slightly for Arsenal, while Manchester City have been erratic and Manchester United regularly frustrated. Chelsea have come down from their ridiculous peak that involved winning every game, while Tottenham have been pretty consistent. At the other end of the table, there have been improvements. The emblem for this change is obviously Hull 2 -0 Liverpool, but that feels like the first crocus of spring; finally we can see the evidence but the bulbs have been in the ground for a while. To describe, in the first twelve games of the season Hull, Sunderland and Burnley were all taking fewer than 33% of the shots in their games; really poor. The second batch of 12 games has seen the worst three teams via this measure taking between 37 and 41% of the shots and Stoke and Middlesbrough have replaced Burnley and Hull in the bottom tier. The bad teams are no longer bottoming out. Now the top teams are still chugging along at a decent clip and winning a fair share of their games against the rest of the league but changes are afoot. Liverpool, Manchester City and Chelsea were the top three shot teams in the league in games one to twelve. All were taking 16-plus per game with Liverpool at nearly 19 per game. Since then Manchester City's numbers have held up fine but Liverpool have dropped to 15.4 per game in games 13 to 24 and Chelsea are right down at twelve, with five games against direct rivals having some impact. All the while, the three teams’ defences have remained stoutly resistant towards opposition shot volume. None of them have conceded an average of more than an extremely strong eight shots per game through this recent period, but the detail here is where they differ: Liverpool were able to ride defensive frailty in the autumn while their attack was crushingly strong, but the shots they concede are rated as the third easiest in the league; they allow few but good chances. When the attack dropped off a little, the lack of defensive resolve has severely hampered their effectiveness in securing results. Manchester City have suffered similarly but their porousness has looked more a combination of a dismal run of variance compounded by their invisible goalkeeper, although the shots they concede are very average, a contrast to those that Guardiola’s former teams have allowed; Bayern regularly allowed few and comparatively difficult chances. Chelsea are the one team of the three that appear to have the defensive end locked up; low shots against, low quality of shots against and a small positive variance. They have also been scoring their own reduced shots at a league leading rate, which sure helps. Indeed their whole set-up is incredibly reminiscent of 2014-15, where they rode the numbers somewhat through an extremely hot autumn. Fuelled then by Diego Costa and Cesc Fabregas they were latterly shepherded home by Eden Hazard leading some cute but tight games as they failed to hit the same attacking heights beyond Christmas as prior. Meanwhile all the other contenders fell away and with a smart lead secured, they came home relatively unchallenged. This time, Chelsea have the best defence in the league and it is that which has provided the bedrock that their organised and talented attackers have been able to eke further points from. Antonio Conte certainly deserves his credit. He has tuned his team in his image and brought the exact defensive resilience that built his run of titles at Juventus while creating a scenario that gives Chelsea a ton of breathing space from which they should be able to coast home. In a way, the attack, though quieter, hasn't needed to be as fired up as earlier in the season. Along the way, Arsenal have moved slightly in the opposite direction. The early warning signs this year were a lack of shots and their average expected goals per shot were down from last year’s significant peak. Slowly, they’ve found a bit of extra volume (16 shots per game in the middle 12 matches) and slightly raised their total expected goal rate and per shot expectation. Of course this has coincided with a run of 7-1-4 which feels all too familiar, has landed them on the edge of the top four and is partly caused by them matching an expectation of goals against that only ranks 8th during this middle period. Also factors during games 13-24: while they are conceding just ten shots per game, the 41% of them that are landing on target is league high and on average they are from closer than any other team in the league, very much at odds with last season in which their shots against distance was league best. Tottenham have risen to be the highest volume shooters in this middle third of the season but are slightly hampered by the majority of them being relatively low quality. They take under 40% of their shots from inside 18 metres which is the lowest total of any team in the big five European leagues by more than 5%, but that they take so many shots means that they are powering an acceptable expected goal rate. It’s not a study in efficiency but for now it’s enabling them to keep well in the mix. A prevailing narrative that has built up justifiably from the heavy skew towards long range shots is that Tottenham are bad at them. When a team is crushing long range efforts and netting them with some regularity, there aren't many complaints about players attempting them, like, say last season when Tottenham scored ten, at a rate that matched expectation. When a team has scored just one goal all year from long range despite taking a ton of shots--enough say for a reasonable expectation to be seven or eight--the fans get a little riled, despite it largely being one of those things. That's Tottenham this year. Defensively, they ran hot early on but have suppressed shots in recent weeks impressively, all the way down to fewer than eight per game. The big warning for them here is exemplified by the 0-0 draw at Sunderland, the type of result that they have minimised this season but that can be liable when their attack lacks decisive incision and they will also surely start conceding more regularly from open play at some point, seven all year is remarkably low. Manchester United have also managed to maintain extremely solid metrics. Their issue is results, as they are have bounced through a series of headscratching draws against weaker opposition. Across the whole season, they have drawn six matches (five at home, one away including both games against Stoke) that they had significant and clear shooting advantages in with regard volume and quality. That's another vote for "shit happens" but has meant that although their unbeaten run has been noted, Mourinho's genuine progress and solidity with his team is currently looking like it might be for naught, as they sit on the fringe of the Champions League places. Arsenal and Liverpool should probably be most cautious of the strength of their old rivals, though a couple of damaging results for any of Chelsea's chasers will quickly turn the top four probabilities upside down. The bigger picture around this is that it is quite possible that the extremely strong early form shown by the big six, form that was reflected both in metrics and point gathering--coupled with the early ineptitude of the league’s worst teams for both measures--was a kind of bubble that has slightly eased over time. The lack of upset victories from smaller teams was unusual, as was the lack of a team or two from the middle classes skewing positively. Slowly, as attrition affects the league and our old friend random variance meanders along, we’re seeing something that looks a little more normal. The top six don’t usually crush the rest of the league quite as convincingly as they did through the first half of 2016-17, and maybe the second half of the season will see more of these less predicted results. Leicester In this week last year I wrote about Leicester getting a few breaks. At that point, Robert Huth had just scored a brace in a 3-1 victory against Manchester City to add to his earlier late winner at Tottenham. We may now be living in strange times, but the seeds were sown some way back. A year on, Huth's most recent event was less pleasant for him and involved being planted 40 yards up the pitch by Henrikh Mkhitaryan en route to the Armenian's opening goal as Manchester United routinely brushed aside the Champions. I would not be surprised if Leicester's groundsman has been instructed to tend Huth in his new location, to add water, a little plant food, in the hope that he will flower come the spring and bring back beauty in place of the ugliness that currently surrounds his team.  At this point last season they had converted over 14% of their shots, enough to stick them in the top five teams this decade. By season's end it had dropped back to 13% and their defence had secured the dough but that understandable slight drop off was followed by a further move in the season's opening 12 games down to 11%--still above average--while games 13 to 24 have seen the wheels fall right off and their all shot conversion is down to 7% and since the Manchester City win, just 3.1% over nine games. A small irony can be noted here considering a comparable weird freak of variance allowed them to concede just 4.2% of their opponents shots in the second half of last season as they waltzed their way to the title. Two huge non-sustainable skews, one defensive and positive, one attacking and negative and each pointing Leicester at the opposing edges of the league table. Last year they ended up being a 50% shots team, this year it's more like 42% but the skews that are killing them right now are in finishing with their own drying up and their opposition's cantering along happily. That recipe will damage a team because in many circumstances, they won't be doing all that much different to before, when it was working out and it's hard to remedy a problem when it's concealed to some degree in uncontrollable and dare I say it, luck related factors. Jamie Vardy and Riyad Mahrez combined to score 32 non penalty goals from an expectation of around 24 last season and added in nine penalties between them. This season they have seven between them at a rate that matches expectation and just two penalties. The Eden Hazard/Mahrez body swap has expired. The N'Golo Kante factor has been repeatedly cited as a driver behind the decline of Leicester and return of Chelsea to form. That's too simplistic for me. Though Kante is clearly excellent, no one player has the ability to drive the extenuating circumstances that have contributed to each team's trajectory. Chelsea reorganised an already very strong squad that massively underachieved last year and always had the potential to regroup into a contending side, while Leicester were inevitably going to find themselves less successful. Talk of regression as a single factor in Leicester's decline misses that they have managed to drift past what might be considered a norm for the team. Usually you would look at this team and say they have enough about them to scrabble away from trouble and this was a blip but 14 games remain and that is a short run. An unfathomable bad run could easily stretch out til season's end and if they don't start finding the net soon, the resemblance to what they contrived to do to the opposition at the back end of last season will become ever more pronounced. Could they get relegated? Now that would be unlucky. West Ham West Ham's dramas this season have been twofold. Latterly the Dimitri Payet situation after initially walking into an odd set of shooting numbers across the opening section of the season. They were taking 53% of the shots at week twelve but just 35% of the shots on target. That's weird. They were also scoring just 8% of their own shots and conceding 14% of the oppositions. These ingredients meant that they didn't win many games (three) and found themselves in a lowly position in the table (17th). This was a lull akin to that which Leicester are now languishing within. The run of games 13 to 24 has found the team taking just 46% of the shots but now 45% of the shots on target, a far more normal distribution. Due to the skew at the top, that seemingly sub par figure is enough to rank 10th and their shot conversions have flipped, they are now converting at a rich 13% and conceding at a still-not-great 11%, but it's been enough to right the ship and helpfully offers a neat counterpoint to the often erroneous "one player can affect results" narrative. Payet was their attack--no team relied more on a single player to create chances than West Ham--but his departure hasn't hampered their progress. The likelihood was that some of these numbers would shake out and they would find a touch of "form" and climb the table, and indeed they have. Burnley Mystery team Burnley have repeatedly defied terrible metrics and a non-existent away record to land themselves safely in mid-table. Expected goals looks at their defence and scratches its head. They've conceded about three quarters of the goals expected and theories abound. Does their deep defense stop the opposition? (maybe?) Are they blocking heavily and above expectation? (Yes, to a degree.) Is this enough to account for ten to twelve goals? (Probably not.) What about their attack? After all they have had to score goals to win nine from thirteen at home. Straight away one stat leaps off the page: Burnley have scored nine goals from over 18 metres or more in 24 games, including seven classed as outside the box. In itself that's not remarkable, but if we recall that Burnley don't shoot much and started the season with terrible shot numbers it starts to raise an eyebrow. If we look at a goal expectation for these shots it comes out around four and on a per shot basis, they are scoring from range at a rate over expectation higher than any team in the Premier League this decade. If I tell you Liverpool and Manchester City 2013-14 are ranked two and three in this list, it becomes clear what kind of attacking overperformance this is: spectacular and unsustainable. This matters not for this season but with eight of those nine goals coming at home and contributing to one goal victories over Crystal Palace, Bournemouth and Southampton as well as the 2-0 win over Liverpool, their points value becomes clear. It won't be something they can rely on next season. _______________________________________ Thanks for reading Not done one of these for a while so it ended up long! @jair1970
Finding the Best Pass In the Bundesliga
What is the best pass in the Bundesliga? A question that interests a good 40% of us. A Hummels throughball, a Keita lock pick through traffic, a Stafylidis 40 yard cross? Two of them are good options but I wanted to be a little more rigorous to find out. When you look at the best, you have to look at the worst and we will do that as well. I've been nosing around with different things to do with pass clustering the last few pieces and will continue to do more in the future, this is part of a loosely organized, ongoing series.
Process
Every Bundesliga pass was clustered into one of 100 types based on start and end position. I then looked at the average completion % on each type of pass across the league and compared each players rates to the league average to see over or under-performance.
Here are the 100 types
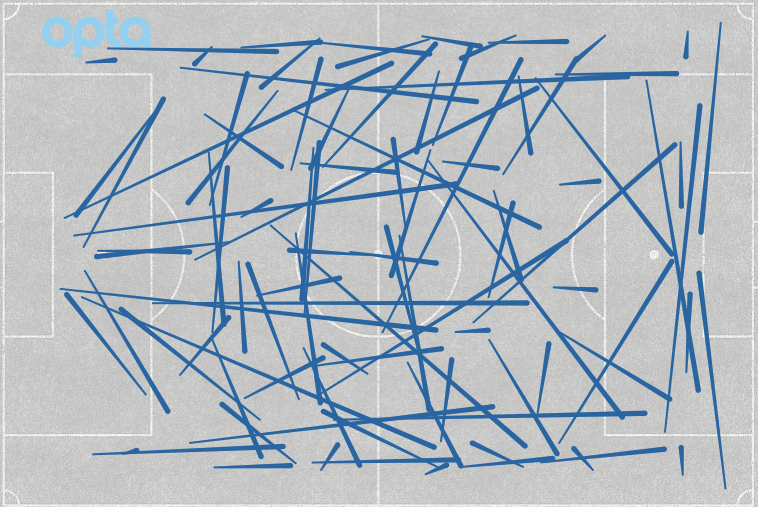
The Best
First, let's look at the "best" pass. How we define best here is most completions above expected. Expected is simply the league average completion % on that type of pass multiplied by the number of times that pass has been played. Our champion is Julian Weigl in the attacking third switching the ball from right to left in the center of the pitch.
Here is the type
and here are all of Weigl's passes of that type.
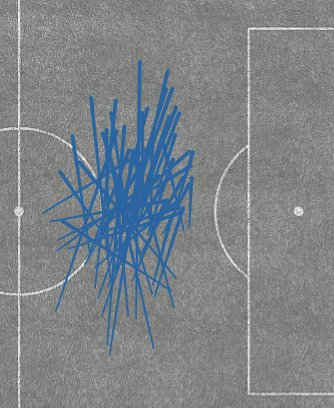
As you can see, even 100 types of passes leaves lots of variation and that's without any complicating variables like head vs foot, dominant foot or not, what happened on previous pass, pace of possession, etc.
League-wide this pass is completed at a 77% rate and Weigl has made 52 of these passes without having a single incompletion, so he is 12 completions above expected just on this pass alone. The Bayern pair of Thiago and Alonso are both around 90% and Castro and Aranguiz are in the mid-80s but Weigl stands alone here. Just on this type of pass alone, Dortmund have kept the ball 12 times more than expected on Weigl passes. Let's take a look at a sampling of those passes from 3 games: Schalke, Hertha, and Freiburg:
What can we learn from this clip? Well you might have a headache from your slowly increasing squinting but I can promise those yellow blobs at the end were Dortmund players. We can also see that the credit can't go solely to Julian Weigl, but to Dortmund's Julian Weigl working within the team's system. Several of the passes come after pullbacks from the wing have opened up a bit of space. Team context is always incredibly important looking at anything like this, which the video helps to show. Several of Weigl's plays take out defenders and advance the ball, so this type of pass feels like a great fit of a player in a system that rewards his specific skills in this part of the pitch. He gets rhythm in a way that keeps the Dortmund attack moving.
Other passes that grade in the top 5 are unsurprisingly lots of Bayern players: David Alaba (moving the ball vertically down the left touchline toward in the final third) along with Hummels and Martinez (moving the ball vertically to midfield). The weird fifth member is Paul Verhaegh dinking the ball back towards the center in Augsburg's own half, this comes from incredible volume to rack up more completions than expected: he has played 71 of those types of passes while no other player in the league has more than 43.
The Worst
This is more cruelly enjoyable. Lots of wide players are near the top of this category: Dong-Won Ji in the opposition half for Augsburg plus Stafylidis and Douglas Santos in their own half struggling to get it out. Alexander Schwolow, Freiburg's keeper, is completing long balls to the right side at just a measly 28% clip. This compares poorly to his fellow high-volume long ballers in Hitz (49%) and Gulasci (52%). None take the top spot however, though Santos has a great glimpse of it if he just looks up. That top spot is reserved for Filip Kostic and that pass looks like a harmless move in from the left wing toward the box, right?
This pass is completed 65% of the time, all of the top 25 most common passers are at least 44% on this pass type, except for our man.
A glimpse at 2 games worth of these passes shows us the problem immediately:
He's not trying to pass the ball to someone near the edge of the box but is isolated and trying to hit long crosses only to smash them directly into defenders standing 3 feet away. Hamburg are losing the ball twice a game on these types of passes from Kostic. It's not like he's amazing when the ball gets past the guy who is literally standing right there: he's hitting about league-average rates on the crosses that actually get into the box. Several of the plays in the video he starts much closer to the middle and dribbles out as far toward the edge of the pitch as he can, making the pass as difficult as possible and seems to just ignore the first man. If Kostic never tried these passes or the moves to get him into position to make these passes, Hamburg would almost certainly be better off. I'd encourage him to dribble inside or pass before he gets to the edge of box extended line, not much good happens when he dribbles wide and deep.
Creating Chances
I will keep this section short as the sample sizes get incredibly small, but there are some interesting bits. Start with Bayern vs Dortmund inside the box on the right side.
Müller and Robben are Bayern's men at work there while Dembélé and Pulisic run the show for Dortmund. There are yawning differences in results: Bayern's duo are 21/50 with 9 chances created
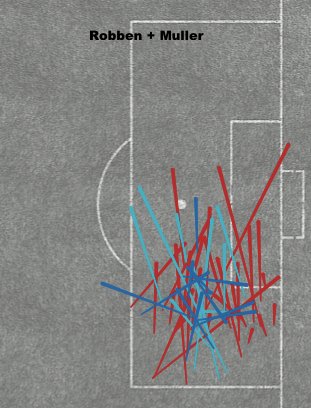
while Dortmund's are 5/43 with 1 chance created.
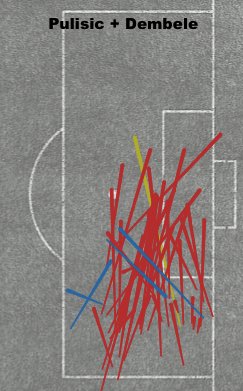
The average pass from this area creates a chance 1 in 5 times so Dortmund are either incredibly unlucky or have some limitation keeping them from taking advantage of getting into great position. If Dembélé just created chances at a league average rate from this passing position, he'd have 5 more. No other player's has a type of pass with more of an "underperformance" if you excuse the sloppy language. Packed boxes might explain some of it, but generally Dortmund racks up elite completion %'s inside the opposition box. This is a weird one, maybe the exuberance of youth is at fault: neither Dembélé or Pulisic was alive when Bill Clinton was sworn into office. Pokemon the TV show aired before either was born, Tony Blair was elected as Ousmane was still inside his mother. Neither were alive to see Deep Blue beat Garry Kasparov, and neither have been alive at a time when Hong Kong was under British control. Anyway, we can wait a couple years until they can grab a beer together in Hershey, PA and re-check this but for now we move on.
America's First At Creating Chances Above Expectation?
Where Pulisic is on one side of the spectrum on this type of pass, Timmy Chandler is on the other. Chandler's high key pass total is due to his "over performance" on these types of passes. Where Dembélé and Pulisic have created 1 chance in 43, Timmy is at 7 chances in 15 passes. Under the new Bruce Arena call-up system, that might overcome being born outside of the country, you never know.
All-In With Max The standout at creating more chances than expected is quite a tasty result. Max Kruse hasn't even played 700 minutes yet for Bremen but has been fantastic for their attack. With this type of pass in particular, he's been nearly impossibly good:
On a pass that only about 1 in 8 turn into chances, Kruse has created 5 chances from 6 passes. Only Keita and Dembélé have created more chances on this type of pass and it took them 31 chances to get 6 and 7. Hakan Calhonoglu (RIP) hasn't created a chance yet on 23 of these passes.
Team-wise there is some serious variation on plenty of types of passes. The type we talked Kruse on, Gladbach have created 6 more chances on 62 fewer passes than Leverkusen.
My favorite team-wide stat I've found so far is Ingolstadt have played 107 of these types of passes, 31 more than any other team.
There are lots of bits to investigate with this type of clustering process and lots of ways to improve it. One way that is doable for some but not quite yet for me that stood out watching the Weigl video was when in a specific possession a pass comes and/or what happened the pass before. If you are passing after a cutback from your right back, your forward passing % presumably will be much higher than if you are Yusuf Poulsen and just won an aerial duel on a Gulasci long ball. Lots of places to go, but hopefully you enjoyed this place we went.
StatsBomb Transfer Pod: January Window Wrap

[soundcloud url="https://api.soundcloud.com/tracks/305933912" params="auto_play=false&hide_related=false&show_comments=true&show_user=true&show_reposts=false&visual=true" width="100%" height="450" iframe="true" /] Ted Knutson and James Yorke look at the transfer stories and moves around this January Downloadable on the soundcloud link and also available on iTunes, subscribe HERE If you like, we'd love it if you shared it. Thanks!