
Earlier today, Ben and I drafted franchises of Premier League players, based in part of performances thus far this year, and in part on building something that would be good going forward. This entry kind of takes the place of our podcast this time around and gives us a good excuse to talk about some of the better players in the PL this season as we head into the holiday schedule. It was done as part of a Google Hangout, which means when we reference comments, there were chatters talking to us live while we were doing the draft. It's possibly a little rough right now, but we might try a few more of these throughout the course of the season and include additional people, since it's a bit easier to do with modern technology than a straight podcast. Happy Holidays! [youtube id="I6uk-_kiT7k" width="633" height="356"]
Month: December 2013
Can You Get Away With a Foul Early in the Match?
Referees are sometimes lauded for keeping the cards in their pockets for as long as possible, but are players taking advantage of this? This graph may raise a few eyebrows: 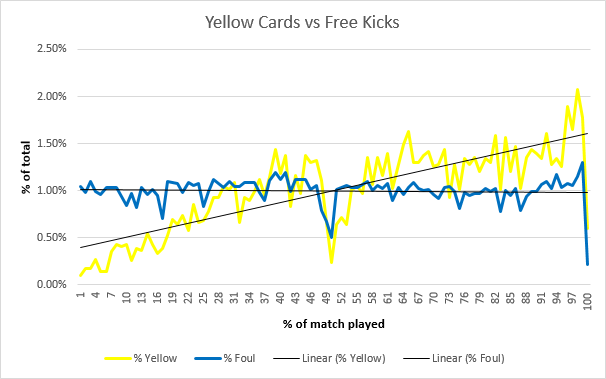 While free kicks are spread out evenly over the duration of the match, the amount of yellow cards increases steadily as the game goes on. This suggests that the chance of getting a card when you concede a free kick increases as well. Unless fouls are in fact steadily getting more reckless, it doesn't seem like they are judged entirely on their own merits. Of course there are different reasons for a referee to give a free kick or yellow card. I've looked at minute-by-minute data of every Premier League match since 2009/2010 from whoscored.com, which provides a description along with every free kick or yellow card event. The distinctions made in these descriptions are not terribly specific, but it goes as long way. Let's look at the classification of yellow cards:
 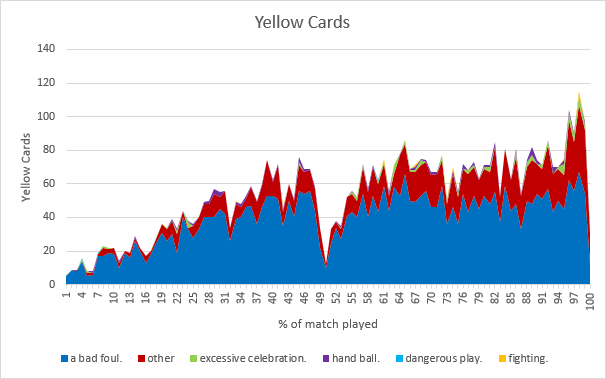 You can see the same increase in cards as in the previous graph, but it's clear that the composition changes over time. The share of yellow cards for unspecified reasons ("other") increases from almost non-existent to close to half of all cards. I can only assume that these are mostly for things like time-wasting, kicking the ball away, dissent, etc., which become more of an issue later in the match. For the most part this explains the increase in the second half, but it still doesn't explain what happens in the first. A possible answer can be found in the official rules, which state that "persistent infringement of the Laws of the Game" is also a cautionable offence. That means fouls don't actually have to be judged on their own merits and it makes sense to look at the amount of fouls committed by the player that receives the yellow card as well. In the next graph I've separated yellow cards received for "real" fouls (kicking/holding an opponent etc.) into those received for first and for subsequent offences:
  Now it's clear that the chance of getting a card for a single foul is fairly consistent during three quarters of the match, but the opening stages are still an anomaly. The only other explanation I can think of is that referees are conscious of the fact that a card early in the match is a harsher punishment than a card later in the match. In my previous article I calculated this effect for red cards, and to a certain extend it must be true for yellow cards as well. Players already on a yellow run the risk of getting a second and will be more careful making fouls in the rest of the match. The numbers show that on average, a player receiving a yellow card will have made 0.59 previous fouls and will only make another 0.36 fouls in the rest of the match. Of course this is skewed by the fact that the average yellow is given after 59% of the match. If we correct for that it's 0.5 vs 0.42. It's a minor effect, but it's there. To be certain I've also looked at hand balls, which I expect will be judged on their own merits. Free kicks given for hand balls are evenly spread out as well, but the risk of getting a yellow for it is 60% higher in the second half than in the first. All things considered it looks like it's true: it is easier to get away with a foul early in the match.
Knutson's Transfer Model Review
I have had a lot of requests to do transfer shopping pieces for various teams, and I’ve always replied that I’m waiting until late December to do them so that we have more data. (And secretly because I kind of hate transfer pieces done well outside of transfer window periods, but that’s just me.)
We’re nearly there, which means I have a lot of writing and evaluation ahead of me. I’ve been working on a back end to make this stuff easier and also learning some visualization stuff to improve how we present the stats. I’ll start rolling out the shopping pieces shortly after Boxing Day.
However, before making any recommendations, it probably makes sense to review the model I put together in the summer to try and unearth talents. In this case I use the term “model” fairly loosely – there was very little math involved, and it was mostly just breaking down stats into per90 metrics and sorting for key performance indicators.
The rationale behind this was that many football front offices aren’t using stats well enough in their transfer shopping. I said this without any personal knowledge, but because guys like Max Kruse were blazingly obvious from a statistical perspective, and yet went from Freiberg to Gladbach this spring for a measly 2.5M euros.
Obviously there’s also the potential case that clubs are completely aware of all of these players, but simply aren’t interested or can’t work out deals for them. Scouting networks are impressive things, with thousands of players falling under their umbrellas. On the other hand, some of these players seemed like clear slam dunks, and others transferred for well below their actual market value based on statistical performance.
My guess is that some clubs use heavy analytical scouting and likely combine it with video scouting to narrow down targets. Others… not so much. The market is still inefficient regarding obvious statistical performers. I doubt that will be the case in five years time.
Anyway, doing these over the course of a month this summer probably took about 80 hours. The problem I have run into is that doing all the stats work and formatting to do the full review would take a ton of time away from creating new content, which was the point of all this anyway. My time is unfortunately finite, especially around the holidays. On the other hand, some review needed to be done. That’s how I arrived at the kludge below.
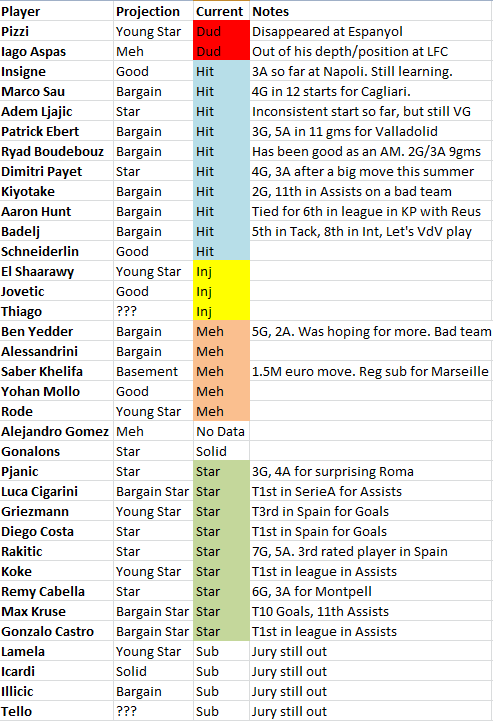
19 of the 36 players evaluated have been hits or stars so far this season. At the other end of the scale, 5 have been meh and 2 definite duds. (Of the duds, I was not impressed by Aspas, but I thought Pizzi was a future star.)
I’m probably most happy with what I had to say this summer about Kruse, Gonzalo Castro, Koke, Diego Costa, and Luca Cigarini (“a poor man’s Pirlo”). Click on the names and go back through them if you are interested – I haven’t changed anything since these were written in June, including suggesting Costa could make it to Brazil’s World Cup squad if he had a good season. Obviously I did not expect Spain to poach him instead.
I’m less happy with how Pizzi worked out. He’s basically disappeared at Espanyol, after having a torrid season last year. I still think Lamela, El Shaarawy, and Ljajic are three of the brightest young forwards in Europe, though their seasons have been complicated by injury and playing time issues.
Anyway, feel free to look back through what I said this summer, and look at the stats for these players today and make your own judgments. In most cases I have leaned toward being harsh instead of lenient (Example: Ben Yedder is doing alright on a bad team, but I was hoping he’d show more improvement overall).
It is possible I am biased, but I'm very happy with how the predictions turned out from this summer. Transfer scouting is an imprecise business, but using stats as a baseline for older players has to be the way forward. All of this was done with basic public info, and version 1 of a methodology, and tried very hard to only touch on players that were outside the mainstream.
Ben and I have something kinda cool we’re going to try out on Monday that will include a Google Hangout at 10:30UK time. Until then, enjoy your Christmas parties and weekend football.
--TK
P.S. We've accumulated a ton of new readers since we started at the end of July, almost all via word of mouth. You guys are what drive it, and I want to say thank you and hope that you continue to tell your friends when you see stuff here that you like.
And since there are so many of you that didn't know us this summer, it's possible you missed out on some pieces I did scouting big name forwards earlier this year as well. Here are the words for the piece, and here's a Tableau vis I used to try and map the characteristics.
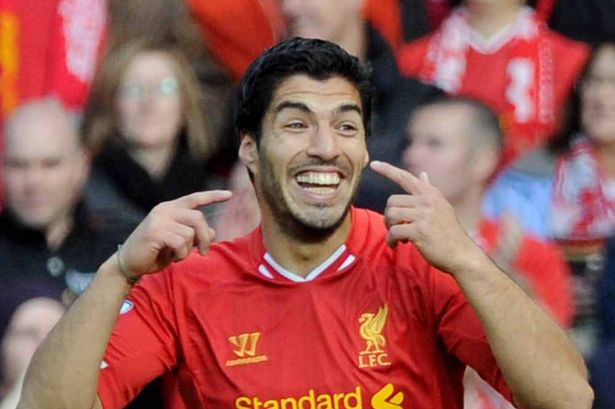
Luis Suárez: The Perfect Storm
Luis Suarez is a brilliant footballer. I think we are now beginning to get to the point where his on-field performances; his influence on his team-mates; and the impact he has on opposition defenses is such that he can be classed as a genuine superstar of world football. Suarez a superstar? Yes, and it no longer feels like a hyperbolic soundbite.
Suarez is frightening opposition defenses. He's butchering weak opposition and outperforming the toughest competition. He's arrived.
An admission: I was always a fan of Suarez despite some very real concerns about inefficiencies in shot selection and pass selection. Suarez, despite some bad, just had too many good qualities to his game for me not to sold on him.
And before I am accused of jumping on any bandwagons following Suarez's hot start to 13/14, I must mention that I was very much behind Arsenal pushing beyond the quoted £40m asking price and signing the player. I believed Suarez was worth the money then and I still believe Suarez is worth that money, and then some. 17 goals in 11 league games tends to bump valuations somewhat.
***
The main purpose of this article is to examine Luis Suarez's hot start to the 13/14 season; how it ranks when placed against Suarez's Liverpool career numbers; and how sustainable Suarez's 13/14 numbers may be.
Liverpool Career
This is what Luis Suarez's Liverpool career numbers look like:
- A solid start in 10/11. Excellent shots numbers undermined by terrible conversion and scoring percentages.
- 11/12 saw shots numbers remain at roughly the same rate per90. Scoring% ticked up a touch as did key passes per90. The goals per90 is still pretty average.
- 12/13: explosions in the sky! Shots, SoT and key passes are all up year on year. The boost in scoring% (goals/SoT) and conversion% (goals/total shots) boosted the goals per90 number to a Liverpool career high.
- 13/14 is other worldly. The shots per90 number looks like the bastard offspring of Messi and Ronaldo. The Shots on Target per90 number is the best 11 game sample I have ever seen as is the Goals per90. Shot volume certainly helped Suarez to score 17 in 11 games but the main drivers are those conversion and scoring% numbers.
| Shots | SoT | Goals | Assists | KP | mins | Sc% | SoT% | Conv% | |
|---|---|---|---|---|---|---|---|---|---|
| S 10/11 | 4.50 | 1.88 | 0.33 | 0.25 | 1.97 | 1099 | 17.39 | 41.82 | 7.27 |
| S 11/12 | 4.56 | 1.66 | 0.39 | 0.11 | 2.33 | 2545 | 21.74 | 36.22 | 7.87 |
| S 12/13 | 5.70 | 2.07 | 0.64 | 0.12 | 2.74 | 2953 | 30.88 | 36.36 | 11.23 |
| S 13/14 | 6.20 | 3.37 | 1.55 | 0.36 | 2.92 | 987 | 45.95 | 54.41 | 25.00 |
13/14 Scoring% is historically high for Suarez's career, but it is also high when placed against his peers' numbers. Suarez's scoring%, in my opinion, is not sustainable long-term.
If you're the type of girl/guy who prefers to use all of a players' shots in conversion stats then focus on Conv% which is, when placed against the previous 3 seasons, seems inordinately high.
So What Is Going On With Suarez's 13/14 Numbers?
Small(ish) sample. The scoring% and conversion% numbers should both cool down over a larger sample (the rest of the season) and that will likely mean a slowing of his 326 goal pace that he is currently operating at.
But what about Suarez's shots numbers which are out of this world? Hmmm, good question. Like most excellent forwards, Suarez is a flat-track bully who butchers weak opposition and a cursory look at the games Suarez has played this season gives us an indication of the opposition strength:
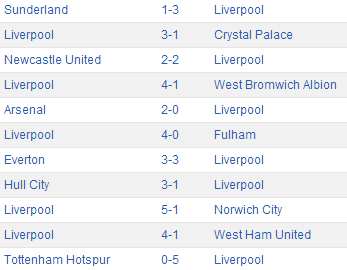
Newcastle, Arsenal, Everton and Tottenham were the tough fixtures. The remaining schedule is pretty easy. Could it be that Suarez is padding his shots numbers against teams who are clearly no match for his talent level?
The flat-track bully element to Suarez's game, and every other good strikers game, is not meant as a criticism. Good strikers feast on weak teams and it may just be that Suarez has faced 7 or 8 teams who, for whatever reason, are pretty weak now. This is my theory, and feel free to ridicule it!
I will probably test Suarez's performance against, say, Top 7 teams and the rest of the league when I manage to find a hour free to do so.
***
We know what Suarez's career box numbers look like and we know that this hot start to the season looks to be a level of performance above and beyond Suarez's career average. What I want to look at now is just how abnormal Suarez's start to the 13/14 season is.
To look at how abnormal the hot start is I am going to look at Suarez's Liverpool career numbers using an 11 game rolling average so as to compare 13/14's 11 game stretch with the other 77 11 game stretches. I want to know if Suarez has enjoyed a hot streak like this in terms of shots, conversion% or goals per90 in his Liverpool career previous to the start of the 13/14 season.
Shot Volume
Shots per90 is pretty variable: 3 peaks and 3 valleys within those 76 buckets worth of 11 games. Suarez's overall shots per90 volume is excellent.
Shots On Target per90 was fairly stable in the first 60 games at the club. Since then, the SoT per90 volume has been on the march with a notable spike in the last 30 games. I'm not particularly sure why we have seen a recent improvement in shots on target per90 volume.
Shots On Target% & Scoring%
Shots on target% = shots on target/total shots. Scoring%=goals/shots on target.

As stated previously, Suarez's ability to get shots on target has improved recently and that improvement shows up inSoT%.
Suarez's Scoring% (my preferred conversion stat) is not particularly stable. There doesn't look to be any long term improvement in Suarez's ability to convert shots on target into goals; it merely looks like a lot of noise to me. In fact, as good/"lucky" as Suarez's scoring% (45.9%) is, Suarez has posted better 11 game spans of scoring%.
Suarez posted five spans of >46% scoring% and those spans came at the start of the 2012/13 season. In short: we have been here before with Suarez and a high scoring%.
That hot scoring% cooled off pretty sharply.
Conversion%
Conversion%=goals/total shots.
If you prefer to focus on a players conversion stats by using all shots that a player takes the we can look at the graph above.
A crazy barren period at the start of Suarez's career is a mystery to me. (Liverpool fans?) But following that barren period we see that Suarez's conversion% bobbed up and down, neither too high nor too low; no droughts or extended hots streaks and the BAM! Look at the far right hand side of the chart. That spike is completely out of keeping with the Suarez's career rates.
Suarez's career conversion% is 12.07%. In 13/14 Suarez's conversion% is 25%. That 25% number is out of keeping with Suarez's Liverpool career. It looks like an anomaly. Or, maybe there is something I am missing. Maybe Liverpool's tactical setup, the quality of his team-mates or weak opponents have led to the spike in Suarez's conversion%? Or it could be the amount of time Liverpool spend winning, and thrashing, their opponents?
I'd say variance with a side dish of weak opposition.
Goals Per90
If we add a recent spike in shots on target volume, a spike in shooting accuracy, a spike in conversion% and scoring% what do we get? A goals per90 spike.
This, I believe, is the most extreme graph. After a tough start to Suarez's career, which included that extended barren spell, Suarez numbers, with no little variance, have stayed at an elite level (buckets 32-75). What has happened in buckets 75-78 can only be described as freakish. A perfect storm, if you like.
That perfect storm was caused by:
- The 2nd best shots per90 rate in Suarez's Liverpool career.
- The best SoT per90 rate in Suarez's Liverpool career.
- The 2nd best SoT% in Suarez's Liverpool career.
- The 6th best Scoring% in Suarez's Liverpool career.
- The best Conversion% in Suarez's Liverpool career.
If we add all of the above together it becomes clear just how Suarez has posted 17 goals in 11 games so far this season.
If we take a guess and say that the shots volume and SoT% may have been caused in small part by some weak opponents, improved tactics and the thrashings that Liverpool have dished out, then what can we say the spike in conversion% was caused by?
Is the spike in conversion% solely caused by variance? Or is some small part of it tactical or influenced by opponent strength? I cannot be certain either way. We know shooting% regresses on a team level and may be a pretty good guess when looking at Suarez's conversion% chart that conversion% isn't a consistently repeatable skill from 5 games or so to the next 5 games or so.
Going forward I expect Suarez to continue to post high shot volume numbers (although they will cool off some) but I am far less certain about Suarez's ability to maintain those conversion% numbers. If Suarez's conversion% numbers cool that will likely mean that Suarez's Goals per90 numbers cool also.
This wouldn't be the end of the world. Suarez would continue to perform well, create tremendous shot volume and score at an elite clip. But regression in the conversion% means Suarez may well drop from Messi-like heights and rejoin the mere mortals.
Suarez is a brilliant player, who will deservedly win the golden boot, but I'll stick my neck out and say that Suarez cannot maintain a conversion% that is double his Liverpool career average. The goals may slow down a little, but that's fine.
Incredible hot streaks don't last forever.
DOGSO and Punishment
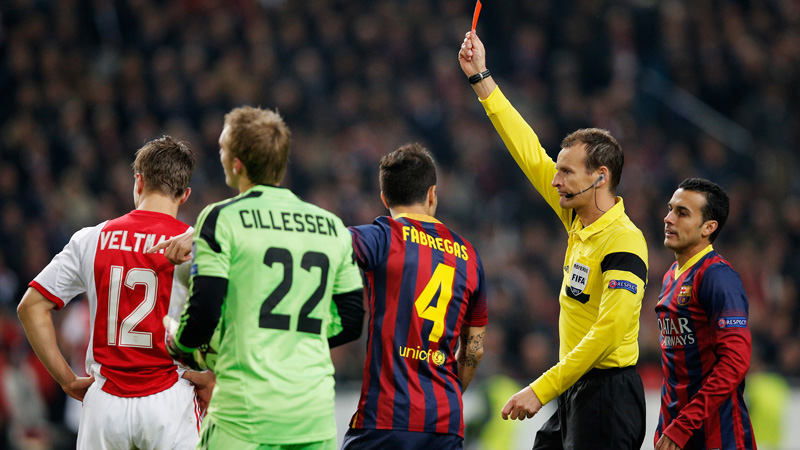
This week UEFA revealed plans to make a case for an end to the ‘triple punishment’ of a penalty, a red card and a suspension for denying an obvious goal-scoring opportunity in the 18-yard box. It’s true that this punishment often seems harsh on first glance, but this move by UEFA seems like a good time to try and back this up with facts.
The best way to do this is to assign an expected goals value to all of the factors that are involved, which are:
- Penalties
- Red cards
- Suspensions
- “Obvious goal-scoring opportunities” (OGSOs)
For example, we know that about three out of four penalties are scored, so we can say that a penalty is worth about 0.75 goals.
The other factors are quite a bit harder to determine though. I’ll even leave suspensions out of the equation altogether because that would require an accurate measurement of the influence of an individual player on a team’s performance. A bit too ambitious…
Obvious goal-scoring opportunities
"OGSOs" in this case are almost by definition hard to assign a value to, because we’re specifically interested in those that are denied. That means we’re trying to measure the effect of something that didn’t happen. We also know that not all OGSOs are created equal, and that nobody can even agree on an all-encompassing definition. We can, however, look at some typical OGSO-situations.
For example, there’s the classic one-on-one with the goalkeeper. We have no readily available statistics on this either, but we do have this:
“From 1977 through 1984 the NASL had a variation of the penalty shoot-out procedure for tied matches. The shoot-out started 35 yards from the goal and allowed the player 5 seconds to attempt a shot. The player could make as many moves as he wanted in a breakaway situation within the time frame.”
This crazy American experiment may turn out to be pretty useful, as this seems to be a decent simulation of a similar situation in a match. As the video below shows, five seconds is not a lot. It puts quite a bit of pressure on the attacker, not unlike having a defender on his heels. As you can see it’s not at all easy to score.
From the available historical data on the internet I’ve gathered that in these kinds of shootouts about 48% of attempts were scored. That means this kind of one-on-one OGSO has an expected goal value of 0.48.
I take it that this is the kind of situation UEFA has in mind, but of course there are also cases where it’s not merely an opportunity that is denied, but a (near-)certain goal. Think of Suarez’s infamous handball on the line to deny Ghana in the 2010 World Cup, or a keeper intentionally bringing down an attacker who only has to walk the ball into an empty net. Surely these have an expected goal value of >0.95.
Red cards
That leaves us with the factor of the red card. In theory the effect of a red card on expected goals can be measured well, but it’s a complicated matter:
- Unlike penalties and goal-scoring opportunities, the effect of a red card isn’t constant over time. A red card in the 85th minute obviously doesn’t leave the opponent much time to capitalize on the advantage, while a red card early in the match can be a huge deal.
- There’s a risk of confusing correlation and causation. Teams ship more goals after conceding a red card, but worse teams get more red cards anyway, so if the team simply has an off-day they can expect to concede more goals and more red cards.
- When counting goals after a red card, we should exclude penalties resulting from the same incident, if we want to consider both factors separately.
Mark Taylor has done some interesting work here. As he points out not only is the value of a red card not constant, it’s not even linear, since on average more goals are scored in the second half than in the first. This means that the rate at which the value of a red card degrades increases a little as the match goes on. I’ve confirmed that this is true even if matches with red cards themselves are excluded (which would be one explanation for this effect).
Mark comes up with an expected goal value of 1.45 for a theoretical first minute red card, but because I’m not entirely sure how he got there (and because double-checking is simply good science) I decided to take a shot at it myself.
I've taken minute-by-minute data from 4.5 Premier League seasons and looked specifically at the 204 matches in which exactly one red card was given. For these matches I've taken the average number of goals scored by the 11-man team and the 10-man team, both before and after the red card was given.
After adjusting for the fact that the average dismissal is after 66% of the match, taking into account that more goals are scored near the end, and subtracting the value of penalties given for the same incident as the red card (12% of cases), I get a value of 1.08 goals for a red card in the first minute. In this theoretical case in which they still have to play the entire match the 11-man team can expect to score 0.61 goals more, and the 10-man team will have to do with 0.47 goals less.
If I exclude matches with red cards given before 20%, or after 80% of the match has been played (cases which provide too little information to compare events before and after the red card), I still end up with the same number of 1.08.
The Ole Gunnar Solskjaer guide to taking one for the team
Is UEFA right? Well, the graph shows that the combination of a red card and a penalty can be almost four times as valuable as the goal-scoring opportunity that was denied. Harsh indeed! On average it will be about 2.5 times as valuable as a one-on-one situation. This has the nasty effect of making it very tempting for the attacker to go down easily instead of staying on his feet and taking the shot.
This also serves as a handy guide for defenders. When they’re chasing an attacker who is through on goal I suggest they refer to these simple rules that they will now surely keep hidden in their sock before deciding on how to proceed:
- As long as you still run the risk of getting both a red card and a penalty, it’s never a good idea to make a foul inside the area…
- …Unless you are avoiding a near certain goal and it’s during the last minutes of the match (Suarez did the right thing).
- If he’s still outside the box and at least an hour has been played, go ahead and take him out (the Solskjaer special seen below).
- If UEFA’s suggested change goes through and you’re still in the first quarter of the match, let him enter the area and then take him out. You’re better off with a penalty than a red card.
- Under the new rules, a near-certain goal should be stopped by any means in almost all cases.
The last point makes clear that in reality a distinction would have to be made between DOGSOs and the denial of near-certain goals (DNCG?) and that the triple punishment would still have to apply to the latter. I feel that on average this new rule would be more fair, but I’m afraid that in specific cases there would be even more room for controversy.
EPL Thoughts and Figures - Suarez is Matching Messi's Best Season + More
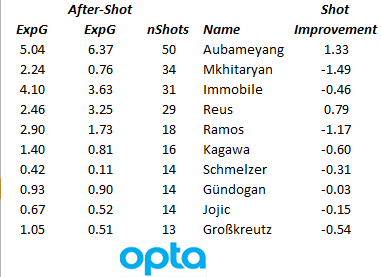
Luis Suarez I’ve been following Suarez’s per90 scoring rate since November, when I noted he was scoring at about the same rate as Ronaldo. Since that time, he’s actually sped up. His current rate is 1.55 goals per90 minutes, which would give him, ohhhhh, 58 goals from 38 games. Let’s put this into context. First of all, that rate is faster than 14 of the other 19 teams in the Premier League, by himself. But how does he compare to the two giants of modern times? Ronaldo scored at 1.12 G/90 in the league last season. His best season was "only" 1.23. Messi was 1.58 last year, his best season for scoring rate. So far this year, Suarez is matching Messi’s best season and he’s .3 goals per 90 minutes better than any Ronaldo has ever had! In the Premier League. HOW IS THAT EVEN POSSIBLE?!?!?! Manager Stats Theory I have a theory right now about managers, where statistical analysis can lend a very good framework to evaluation. Shot Dominance (the ratio of shots a team creates and concedes against an average opponent) is a good baseline, and then it can be colored in by shots on target information, shot location information, possession, counter-attack goals, and maybe one or two other things. Essentially, how a team fares in the shots battle is the most important driver to success. Even managers that have funky systems like Simeone at Atletico Madrid (who are one of the very few Champions League squads with under 50% possession across a season), still grade extremely well in the shot ratios. The SOT info is there to drill down deeper on shots info and to also maybe filter out managers who have a good tactical system but are saddled with bad talent. Shot location info is important to evaluate whether a manager is an AVB-style “create a ton of shots but from whatever distance,” versus a Guardiola-style “don’t shoot until you are clear on goal.” A manager whose team counter-attacks regularly is likely more valuable than one that does not, as that type of tactical setup and flexibility is an important trait in posting long-term success. Anyway, all of this is just a theory right now because the data is just coming available for teams and managers across multiple years. We’re also just now seeing how managers who post good Shot Dominance scores at teams with poor talent (like Martinez at Wigan or Pochettino at Espanyol) fare with new jobs and better personnel. 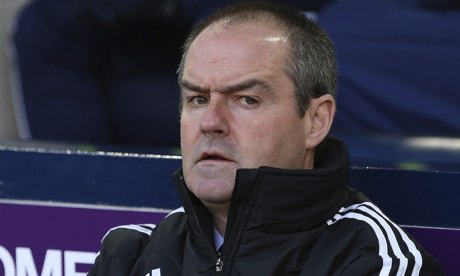 I mentioned when he was sacked that Pepe Mel looked like exactly that sort of candidate, making him a good hire for another club. Markus Weinzierl from Augsburg looks like another. There are more of these managers, scattered across Europe, and we’re building a database stretching back at least 4 seasons to help scout them out and do further research. Steve Clarke at West Brom was basically average. Shot Dominance was about what you expected from a club like WBA, though they were slightly below average in shots on target concessions on both ends of the pitch. He’ll probably get another job and do fine, but it wasn’t a big shock that he was sacked, with West Brom’s recent form looking terrible and their table position close to the danger zone. AVB I’ll try (and probably fail) and keep this fairly short, since I’ve written about AVB and Spurs quite a bit already this season. I have been a fairly staunch supporter of the Portugeuser analytically, but this weekend made it a lot harder. The naivety displayed in both the tactical setup -a suicidal adherence to the high line despite a patchwork defense and the most lethal counterattacking squad in the land- and personnel -playing Rose on Thursday when extra rest and even 45 minutes would have helped against Suarez and Sterling, the attacking setup… AGAIN- left even AVB’s supporters scratching their heads. The scoreboard obviously did the rest. Liverpool’s first goal felt like an anagram of what Newcastle did at White Hart Lane last month – the events were in a slight different order, but it spelled out nearly the same goal. Press the weak spots, close down any actual passers in the Spurs lineup (of which there were few, which made it easier), and then attack with pace behind a slow, bewildered back line that is playing too high. The difference is that against Newcastle, Spurs dominated the rest of the match and were unlucky to lose. Against Liverpool, they were annihilated. Taking a step back from that particular match, I think AVB did himself in with a combination of taking shots at the home support (something you can never, ever do in the way he did), and not playing the talent Baldini purchased. Stubborn adherence to his tactical system when clear changes were required and the subsequent results just gave Levy an excuse. And make no mistake, Spurs are talented. People have been taking shots at Baldini’s summer spree in the wake of some bad results and Spurs’ offensive failures, but how many of those guys - especially the creative ones - played? Eriksen has five league starts. Holtby the same. Lamela, he of the £30M move and 15G/5A last season, who is widely considered one of Europe’s top young talents by anyone with a clue? Two starts. Baldini deserves criticism for Soldado, and maybe for not finding a left wing and left back depth, but the younger guys Spurs bought have been good in the past and will be good again. Would I have fired him based on his performance? No, not yet. They are still in striking distance of a Champions League spot. But if there’s other stuff going on behind the scenes that we don’t hear about? I said it on Twitter ages ago, but you can picture scenes from Moneyball taking place at Spurs. [Levy walks into AVB’s office after losing against West Ham.] Daniel Levy: I should have made you a bigger part of the conversation from day one. That way we'd be clear what we're trying to do here. That was my mistake, Andre, and I take responsibility for that. AVB: What are you trying to say? Daniel Levy: I'm saying it doesn't matter what moves I make if you don't play the team they way they're designed to be played. AVB: Daniel, you're out of your depth. Daniel Levy: Why not Lamela on the right? AVB: Because he can't play there. Daniel Levy: How do you know? AVB: It's not my first football match. Lamela can't play in the Premier League. He can't score and he only has one foot. Daniel Levy: Could this be about not letting you go to PSG? AVB: No. This is about you doing your job and me doing mine. Mine's being left alone to manage this team you assembled for me. Daniel Levy: I didn't assemble it for you, Andre. AVB: No shit. Daniel Levy: Good meeting. Every time we talk, I'm reinvigorated by my love of the game. [Weeks pass. The team still doesn’t score.] Daniel Levy: You can't start Townsend on the right tonight, you'll have to start Lamela. AVB: Yeah, I don't wanna go through ten rounds, Levy. The team sheet is mine. And that's all, okay? Daniel Levy: The team sheet is definitely yours, I'm just saying you can't start Townsend. AVB: Well, I am starting him on the right. Daniel Levy: I don't think so, he plays for QPR now. AVB looks at him in shock. AVB: You sold Townsend? AVB: You are outside your mind! Daniel Levy: Yep. Cuckoo. Daniel Levy: Defoe's gone too. AVB: You're killing this team. Daniel Levy: Andre, I can do this all day long. [Levy walks out of AVB's office and Baldini goes to follow him when AVB stops him] AVB: Hey, you agreed with this? Baldini: Hundred percent. [End scene.] Talent matters. So do systems. When the talent can’t get on the pitch, and the manager is so inflexible tactically as to not change in the face of clear problems, and he takes shots at the fans along the way, well… Dude basically fired himself. Atletico Match Stats “Valencia had scored in every game so far this season. Then they met Ateltico.”
 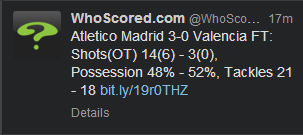 I would say this is one of the more unusual stats lines you will see, but it keeps happening in Atletico Madrid matches. Total dominance in shots and shots on target crossed with 48% possession, against an inferior team, at home. What Simeone is doing at Atletico is worth watching and studying. Our model grades them as one of the top 2 teams in Spain, and has all year long. They have a unique system that, despite not caring about controlling possession, is capable of dominating the shots battle and the scoreboard. They are extremely hard to break down defensively. And they have a well of young talent that is as impressive as anywhere in Europe. I kept hearing people hope to face Simeone’s club in the lead up to the Champions League draw. Outside of Bayern Munich, they were the team I least wanted Arsenal to face. They play a fundamentally different style to most elite teams, you can’t counter attack against them, and they have a ton of different angles of attack. Looking for a CL dark horse? It's these guys. Good luck to Muntari and AC Milan – you got the opponent you said you were hoping for. I doubt that is going to turn out very well for you in the end. Fatigue Arsenal looked seriously leggy this weekend, which is no real surprise considering how many matches most of their best players have played in the first half of the season. I did the calculation during the City match, and Ramsey had already played something like 500 more minutes at the club level this season than Aguero. A lot of this is complicated by Arsenal injuries earlier in the season that shrunk the squad size. Those guys are coming healthy now, but the others have a lot of miles on them compared to Chelsea or City’s men, which is probably lowering their performance levels. Anyway, fatigue is a thing, and November and December are when it typically bites down hard. Liverpool and Everton don’t have European football to contend with. This could end up being really important by the time March roles around and we see who is in pole position for those final CL slots at the end of the season. Arsenal are lucky enough to have a nine day break before heading into the holiday fixtures. That should be enough recovery time to freshen them up, but their hold on first place is tenuous at best. The Nowhere Men
 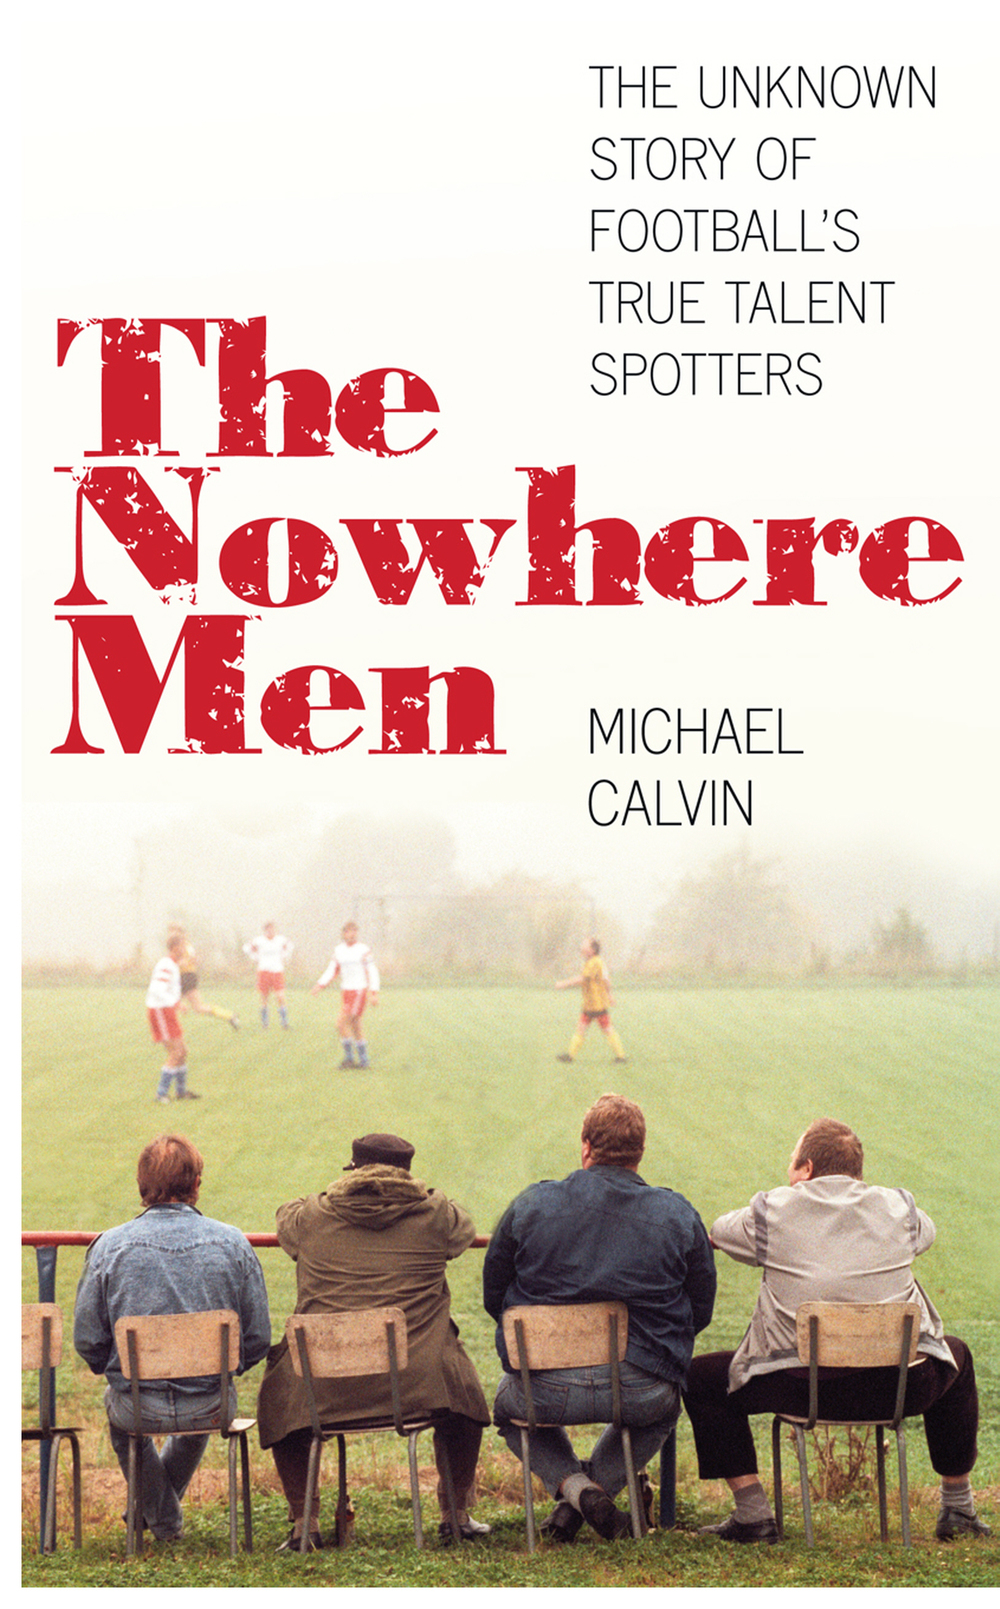 I have stated on Twitter how much I enjoyed this book and I wanted to give it another recommendation here in print. Michael Calvin’s book is an in-depth look at the world of English scouts, and it’s told mostly as a series of scouts talking about their lives and telling stories. However, it also has some balanced info about how clubs work, the role analytics is now taking at the club level, and some background info on Damien Comolli in particular that just made me laugh. There’s a section in there discussing Matthew Benham, owner of Brentford FC as well as the Smartodds betting hedge fund that I found really enjoyable.
“Is a statistical model useful in scouting and recruitment? Without a doubt. The problem, however, is that too many people in football are running these computer models without having a maths or science background.”
…
“Frank took me up to Liverpool to meet Comolli. The idea was ‘we’ve got a model, you’ve got a model, maybe we could talk about ways we could work together.’ It was extraordinary. He just said, ‘my model is correct.’ Anyone with a pure maths or science background wouldn’t have said that.”
Anyway, I found the book to be a great read and wholeheartedly recommend it for yourself or as a Christmas gift. The Kitchen Sink
- 16 matches into the season, Nurnberg have a record of 0-10-6. That’s 62.5% draws through nearly half a league season. The highest number of draws through an entire season in recent times is 14. Nurnberg could hit that by mid-February.
- Speaking of draws, Daniel Storey tweeted a great stat this weekend: West Ham have more 0-0 scorelines this season than the entire Bundesliga.
- Assuming AVB keeps his job, who would you rather be right now: David Moyes or AVB? AVB is taking fire from media and fans for the giant losses against Manchester City and Liverpool. David Moyes won this weekend (against a horrific Villa defense), so it’s quieter, but United are still in 8th place… two points behind Spurs.
- I read something in the Telegraph this weekend that estimated 2 billion is spent per day on sports betting. That equates to 730B for a year, which would put sports betting on par with one of the Top 20 GDP nations on the planet. Like… the Netherlands.
- Having worked on both sides of the industry, and knowing that people in the world’s largest economy (the United States) basically can’t bet on sport, I am dubious as to whether this number approaches reality.
The Reason West Ham Could Go Down
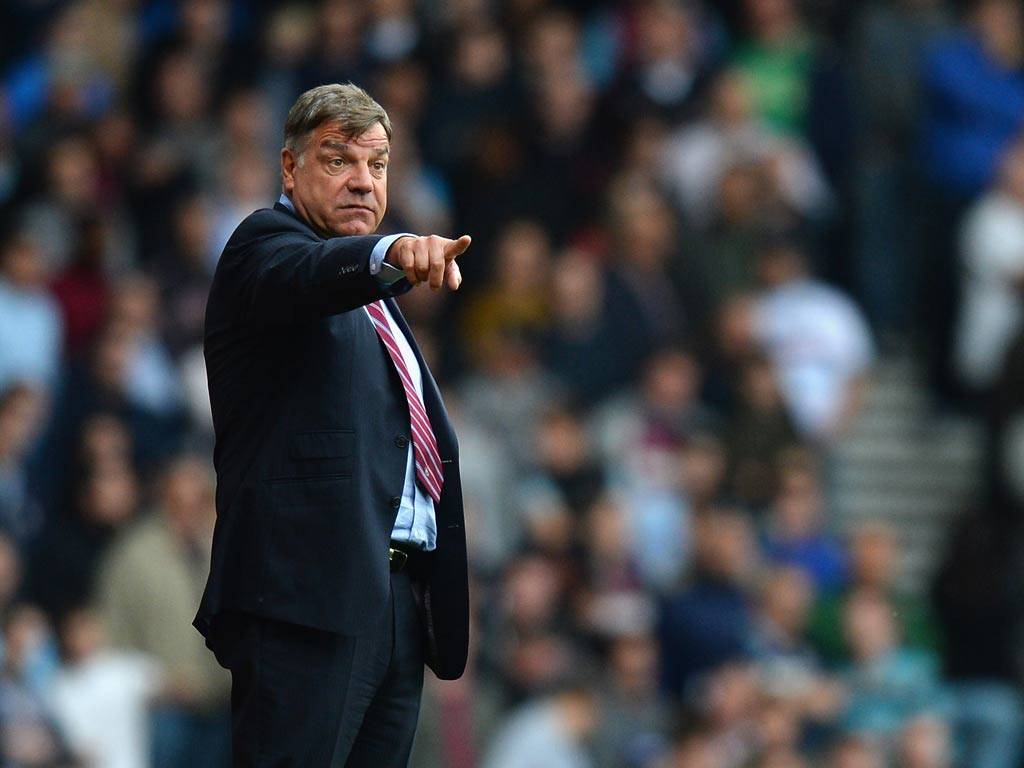
The knowledge that shot locations are important is increasing all the time, however West Ham seem to be going out of their way to remind us that there is more to a good attacking strategy than simply ensuring teams shoot from close range. West Ham's Traits The injuries suffered by West Ham’s strikers during the current 2013/14 EPL season are well documented, and, at face value may provide plausible reasons why West Ham has scored just 13 goals in the opening 15 league games. However, upon examination of last season’s data I would suggest that there may be contributing systemic reasons for West Ham’s relatively low goals total. 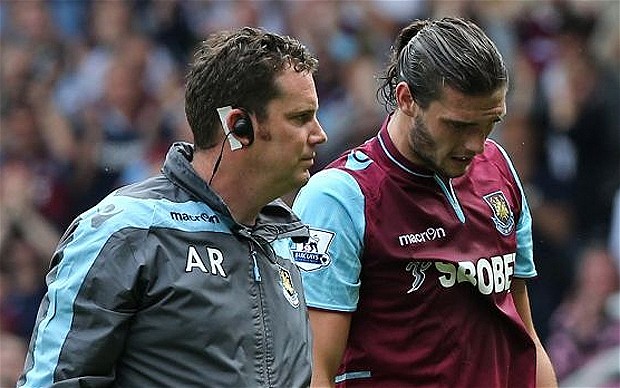 During the opening 15 games of the 2013/14 EPL season West Ham have taken 62% of their shots from Inside the Penalty area. The only teams to post a higher percentage of their shots from inside the area than West Ham are the perceived Super Powers of Man City, Man United and Arsenal. This is broadly consistent with the 2012/13 season where West Ham took 68% of shots from inside the penalty area; this 68% value was the largest proportion in the league last season. Based on these numbers we can ascertain that West Ham seem to place more value than most on ensuring they shoot from good locations and attempt to minimise what are perceived to be “wasted, low expected value” shots. Ordinarily, taking approximately two thirds of a team’s shots from inside the penalty area is something that should be strived for; however, the underlying numbers posted by West Ham from the start of the 2012/13 season suggest that something is missing from the attacking strategy being adopted. It appears that West Ham have almost adopted an “ensure we shoot from good locations” strategy to the detriment of everything else, including how the shot has come about. The origination and type of the pass that led to the shot has an important bearing on the chances of the subsequent shot resulting in a goal. I think it's beyond doubt that Sam Allardyce favours close in shots and I found this interesting answer from Kevin Nolan in reply to a question in 2007:
The gaffer [Allardyce] said that he would have to fine him [Jay-Jay Okocha] because he was missing the target so often.He now has a theory that a large percentage of shots from outside the penalty area miss the target and thus do not lead to goals.The manager is now insistent that if you shoot from outside the area you hit the target - but there are no fines involved.
Data Teams tend to favour shots from different pitch locations so in order to have a level playing field to aid comparison I am looking at just non-penalty shots taken from the central portion of the penalty area, but which were taken from outside the 6 yard box. In the remainder of this article shots from this area will be termed “Central Shots”. "Shots" in this article refer to both shots and headed attempts on goal. The area has been bounded by a black rectangle in the image below. 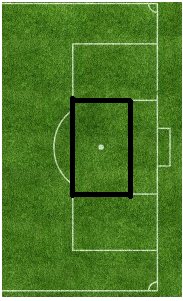 The tables contained in this article relate just to shots taken from within this area. This area under investigation was not cherry picked to give a predefined set of results but was chosen instead due to the large volume of shots and the relatively high conversion rate expected from within this zone. It’s also the area that I would expect to see shots that come from knock-downs or second balls, a tactic that would be held to be used quite extensively by West Ham. Central Shots and Goal Conversion Rates 2012/13 EPL Season
 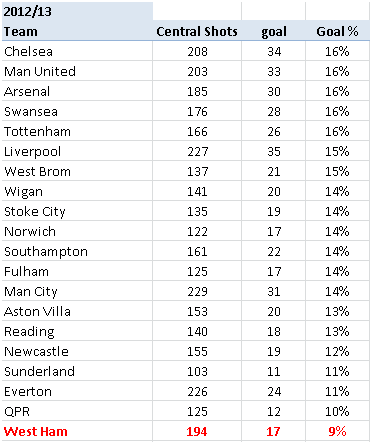 The above table has been sorted in descending order of Goal % (Goals / Central Shots) West Ham’s total of 194 Central Shots was the 6th highest in the league last season, but the paltry return of just 17 goals from these shots represented a conversion rate of only 9%. We can see that this was the lowest in the league. This pattern of a large number of Central Shots with a corresponding low conversion rate has broadly continued during the current season:
 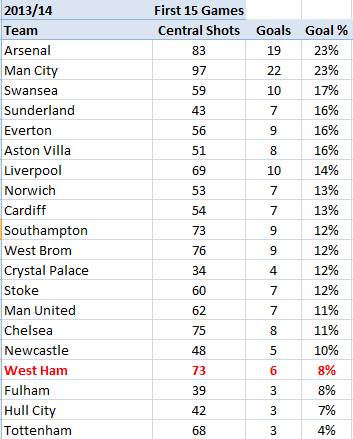 The 73 Central shots taken during the opening 15 games is the joint fifth highest in the league, but once again West Ham are being let down by the conversion rate of just 8% from these shots – resulting in just 6 goals. As an aside, this measure clearly shows part of Tottenham’s problems this season. Somehow, they have only managed to score 4% of their Central Shots this season – the EPL average is 13%. Those returns are barely believable and should be Exhibit A for Andre Villas Boas should he ever require any stats in his defence. I would contend that Spurs have deserved more goals from their attempts, and they have been victims to a large dose of variance, so it’s a pity that AVB doesn’t believe in stats!!! Getting back to West Ham, if we didn’t have last season’s numbers to compliment the data from the opening 15 games in the above table we could perhaps assume that the scoring conversion rate will pick up when Andy Carroll comes back into the team. However, armed with the evidence from last season I think it is worth considering whether there are other factors that have resulted in the very low conversion rates of Central Shots since West Ham have been promoted to the Premier League in 2012. Expected Goals As usual, I’ll use our (produced with Constantinos Chappas) ExpG metrics to dig a little deeper into why West Ham are not availing of what appear to be great chances. In order not to bore our regular readers I’m skipping over the explanation of ExpG, but new visitors to StatsBomb can find a detailed explanation at the bottom of this piece. Central Shots Analysis using ExpG Last Season
 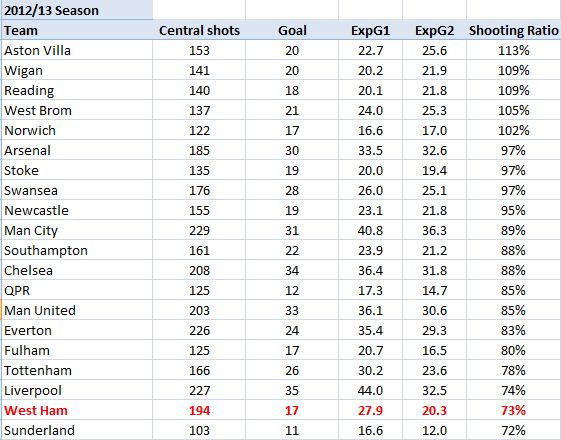 Shooting Ratio = ExpG2 / ExpG1 (the higher the ratio the better the shooting given the initial perceived shot quality) The above table has been sorted in descending order of Shooting Ratio Now let’s look at the corresponding figures for the opening 15 games of the 2013/14 Premier League season.
 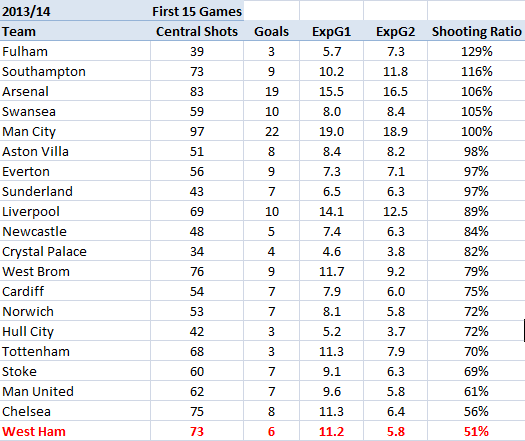 We can see that West Ham lie bottom, and detached by some distance, of the table for the current season, and second from bottom last season. This is the single most important take away stat from this piece. What is the significance of the Shooting Ratio? Let’s take the 2012/13 full season figures for illustration. West Ham had an ExpG1 of 27.9, ExpG2 of 20.3 and actually scored 17 goals from these Central Shots. Using the data at the point these Central Shots were taken, our model expected West Ham to score 28 goals, however only 17 were converted. This is a large under performance and needs further analysis. ExpG1 values are controlled for headers so the fact that West Ham had the most headed attempts at goal in the league (123) shouldn’t be part of the explanation for the shortfall. I feel that the ExpG2 measure can rule out that “bad luck” was at play for the majority of this shortfall. The ExpG2 value of 20 means that after the shots were struck the expectation for the total goals decreased from 28 to 20. This fall in expected goals is due to bad shooting – nothing less. Shots were either hit too centrally at the opposition goalkeepers, were blocked or missed the target altogether. Most likely a combination of all three factors are liable to be at play here. One season can be explained away as a blip, but when the poor Shooting Ratio has continued through to the current season (11 Expected goals become just 6 when the shot locations have been taken into account) then I feel this matter requires further examination. The use of the ExpG2 metric rules out the suggestion that the lower than expected goal totals can solely be put down to “bad luck”. Good quality shots that are saved would have a high ExpG2 value regardless of the actual number of goals scored. For example, Tottenham had an ExpG2 value of almost 4 in their defeat to Newcastle last month despite not scoring. In West Ham’s case the ExpG2 values are not high; in fact they are the lowest in the league as a proportion of the ExpG1 values. What’s the cause of West Ham’s shooting problems? This is the important question, and unfortunately I can’t definitively answer it right now. With access to more granular data I would be able to undertake more detailed analysis to see if there is any particular subset of shots (ie how they are created) that are contributing to the low ExpG2 numbers, and hence low actual goals scored. Without access to this data I can only offer a possible suggestion: A lot of shots appear to be created either directly from crosses or knock-downs from crosses or long balls. Perhaps the subsequent shooting opportunity is harried by onrushing defenders, and thus shots that initially appear good quality do not have as high an expected value as they first appear. Player or Systemic Causes From the little work that I have done on repeatability I’m not sure that at, the average Premier League level, finishing ability varies that widely between players. Of course, there will always be exceptions with the very best strikers but generally I think that team play and systemic approaches will drive individual players’ stats, not the other way about. Central Shots on Target From a West Ham point of view, the percentage of Central Shots that are On Target (ie score a goal or force a save) have been exceptionally disappointing over both seasons. The below tables have been sorted in descending order of On Target percentage
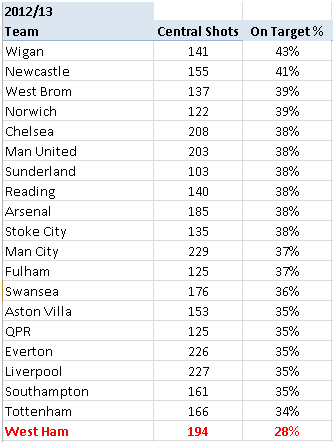
 West Ham only managed to get 28% of their Central Shots on target last season; by some distance this was the lowest in the league. As with the other metrics we have looked at in this piece, the situation has not improved in this current season. As stated above, I can’t be definitive about this, but in my opinion there is something about the quality and type of chances that are being created by West Ham which means that they are not as strong as they initially appear. Conclusion It is apparent that West Ham prioritise shooting from good locations with approximately two thirds of shots coming from inside the penalty area. However, they have converted just 9% of their Central Shots over the last season and a half. This is the lowest conversion in the league and my work would suggest that this low conversion rate is not due to bad luck as the placement of shots relative to apparent chance quality is lowest in EPL from the start of last season. All relevant metrics were poor last season; so this is not just a 2013/14 problem and this continuation of poor metrics (lowest in league) suggests that there may be systemic issues rather than being due to the availability, or otherwise, of individual players. The data demonstrates that West Ham have an issue in turning what look like good quality chances into goals. Given Sam Allardyce’s reported use of analytics it is surprising that this phenomenon has been in existence throughout the last season and a half. Without having the data required to pinpoint the exact reason I would suggest that the lack of variety in West Ham’s attacking strategy allows defences to be prepared for the crosses and long balls that they play - last season they made the most crosses in the Premier League and currently sit 3rd in the same measure this season. The readied defences then ensure that the Hammers rank amongst the very worst teams in terms of getting their shots on target. Could it be the case that West Ham are concentrating too much on one KPI - shot location - to the detriment of developing a balanced attacking strategy? Either way, it appears to be time for a rethink of offensive strategy at Upton Park. Expected Goals Explanation One of the metrics that I use to help analyse scoring opportunities is Expected Goals (ExpG). These are a series of models that I have developed in collaboration with Constantinos Chappas and they numerically evaluate the probability of a goal being scored from any shot. These metrics have been developed using Opta data and so they cannot take account of defensive pressure or positioning, but I feel that I have developed a work around for this. We use two metrics, and it’s important to understand the subtle distinction between them: ExpG1 – is the Expected goal value of a shot at the time that the shot is ABOUT TO BE taken. This calculation takes into account many factors such as shot location, whether the shot was a header or struck with the foot, the location and type of pass. ExpG2 – is the Expected goal value of a shot AFTER the shot has been struck. This takes into account all of the factors used in ExpG1 but is weighted much more towards the intended location of the shot. A shot that is blocked or off target would have an ExpG2 value of zero (as the shot cannot be scored), whereas a shot aimed for the very top corner might have a probability approaching 1.00.
Attacking Wrinkles - Manchester City and Barcelona
One of the things I've wanted to do on StatsBomb for a while is provide some tactical illustrations of things we've either referred to on the podcast or in articles, but failed to provide visual evidence for. Describing situations is one thing, showing them to you is another. In last week's podcast, Ben and I talked a bit about how interesting the Manchester City attack is. They attack from both sides of the pitch with skill players and overloads. On a good day, Navas might just be the winger most likely to skin an oppositing fullback in the league, and Nasri on the opposite flank looks like a new player under Pellegrini. One of the cool things I have mentioned is that both Aguero and Negredo also seem capable of a "post-up" game as well. Through your feedback, I learned the phrase post-up doesn't really have any meaning to non-basketball fans, so I spent some time this week figuring out how to make gifs, so we can show you this stuff with pictures instead of just words.  This is a short clip from the City v. United match earlier this year. Watch as the ball comes to Yaya, he initially looks at Aguero for a potential pass. Aguero seals off Rio with his body (the post-up), Nasri cuts toward Aguero looking to draw in Vidic, and Negredo makes a run into that space. Yaya skips the pass into the post, and Rio does a full shove on Aguero to avoid it, but the concept is there. I've seen that sort of post-up seal a number of times so far this season from City, and been impressed that both Kun and Negredo are strong enough to pull it off. Basically, the ball gets played in to feet of one of the two forwards. At that point you get one cut (like the one Negredo makes here) from inside, and usually an overlap from a fullback or Nasri/Navas outside. It gives City so many options when combined with movement that they get better chances in the final third than most teams might, as it sets up the following possibilities: 1) The post-up man hits either cutter toward the basket for a potential open shot. 2) If the ball is passed to the cutter, they either take the shot, or look to play a low cross into the other cutting player. They can also drag it back to Aguero for a 1-2 as he moves. 3) The post-up man can turn his defender and shoot. 4) If the entire defense drops to track runners, the initial passer can fill the space and take a shot in traffic, or they can pass back out and reset. It's complicated as hell to time right, but City have the knowledge of where the runners are going to be, while the defense does not. When it works, it looks a lot like the super-powered Barcelona run patterns, or a bit like what Fergie had United doing last year. If I see more (especially successful ones), I'll make some more gifs. The other thing I wanted to show is yet another wrinkle that reminded me of Fergie's United attack last season. This sequence from the Spurs match (where Tottenham defended terribly in general), shows how a talented group of moving parts can wreak havoc on opposing defenses.
  It starts with a pass from Nasri on the sideline (I cropped that) to Aguero who cuts in. You see Nasri briefly appear on the right, but he stops and drags his marker up the pitch, which opens the space for Aguero as Walker stops marking Kun when Dawson goes to make the tackle. It's such an easy pass for Negredo at that point, that all Kun has to do is put it away. Lloris does well to stand his ground here and saves the chip, but it ends up being the definition of a "good chance" against an entrenched defense. Also notice Zabaleta making the far-post overlap on the left in case Aguero wanted to pass (and he probably should have), much like I described for the post-up play. Spacing, movement, and talent make this City attack a real handful todeny. Cescy Football Take nothing away from Mesut Ozil, but Cesc Fabregas is the best attacking passer I have ever seen, especially when it comes to throughballs. I watched him rise from a teenager to one of only 2 players in the Premier League to have 20+ assists since 2003. (I only have assist data from 2008 for the other Euro major leagues, and Xavi is the only other guy to post a 20, though I think Misimovic in Bundesliga had one season that would get there on a per90 level.) ANYWAY, Fabregas hasn't played the same position as he did at Arsenal since he moved to Barcelona. Until now. What happens when you combine the best throughball creator in football with Neymar and Messi as his wing forwards? This.
  And this. (Okay, this one is from Messi, and was wrongly called offside.)
  And finally this.
  To be fair, the Valencia central defenders helped quite a bit here, but wow is that a problem. This also occurred three times in three minutes, meaning Valencia had no fucking clue what was going on, despite having seen the same thing sixty seconds before. Barcelona have some weaknesses in the defense again this year, but Fabregas is only four clear chances short of the top mark set in that metric across the entirety of last season. In fourteen games! I've watched a number of Barcelona matches over the last few seasons - I don't remember them attacking in this fashion regularly. It's one reason why I think they are probably more dangerous to good teams than they were last season. Variability in attack is important, and making teams uncomfortable attacking you because you can pull this trick out of your bag is a big bonus. Conclusion This was kind of a test run to see if we could use .Gifs to illustrate tactical concepts. Presumably the images will become better/more useful as I gain any kind of competence with image software. Sadly, we'll never get to the point that Sky or the BBC are with video clips and highlighted players and the like, but maybe we can get close enough. In the meantime, let me know what you think, and also poke me if we talk or write about something you guys would like to see examined in more detail. --TK
10 Points: RvP, Fulham & Arsenal's Defence (week 15)

1) Close Goal Difference
Close Goal Difference = Goal Difference at minus 1, tied and plus 1. I've banged this drum for some time now in various places. Close Goal Difference has an almost perfect (r2=0.95) relationship with points won. Close Goal Difference  Total Goal difference has a weaker relationship with points (r2=0.79).
  Overall goal differential, which includes blowouts and thrashings (Liverpool, City and Norwich), has a weaker relationship with points won. If we solely focus on Close Game State we retain 82.9% of the goal events and throw out the goals scored that likely had zero bearing on how the points were won. None of this is groundbreaking news. Incidentally, Man United won the league in 12/13 with a Close GD that was streets ahead of any other team in the league. 13/14 PL Table With Close Goal Difference
| Pos | Team | Close GD | Points |
|---|---|---|---|
| 1 | Arsenal | 19 | 35 |
| 4 | Man City | 14 | 29 |
| 3 | Chelsea | 12 | 30 |
| 2 | Liverpool | 12 | 30 |
| 5 | Everton | 8 | 28 |
| 8 | Southampton | 4 | 23 |
| 6 | Tottenham | 4 | 27 |
| 9 | Man United | 3 | 22 |
| 7 | Newcastle | 3 | 26 |
| 12 | Stoke | -2 | 17 |
| 11 | Swansea | -2 | 18 |
| 10 | Aston Villa | -3 | 19 |
| 15 | West Brom | -4 | 15 |
| 13 | Hull | -5 | 17 |
| 14 | Norwich | -8 | 17 |
| 17 | West Ham | -8 | 13 |
| 16 | Cardiff | -9 | 14 |
| 18 | Fulham | -10 | 13 |
| 19 | Palace | -11 | 13 |
| 20 | Sunderland | -17 | 8 |
This is how Close GD and Points through 15 games looks. Tottenham and Newcastle are big outliers in terms of more points gained than their Close GD would suggest. Man City's Close GD suggest that they should have secured more points.
2) RvP Sad Face
I desperately wanted a GIF of this situation but a plain 'ol picture will have to do. The picture really doesn't do justice to how dejected RvP looked as he trudged off.  I wonder what goes through van Persie's head in those quiet, reflective moments? Does he pine for 'home'; does he regret his decision to move to Man United? Probably not. But I'm damn sure that a big part of RvP signing for Man United - except for the substantial pay rise - was the chance to work with Alex Ferguson and win trophies. Man United's ability to win silverware seems to have departed when the genius (with every passing game the word genius becomes apt) finally decided to retire. Look at van Persie's face. Look at it! Sorrow, regret, sadness. He looks like a man who left his girlfriend, who was pretty darn amazing and loving, for the hot-hot girl he met in a nightclub. Turns out that the hot club girl is a bit of a dick: nags him when he goes for a beer with his friends, arguments over his failure to fold towels in the correct manner, "football, again?". Ferguson was like the makeup that the hot club girl wears and he made Man United look more attractive and dazzling a proposition than it actually was. Well, it's morning now for van Persie, the club girl has no makeup on and she's not so hot now. Robin may well be wondering what the hell he has got himself into.
3) What Next For United?
This: Villa, West Ham, Hull and Norwich. 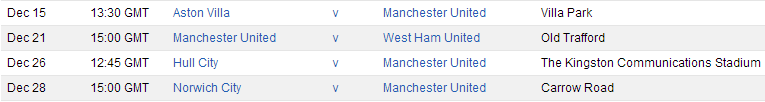 Moyes' world seems to be crumbling. The players look bereft of confidence and belief. Now is really the time for Rooney and (health permitting) van Persie to step up. That pair are Man United's best players and it's times like this - semi-crisis - that a club needs it's best players. This upcoming bunch of fixtures are probably just what Moyes needs. United will be favourites in all 4 fixtures, 3 of the 4 are on the road which may not be the worst thing in the world right now. 9 points form these 4 games would be the absolute bare minimum requirement. 12 points, as unlikely as that seems in current form, may just be possible. This stretch of games which takes us to the end of the year, and the halfway point in the fixture list, will likely define the narrative regarding Moyes and his Man united team.
4) PDO
I love the stat called 'PDO'. A lot of you may not, and you may be highly dubious of it. PDO is team save%+ team Scoring% and it regresses heavily toward the mean on a season to season basis. It has been said before that PDO captures 'luck' or 'non-skill' or simply put, the unexplainable. Hell, maybe PDO captures systems and those who say that a team (non-Barcelona) post PDO's way out of the normal bounds are able to do so because of these systems. Maybe high PDO's are due to the amount of time spent in a winning position? It's possible. This is the best explanation I have seen for what PDO actually means:
@ExtraSkater PDO's really the answer to "are they outperforming shot differential", so it's the key plot here... — Eric T. (@BSH_EricT) December 6, 2013
13/14 PDO's  Arsenal are the big outlier in terms of posting a high PDO. Palace are the team posting the crazy low PDO, but that PDO is regressing. Arsenal are stubbornly holding out for whatever reason. In 11/12 Man City won the league with a PDO of 116.2. City's PDO the next year? 99.16. In 12/13 United won the league with a PDO of ~114.9. United's PDO so far this year? 98.52. My point is: winners of the league, especially if they are runaway ~89 point winners, will likely post a pretty darn good PDO that may sustain for a 38 game spell. But unless you are managed by Ferguson or there is a huge talent gap between your team and the rest of the league it's unlikely that a team can maintain such high PDO's year on year. If we take Eric's tweet at face value then we conclude that Arsenal are the team who are outperforming their shot differential to the largest degree.
5)Regression in Save%
I talked about PDO in the previous point so now let's look at save%. This time I want to focus on the Save% splits. I'm going to take the first 8 games and the next 7 games and look at the save percentages posted in each of those buckets.
| SV% | First 8 Games | Last 7 Games |
|---|---|---|
| Southampton | 88.46 | 50 |
| Liverpool | 82.5 | 66.67 |
| Stoke | 81.58 | 67.57 |
| Tottenham | 80.77 | 65.63 |
| West Brom | 80.65 | 62.5 |
| Chelsea | 79.17 | 52 |
| Fulham | 78.26 | 63.64 |
| Arsenal | 75.68 | 91.67 |
| Hull | 75 | 65.52 |
| West Ham | 75 | 67.65 |
| Cardiff | 74.51 | 75.68 |
| Man United | 69.7 | 68.97 |
| Norwich | 69.05 | 70 |
| Aston Villa | 68.75 | 75.76 |
| Swansea | 64.52 | 65.38 |
| Man City | 62.5 | 71.43 |
| Newcastle | 62.16 | 77.42 |
| Everton | 61.54 | 86.67 |
| Palace | 59.52 | 73.68 |
| Sunderland | 52.38 | 65.52 |
It's worth noting that 18 of the 20 teams saw their save percent regress in the last 7 games back toward (or beyond) the mean. Only Arsenal and Cardiff managed to sustain their high (or low) Save percentages from bucket 1 to bucket 2. Maybe Arsenal and Cardiff employ unique defensive systems. In a way I kinda hope Arsenal are employing a unique and vastly superior defensive scheme in comparison to anyone else in the league. If they were, it would be interesting to analyze and duplicate. Alas, a 91% save% in the last 7 games may be systemic but is more likely to be simply due to variance and the bounces teams sometimes get.
6) Arsenal's Defense
Whilst we are on the topic of Arsenal's save% I'll take a quick look at Arsenal's defensive scheme. This season we have seen a flexible Arsenal: pressing in one game, sitting deep in the next, using possession to swamp opponents in the easier fixtures. Throughout these intelligent and varied tactical setups Arsenal's defense has been mighty impressive. Arsenal's 11goals against is the lowest total in the league. But what do some of Arsenal's underlying defensive numbers look like?
| Metric | # | Rank |
| Shots Against | 172 | 7th |
| SoT Against | 61 | T 7th |
| SoT Prevention% (av ~67%) | 64.53% | 17th |
| D Zone Time | 23.64 mins p90 | 6th best |
| Save% (~70%) | 81.96% | 1st |
Well, not much of that would help us in understanding why Arsenal have the best GA record in the division. Shots and Shots on Target against are pretty meh. Shots on target prevention (SoT against/shots against) is one of the worst numbers in the league. Arsenal are pretty good at not allowing the ball into their own defensive end and, of course, the save% IS OUT OF THIS WORLD. Some of Arsenal's middling shots against numbers are caused by score effects (Arsenal leading a lot of the time) but those same score effects should assist Arsenal in posting a better SoT prevention number than 17th in the league. Maybe a deeper video breakdown would help us to get a better feel for Arsenal's defensive scheme, although I'm not convinced that would turn up anything new. Arsenal are giving up too many shots and too many shots on target for a title challenger, even if those are from a longer distance than the average team posts (my intuition). On the surface, Arsenal's save% is keeping them in the hunt right now.
7) Sunderland
Sunderland, it's been a while since I wrote about you and your crazy antics, but I'm back. James Grayson posted a chart on twitter that looked at Sunderland's collapse in TSR this season. I wanted to follow that up with a few little bits of info.  Paolo Di Canio was fired after game 5 with Sunderland's shots +/- at -5. Di Canio's PDO (see above) was 81.4which is massively under par. Kevin Ball took charge for games 6 and 7 which saw Sunderland tread water. Poyet, the great hope, took charge at game 8 and has presided over a complete fucking collapse of Sunderland's shots numbers (-74 in 8 games ). Poyet's Magic
| Poyet | |
| SOT For | 2.38 |
| SoT Against | 4.38 |
| Goals For | 0.88 |
| Goals Against | 1.75 |
| Scoring% | 36.8 |
| Save% | 60.0 |
| PDO | 96.8 |
Poyet's Sunderland are being killed not only by the shots count but the shots on target count too. Goals for and against? Bad news in those categories too, I'm afraid. But there may be some extenuating circumstances. The Good (less bad) Sunderland's last 4 home games have come against Newcastle, City, Chelsea and Tottenham and yes, boys and girls, that is probably the toughest 4 game-set of home fixtures and PL club will face this term. The Bad Sunderland's last 4 away games have been fairly gentle in terms of away fixtures: Swansea, Hull, Stoke and Villa. In those games Sunderland were -36 in shots, -12 and were outscored 7-0. Overpowered by tough competition at home. Overpowered by weak competition on the road. Poyet will be given lots of time, and we people that stick our noses in teams' business need more time to properly analyse Sunderland. Thing is, this looks like O'Neill's Sunderland and that is not a good sign.
8) Fulham & The Dead Cat Bounce
In finance, a dead cat bounce is a small, brief recovery in the price of a declining stock.[1] Derived from the idea that "even a dead cat will bounce if it falls from a great height" Is Fulham's recovery in terms of results and underlying numbers to be a small and brief one? The new manager Meulensteen will hope that his systems and coaching will be sustainable and can enable Fulham to rise clear of relegation trouble. I'm not convinced this will be the case. Fulham's have a lack of talent, especially in midfield, and this prevents them from controlling games. This lack of control leads to being heavily outshot and, ultimately, without a strong defense, outscored. Meulensteen's target - with the help of a January buy or two - will be to turn Fulham into the team that they were in Martin Jol's early days: a team that is able to beat the weaklings at home and spring the odd rare surprise away from home. That type of results profile may be enough to survive this season which will be a fine outcome as things stand right now. This season, at best, will be a write-off and a steep learning curve for Khan. Fulham have the money and potentially the coach to gradually improve this team.
9) Shots & Shots On Target
This is pretty simple: How well do shots and shots on target correlate with GD? I've formatted the correlations on a week by week basis. Shots on target has always had an edge in terms of it's relationship with GD, but that edge is closing.  It's worth noting that these correlations are a lot higher in 13/14 after 15 games than they were in 12/13. Don't ask me why that is the case beacause I have no idea! The real test for any of these stats is how predictive they are of future performance. next week I'm going to run quite a few charts and graphs on the predictive ability of certain stats using the tiny, and probably deeply unsatisfactory sample of the first 8 games and the following 8 games.
10) Goal Of The Week
There may well have been better goals this week ( Stoke's, Osvaldo's) but the execution, and the importance, of this goal means it's tops for me. Deulofeu scores here because of the pace of the shot and the short back lift.
StatsBomb Mythbusting: Downing Creates Poor Chances
Football is a results driven business and it is very difficult to overlook the goals for and against numbers when assessing a team or a player. For an attacking player to be deemed a success he simply has to contribute to the team’s goal tally, but this results orientated focus can sometimes leave players trailing in its wake; often through no fault of their own. On Saturday morning I read the following tweet from Stephen McCarthy: 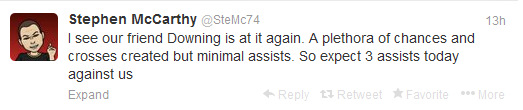 It does seem to be the general consensus that although Stewart Downing creates quite a few chances they are not good quality ones. Assist creation is an unusual task, in that after the chance is created the passer can’t do anything but watch and hope that the subsequent shot is scored. At this point he cannot influence the shot, but his reputation depends on how that shot is finished. It’s human nature to want to be in control of our own reputation, so it seems a little unfair that this is the life of chance creators. If you don’t believe me, ask Stewart Downing. The opening paragraph of this piece from EPLIndex seems to sum up the general perception of Downing:
Most football fans recognize Liverpool winger Stewart Downing as one of the biggest transfer flops in Anfield history. Bought from Aston Villa for around £20 million in 2011, Downing was a part of Kenny Dalglish’s FSG financed summer spending spree that included the purchases of Jordan Henderson, Charlie Adam, and Brazilian goalkeeper Doni. Downing, along with the other new signings, suffered an absolutely miserable start to his Anfield career by all accounts, failing to score a single goal or record a single assist during his debut EPL campaign with the Reds last year.
Downing Chances Created As usual, I have incorporated stats from various providers of Opta generated data and have compiled detailed numbers on Downing’s Key Pass (chances created) from the beginning of the 2011/12 season: 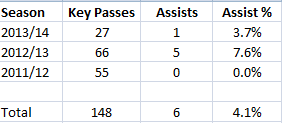 Over the last two and a half seasons, Downing has created 148 shots, but only 6 of them have been converted into goals. This conversion rate of 4.1% is far below the average shots success rate of 9% - 10%. His 2011/12 season at Liverpool was exceptionally poor with the creation of 55 chances but remarkably none of them were scored. It was his lack of returns in this season that prompted the opinion given in the EPLIndex article quoted above. The scoring rate associated with the chances he created last season were much more in line with the league norm, but unfortunately the conversion rate of his chances created this season are once again disappointing. Just 1 goal has been scored from the 27 shots he has set up for so far this season. Given the poor conversion rate it is perhaps understandable that people seem to consider the value of a Stewart Downing Key Pass as being less likely to result in a goal than the average Premier League chance created. The most common reason for this (at least according to my Twitter timeline) is that he seems to cross a lot and there is an assumption that a substantial amount of his key passes create headed chances which, we know, are less likely to result in a goal than a shot from similar locations. ExpG I wanted to go beyond just the raw goal numbers to try to get a better understanding of why the conversion rate on Downing’s chances created is so low. Is he really creating worse quality chances than almost any other player in the Premier League? I’m using the ExpG1 and ExpG2 metrics, created in conjunction with Constantinos Chappas. First of all a brief reminder as to what the two measures represent: ExpG1 – is the Expected goal value of a shot at the time that the shot is ABOUT TO BE taken. This calculation takes into account many factors such as shot location, whether the shot was a header or struck with the foot, the location and type of pass. ExpG2 – is the Expected goal value of a shot AFTER the shot has been struck. This takes into account all of the factors used in ExpG1 but is weighted much more towards the intended location of the shot. A shot that is blocked or off target would have an ExpG2 value of zero (as the shot cannot be scored), whereas a shot aimed for the very top corner might have a probability approaching 1.00. I think it is important to use both ExpG measures in tandem for this analysis. Although we feel that ExpG1 is as accurate an estimate of the probability of any shot being scored, I am aware that defensive pressure is lacking from its calculations. If the mechanics of our ExpG1 calculation were incorrect then it could be possible that we could be returning a higher goal probability than is justified for any individual attempt. In this specific case, perhaps Downing’s chances tend to be given to players who are heavily marked, to players who are given the ball on their weaker foot or to players who are at full stretch and so can’t get adequate purchase on the shot. ExpG1 would not be able to pick this up, but ExpG2 would catch this effect. If a player shoots under a lot of pressure then there is a greater chance that the shot will either be blocked or be harried into shooting wide. Likewise, if a player is shooting at full stretch he may struggle to hit the target. In both of these scenarios the ExpG2 values would be zero as the goalkeeper hasn’t had to make a save and thus a goal can’t be scored. The other main advantage of using ExpG2 is that it controls for goalkeeping performance. The ExpG2 of a shot aimed towards the top corner will be much higher than one destined for the centre of the goalmouth, and the ultimate outcome of the shot (goal or save) does not have an impact on the ExpG2 value. As mentioned earlier, the act of finishing the chance is entirely up to the striker and Downing can have no additional influence on it but it is my assumption that over the course of a season the total of ExpG2 will reflect the quality of the assists. This is because he won’t be creating chances for just one specific player, but rather he will create shots for a spread of his teammates; all of whom will have varying finishing abilities. The use of both ExpG measures can let us objectively look at the quality of chances that Downing has created over the last two and a half seasons and we can go beyond relying on the actual number of goals scored. Downing's Numbers
 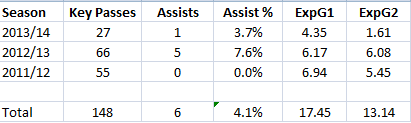 We’ll start with the awful 2011/12 season where we maintain that the 55 shots he created had an expected goal total of 7 at the point the shot was taken and 5.5 after the shots and headers were struck. Somehow, however all 55 of those chances were missed. Downing’s critics will say that there has to be some reason why he could create 55 chances yet not see one of them being scored; it can’t all be down to bad luck. Downing did have one sympathiser in my timeline during the subsequent discussion on Saturday morning:
  For what it’s worth, I too share @The_Woolster (Ben’s) view that Downing was in fact exceptionally unlucky during the 2011/12 season. Remarkably, when taking into account the placement of the shots that came from his passes he should have been responsible for creating 5.5 goals, which would have been exactly 10% of the number of chances he created. Needless to say, there is quite a lot of difference between creating 0 goals and 5.5 goals. So what happened? A very enlightening comparison can be made between Stewart Downing and Chris Brunt using their 2011/12 stats.
 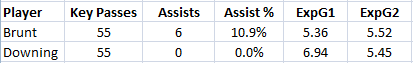 I have chosen Brunt as a comparison as he and Downing are wingers and they both generated 55 chances during that season. The ExpG1 of chances created by Downing was slightly higher than Brunt’s but both players’ chances generated an ExpG2 (probability of a goal being scored when final shot placement is taken into account) of 5.5 over the course of that season. One other interesting similarity is that both players created approximately half of their chances by way of crossing; Downing had 29 and Brunt 28 crosses. So both players had almost identical statistics, apart from the one that matters. The West Brom players on the end of Brunt’s passes managed to convert 6 of them into goals. Unfortunately, during the 2011/12 season Downing’s Liverpool teammates weren’t nearly as efficient with his chances. I appreciate that those numbers may be difficult to accept. How can two players generate chances that have the same aggregate probability of being scored yet one player sees 6 of them converted (which is almost exactly in line with expectations), and the other zero? I think that the following shot placement plots can help us understand this. These shot plots show the shot placement for every non blocked shot that resulted from the players’ key passes. Brunt
 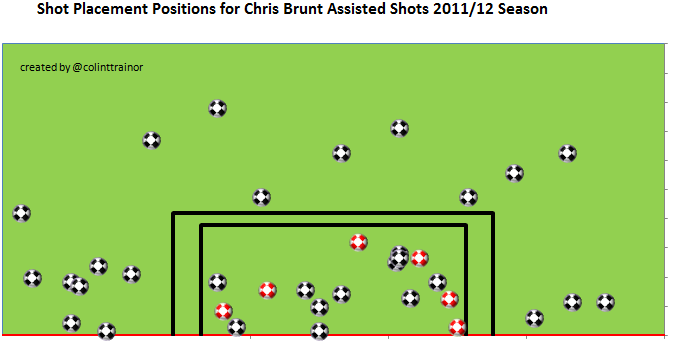 Goals are signified with red coloured balls and we are viewing the goalmouth from the striker's viewpoint. Downing
 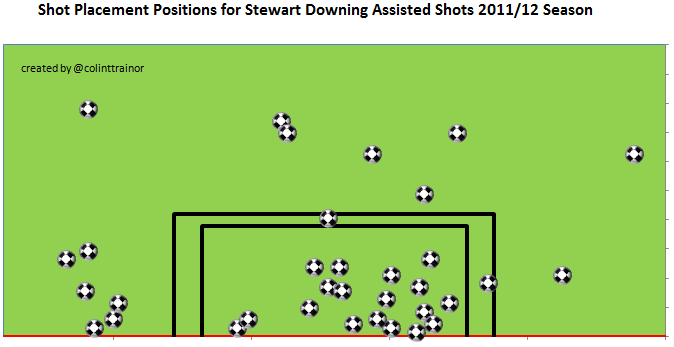 Common wisdom would suggest that as Downing was 0 for 55 the chances he created must have been of low quality. I think that the above plots suggest that this was not the case. 19 of the shots Downing created were on target and a further two hit the woodwork; quite a few of the shots were hit centrally but opposition goalkeepers were made to work and that shot pattern is definitely not consistent with a return of 0 goals. Compare that to Brunt’s output. 18 of the Northern Irishman’s chances were put on target and 6 of them were scored. This in itself is not remarkable as the percentage of on target shots that are scored is approximately 30%. What is more remarkable is that Downing seen his strikers go 0 or 19 on their shots on target. Other than looking at each of the 55 chances Downing created on tape I have done all the analysis I can using the available data, which I think is enough to suggest that he was exceptionally unlucky in the 2011/12 season. The ExpG2 for the shots he created suggested he should have provided 5.5 goals and the subsequent shot placements for those chances confirmed that a return of that magnitude was indeed deserved. Unfortunately for Downing, it seems that people need to see goals being put on the scoreboard to appreciate the chances that players create. I would contend that his return of zero goals in 2011/12 was simply due to variance and not that the chances he creates are somehow less valuable than the average Premier League player. No discussion is required for the 2012/13 season as the chances he created were converted roughly in line with what our model predicted for him; 5 goals versus an expected total of 6. Current Season Then we arrive at his numbers for 2013/14; and they aren’t good. His 27 key passes have created just 1 goal, compared to an ExpG1 value of 4.4 and an ExpG2 total of 1.5. From my point of view, the difference between the two ExpG metrics is worrying. At the point the shots are about to be taken our model has expected 4 goals, yet as soon as the shots have been taken that goal expectation rapidly drops to just 1.5 goals. It’s therefore no surprise to see that only 1 goal was actually scored from Downing’s key passes in the first 14 weeks of the current season. It is a possibility that the decrease in goal expectation is as a result of chances that aren’t as strong as they appeared to be on the ExpG1 measure. However, after demonstrating that in the previous seasons Downing’s chances were no worse than our model initially suggested perhaps there is another reason why the chances he is creating are being finished so poorly this season. Last summer Downing made the move from Liverpool to West Ham, and in many games this season West Ham has found themselves playing without a recognised striker. Even when they have started with a forward the injury to Andy Carroll has meant that the player handed the start probably isn’t Sam Allardyce’s first choice option. Here are the attacking numbers for West Ham this season:
 ![]() Although the scale of the decrease isn’t quite as marked when looking at West Ham as a whole, we see that the Hammers have big problems in front of goal. Perhaps the lack of a main striker or the attacking strategy that West Ham employs can explain the very large decrease between ExpG1 and ExpG2. Either way, this decrease (the largest in the league) clearly shows West Ham have performed abysmally in converting the chances they have created. So where does that leave us with Downing in the 2013/14 season? Unlike the previous two seasons, there could be cause for claiming that the chances he has created this season have been poor. However, when I parlay the fact that he did create good quality chances in the two previous seasons with the wider shot conversion issue that is unfolding at Upton Park this year then I’m tempted to give him the benefit of the doubt for a little while longer. However, there is one thing that I am sure of. His return of 0 assists in 2011/12 for Liverpool was not down to the poor quality of his chances but rather was attributable to some bad luck, poor shooting and excellent opposition goalkeeping performances. Unfortunately for Stewart Downing, it doesn’t take much to earn a reputation; deserved or otherwise.
Although the scale of the decrease isn’t quite as marked when looking at West Ham as a whole, we see that the Hammers have big problems in front of goal. Perhaps the lack of a main striker or the attacking strategy that West Ham employs can explain the very large decrease between ExpG1 and ExpG2. Either way, this decrease (the largest in the league) clearly shows West Ham have performed abysmally in converting the chances they have created. So where does that leave us with Downing in the 2013/14 season? Unlike the previous two seasons, there could be cause for claiming that the chances he has created this season have been poor. However, when I parlay the fact that he did create good quality chances in the two previous seasons with the wider shot conversion issue that is unfolding at Upton Park this year then I’m tempted to give him the benefit of the doubt for a little while longer. However, there is one thing that I am sure of. His return of 0 assists in 2011/12 for Liverpool was not down to the poor quality of his chances but rather was attributable to some bad luck, poor shooting and excellent opposition goalkeeping performances. Unfortunately for Stewart Downing, it doesn’t take much to earn a reputation; deserved or otherwise.
Podcast 8 - Who Gets 4th in the EPL plus a Man City Breakdown
Podcast number 8, also known as the one where Ben says mean things about most of your teams. He loves hatemail, so feel free to bombard him with it.
Score Effects
One of the most crucial findings of the nascent football analytics community was the discovery of shots ratios and their powerful predictive power. The discovery that year-on-year shot differential at the team level was repeatable, and largely skill driven (86% skill/14% luck), enabled the community to write and talk about a teams dominance without having to refer to league points or placings.
Football was merely catching up with what hockey had known for a number of years.
Shots Ratios/Differentials are, in general (obviously there are exceptions), a proxy for something else - control, territory, scoring chances and they tell us some, but not all, about a teams underlying dominance over it's it's opponents and it's fixture list. A team that takes 60% of the shots in it's games will, over time, be more successful than a team that takes 30% of the shots.
But there's a problem with using basic shots numbers as a cast iron indication of dominance and that problem is called goals. Specifically the effect that the scoring of a goal has on the dynamics of a game.
The team that takes the lead in any given fixture is likely to sit a little deeper and take fewer shots. The team that is trailing will attack more and take more shots - especially as time begins to tick down. The wisdom of this strategy - tactical or subconscious - is questionable, for what team would willingly choose to cede territory and concede an increasing number of shots?
In this post I'm going to present some numbers on Score Effects which will show what teams do when leading or trailing by a goal and why those teams employ the seemingly odd strategies that they do.
*Note: I wish I had more data to use but my database melted into oblivion over the summer. Alas, we have 13/14 season to work with.
TSR
Our entire sample is tens of thousands of minutes of football and nearly 3500 shots. But the crucial game states to look at are those which fall under 'Close': minus 1, tied and plus 1. This is where 85% of game time takes place, 83.9% of all shot events take place and it's also the where we see the best examples of how goals lead to score effects.
I have included all game states in the following charts, but as stated above we are really only interested in the game states which fall under Close. The sample size of +3, +4 etc just isn't big enough to draw any conclusions.
This is Total Shots Ratio (shots for/shots for+shots against) and straight away we see some things of interest:
- Tied TSR is 50%.
- Teams at Plus 1 get out-shot by a decent margin 46.6% to 53.4%.
It's a curious thing but teams who are leading by a goal tend to construct something that is called a 'defensive shell' that sees the leading team, in most cases and especially away from home, tighten up their defensive shape and drop deeper. For the leading team preventing an equalizer is more valuable than trying to score a second goal. All these things lead to the team at plus 1 losing the shots battle and the team at minus 1 winning the shots battle.
We often hear of managers who want their teams to play the same way when winning as they do when they are losing, but the data says that this doesn't actually happen (except for a few elite clubs). Why do teams play differently when leading? It could be tactical or it could be a collective response from players who are risk averse and want to protect the slender lead.
Quick Hit: Team trailing at -1, on average, tends to out-shoot their opponents due to a mix of their own desperation to equalize and the leading teams' tactical conservatism in protecting their game position. Why are teams out-shot when leading by a goal?
Shots On Target Ratio

This time we are looking at shots on target. Similar results are evident:
- Teams at +1 lose the shots battle 47.85% to 52.15%.
Teams who lead by a single goal (plus 1) are out-shot by TSR and SoTR but the shots on target battle is a little closer:
| Minus 1 | Tied | Plus 1 | |
| TSR | 53.36 | 50.00 | 46.64 |
| SoTR | 52.15 | 50.00 | 47.85 |
The table above likely shows some of the positive effects of a defensive shell. Yes, the leading team gives up an increased number of shots against and thus sees it's TSR suffer, but in defending deeper in a more compact shape it's shots on target ratio doesn't deflate to quite the same extent. Two reasons why, at plus 1, SoTR is higher than TSR:
- The defensive shell works and forces the trailing opposition team to take shots from increased distances, from worse angles or under more pressure with less space. The pressure, the bad angles and the increased distances all contribute to the leading team being able to prevent a higher number of the trailing teams shots from finding their way on target.
- The leading team is able to exploit the desperation of the trailing team and counter attack into more space with fewer defenders present. That space and lack of defensive pressure leads to a higher percentage of the leading teams shots to find their way on target.
Quick Hit: Teams trailing at -1 shoot their opponents by shots on target but the margin is smaller than when looking at total shots.
Shots On target Percentage
Complete for/against chart with SoT % rating.

This chart shows us the percentage of team shots for that end up on target. In the section above I talked about the space and lack of pressure the +1 team faces when attacking and we see the effects in this chart.
Plus 1 SoT% is 34.93% which is a touch higher than the number teams post at minus 1. The reasons for this can be seen in bold above. It's pretty simple really, trailing teams find it harder to post good Sot efficiency numbers due to the leading teams shell. There may also be a touch of desperation to the trailing teams shots selection.
The trailing team also cheats for offense which leaves them open to effective counters.
Quick Hit: Team at +1 (and further) receives a boost in SoT For% & SoT Prevention%. Team at -1 suffers a decline in comparison to plus 1 in both Sot For% & SoT Prevention%.
Scoring%, Save% & PDO

As stated previously, any information outside of +1/-1 is likely too small a sample to be trusted at this point.
Close Game States contain ~84% of the shots information so we shall focus on close. It's also worth noting that there is massive variance in sc% and sv% in small samples (see Arsenal's scoring% at tied which is contributing to the high league Tied sc% for an explanation).
Scoring%
Scoring% at plus 1 sits at 29.8% which is significantly higher than scoring% at minus 1. Again, the leading team, in general, attacks into more space with less defensive pressure so it's no real surprise to see plus 1 scoring% so much higher than scoring% at minus 1. Minus 1 scoring% runs into that defensive shell - lots of bodies/pressure/little space - and suffers for it.
Save%
We see a boost for the leading teams save% (defensive shell, forcing shots to the outside). Save% at minus 1 is significantly when compared to plus 1. The trailing team may well be cheating for offense which leads to a higher percentage of shots against actually getting on target. That same cheating for offense may also contribute to a lower save%.
PDO
Add the scoring% and save% numbers together for each individual game state and we end up with a PDO rating. PDO gets a pretty big boost at +1 and a pretty sharp drop at -1.
Goal Share %
The final graph is the most telling. Things we know so far: The trailing team is the stronger by the shots count but weaker in terms of efficiency and conversion percentages. The leading team has a tactical advantage in that they have possession of the lead, can tighten their defensive shape and in attack capitalize on the trailing teams desperation in trying to find an equalizer. For the leading team, not conceding an equalizer is more valuable than scoring a second goal, and that tactical mindset is evident in all of the charts above.
The result of all the things we have looked at can be easily summarized: The leading team (+1) scores 52.94% of the goals and concedes 47.06%. And that is despite being out-shot by both total shots and shots on target.
Tactics - defensive shape and counter attacking threat - actually matter a hell of a lot to the team that is leading by a single goal.
Those tactics reduce the oppositions efficiency and conversion percentages while boosting their own efficiency and conversion percentages. The result of those tactics is a greater likelihood that the next goal of the game will be scored by the team already leading.
Notes & Further Questions
I'm far from happy that I can't publish a study on score effects that features a far larger data sample but I felt that score effects and game states had begun to feature in my work to such an extent than an explanatory post on the topic was necessary.
Some of these numbers may well change over the course of the season, or over the course of the next three seasons but hey, I felt I had to address the topic. The question of shot quality is a hot topic in football analytics these days. The question of how much shot quality matters needs to be answered, and it will be.
But I do wonder to what extent scoring or save% boosts at +1 and +2 game states can sometimes skew our interpretation of teams' overall numbers. We know 'good' teams can sometimes sustain PDO's north of the league average. Is that sustain positive proof of an ability to create better chances (shot quality) and prevent quality chances against or is it merely a function of the boost that good teams receive by spending a lot of time in winning (+1, +2) positions?
Are Arsenal's and Liverpool's save percentages indicative of a well rounded defensive scheme no matter if the scoreline is in their favour or not?
Or are those teams save percentages and defensive schemes boosted by spending above and beyond an average of 45 minutes per game in a winning position?
Teams with good attacking and defensive schemes tend to find ways to get into the lead more often that not. Not all of a team X's impressive conversion numbers are due solely to score effects but some of it may well be.
On a individual player level who's to say that what looks like a sustained shot quality ability isn't just a function of playing on a dominant team who spend a huge chunk of their games in a positive game state?
Scoring becomes easier when your team is winning by two or three against demoralized opposition.
Lots of questions, more miles to be covered.