Does Your Manager Suck? Let’s Find Out!

One of the things I’ve been mulling over recently is how team stats are both a reflection of the players and of the man in charge. Even in this era of unprecedented player power, a team's manager still picks the team sheet, and players generally need to do what the manager wants in order to stay in the lineup.

But when it comes to managerial evaluation, more than anywhere else in football, it is incredibly hard to divorce personality from performance. Managers who are grumpy gits with no sense of humor get away with far less than the slick salesmen whose performance is never more than average wherever they land. Strong tactical, technical managers who aren't that great with the press often seem less fondly remembered than their less successful, but smoother talking counterparts.

How can analytics help with regard to manager evaluation, and better separate the good managers from the bad?

It’s All About the Money Money Money

One popular use of analytics in managerial evaluation is comparing team spend vs. manager performance. The theory here is that the league table should approximately represent the value of the various teams, and managers that over or underperform how much money has been spent on their squad are interesting. The issue I have with this type of evaluation is that it is a) slow, and b) muddy. Is one season enough to tell if a manager is doing a decent job compared to wage spend? What if they take over a squad that is horribly meshed to their preferred style and have to spend an entire year transitioning?

You can look back at past performance and create a delta variable versus how a manager was predicted to fare, but to me this analytical method just isn’t that useful.

Points Per Game

This is the other evaluation tool I see commonly used, especially when comparing across leagues. It’s useful in that managers move around during the season, and this type of evaluation removes the direct team association, so you can find out things like Dougie Freeman was really good at managing 3 different teams last year, even if the one he ended up at did not get into the playoffs.

The problem with this is that it’s basically a floating, managerial league table. I would prefer something a bit more divorced from direct team performance, since as noted above, there are a lot of muddy factors that go into that.

Even if you’ll never be able to remove manager performance from the teams they managed, maybe we can come up with something more descriptive that allows us to look at performance overall, crossed with performance in different areas of the game, to help us better highlight strengths and weaknesses.

Is the Manager At Least Better Than Average?

In this methodology, we evaluate managers much in the same way we evaluate players – by comparing them to their peers. But instead of rate and counting stats like we use with players, we can compare team performance in some key areas against long-term league averages to find out if a manager is performing better or worse than the other guys around him. Today I want to quickly investigate three key areas.

1)      Shot Dominance

This is a metric we use to distill the basic battle of football – is a team generally taking more shots than their opponent? If they are, they will be posting a number over 1, and if they are dominated in this area, the number will be less than 1. Stylistically, teams that are posting numbers quite a bit over 1 are very good at doing the basic, yet extraordinarily important task of shooting more often than their opponents.

2)      Shots on Target Conceded

The second metric for evaluation is to look at how well a manager coaches the defense, and we do this by looking at how frequently the team concedes shots on target versus the league average. Conceding more shots on target than expected likely means your defense has some organizational issues (and or is bad at limiting errors). Conceding fewer shots on target than expected is usually the sign of a well-coached, tightly-organized defense. Basically, this adds a quality control layer to shot dominance.

3)      Shots on Target

The final metric I want to look at today is Shots on Target for the offensive end. Creating more shots on target than expected is a combination of talent and efficient offensive systems. Creating fewer shots on target than expectation is a sign that players are likely being wasteful with the ball, shooting from bad positions, or creating offense in a way that is less efficient than other teams in the league. This is a second quality control layer added to shot dominance, both of which can be highly influential in determining outcomes.

Any one of these metrics is interesting by themselves, but when combined they should provide a reasonable evaluation metric for the type of system a manager has instituted (ShotDom), how well they are coaching the defense compared to the rest of their league, as well as how efficient their offense is at creating +EV shots.

If this way of evaluating managers is decent, we should also see noted good managers at the top of the metrics, and managers who are not very good filter to the bottom. If not, all we’ll end with is a bunch of noise.

At the end of the day, numbers are boring to most people, so I’ve tried to be helpful and color code performances in each category that stand out compared to league average. Green in all three metrics is very good. Green in two out of the three categories is also very good, especially if that third category is just neutral.

Red in just one category is not great and a sign of things to be improved (or possibly systemic tradeoffs), while red in multiple categories is objectively bad. It’s a fairly clear sign that the manager needs to coach the team to do things better in multiple areas of the pitch.

A quick caveat: even the best managers are limited by the talent at hand, and good or bad talent will heavily skew some of these metrics. Managers manage groups of players, and their performance and the performance of the team is the result of what those players do – it’s impossible to completely strip out players from managerial evaluations, and teams with the most talent will also tend to be near the top of these tables.


EPL

PL_manager_eval


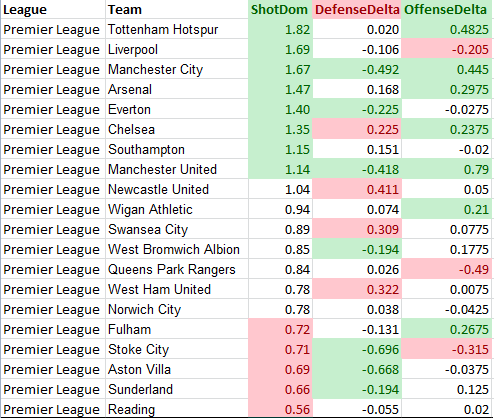
There were only two teams in England with green across the board, and both of them resided in Manchester. Spurs, Arsenal, Everton, and Chelsea show up with double greens, though it is worth noting that both Arsenal and Chelsea were bad at limiting shots on target versus expectation. This is either a sign that they need better defensive personnel starting most of their matches (Arsenal still commit a ridiculous amount of defensive errors each season), or that the defense could use better coaching. At the other end, Stoke were tremendous on the defensive side of the ball, but stylistically poor and offensively stunted. Reading were neutral at the offensive and defensive stats, but they were dominated time and again and the onslaught forced them down. QPR are interesting, because they weren’t terrible in style or in allowing too many shots on target versus expectation, but a second year in a row of absolutely terrible offensive performance saw them relegated as well. That Shots on Target number was actually an improvement on how bad it was over the Christmas holiday – maybe Remy just arrived too late.


Bundesliga

bundes_manager_eval

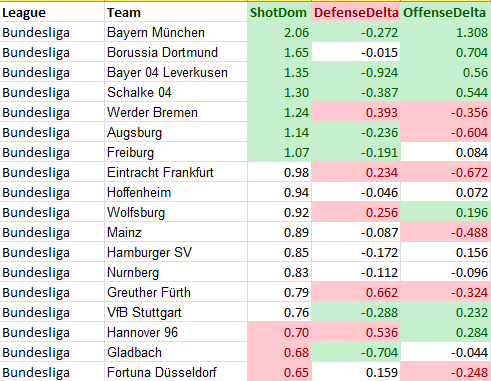
There were three full green clubs in the Bundesliga last season, with Munich obviously leading the way. Dortmund were defensively neutral in SOTCON, but they gave up under 10 shots a game, so there’s no doubt Klopp is amazing as well. Unheralded Freiburg were double green + neutral on offense, while Stuttgart were double green + neutral as well, but their shot dominance number is right at the cusp of being red. They need to play a more dynamic, positive style to get a better performance overall in the league.

Werder Bremen can officially be dubbed a hot mess. They are doing the systemic thing surprisingly well, but there are flaws in execution hidden at both the offensive and defensive ends.

At the other end, Greuther and Fortuna are nearly both triple red, and it’s no surprise they were relegated. What does come as a surprise is how well Frankfurt and Hannover fared, when these metrics would figure they should be much further down the table. I would expect significant regression this season if those two teams perform the same across the board.

Serie A

seriea_manager_eval

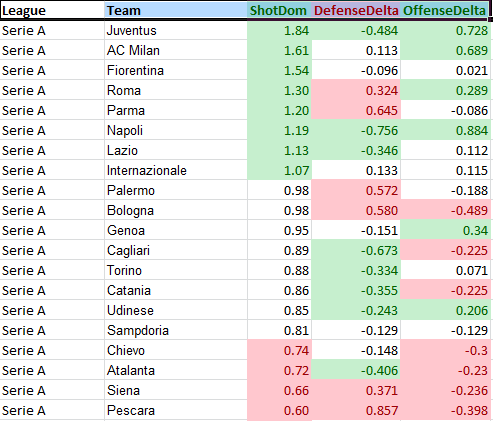
Juve and Napoli are both greened up. Considering Mazzari jumped from Napoli to inter this summer, that should mean good things for the Nerrazzuri, whose Shot Dom was basically neutral and whose defense teetered on bad last year. Even if their talent were the same, I’d expect Inter to be a lot better this coming year due strictly to managerial benefits.

Milan, Roma, Lazio, and Udinese are double green in Serie A, but Roma has the expected defensive problem that comes with Zeman, while Udinese lost the shots battle pretty regularly.

At the other end, Siena and Pescara are both red washouts and were unsurprisingly relegated. The other relegated team was Palermo, who actually did okay in shots dominance, but were awful in defense, and anemic in offense (their offensive number is right on the edge of the red cut off). Atalanta, Chievo, and Bologna sit deep in the double red zone for next season, and need to make significant changes to avoid another relegation fight.


La Liga


laliga_manager_eval


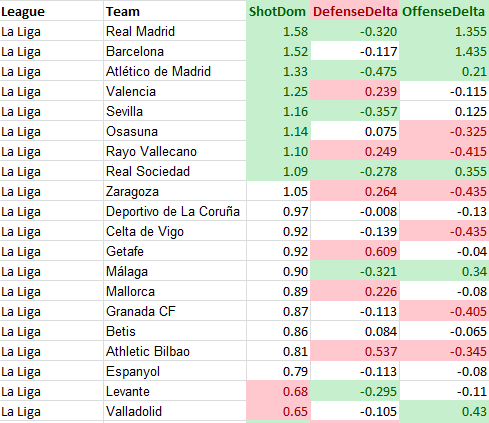
Finally we come to Spain. Both Madrid teams are fully green, Barcelona is nearly so, and scrappy Champions League qualifiers Real Sociedad join them. Except Sociedad’s manager never quite got along with the board at Sociedad, and jumped ship to Rennes this offseason. I have no idea how they will perform this year, as their new manager is a former youth and assistant manager who was promoted from within the club. That should make for a fun analytical experiment though.

Sitting in positive double green territory were Sevilla and Malaga, the former of which switched managers during the season, and the latter of which lost Pellegrini to Manchester City this year. Hrm.

Much like Werder Bremen in Germany, Rayo are also a hot mess.

La Liga didn’t have any red washouts, but Bilbao were close, while Zaragoza had a positive style, but were below league average on both the offensive and defensive metrics. Bilbao’s goal differential was actually fourth worst in the league, but they managed to finish a comfortable 12th despite that. Spain’s other two relegated teams were Deportivo La Coruna (a rare all white relegation), and Mallorca (bad defensively, negative in offense as well, but fairly neutral in the shots battle.

Conclusion

Obviously people will make their own judgments, but I find this method of evaluating manager performance far more interesting and descriptive than either performance vs wage spend or the basic points per game evaluation.  To me it gives you a much clearer idea of managerial strengths at weaknesses (especially when measured across multiple seasons), as well as some suggestions about style of play folded in.

Feel free to let me know what you think on Twitter or in the comments though. This is just a first crack at a different way of looking at whether your manager is any good or not, and who you should probably be buying if you have a vacancy to fill.

--TK

Things We Think We Know About Football – July 2013

Some days it’s good to take a step back from the daily deluge of information and try to organize what you think you have learned recently. I’ve been writing regularly on football analytics for about six weeks now (and off and on for seven months), and I’d say half the topics I’ve covered are based on poking around the data, and the other half are riffs on insight from other writers. I certainly feel a lot smarter about the game and about analytics than I did before, but what do I really know? And more generally, what do people in the analytics community think they know about the game that maybe they didn’t a month or two ago? Crosses Are Bad There are a couple of references for this that I really like. The first ones are from WillTGM, who looked at crossing generally as well as in the context of Liverpool, last summer. Will’s task was to look at whether Liverpool chose to play a heavy-crossing game tactically the year Kenny Dalglish was fired, and then to investigate whether that type of tactical choice is particularly effective at generating goals. I’m linking to the whole category of pieces he did, because they are really well written, explore a number of different aspects, and should basically be required reading for anyone interested in the topic from an analytics perspective. Will concludes that open play crossing is extremely difficult (20.5% accuracy vs. nearly 34% from set pieces), and that most teams aren’t very efficient at converting them into goals. Liverpool did indeed choose to cross the ball an awful lot that season, but goals did not pour in as a result. In general, nobody is effective at turning crosses into goals. (I’m shortchanging the work a bit here when I summarize – he covered all sorts of useful stuff. Just go read them.) theowalcott_crossThe second one is from @footballfactman, looking at Theo Walcott’s crossing, which is deemed a) generally inaccurate and b) surprisingly devastating. Paul digs a little deeper and discovers that most of Walcott’s assists are from short (presumably low) crosses and pullbacks. In fact, from having watched Arsenal constantly, I would guess the majority of Theo’s crosses period have been low and hard, and he had an almost psychic relationship with RVP and that near post run. This is dramatically different from what you would typically get from Golden Balls or Leighton Baines. Because of this style, they are easier for defenders to simply cut out and clear, but they also result in a reasonable amount of goals when completed. It would be interesting to see how many of the cutouts from this type of pass result in possession going right back to the attacking team, since they don’t see very controllable. The point here is that crossing is really hard. Even Baines, who is one of the best in the Premier League at completing them, only succeeds in finding a teammate 30% of the time. Headed Shots Are Bad This one is fascinating because if you do the surface analysis, it looks like this. heads1_colin That image is taken directly from Colin Trainor’s seminal examination of the subject , and if you stop at the surface examination you suddenly think “WOW, headers are the way to go. They are just as accurate as ground shots, they are three times less likely to be blocked, 10% less likely to be saved (based on percentage comparison), and 33% more likely to score a goal. Those numbers are massive!” Not so fast, my friend. This… this is the area where good, detailed analysis comes into play. When controlled for location as Colin did, headers are considerably worse at scoring than ground shots in every single spot on the pitch. The only thing that makes headers look so amazing is that they are all taken relatively close to the goal. Meanwhile, ground shots come from everywhere (even though they shouldn’t - that’s a topic for a different day). Headed Passes Are Bad Too This one came up as a result of the piece I wrote complaining about how big forwards don’t fit into Arsenal’s general strategy, so why does Wenger keep buying them?!? Anyway, it sparked a bigger discussion that not only deserves its own article, it also indicates a need to change the way we break out and display passing stats. Here’s the quick hit:

Player Ground PS% Ground Pass Head PS% Headed Pass Total PS%
Giroud 77.9% 430 39.3% 234 64
Dzeko 79.5% 517 32.1% 131 69
Ibrahimovic 78.5% 1165 41.4% 111 75
Van Persie 86.4% 831 39.6% 91 80
Lewandowski 78.9% 560 42.3% 123 72
Carroll 81.8% 340 38.6% 321 61

*pause for effect*

Headed passes from forwards are half as likely to be completed as ones on the ground.

There is sense to this. The hits that players take when trying to head the ball would be instant fouls if anyone did the same when they are standing on the ground. Additionally, the quality of the aerial ball itself is so much more important than the quality of a ball played to your feet. A headed pass is a first-time pass, every time. Oh, and unlike a pass along the ground, the trajectory of the ball now exists in three dimensions instead of two. Heading is just really bloody hard. Andy Carroll has nearly equal amounts of attempted passes with his feet as his head - of course he's going to look terrible. Maybe the problem isn't with passing skill with the big forwards, maybe the problem lies with the approach? Obviously it’s an important part of the game, but heading the ball simply isn't something you want your offensive players to do a lot of if you can help it. Passing Bleed Is Bad I discussed this in brief when I talked about Olivier Giroud at Arsenal, but it deserves application on a broader scale.  Central midfielders pass the ball 50 to 80 times a match. A 5% difference in player completion percentage is 3-4 passes a match. A 10% difference means 6-8 more failed passes in the central midfield, and at that point it really starts to matter. It also has a trickle-down effect into what kind of passes your team has to make to be safe, and what kind they are capable of making to attack (think long, diagonal balls to wide forwards on the counter-attack). Passing percentages vary widely due to tactical considerations, but if you control for those types of things, you want the best passers possible all over your squad. Choosing a player with a 5% lower success rate that makes up for it in other areas is fine, occasionally. However, 5% worse across an entire team that passes 500 times a match results in 25 more possessions for the opposition, every game. Lesser passers bleed away possession to the opposition, and eventually that bleeding will lead to goals. Football is Inherently About Percentages It’s true, and the game does not give a damn whether people care about this or not, because it is imposed as one of the basic structures of playing football. I know that’s statty/geeky as hell, but it is a simple, obvious truth. The sooner this is accepted, the sooner people can go about applying the principles to make their teams better. Conclusion: Strategies that revolve around crossing and heading are hugely inferior strategies. Look, this isn’t my conclusion, this is what math says. Crossing is hard. Heading is hard. Passing the ball as a header? Also really hard. So why would any manager choose to do it regularly? I have two theories on this, from two different angles. 1)      This approach makes sense if it is rare and teams are unprepared for it. If the vast majority of the league plays normally, and your squad employs a physical, aerial approach, teams may be uncomfortable playing that style of football and you have an advantage. However, once a number of teams play this style, counter-strategies (like putting four centerbacks in the lineup across the back line and/or playing all your tall players) come into play that destroy this. 2)      It’s cheaper to play this way than competing with other teams for “normal” players. I might believe this if I didn’t see how much Sam Allardyce and especially Stoke had spent on players in the last five years. So uh yeah… I don’t think either of my theories make logical sense anymore. Therefore I honestly don’t know why any smart manager, and especially an analytically savvy one, would choose this avenue for their team. Mixed Strategies Are Not Only Good, They Are Vital So this is where it gets tricky. Crosses are bad. Balls in the air are bad. Headed shots are inferior to ones on the ground from the same location. BUT

Image from thetimes.co.uk
You need to be able to perform all of these at a reasonable level in order to make your opponent respect they are part of the arsenal. You need to threaten from wide to keep the defense from simply packing the box so tightly nothing ever gets through.  You also really need to be able to head the ball well to have a chance at scoring goals from longer free kicks and corners.  So even when they aren’t deployed as a primary avenue of attack, these things need practice, and work, and players who have the skill to turn them into threats. However, when you bring it back to percentages, they don’t have to be the primary or even the secondary options. You need to enact them just enough that your opponents don’t know what’s coming all the time. The interesting thing is, when applied in this fashion, the effectiveness of these lower percentage plays often goes up. Teams get so focused on shutting down the central passing and lateral movement, that they overbalance and leave the break to the byline open. Suddenly defenders are scrambling to prevent a free break on your keeper, and the cutback to the penalty spot is completely open. Central defenders’ legs get tired from chasing speedy guys around for 75 minutes, and they no longer defend aerial crosses to the far post as well. Chicharito/Dzeko have a late-game feeding frenzy. The short corners you keep taking pull out not just one, but two extra men from the box, and that was the guy that was supposed to mark the player on your team who just got an open header. So yeah, all those things listed above are bad, but… you can’t just play it on the ground all the time, or your team becomes predictable and easier to stop . Mixed strategies aren’t just recommended, they are vital when it comes to success. This is true whether your team is trying to pass the ball into the back of the net every game, or whether your manager has procured Andy Carroll as the pack horse for their own special brand of hoof ball. Brain dump, finished. Class dismissed! --TK

Holy Shit, Football Is A Game Where Every Team Plays the Percentages

I haven’t written this article yet because my brain has been chewing its cud here for some time. It's not hyperbole to say this is the single most important concept guiding my analytics research and the way I think about the game. It is addressed with the briefest of kisses in the Giroud article, but it’s a topic you can write a book on and someone, at some point, almost assuredly will.

As the title indicates, everything in football comes down to actions, and how successful you are at completing those actions. In short, percentages. We never think about it this way, but just by playing football, you are inevitably throwing yourself into the hands of the probability gods, and the only way to push them to guarantee your favour is to create better percentages.

Confused? Don't be... there are examples bloody everywhere.

The average team completes something like 400 passes a game. Barcelona at their peak have averaged over 700. A misplaced pass ends a possession, so you can only chain passes together by completing them. Simples.

A 5% passing difference across your squad results in 20 extra possessions for the opposition in an average team. For Barcelona, it would instead result in 35 extra opposition possessions (though at a certain point, they won’t have the ball enough to complete all of those passes, so the possession and passing numbers go down). I don't have the numbers for what percentage of possessions result in a shot at hand, but the chain of consequence is fairly easy to see. Missed pass, lost possession, opposing shot, opposing goal. Trickle, trickle, trickle.

If the other team doesn’t have possession, they can’t score, but the only way you can keep possession is to keep completing passes. On the other hand, the only way you can score, is to complete forward passes, preferably in the final third. If you don't complete passes in the final third, bad things will happen, even to great teams. This image from the Champions League semifinal will likely remain one of the most incredible and indelible pictures in modern football.


barcelona-passes-against-bayern-home-and-away

In the match in Munich, where Barcelona had 66% of the possession against the best team in Europe, Munich completed 81% of their passes. They also somehow erected a brick wall stretching across the entire 18-yard box that Barcelona simply could not break through. This enabled Munich to take 15! shots against Barcelona and  7 of them on target. Barcelona only managed 4 shots total. Final score: 4-0.

Let's push out a bit and look at important percentages across a season. Liverpool shot the ball nearly 20 times a match last season. However, they were 6.4% worse at shooting the ball on target than Manchester United. Multiply Liverpool’s shots per game times United’s shot percentage and they likely would have ended up with 85 goals scored and 43 conceded. That’s a goal difference of 42, or one less than United posted in winning the title. Liverpool almost assuredly would have qualified for the Champions’ League.

Flip it around. Aston Villa were really bad at conceding shots last season, but they were surprisingly good at not allowing them to be on target, coming in third in the league at 28.5%. Wigan gave up 2.7 less shots per game, but 33% of shots against them were on target. If Wigan’s SOTCON% was the same as Villa’s, they would likely have conceded 7 fewer goals on the season, giving them a goal differential of -19. That probably would have been good enough to stay in the Premier League.

Every game has thousands of actions per team. Every season has hundreds of thousands. Even comparatively small percentage changes in critical areas (like putting shots on target, or final third passing percentages) add up quickly, and will make the difference between success and failure.

Efficiency absolutely matters.

So when you see me gush about how good someone like Marco Sau is at putting shots on target, this is why. And when I express discomfort at how Alvaro Negredo's passing percentage or shots on target is below the level I would be interested in for his price, that’s also why.

Teams can win with different strategies – there is still no single “right way” to play football. However, because playing football means inherently playing the percentages, the one thing that they absolutely must focus on in all of the important areas, is to do things efficiently.

Thinking about it... I guess teams can also choose to do things inefficiently. They just can't claim surprise when they don't turn out how they expected them to.

--TK

What the Hell Are We Doing? Goals and Transfer Shopping

ss_moneyball_gunshipToday’s piece is inspired by the early summer transfer signings. The goals in the title don’t refer to actual goals that are scored on the pitch, though that’s what I normally write about. Today, the word “goals” is referring to team milestones. Literally, what is your team trying to accomplish this year? Are they simply hoping to survive in the top tier of football? To snuggle deep into mid-table obscurity? To compete for a spot in Europe? To get into the Champions League? To win the Champions League? All of those goals have different requirements in terms of what kind of players your team should be buying, how much they should be spending, how many players are needed in the first place, etc. Everything in football has a cost, not just in terms of £££, but also in terms of expenditure.  Money is a resource, but so are effective player minutes. At some point, rotation becomes absolutely vital, even for smaller teams. Want your team to make a deep cup run or two? You either need a bigger squad, or you can expect it to cost you places in the league. Given how much the English Premier League now pays out in prize money based on league finish, that money adds up quickly. Want your team to compete for the Europa League as well? That will burn a lot of player minutes. The more minutes your team plays, the more likely they are to get injured. If your first team is absorbing all of those minutes, then your best players will be the ones who get injured, and that has an effect on every other competition you are in. Also, even if nobody really mentions this, fatigue is totally a thing. Continue reading "What the Hell Are We Doing? Goals and Transfer Shopping"