Does Possession % Matter?
Any analytically inclined soccer fan (a.k.a. you) is probably well-aware of the limits of possession % as a meaningful metric. In fact, its faults are so numerous and well documented that the ubiquitous ironic mentions of "but what about possession?" every time Barcelona loses have (mostly) stopped. I understand the collective derision, but if we look at the metric in a deeper way can we glean some interesting information? I think so.
One thing that I think does need to be stated is that there is a relationship between possession % and points (at least in the EPL – see graph below).
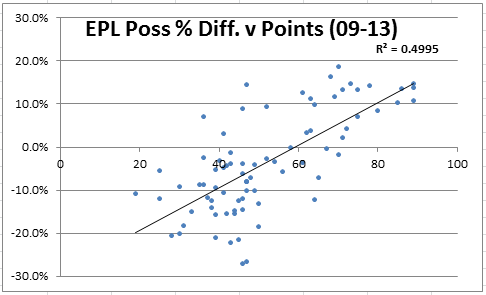
The causes of this relationship are complex and difficult to disentangle, but probably the best way to think of possession % is as a symptom of playing winning football as opposed to the cause, though of course sometimes it is the cause! Confusing! A must read on this subject is Devin Pleuler's interesting take on possession as a defensive weapon.
How is Possession % Calculated?
Based on some good work a couple years back by Graham Macaree, we know that the possession % that the majority of media outlets use is really just a pass ratio. The pass ratio approach is pretty simple: team possession % = team’s total passes / both teams’ total passes. This methodology was confirmed to me by an Opta employee. We can debate the merits of this approach until we are blue in the face, but for many sensible reasons I think it is probably the best proxy.
Splitting Possession % into Offense/Defense
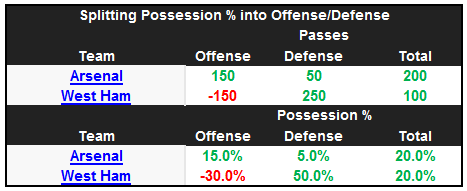
Not all pass ratios/possession % are created equal. For example, let us assume that an average EPL match sees 900 passes on average between the two teams (450 for each team). On this particular match day Arsenal outpasses Swansea 600-400 (60%/40%). Across town, West Ham outpasses Crystal Palace 300-200 (60%-40%). Both Arsenal and West Ham have the same possession % (60%), but they have achieved them in vastly different ways. By comparing their passing #’s to the league average, we can essentially allocate Arsenal and West Ham’s 20% possession advantage (60%-40%) to an offensive and defensive component, as demonstrated below. You start by comparing how many passes each team attempted and allowed and compare them to the league average. Arsenal, in this example, were 150 passes above an average offense (600-450). West Ham, by contrast, were 150 passes below an average offense (300-450). But, West Ham makes up this difference by allowing 250 less passes than an average defense (450-200).
That was a hypothetical, but what does this approach look like for this year’s EPL? (stats are two weeks old)
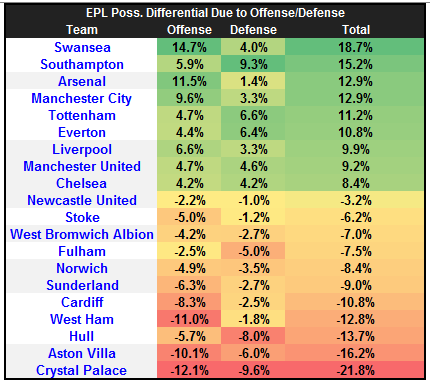
Talk about a tale of possession haves/have nots. The difference between the #1 possession team (Swansea) and the #10 team (Chelsea) is closer than the difference between Chelsea and the #11 team (Newcastle)! Another thing that jumps out is the comparison between Southampton and Arsenal; both have similar possession #’s, but achieve it in a very different fashion: Arsenal with offense and Southampton with defense.
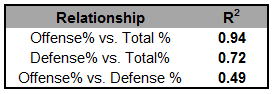
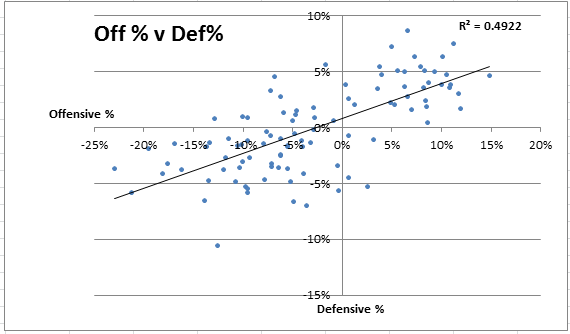
You also might notice the larger variance in the offensive component compared to the defensive component. This makes sense, as a team might face a variety of passing styles over the course of the year, but their offensive style is more persistent. Running some regressions (based on past five years of EPL data – 100 teams) backs this up, as the offensive component has a much stronger correlation with total possession differential than the defensive correlation. Interestingly, while you would expect a strong relationship (R2 > 0.7) between offensive and defensive components, the R2 was only 0.49, which I think demonstrates that this exercise of decoupling possession into offense/defense has some merit.