Controlling the Midfield (and why James Milner might not be the answer for Liverpool)

Each sport has it’s truisms about where the core of winning teams come from. In baseball it’s “up the middle”, the notion that if you get your defensive players in the middle of the field right, it’s easier to fill the rest. In football, games are won and lost “in the trenches” where the unappreciated lineman clear holes for skill players to score touchdowns. In soccer, it’s the midfield or in one of the more delightful sporting cliches: the engine room. Great forwards will not score goals without a solid midfield to move the ball up and give them plenty of touches. A top class back four can’t hold out for 90 minutes repeatedly if they have to constantly defend against passes coming toward their goal. These are widely accepted truisms but it is pretty hard to look at stats to determine which engine rooms are running at top speed and which are bogged down. Hopefully this is a step toward determining that.

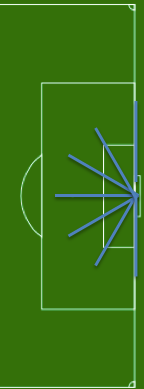
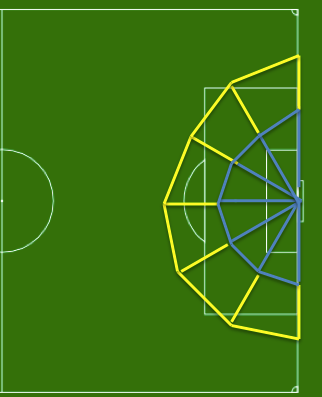
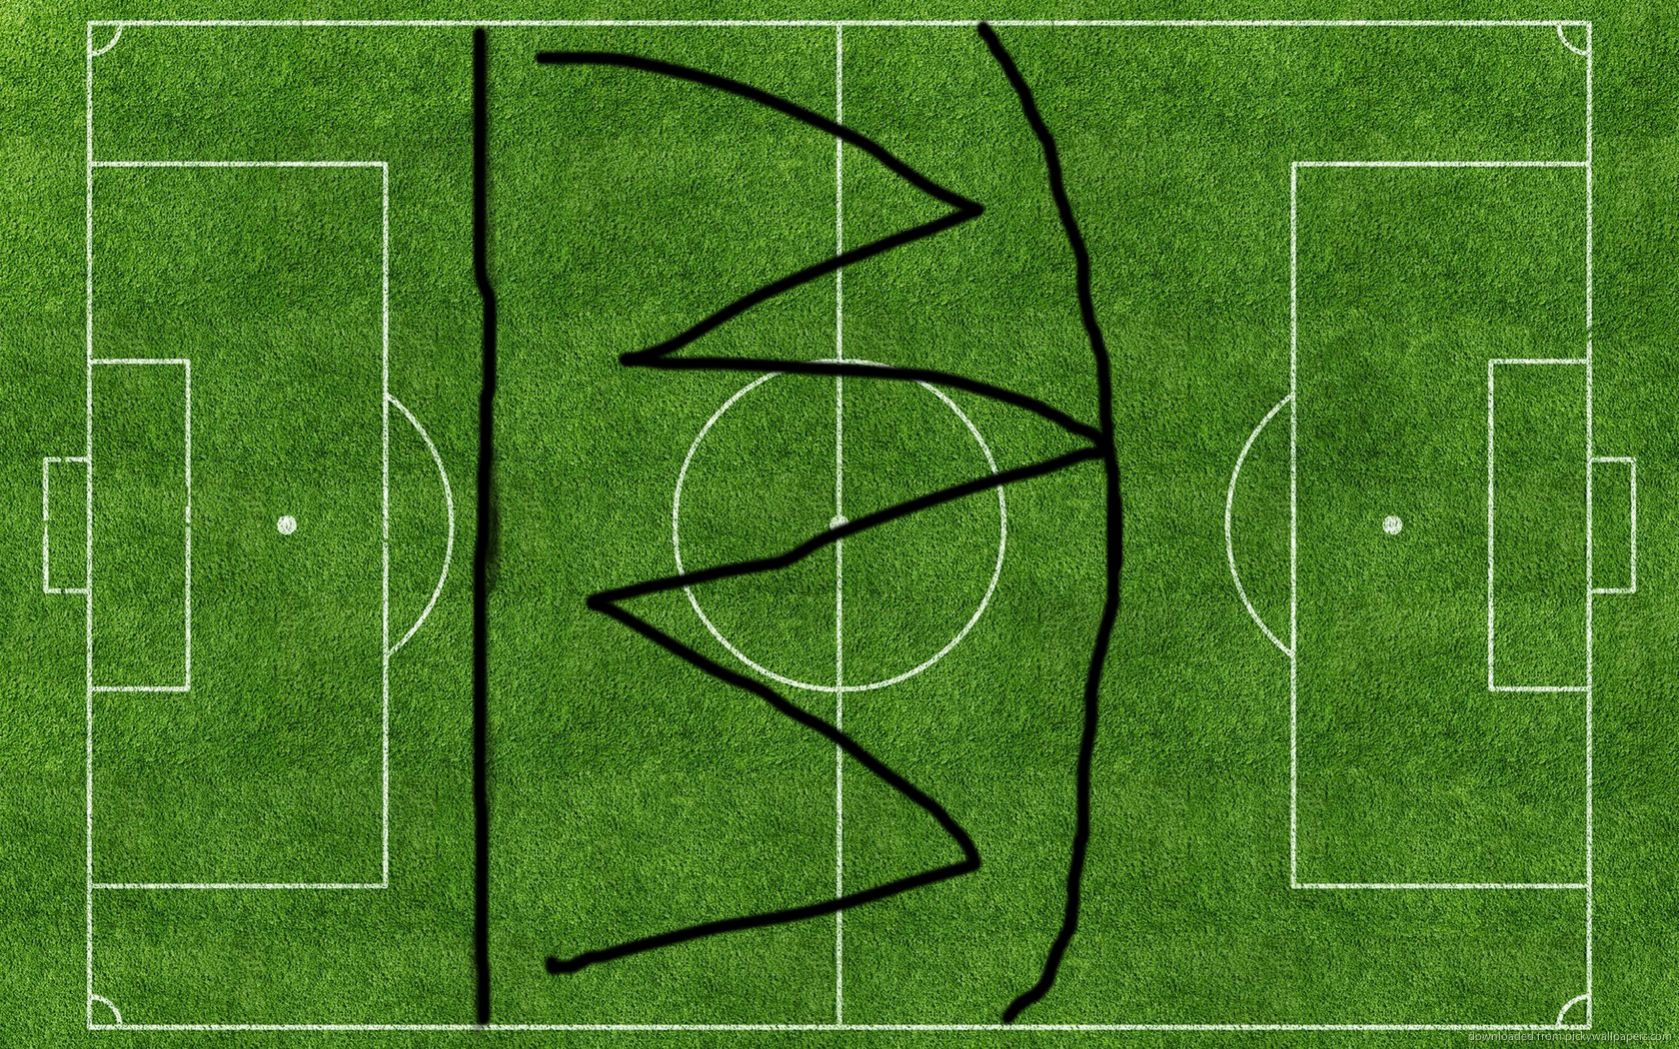
First, we need to define where the midfield is. This is how I defined it, between 38 and 79 yards away from the goal in my advanced soccer graphics representation program. This was just my decision based on what looked right and there are probably other ways of defining it that might be more correct.

Next we want to determine what stats to use to determine whether a team is dominating the midfield. Number of completions for and against shows possession but we need more, completion percentage is nice but rewards simple, short passes back and forth just inside the area equally with incisive balls through the middle. In the end, I came up with 4 factors to measure a team’s midfield control.

The first three are simple. One: completions per game. Two: the share of passes that are going backwards, mainly for context. Three: how far the average pass travels.

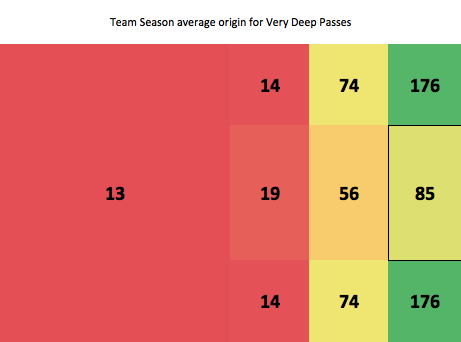
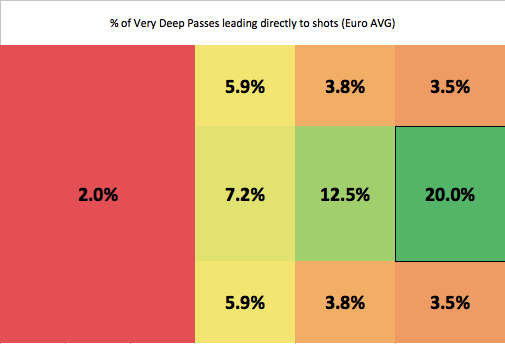
The fourth is a little more complicated. It is basically adjusted completion % on forward passes. To measure which teams were actually best as moving the ball through the midfield, I created a rough model for how an average team passes. It takes into account how far from goal the origin of the pass is and how much closer to goal the ball goes. I did this separately for La Liga, the Bundesliga, and the EPL. For example, in the EPL a pass that originates 63 yards from goal and is targeted at a player 4 yards closer to goal (59 yards from goal)*, is expected to be completed 86% of the time. If a passer is 40 yards from goal and tries to play a ball 26 yards closer to goal (in the box 14 yards from goal) it is expected to be completed 20% of the time. Obviously there are big changes depending on pressure and number of options available: a striker playing a ball forward will have a lower % than a midfielder or a defender simply due to how the team is laid out. This is ok, especially at the team level, as we are simply using this to measure which teams are actually passing well and which teams might be inflating their completion percentage through short passes far from goal. We add up each passes expected completion percentage then compare how many passes were actually completed to see if a team is above or below what you would expect.

*from goal is measured directly from goal. So a pass completed to the corner would be measured as 30+ yards from goal, not 0 even though it might be completed on the end line.

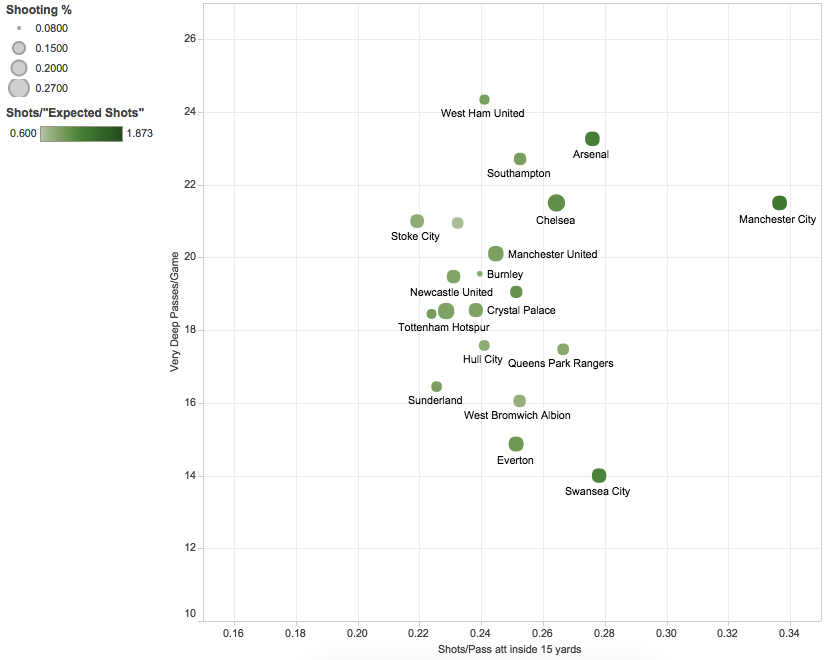
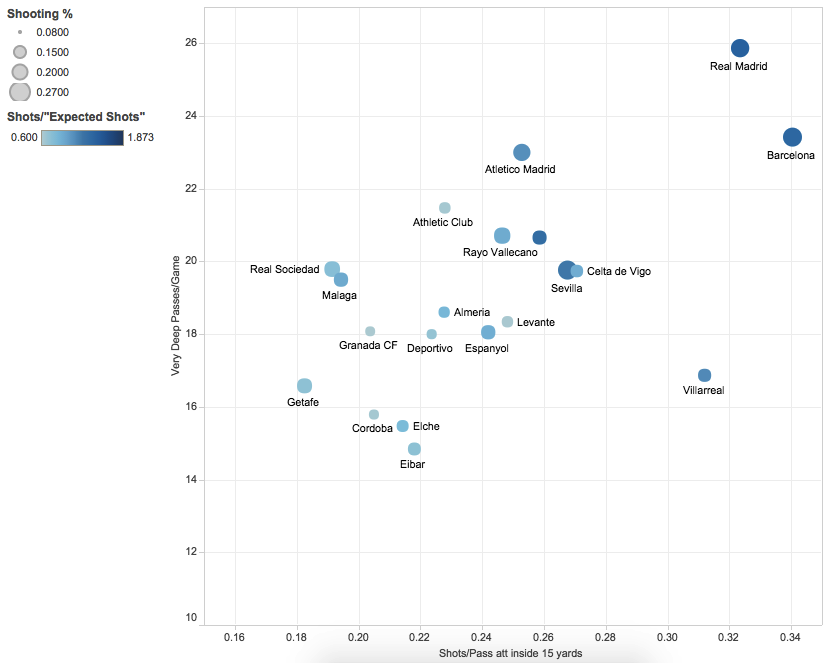
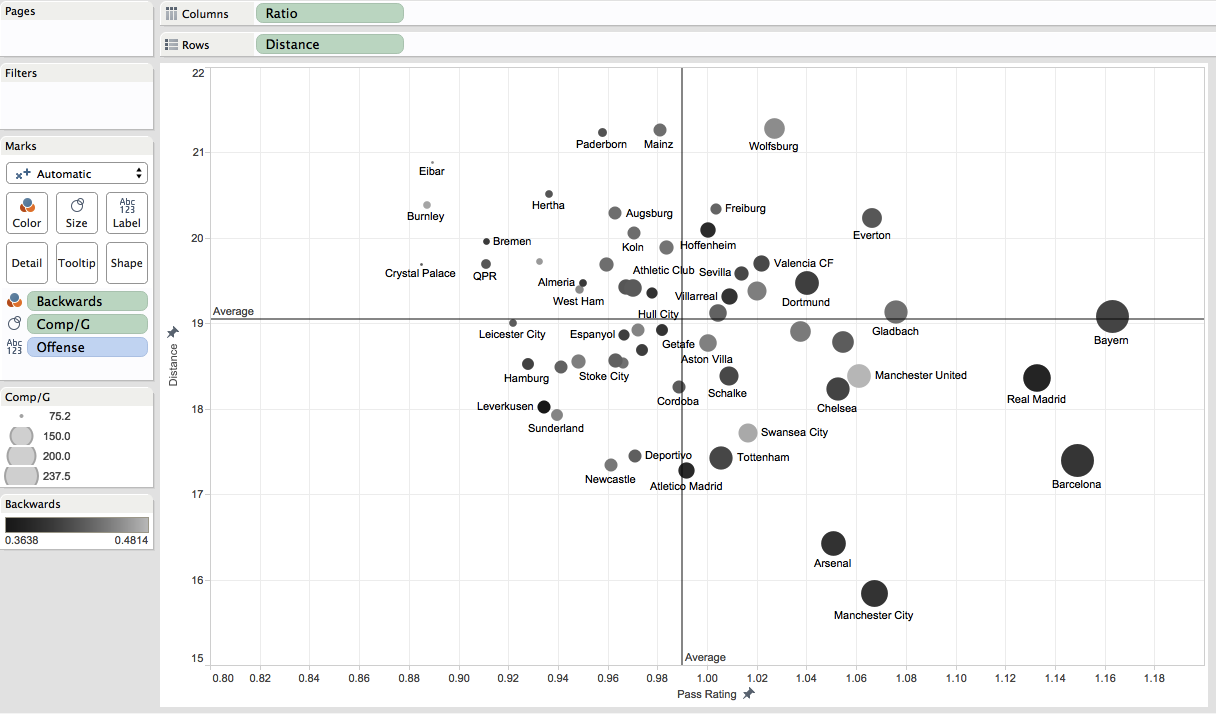
To visualize all of these factors, we go to Tableau and look at the 3 biggest leagues graphed:

Clickable link for interaction

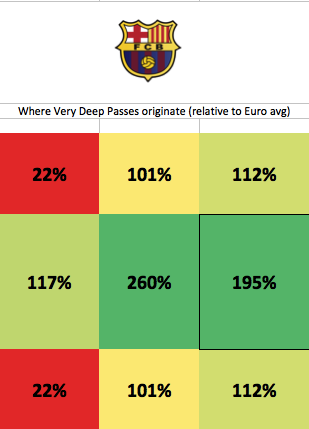
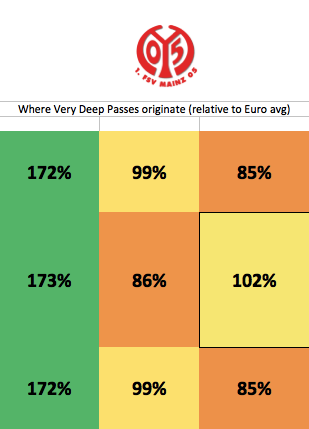
Far on the left side of the grap we see Crystal Palace, Burnley and Eibar. These are the three teams who completed a lot fewer passes than you’d expect an average team in their leagues to complete. They were only about 89% as likely to complete any given pass as the normal team was. Moving from left to right we see teams like Newcastle, Atletico Madrid, and Mainz around the average line when it comes to pass completion quality. Far on the right, we see the expected big boys in Bayern, Barcelona, and Real Madrid. Gladbach, Everton, and both Manchester teams sit significantly behind those 3 in the second tier of this pass rating.

Looking at the bottom of the graph we see Man City and Arsenal in a group of their own when it comes to playing short passes. Up top we see 3 German teams play the longest passes, with varying rates of success. Paderborn, Mainz and Wolfsburg average midfield pass is over 5 yards longer than Man City.

Looking at the size of the bubbles, we see unsurprisingly that the best teams at completing passes are generally the ones who complete the most. One place we can see a contrast is between Tottenham and Atletico Madrid, who play similar short passes at similar success rates but the difference comes when we see Spurs play complete almost 40 more passes per game in the midfield.

The share of passes that go backwards is the color of the bubble. We see that Swansea and Manchester United are teams in the right half who play backwards passes more than anyone else, in fact Manchester United play the highest share of midfield backwards passes of any team on this chart. This is rare for a top team as you can see, and indicates a lack of forward options, a lack of aggression, or a tactic obsessed with keeping the ball.

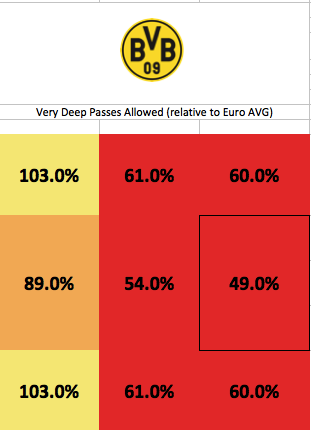
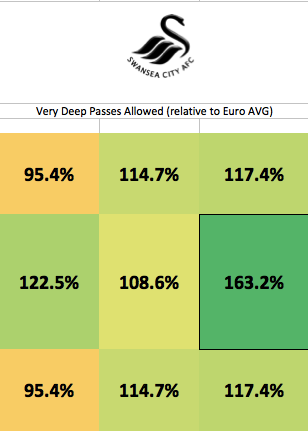
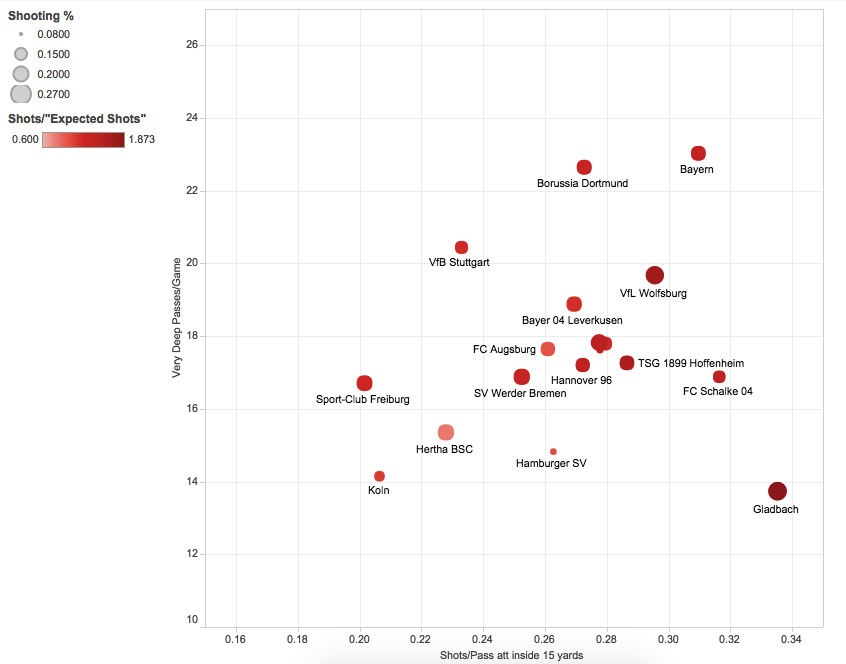
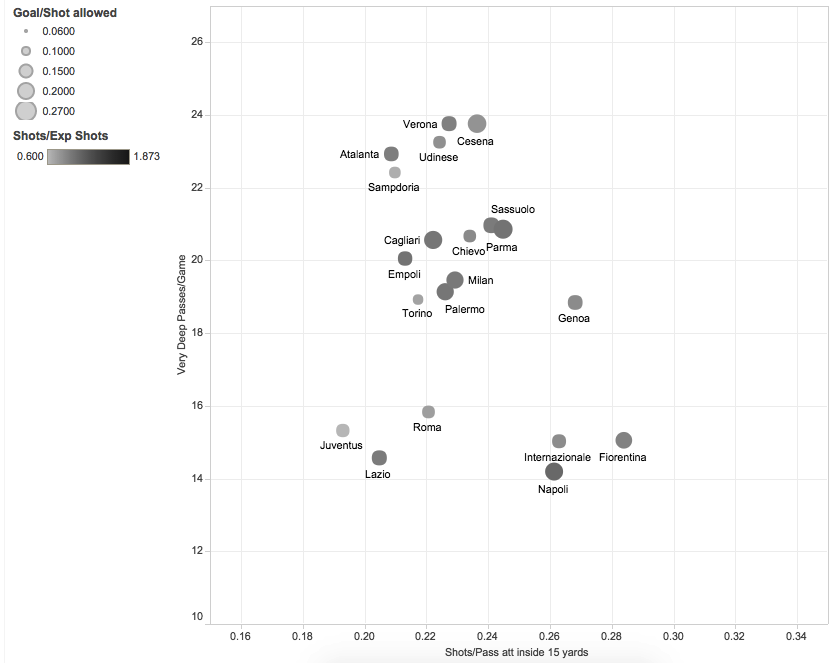
Here is the defensive chart with a clickable link for more interaction:

Clickable, interactive link

We see two massive outliers immediately. One is Leverkusen, who were just enormously harder to get through the midfield against than anyone else. The other is the infintesimal dot representing Bayern. Teams complete 40 more passes per game in the midfield against Man City than they do vs Bayern. Two interesting teams to contrast are Manchester United and Rayo Vallecano. They see the same amount of passes, are both very good at stopping passes and allow a little above average pass distance. The main difference is teams play forward a ton vs Rayo (because they press extremely high) while opponents play backwards a high amount against United.

Still the single most interesting part of this graph is Real Madrid. Teams play extremely short passes while completing more than you would expect. This was not something I picked up on while watching and something that is hard to explain away as a tactical decision in a league where they are simply so much better than many of their opponents. Something was wrong with Real’s defensive midfield last season, and that looks to be a pretty big hole going forward for a team with UCL and La Liga ambitions.

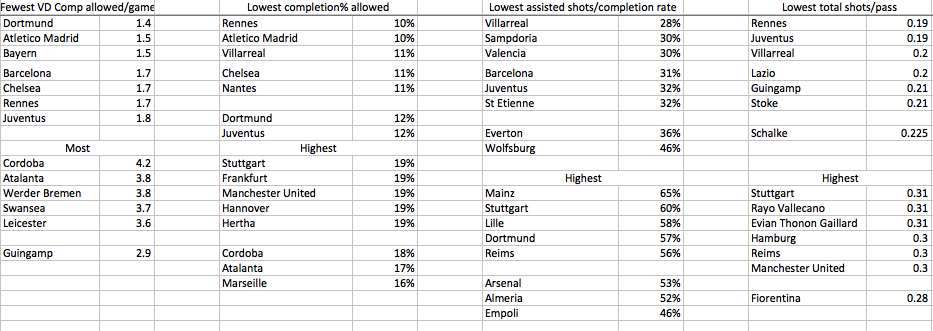
Chelsea are somewhat close to Madrid, down by Swansea. This is more easily explained as a tactical decision as we know from my previous piece on converting shots to passes that Chelsea are one of the best at keeping teams at arms length or on the edge of the attacking area, and one of the best at keeping passes from being converted into shots.

The longest passes allowed are generally all German teams (see below for more on league differences) and then some bad Spanish teams and then Tottenham, who are right besides Augsburg. Only Man United and strangely QPR are better at stopping passes through the midfield than Tottenham, the main problem with their defense was the passes that get through are long and dangerous, and are converted into shots at a higher rate than any other EPL team. This would suggest at first glance that the backline is more of a problem than the midfield. United had similar problems, though they were tougher to pass against and not near as susceptible to passes being converted to shots.

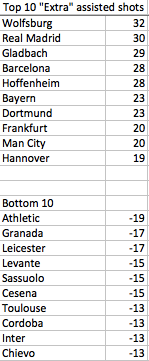
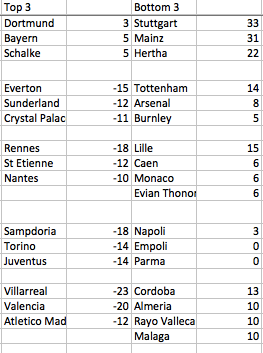
Combining shot conversion and midfield control

We saw how Chelsea’s unimpressive defensive midfield numbers were overcome by the sterling job they do stopping deep passes from being turned into shots, let’s see if there are other interesting separations.

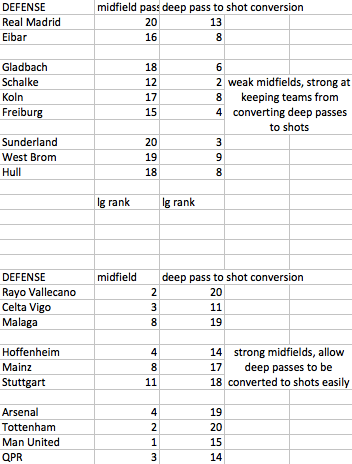
There are obvious tactical reasons for some of these (Gladbach’s shelling, Celta/Rayo’s high presses) but there are some general conclusions we can make. If my team was in the second group, I would look first to upgrade my back-line if I wanted to improve my defense.

Combining offense and defense for total control of the midfield

To see which teams really control the midfield as the title mentioned we will combine the offensive and defensive metrics. The ratio of completions/completions allowed and the amount pass ratings on offense and defense are combined for one ranking.

Top 10

1. Bayern Munich

2. Barcelona

3. Dortmund

4. Manchester United

5. Real Madrid

6. Manchester City

7. Celta Vigo

8. Arsenal

9. Liverpool

10. Tottenham

Real Madrid’s poor defensive showing is outweighed by its dominant offense. The rankings give some weight to the idea that a good midfield will build you a good team. One interesting team not in the top 10 is Chelsea, who were 15th overall but still won the league without a dominant midfield.

Looking at individual teams

When you see a team rank high or low, the next question becomes why are they so high? What players are dominating the midfield for them? While this is still a very hard question that I am in no way certain of answering, looking deeper at this kind of passing data can help tell us a little bit. We will look quickly at Man City and Liverpool, two teams who were both easily above average in number of passes and pass rating (completed passes compared to "expected" completions).

We won’t look at defenders (though I will mention Mamadou Sakho was nearly off the charts in how well he advanced the ball aggressively) or forwards (where the differences between Eden Dzeko, Stevan Jovetic and Aguero are very noticeable) but will focus only on midfielders for now.

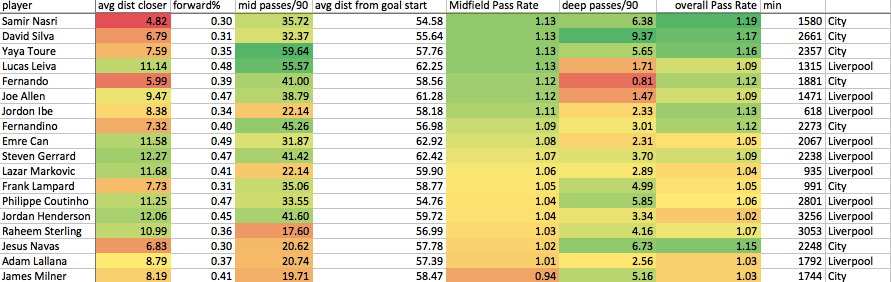
The midfield pass rate is basically how well the player is doing at completing passes that move their team toward goal in the midfield. A rating of 1 means they do exactly as well as an average EPL player, as you can see everyone here has a rating above 1, except for Milner who is 6 points below the average EPL player when it comes to completing these passes. His role was obviously much different at City than it will be at Liverpool, but the number remains a big worry for Liverpool fans. He is now being featured in an area where he really struggled to move the ball last season. When you factor in every pass over the whole field (overall pass rate), we can see Milner rises above average indicating he was at his best in the final third. His volume of work will drop there and rise in the center of the pitch in the upcoming season. Of course, more than half of the game is missing here but defensive work will come in another time, another article.

Other interesting player notes: Jordan Ibe’s high rating in limited minutes bodes well for his future and it’s another reminder of how silly good Yaya Toure and David Silva are. Liverpool as a whole saw their pass ratings drop the further upfield they got, no surprise to Liverpool fans who watched as they played an extremely conservative style for most of 2015, committing very few players forward. The limited attacking options made it very hard to pass, which will make it interesting to check in on Sterling at Man City and Coutinho with more options to see if they raise their ratings.

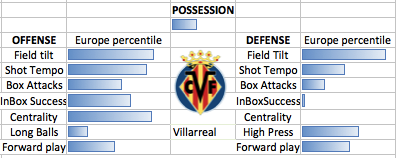
This is a broad overview of midfields, there are probably 20 articles to be written simply on Liverpool alone and there are tons of ways of looking deeper (who is forcing teams to play through the edges, hint: Villarreal, looking at game-by-game throughout the season and wondering why Liverpool had such poor midfield numbers vs Tottenham and great vs Chelsea while awful at home vs City and great away, etc) but hopefully you enjoyed this start. Any questions, comments, criticisms, etc feel free to reach me on twitter @Saturdayoncouch or post in the relatively new comment box below and I will be glad to discuss. Spammers, if you have read this far I am all set on sunglasses so please do not post.

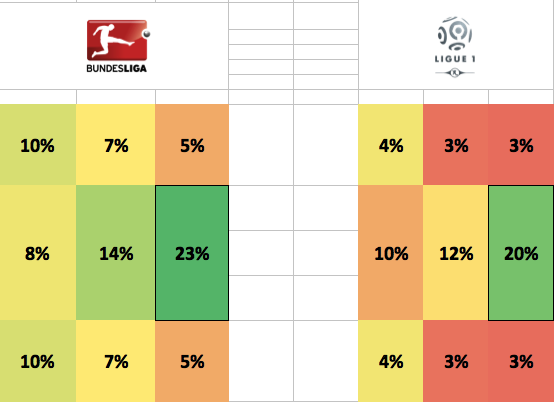
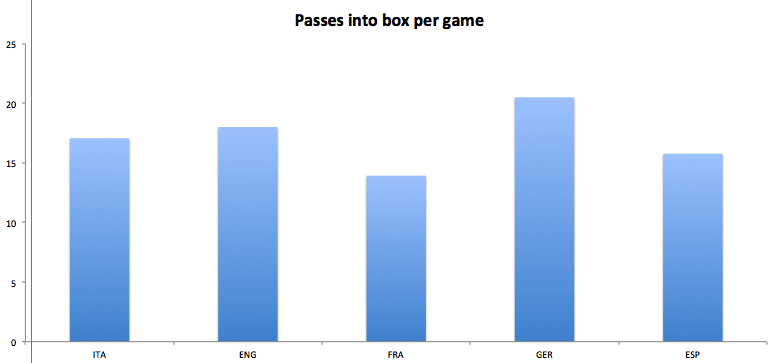
Postscript comparing leagues

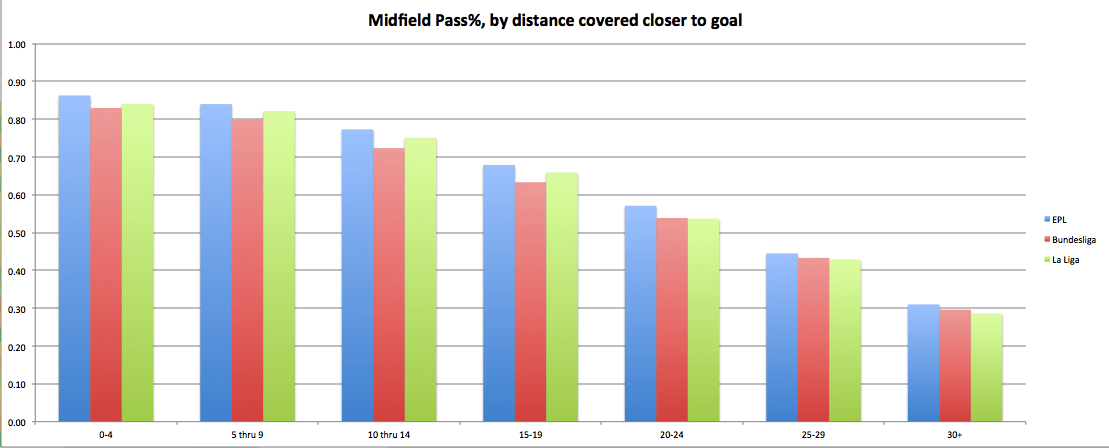
I promised a breakdown between leagues, but ran out of time. Here is a quick graph comparing completion percentages for different length passes. The Bundesliga is noticeably harder to complete passes. La Liga tends to see more short passes and Bundesliga: more long passes. Another time, maybe we can expand but there’s never enough time, right?

Converting Dangerous Passing into Shots

When watching the Milan-Torino film for my last piece, the idea came to me to look deeper into dangerous area passes. Torino had put the ball into dangerous spots a lot in the first half but a check of the shot map made their half look harmless when it had actually been anything but. That led to a lot of research and then into this post, where I'll look at how often passes into dangerous areas are converted into shots, the difference in assisted and unassisted shots, what teams do this well and poorly, and ask what we can do with all this new data. Hopefully you will find this as fascinating as I did.

What are dangerous, or Very Deep passes?

Passes played very deep into the opponents area.

Okay, smartass, what is this area you are defining as Very Deep?

The area roughly covered by blue lines here, within 15 yards of the opponents goal

Okay, what is so special about this area, I am tired of learning about new areas and terms why should I put this one in my memory bank?

To ease the understanding of the rest of the article. There is no special reason I chose exactly 15 other than it's a clear number. Teams converted 18% of shots from this area, compared to 6% in the 15-25 yard range but that is likely true for 14 or 16, but I chose 15. Very Deep is also easier to say that 0-15 yards of opposing goal every time.

How often do teams pass into this area?

I see where you are headed. To pre-empt the next few questions, here is a general table:

If you complete a pass in this area and get a shot off then unsurprisingly it is a golden chance. It follows that turning more of these passes into shots one of the best ways to improve your offense (or vice versa for defense).   A few quick best and worst lists to put down some context.

Offense:

and defense:

First, to explain the difference in the two right-most columns. Assisted shots/completion is how often a completed pass turns into a shot. Total shots/pass is all shots (assisted and unassisted divided by total passes into the area). A couple interesting observations: Manchester United's soft underbelly shows up here, nearly the easiest to complete passes against in this area and then allow nearly the highest shots/pass of any team.

Those are simply unacceptably bad rates for a team with their payroll. Dortmund allow the fewest completions per game, yet when they are completed they were converted into shots at the 4th highest rate. This makes me think there is very high pressure on the players attempting the pass and maybe higher risk defending on the recipient.

Ok, so where do passes into the very deep area generally come from?

(sides have been equalized to hopefully increase comprehension, differences not significant between sides, the huge box with 13 in it is the entire own half, opposition half is the rest broken down) We see that passes into the Very Deep area come primarily from the sides, in a season an average team will play 350 passes from the corners of the pitch into this area (not counting actual corners).

All Very Deep passes aren't created equally are they?

No they are not. Here is how often they are converted directly into assisted shots:

So we see that as we expected it's better to play a shorter pass from the middle of the field into the area than to hoof one from out wide. Only 1 out of 29 passes from the corners turns into a assisted shot while 1 out of 8 from the middle outside the box turn into assisted shots.

That's a European average though, does it mask differences from league to league?

As you'd suspect looking at the leaders charts above, it absolutely does. Let's look at the Bundesliga vs Ligue 1:

We see that long passes from the sides of the pitch are turned into shots over two times as often in Germany as they are in France. This variation in styles between leagues (which also shows up in shots) is one of the more interesting questions in football data.

Teams in the Bundesliga press out a lot more than in Ligue 1, leading to some of the differences we see here and causing pesky problems for anyone trying to build any sort of expected goals (or, as I briefly and madly considered, expected shots *shudders*) model that covers more than one league.

Pressure is the missing component I assume, as there are simply fewer defenders covering pass recipients in the Bundesliga than there are in France but until we can account for that, differences in playing styles across teams leagues will continue to trouble global model-makers, in which I semi-proudly claim membership.

A few interesting team maps before we move on, first Barcelona. Barcelona attempts passes from the deep sides of the pitch near the halfway line less than any other team in Europe. They tried only 6 passes from there, understandably working the ball through the center.

Mainz on the other hand tried 47 passes from the sides near the halfway line:

Dortmund rarely allowed any dangerous passes, though as we saw the very few that were completed caused major damage.

while Swansea allowed 139 passes that originated inside the box (which led Europe):


I know you just disregarded an Expected Shots model but let's see it in action anyway.

If you insist, and at the least it leads us to some interesting conclusions even if it is simply an assisted shots model. It is a very simple setup: if a pass came from the center square it is given a 12.5% chance of leading to an assisted shot, from the corners: 3.5%, etc, etc. You can look back a few graphs up at the % of Very Deep passes leading directly to shots graph to see the rest.

Looking at actual shots compared to "expected" shots will tell us who was the best offense at turning dangerous pass attempts into very dangerous shot attempts and who was the best defense at defusing their box being bombarded by limiting the number of shots.   As expected we see a lot of German teams are great at converting their passes into shots above the rate we would expect based on where those passes came from, starting with Wolfsburg who took 32 more assisted, close-range shots than we would expect from their pass numbers:

So if Athletic could convert passes into shots like Real Madrid, they would have added 50 more assisted shots to their total. If they converted those at the European average rate of 40%, they would have scored 20 more goals and possibly threatened for Champions League. I think that this means Athletic's attacking line is holding back a team with the potential to easily score 50+ goals.

They have enough dangerous possession to be doing much better, so if looking for an offensive upgrade I'd look toward those involved in the final ball as the players behind them are being let down by those in front.   Looking at defenses I will split it up by league so it's not just a list of German teams in the top 10 of defenses who allow a high rate of shot conversion (number is "extra" shots allowed above or below what would be expected from pass totals and origin):

Here we see possibly why Sunderland stayed up this season. They are a surprising name to see on the left side of this table and facing 12 fewer high quality chances than expected was a big boost toward gaining the 3 key points between survival and the Championship.

We can look deeper into each league with the following images and interactive links. In Germany high on the y-axis Bayern and Dortmund are the teams well ahead of the pack in sending passes into the box. Gladbach's extreme efficiency shows up as they are near the bottom of Very Deep passes attempted, but they are best in the league in converting passes into shots. The dark color of their circle shows it's not just passes from high quality areas, they are simply converting passes into shots at a rate above anyone else in the league. The size of the circle shows they are converting those shots into goals atop the league as well.

Bundesliga Offense

In the EPL we have more uniform conversion rates outside of Man City.

EPL Offense

In La Liga we see massive spreads in conversion rate and very deep passes per game. This wide spread has always made this league the toughest to model correctly.

La Liga Offense

An interesting case is Serie A's defenses. 6 teams allow essentially the same amount of passes into the box but we see the difference in Juve, Lazio and Roma (the top 3 teams in the table and fewest goals allowed) is they turn those passes into fewer shots allowed than Inter, Fiorentina and Napoli.

Serie A Defense

Looking one step back

What about the yellow area (15-25 yards out from goal)? It's not near as dangerous: only 22% of completions turn into assisted shots and 10% of assisted shots are turned into goals (Unassisted shots clock in at 3%). There are still interesting things to learn looking at this area. I looked at the ratio of completions in the yellow area (deep) to the blue area (very deep), thinking teams that build a shell around their goal might keep the action at arms length.

We see a familiar face at the top in Chelsea. Mourinho's wall around the goal is a familiar, frustrating sight for EPL teams and it's borne out here. You can get close, but not close enough to get a really high quality shot.   At the other end Leverkusen tries to not let teams get close to their goal, but when they do they don't slow down on the doorstep they barrel down on goal. Teams who have a high completion ratio (like Chelsea and Everton) are also generally better at keeping their opponents from converting passes to shots. On offense that relationship does not hold, though Chelsea and Everton are again near the top.   The offensive top 10s look like this:

What are the uses?

These metrics can help evaluate where your team's attack or defense is being let down. We used Dortmund's defense earlier and identified the final link as the weakest: they are allowing an extremely low amount of very deep passes and a low completion rate, but those completions turn into shots way too often. If they can get that rate down to even European average, that could be 35 fewer shots they would face. It gives us a glance at where teams are entering the ball to dangerous spots and how well they are converting those passes.

What is missing and what is the next step?

The obvious next step is looking at which of these metrics are repeatable and which are most influenced by luck. Right now, I have no statistical backing to say which is which but I am pretty confident that simply based on larger sample size, pass-to-shot conversion rates are much more indicative of true skill than shot-to-goal conversion rates.

Applying these metrics to individual players would be an interesting use. If Leighton Baines crosses are converted into shots at a significantly higher level than everyone else that is useful information. Same with strikers, if Aubemayang is converting passes into shots at an elevated rate while Ramos and Immobile are not, then he might be the reason and not the supply. Defenders can be looked at as well, though as usual that comes with a lot of complexity.

Problems with these metrics are the difficulty in classifying unassisted shots. Some of these likely were assisted from passes just outside the area I selected as a cutoff but it is hard to determine which ones come from dribbles, loose balls, rebounds, etc. That would add useful information. It almost doesn't need to be stated at this point, but pressure would totally change how we look at metrics like these and shots. Without a huge manual project, it's unlikely we will have Europe-wide pressure stats anytime soon. Of course, the ultimate end point is shots to goals but I felt the piece was already long enough and I don't have as much new to add in that area. There has already been plenty of good work (like this piece from Michael Caley) that has established a lot in that area. Classifying % of shots taken as headers from each area would be another improvement I could make.

Thanks for sticking with this piece through the stats and the tables.

Hopefully you enjoyed it or it sparked an idea for you. If you have comments, critiques, ideas, or anything else you can reach me @SaturdayonCouch on twitter or you can post a comment on my website.

Thanks for reading StatsBomb!


PoweredbyOpta

How Do You Find The Most English Team? Similarity Scores And Team Style Profiles

How do you find the most English team? You could count English internationals, home-grown players, the most fans, or simply refer to the picture above and declare that game the most English game of recent years. I took a different approach to find out which team played closest to the English style this last season. To do so, we need to develop a way of profiling teams by their style. For this we will use a number of metrics, listed below:

Both offense and defense -Possession

Offense -field tilt (ratio of attacking third/own third completions)

-shot tempo (shots per pass)

-intrabox success rate (completion % on passes that begin and end inside the box)

-pass length -centrality (% of passes toward the center of pitch in final third)

-box attacks (passes into the box)

-forward play (% of passes that are forward)

Defense

-field tilt

-high press rate (% of passes completed that are 60+ yards away from the goal)

-shot tempo

-intrabox success rate

-centrality

-box attacks

-forward play

For each metric, a team’s rate was compared to the European average and standard deviation to get a z score, which was then used to make a team profile. For example, Villareal allows 31% of intrabox passes to be completed. The European average is 40.4% with a standard deviation of 5.4%. This puts Villareal in the 4th percentile for ease of intrabox passing against. This is done for each metric to create a team profile (Villarreal shown again):

You can see the two things that jump out are that they shut down the box and also force teams to the flanks more than any other team in Europe.

If you do this for each team in a league you begin to see some significant stylistic differences. I've looked at differences in shooting across leagues before and Colin Trainor and others have written about it on this site. Others have written very well about defensive differences from league to league. These profiles are another way of looking at league differences through how they play the ball. Spanish, Italian, and English teams have significantly higher field tilt than German and French teams. England and France are well ahead in intra-box pass % with Spain and Germany significantly behind. Box passes can be seen below:

Putting it all together, here is the composite England style profile (average of each team):

To find the most English team we need to use another tool in its early stages: the Style Similarity Score. It’s a simple tool that compares percentile differences across the different categories (with slight weighting changes, they are ordered according to importance in the list at the start of the article) and gives us a number summing up all of those differences. If a team had exactly the same numbers as another, their Style Similarity Score would be 0, and the higher you get the more different the teams playing styles theoretically are.

View post on imgur.com


The eye test doesn’t completely contradict anything I’ve seen, which makes me think this is a good first step. I wanted to use this new tool to find the real essence of each league. The glitz and glamour of Arsenal, Bayern, Barcelona and PSG are well-known but certainly aren't representative of the average team in each of those leagues. So I put the English profile from above through the similarity score to find the two teams most similar so I’d know what game to watch if I wanted to find the true heart of Premier League football. I did this for each of the top 5 leagues.

Results  

England: Stoke City v Aston Villa

Italy: Palermo v Sassuolo

France: Lorient v St Etienne

Germany: Frankfurt v Stuttgart

Spain: Deportivo de La Coruna v Valencia

If you had sat down and watched all 11 of these matches between these sides this season, I think you would have a good taste of the differences between the leagues. Just looking at the results you can see that: Frankfurt and Stuttgart played a 5-4 classic and a 3-1 as well while St Etienne beat Lorient three times by scores of 2-0, 1-0, 1-0 without a first-half goal.

The EPL is an interesting case as it has way fewer teams that "look" like the average side. This is because the league is more stratified in the way they pass. Burnley, QPR, Palace, Stoke, West Ham, and Hull all are in the top 15% of most long balls while Arsenal, City, Swansea, Liverpool, Spurs, Chelsea, and Everton are in the bottom 15%. This wide split between groups of teams means there isn’t a big group of teams playing near the average English style (like there are in Germany, France and Spain) but Stoke-Villa is as close as it gets.

Where do we go from here? 

With more work, team profiles and similarity scores could be used to look at how teams and styles match up against another. If we can see that Dortmund struggle more against teams who press them back then teams who sit back and force play wide you can alter your tactics (if you are a manager) or alter your bets. It’s another piece of information on top of shot data like expG: if Villarreal and Marseille had the same expG rating you would know Dortmund was a better bet against Marseille’s style of expG than Villarreal. Maybe teams that sit back and play long balls do great against teams that have high final third possession numbers like the conventional wisdom says, maybe they don't. Game-to-game and month-to-month changes in tactics and style could be tracked much more clearly. Similar styles could be mapped together to see if their shots or shots allowed are different than the normal to improve xG models. One early example of this involves Swansea. I wrote about how expG models do not properly capture what Gladbach has been doing so I was interested to see who was similar to them. They turned out to be a rather unique profile with not many similar teams but the closest team was Swansea. Despite having a poor intra-box defense the Swans track well with Gladbach. When I checked their goal numbers relative to expected goals, sure enough they have been over-performing for 3 straight seasons now in my model. I haven’t done a deep dive into that yet, but it’s something I might not have seen without the similarity score.

These Team Style Profiles and Style Similarity Scores are good first steps but there is lots of room for improvement and without tracking data there are limitations.  Should different metrics be chosen? There are pretty strong relationships between possession, field tilt, and box attacks for example so should they all go into the mix? Should the weight assigned to each metric when comparing with other teams be adjusted? What about teams who change styles often throughout games and season like Thomas Tuchel did at Mainz? At the end of the year the stats only look one way but it covers up a ton of variance, there needs to be a metric for flexibility for sure. Certainly changes will be made, one of the first being improving field tilt to include all completions and not just a simple ratio of attacking/own third.

Comments are closed here so if you want to discuss anything in the article, have ideas on how to use or improve these tools, or anything else you can go to my blog or on twitter @Saturdayoncouch and I'd love to chat about it.