EPL Season Preview 14-15: Chelsea

Cast your mind back to last season, just briefly, and try to recall Mourinho's Chelsea team. Impressive structure, solid, efficient, and able to grind out some spectacular results in the most difficult away games of them all. Remember the brilliantly stoic tactics that Mourinho employed away at Man City and Liverpool.

Tactically, Mourinho still had it, and he's still got it. But what Mourinho didn't have last season was the horses to play in a flexible way when the game, or game situation, demanded it. Chelsea, in what some called a season of transition, didn't have the squad depth or the variety of player needed to combat the lesser teams in certain away games. The issues regarding Chelsea's squad makeup and flexibility also extended to some home games where Chelsea began to suffer problems against teams that "parked the bus".

Maybe I am being both overly kind to Mourinho and overly critical to the makeup of the squad, but it felt to me that he just didn't have the variety and quality of players that he needed to break down all different types of opposition. But he has now. Players of the highest quality have been signed, the first XI looks vastly improved and the narrative surrounding Chelsea now sounds something like this: No Excuses.
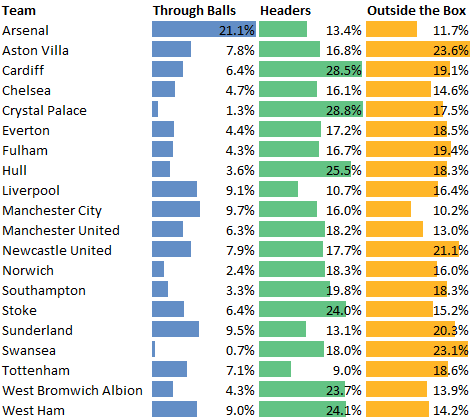
13/14 Numbers


chels stats


That is a lot of numbers and a lot of #2 rankings for those numbers. Despite Chelsea lacking in a few key areas of the playing staff (creative mid, striker) Mourinho managed to get some mighty fine underlying numbers from the players he had.

This was a pretty darn good Chelsea team. Chelsea in 2014/15 should be even better.


My God Fabregas looks older.


INS

Fabregas 33,00 Mill. €

Diego Costa 38,00 Mill. €

Felipe Luis 20,00 Mill. €

Drogba Free

Pasalic 2,50 Mill. €

Courtois & Zouma return from loan spells

Outs

Luiz 49,50 Mill. €

Lukaku 35,36 Mill. €

Demba Ba 6,00 Mill. €

Various loans for youth players.

Chelsea just about broke even. That they did so while upgrading positions of absolute need and selling players that likely won't harm the quality of the first XI is astounding. It's strong work and credit where credit is due.

The Squad

The loss of Lukaku and De Bruyne, both top draw prospects, will hurt in the long term but it raised substantial funds in order to do the important work of improving Chelsea in the present.

Diego Costa fills an immediate need in the striker position and will surely score if his fitness holds up. Fabregas was a creative wizard in his first spell in the PL, but has age caught up with a player who was subjected to boos and, most painfully, sarcastic jeers from Barcelona fans last season? Fabregas has likely got a good few years left yet and should be a fine signing. Courtois might be the 2nd best GK in the world, Zouma adds depth and promise in the CB position and Felipe Luis is a specialist left back who Mourinho should be able to quickly trust.

Chelsea have greater depth and quality now and this should be a squad better able to cope with the grind of a typical Premier League season.

The First XI


This is only a guesstimate, remember! Maybe Fabregas drops in where Ramires is and Oscar fills the position vacated by Fabregas. Maybe Schurrle plays instead of Willian. Point is Chelsea have midfield options now, options enough to tweak the shape and formation of the first XI if needs be.

Management

Hard, unfair, loved by his players, a proper bastard, tactical genius. These are just some of the words that could be used to describe Mourinho but the only word the man himself would be interested in would be winner. The mainstream media tell us that this is a big season for Mourinho, that there'll be no excuses this time, that he has his player upgrades, that he has settled back in at Chelsea once more.

Maybe that narrative is fair. Managers at the top clubs now are on a short leash, though Mourinho's would be a little longer than others might be, and the pressure to win now exists at Chelsea just as it does at Man City. Mourinho has the experience, the character and, above all, the brilliant systems to win now.

Will the arrivals of Fabregas,the creative hub, and Diego Costa, the spearhead, lead to a change in setup or approach from Mourinho? Probably, but any change won't be drastic and Chelsea should still use that killer counter attack option that gave the big teams such trouble last season.

Maybe Fabregas' arrival leads to better game management and more control of games. Maybe Costa is the forward Chelsea have been looking for to maximize that insanely good attacking midfield band.

Mourinho is pragmatic and adaptable and how he tweaks his setup to accommodate the aforementioned players will be a fascinating thing to watch.

Expectations

To win the league, semi-finals of the CL. Domestic cup wins would be nice but who are we kidding!

Conclusion

Chelsea were a mighty good team last season who posted some mighty good numbers, but a lack of personnel options and a misfiring forward line handicapped Mourinho's title challenge. Chelsea, with an improved starting XI and some increased depth, should get a lot closer to winning the PL title in 14/15 but will it be enough?

I think the title race will be pretty close this year and the two, almost inseparable, teams will be Man City and Chelsea, which will be a surprise to no-one. But, Chelsea will fall just short of a Man City team who boast unrivaled squad depth and forward punch. Man City's strength isn't the only reason I think Chelsea will fall just short.

I still believe Chelsea have depth issues at center forward where the drop off in talent after Diego Costa is alarming. Torres is a ghost, Drogba was declining 3 years years ago and not much should be expected from him. If Costa suffers more injury troubles then the scoring burden falls to one of those faded talents or to a man like Schurrle. It's not ideal and it is very likely that it could be an issue for Chelsea at some point this season.

The other area of weakness may be in the center of defense. Cahill and Terry are a fine, fine partnership but if injury strikes to one of the pair then Chelsea are left with Ivanovic and 19 yo Kurt Zouma.

Chelsea have improved their first XI and signed players who should add at least a few points to the tally Chelsea posted lasted year but issues regarding positional depth and Chelsea's ability to cope with injuries in defense and attack lead me to think that Chelsea will finish in 2nd place.

But it'll be close. I think.


Wayne Rooney's Fantastic Career

This morning Paul Scholes broke rank somewhat by giving his opinion on Wayne Rooney's mentality, training ethic, and somewhat logically, his unsuitability to play center forward for the remainder of his career. It has long been mooted that Rooney would into a deeper tactical position as the years progress, an dit isn't beyond possibility to see Rooney played as an attacking midfielder/schemer/roamer type once into his 30's.

I'd link you to the article Scholes wrote (ha) but search for "Nicklas Bendtner arse" and you'll find it easily enough from there.

See:

Image

Scholes Quotes:

Wayne was in the Everton team at 16 years of age, in 2003. Since then he’s played at Euro 2004, two World Cups, Premier League, and Champions League every year at United. There’s a chance he’s worn out. Wayne’s peak may have been a lot younger than what we’d expect of footballers traditionally. Age 28 or 29 has been the normal ‘peak’. With Wayne, it could have been when he scored 27 league goals in 2011/2012 when he was 26.Pretty juicy.

Scholes continues:

Wayne might be a player who’d retire come 31 or 32, given the amount of football he’s played. Ryan Giggs has been on the go for ages, but he adjusted his position. Can Wayne do the same?I don’t think Wayne will be able to play centre forward until he’s 34 or 35. But he could play centre midfield, possibly, into his mid-thirties.

In short, Scholes thinks that Rooney may well have peaked in 11/12; that he may have a lower age peak than other players due to miles on the clock; and that Rooney can't play center forward until he's 34 or 35. I'm not in huge disagreement with points 2 and 3, and if Rooney is still playing center forward at 35 it will be because he has followed the Martin petrov route.

I was thinking over some of the points made in Scholes' article, specifically: has Rooney peaked and what does Rooney's career arc look like?

A quick search later and I stumbled on earlier StatsBomb work from Ted which looked at Rooney's most recent 5 seasons using detailed stats. You should check it out, there's radars and all! What I wanted to do was look at the entirety of Rooney's pro career (12 seasons) and to be able to do this we have to abandon some of the more detailed stats featured in the radar piece. Why? Well, the football stats dark age ended in 2008-09 and from that point onward we began to have access to more detailed game stats like accurate shots on target info, key passes, giveaways, takeaways etc. etc.

I don't want to repeat previous work so what I decided to was take Rooney's basic info from all 12 seasons of his pro career including the Everton days.

All numbers are from the Premier League only.

Stats we can examine:

  • Percentage of minutes played.
  • Goals p90
  • Assists p90
  • Scoring Contribution p90
  • Shots p90
  • Conversion%

Six categories which will be broken down by age during the relevant season. I'll also include a rolling average of his performance throughout his career.

Percentage Of Minutes Played

Image

Rooney's career average sits around 70% of minutes played which, for a player with that many miles on the clock, is pretty impressive. Pretty durable player, alright.

Goals p90

Penalties, penalty shots are, and always have been, stripped out.

Image

Remember Scholes' quote about Rooney having peaked in 11/12 (26 yo season)? Was Scholes fooled by Rooney's excellent goalscoring in 11/12 and thus concluded that "peak" must have arrived in the season he scored the most goals, ignoring Rooney's general contribution as a forward?

Scholes obviously watched Rooney up close and may have been able to detect subtle changes in Rooney's game and where he may have declined over the years, but 11/12 looks like a spike in performance (as does 09/10) due to shot volume or conversion% or tactical usage and not the start of some terminal decline.

Despite varying quality of teammates this chart is actualy quite clean: growth in the early part of his career, 2 years of overperformance, one year of underperformance and pretty consistent numbers apart from those over/under seasons.

Assists p90 Image

Remember how I mentioned usage when talking of Rooney's goals p90 numbers.

Check his 24 to 26 year old seasons out:

Age 24

Goals p90 0.73 Assists p90 0.10

Age 25

Goals p90 0.32 Assists p90 0.45

Age 26

Goals p90 0.67 Assists p90 0.13

I could be wrong but that looks like tactical usage. In general assist rates for Rooney's career are all over the place.

Scoring Contribution p90

Image

Once we add Goals p90 and Assists p90 we see can clearly see Rooney's consistent contribution as a forward. Scholes may well believe Rooney peaked in 11/12 (age 26) but age 22 and age 27 stand out above all others.

At age 22 Rooney posted an excellent scoring contribution number and part of this was due to operating in close proximity to the legendary Cristiano Ronaldo. That was the year that Ronaldo scored 31(27) league goals (5.76 shots p90, 0.88 Goals p90). Ronaldo draws teammates into his orbit of excellence and thus they post better numbers.

All told, since Rooney's peak, at least according to Scholes, the England forward has posted 2 of the best 3 Premier League seasons of his career in terms of scoring contribution p90 minutes. The rate stats don't lie although it is important to factor in the percent of minutes Rooney has played in each season.

Shots p90

Image

Rooney has always posted pretty good shot volume, even in his 17 and 18 yo seasons (he was really something at that age), but three of the last four seasons of shot volume have fallen below Rooney's career average. Not entirely sure why that has happened:

  • Declining team talent level?
  • Different tactical usage?
  • Different team tactics?
  • Decline in his own game?

The first 3 points have merit, hell even the fourth one may have merit but Rooney's contribution numbers have held steady despite his shot rate declining.

Conversion% Image

Part of the reason Rooney's Goals p90 numbers have remained strong despite below average shots generation is due to the graph above. Rooney's conversion % has been on an upward trend (bar a couple of down years) for the players entire career. It is possible that Rooney has become a better shooter as he has grown older, or that he has learned how to shoot from better positions on the field. It is also possible that tactics were geared towards getting Rooney into the best scoring positions possible.

It is certainly a curious trend, though.

Conclusion

Rooney has been an excellent footballer throughout his career and we don't need to waste too much time arguing otherwise. Has he become as good as hoped? Maybe not, but he is a player who contributes in terms of goals and assists at a very good level despite the changeable quality of teammate over the years.

As for Scholes' theory that Rooney may have peaked in 11/12 (26), well, I'm not so sure.

It is easy to see why Scholes may have come to that conclusion: Rooney played the most number of minutes of his career and as the main striker. He scored a ton, had his 3rd best shot volume season while posting the 2nd best conversion%. It is easy to see why such a season is held up as the last of Rooney's peak. Instead, it should be held up as an outlier season. A season of splendid achievement created by tactical usage, excellent health and a spike in both shot volume and accuracy.

It likely wasn't Rooney's peak from which he has now regressed. It's just that since that season Rooney's role has changed (he's assisting more goals), the quality of teammate and tactics may have changed, but still the player has posted 2 of his best 3 seasons of scoring contribution since he "peaked".

Rooney has been mighty good since 11/12, but he's been mighty good in a slightly different, more all-round way.

Career

Image

Attacking Styles and Defensive Weaknesses

An Expected Goals Model works by categorizing chances and assigning a value to each category. In most cases we just add up all Expected Goals for a team or a player to measure performance, but it's also interesting to take a closer look at those categories themselves. I've looked at a few recognizable 'types' of chances (based on shot type, location and assist type) and asked myself the question if a team's attacking style can be identified by the types of chances they create, and similarly if teams have certain defensive weaknesses against specific types of chances. In other words: how much do chances of a certain type contribute to the total ExpG or total conceded ExpG? Here are the numbers for the Premier League as a whole over the last four full seasons: totals To see if these numbers are actually meaningful I've looked how much they differ per team (relative standard deviation), and to what extend they are repeatable (correlation between the first and second half of a season). Any stat that tells something about a teams style should be repeatable at least. The first thing you'll notice is that repeatability can hardly be found in types of chances conceded. Teams play to their own strengths much more than they play to their opponents weaknesses. This actually surprised me a bit. I would suspect that if it's known that a team has trouble defending crosses other teams will use that knowledge, but it might be easier said than done if you don't have the players for it. On the other hand, a manager can change a team's attacking style as we will see later. A couple of examples: setpieces Teams that are consistently weak at defending set pieces? There's no such thing aside from one exception (the top right outlier): Arsenal during the 2010/2011 season. Penalties are all over the place and completely random: penalties Here you'll see that the creation of a certain type of chance is more spread out and shows more correlation than the amount of chances conceded of the same type: headers throughballs All in all I would say that there are only three numbers that are definitely meaningful: chances created from through balls, headers and shots from outside the box. Between through balls and headers there's also a negative correlation of 0.54. Without a doubt we're looking at different attacking styles. Here's a view of this season's data which I like to call arsenewenger.png: arsenewenger.png A closer look at Arsenal shows that although he fits right in, it's not just Özil either. Here are the top ten seasons (out of the last four) in terms of %ExpG from Through Balls: toptb You want more manager fingerprints? Here's the full picture from this season: allteams Notice Crystal Palace as the leading team when it comes to headers? It's no coincidence. Over the last four seasons under Tony Pulis, Stoke averaged more than 30%. Now Pulis gets the Palace job and immediately their percentage is up to 32.7% from 24.6% under Holloway. And then there's Swansea, currently the team with the lowest share of through balls. If they ever were a poor man's Arsenal they're not doing a very good job now. Under Brendan Rodgers in 2011/2012 they managed 11.1%, in the first half season under Laudrup it was even up to 11.8% but then it dropped to 4.6% and all the way down to 0.7% now (that is one shot from a through ball all season). This blows my mind as Michael Laudrup was an absolute master of the through ball himself. At the same time you can find Rodgers' first season at Liverpool in the top ten above, right there as the highest non-Arsenal team. That leaves us with one high profile managerial change which doesn't show such a clear picture. After David Moyes' move from Everton to Manchester United, Everton's headers are down slightly and shots from outside the box are up (Barkley, Mirallas), but it's not a huge difference. United's through balls are down a bit, and headers are up, but that trend was already going on under Ferguson: manu  

The Premier League 2003-2013: Points Per League Position

This will be a really short post today. The topic: historic Premier League points totals per table position.

It is most likely that this type of study has been undertaken before, so if it seems like I may have repeated previous work, please don't get mad. Assume I may not have seen said previous work, send me a link of said previous work and I will link it at the top of this page.

I have pulled the last ten years worth of PL tables (2003/4 to 2012/13) and the points total for each of the 20 positions in the table. It looks like this:

Ten Year Table

Pos Mean Mode Median PPG
1 88.6 89 89 2.33
2 81.9 83 83 2.15
3 75.8 75 75 2.00
4 68.8 68 68.5 1.81
5 64.0 65 64 1.68
6 60.8 58 61 1.60
7 57.1 53 56 1.50
8 53.1 49 52.5 1.40
9 51.0 52 52 1.34
10 48.7 47 49.5 1.28
11 46.8 47 47 1.23
12 45.4 46 46 1.19
13 43.7 42 44 1.15
14 42.7 45 43 1.12
15 41.5 41 41.5 1.09
16 39.3 36 39 1.03
17 37.3 35 37.5 0.98
18 35.0 36 35 0.92
19 32.1 30 32.5 0.85
20 25.3 25 26.5 0.67

Ten Year Table In Graph Form

Every season previous to 2013/14 is plotted on this graph (grey lines) and the red line is the ten year average.

Points_table_10_medium

Of Interest:

  • The 10 year average says there is likely to be one terrible team cut off from the rest.
  • Top 3 are separated somewhat.
  • Points gap between each positions gets closer as we move down the table.
  • The two low points for Fourth place were 60 and 61 points in 03/04 and 04/5.
  • I'm not entirely sure which way to solve this problem, but should any work on "points required to win the title/4th place/avoid relegation?" use the average points won for 1st/4th/17th or should we use 2nd+1 point/5th+ 1 points/18th+1 point?

I've no idea what the answer is for point four, but I recall a recent conversation on twitter about this very subject between @theM_L_G and @JamesWGrayson. So, we have looked at the average number of points that each table position records, we have also seen that information in graph form. The question now is, how does the 13/14 season shape up in comparison to this ten year average?

Are the top 6 over performing, are the bottom three weaker that the ten year historical average?

Ten Year PPG Pace

2014_ppg_historical_medium

Right now, positions 2-9 are are recording points per game at a significantly higher clip than the ten year average. This over performance comes at the expense of positions 10-18. Also, the gap between 8th place and 10th place is really something: Newcastle (8th) 36 points, Villa (10th) 24 points.

Has the top of the league become stronger? Have the bottom ten teams become weaker? Are the results in the chart above simply variance of just 22 games played? Possibly.

It is also possible that the 2013/14 season is an outlier, just as it is possible that 2013/14 may be the start (or middle) of a trend which sees the richer, more successful clubs record points total above historical averages.

I don't want to dig too far into that today, instead all the information needed to conduct your own investigations are at the bottom of the page. I'm lazy, see!

Working Out

Show yer working out!

Just copy and paste.

Pos S 12/13 S 11/12 S 10/11 S 09/10 S 08/09 S 07/08 S 06/07 S 05/06 S 04/05 S 03/4 Average
1 89 89 80 86 90 87 89 91 95 90 88.6
2 78 89 71 85 86 85 83 83 83 79 82.2
3 75 70 71 75 83 83 68 82 77 75 75.9
4 73 69 68 70 72 76 68 67 61 60 68.4
5 72 65 62 67 63 65 60 65 58 56 63.3
6 63 64 58 64 62 60 58 63 58 56 60.6
7 61 56 54 63 53 58 56 58 55 53 56.7
8 49 52 49 61 51 57 55 56 52 53 53.5
9 46 52 48 50 51 55 54 55 52 52 51.5
10 46 47 47 50 50 49 52 51 47 50 48.9
11 44 47 47 47 45 46 50 50 46 48 47
12 43 47 46 46 45 43 46 48 45 47 45.6
13 42 45 46 44 41 42 43 47 44 45 43.9
14 41 45 46 39 41 40 42 45 44 45 42.8
15 41 43 43 38 41 39 41 43 42 44 41.5
16 41 38 42 36 36 37 39 42 39 41 39.1
17 39 37 40 35 35 36 38 38 34 39 37.1
18 36 36 39 30 34 36 38 34 33 33 34.9
19 28 31 39 30 32 35 34 30 33 33 32.5
20 25 25 33 19 32 11 28 15 32 33 25.3
Total 1032 1047 1029 1035 1043 1040 1042 1063 1030 1032

Can You Get Away With a Foul Early in the Match?

Referees are sometimes lauded for keeping the cards in their pockets for as long as possible, but are players taking advantage of this? This graph may raise a few eyebrows: Yellow Cards vs Free Kicks While free kicks are spread out evenly over the duration of the match, the amount of yellow cards increases steadily as the game goes on. This suggests that the chance of getting a card when you concede a free kick increases as well. Unless fouls are in fact steadily getting more reckless, it doesn't seem like they are judged entirely on their own merits. Of course there are different reasons for a referee to give a free kick or yellow card. I've looked at minute-by-minute data of every Premier League match since 2009/2010 from whoscored.com, which provides a description along with every free kick or yellow card event. The distinctions made in these descriptions are not terribly specific, but it goes as long way. Let's look at the classification of yellow cards: Yellow Cards Classification You can see the same increase in cards as in the previous graph, but it's clear that the composition changes over time. The share of yellow cards for unspecified reasons ("other") increases from almost non-existent to close to half of all cards. I can only assume that these are mostly for things like time-wasting, kicking the ball away, dissent, etc., which become more of an issue later in the match. For the most part this explains the increase in the second half, but it still doesn't explain what happens in the first. A possible answer can be found in the official rules, which state that "persistent infringement of the Laws of the Game" is also a cautionable offence. That means fouls don't actually have to be judged on their own merits and it makes sense to look at the amount of fouls committed by the player that receives the yellow card as well. In the next graph I've separated yellow cards received for "real" fouls (kicking/holding an opponent etc.) into those received for first and for subsequent offences: Yellow Cards First Foul Now it's clear that the chance of getting a card for a single foul is fairly consistent during three quarters of the match, but the opening stages are still an anomaly. The only other explanation I can think of is that referees are conscious of the fact that a card early in the match is a harsher punishment than a card later in the match. In my previous article I calculated this effect for red cards, and to a certain extend it must be true for yellow cards as well. Players already on a yellow run the risk of getting a second and will be more careful making fouls in the rest of the match. The numbers show that on average, a player receiving a yellow card will have made 0.59 previous fouls and will only make another 0.36 fouls in the rest of the match. Of course this is skewed by the fact that the average yellow is given after 59% of the match. If we correct for that it's 0.5 vs 0.42. It's a minor effect, but it's there. To be certain I've also looked at hand balls, which I expect will be judged on their own merits. Free kicks given for hand balls are evenly spread out as well, but the risk of getting a yellow for it is 60% higher in the second half than in the first. All things considered it looks like it's true: it is easier to get away with a foul early in the match.

Luis Suárez: The Perfect Storm

Luis Suarez is a brilliant footballer. I think we are now beginning to get to the point where his on-field performances; his influence on his team-mates; and the impact he has on opposition defenses is such that he can be classed as a genuine superstar of world football. Suarez a superstar? Yes, and it no longer feels like a hyperbolic soundbite.

Suarez is frightening opposition defenses. He's butchering weak opposition and outperforming the toughest competition. He's arrived.

An admission: I was always a fan of Suarez despite some very real concerns about inefficiencies in shot selection and pass selection. Suarez, despite some bad, just had too many good qualities to his game for me not to sold on him.

And before I am accused of jumping on any bandwagons following Suarez's hot start to 13/14, I must mention that I was very much behind Arsenal pushing beyond the quoted £40m asking price and signing the player. I believed Suarez was worth the money then and I still believe Suarez is worth that money, and then some. 17 goals in 11 league games tends to bump valuations somewhat.

***

The main purpose of this article is to examine Luis Suarez's hot start to the 13/14 season; how it ranks when placed against Suarez's Liverpool career numbers; and how sustainable Suarez's 13/14 numbers may be.

Liverpool Career

This is what Luis Suarez's Liverpool career numbers look like:

  • A solid start in 10/11. Excellent shots numbers undermined by terrible conversion and scoring percentages.
  • 11/12 saw shots numbers remain at roughly the same rate per90. Scoring% ticked up a touch as did key passes per90. The goals per90 is still pretty average.
  • 12/13: explosions in the sky! Shots, SoT and key passes are all up year on year. The boost in scoring% (goals/SoT) and conversion% (goals/total shots) boosted the goals per90 number to a Liverpool career high.
  • 13/14 is other worldly. The shots per90 number looks like the bastard offspring of Messi and Ronaldo. The Shots on Target per90 number is the best 11 game sample I have ever seen as is the Goals per90. Shot volume certainly helped Suarez to score 17 in 11 games but the main drivers are those conversion and scoring% numbers.
Shots SoT Goals Assists KP mins Sc% SoT% Conv%
S 10/11 4.50 1.88 0.33 0.25 1.97 1099 17.39 41.82 7.27
S 11/12 4.56 1.66 0.39 0.11 2.33 2545 21.74 36.22 7.87
S 12/13 5.70 2.07 0.64 0.12 2.74 2953 30.88 36.36 11.23
S 13/14 6.20 3.37 1.55 0.36 2.92 987 45.95 54.41 25.00

13/14 Scoring% is historically high for Suarez's career, but it is also high when placed against his peers' numbers. Suarez's scoring%, in my opinion, is not sustainable long-term.

If you're the type of girl/guy who prefers to use all of a players' shots in conversion stats then focus on Conv% which is, when placed against the previous 3 seasons, seems inordinately high.

So What Is Going On With Suarez's 13/14 Numbers?

Small(ish) sample. The scoring% and conversion% numbers should both cool down over a larger sample (the rest of the season) and that will likely mean a slowing of his 326 goal pace that he is currently operating at.

But what about Suarez's shots numbers which are out of this world? Hmmm, good question. Like most excellent forwards, Suarez is a flat-track bully who butchers weak opposition and a cursory look at the games Suarez has played this season gives us an indication of the opposition strength:

Lpool_fixt_medium

Newcastle, Arsenal, Everton and Tottenham were the tough fixtures. The remaining schedule is pretty easy. Could it be that Suarez is padding his shots numbers against teams who are clearly no match for his talent level?

The flat-track bully element to Suarez's game, and every other good strikers game, is not meant as a criticism. Good strikers feast on weak teams and it may just be that Suarez has faced 7 or 8 teams who, for whatever reason, are pretty weak now. This is my theory, and feel free to ridicule it!

I will probably test Suarez's performance against, say, Top 7 teams and the rest of the league when I manage to find a hour free to do so.

***

We know what Suarez's career box numbers look like and we know that this hot start to the season looks to be a level of performance above and beyond Suarez's career average. What I want to look at now is just how abnormal Suarez's start to the 13/14 season is.

To look at how abnormal the hot start is I am going to look at Suarez's Liverpool career numbers using an 11 game rolling average  so as to compare 13/14's 11 game stretch with the other 77  11 game stretches. I want to know if Suarez has enjoyed a hot streak like this in terms of shots, conversion% or goals per90 in his Liverpool career previous to the start of the 13/14 season.

Shot Volume

Sua_shot_volume_medium

Shots per90 is pretty variable: 3 peaks and 3 valleys within those 76 buckets worth of 11 games. Suarez's overall shots per90 volume is excellent.

Shots On Target per90 was fairly stable in the first 60 games at the club. Since then, the SoT per90 volume has been on the march with a notable spike in the last 30 games. I'm not particularly sure why we have seen a recent improvement in shots on target per90 volume.

Shots On Target% & Scoring%

Shots on target% = shots on target/total shots. Scoring%=goals/shots on target.

Sua_sot__medium

As stated previously, Suarez's ability to get shots on target has improved recently and that improvement shows up inSoT%.

Suarez's Scoring% (my preferred conversion stat) is not particularly stable. There doesn't look to be any long term improvement in Suarez's ability to convert shots on target into goals; it merely looks like a lot of noise to me. In fact, as good/"lucky" as Suarez's scoring% (45.9%) is, Suarez has posted better 11 game spans of scoring%.

Suarez posted five spans of >46% scoring% and those spans came at the start of the 2012/13 season. In short: we have been here before with Suarez and a high scoring%.

That hot scoring% cooled off pretty sharply.

Conversion%

Conversion%=goals/total shots.

If you prefer to focus on a players conversion stats by using all shots that a player takes the we can look at the graph above.

A crazy barren period at the start of Suarez's career is a mystery to me. (Liverpool fans?) But following that barren period we see that Suarez's conversion% bobbed up and down, neither too high nor too low; no droughts or extended hots streaks and the BAM! Look at the far right hand side of the chart. That spike is completely out of keeping with the Suarez's career rates.

Suarez's career conversion% is 12.07%. In 13/14 Suarez's conversion% is 25%. That 25% number is out of keeping with Suarez's Liverpool career. It looks like an anomaly. Or, maybe there is something I am missing. Maybe Liverpool's tactical setup, the quality of his team-mates or weak opponents have led to the spike in Suarez's conversion%? Or it could be the amount of time Liverpool spend winning, and thrashing, their opponents?

I'd say variance with a side dish of weak opposition.

Goals Per90

If we add a recent spike in shots on target volume, a spike in shooting accuracy, a spike in conversion% and scoring% what do we get?  A goals per90 spike.

Goals_per90_medium

This, I believe, is the most extreme graph. After a tough start to Suarez's career, which included that extended barren spell, Suarez numbers, with no little variance, have stayed at an elite level (buckets 32-75). What has happened in buckets 75-78 can only be described as freakish. A perfect storm, if you like.

That perfect storm was caused by:

  • The 2nd best shots per90 rate in Suarez's Liverpool career.
  • The best SoT per90 rate in Suarez's Liverpool career.
  • The 2nd best SoT% in Suarez's Liverpool career.
  • The 6th best Scoring% in Suarez's Liverpool career.
  • The best Conversion% in Suarez's Liverpool career.

If we add all of the above together it becomes clear just how Suarez has posted 17 goals in 11 games so far this season.

If we take a guess and say that the shots volume and SoT% may have been caused in small part by some weak opponents, improved tactics and the thrashings that Liverpool have dished out, then what can we say the spike in conversion% was caused by?

Is the spike in conversion% solely caused by variance? Or is some small part of it tactical or influenced by opponent strength? I cannot be certain either way. We know shooting% regresses on a team level and may be a pretty good guess when looking at Suarez's conversion% chart that conversion% isn't a consistently repeatable skill from 5 games or so to the next 5 games or so.

Going forward I expect Suarez to continue to post high shot volume numbers (although they will cool off some) but I am far less certain about Suarez's ability to maintain those conversion% numbers. If Suarez's conversion% numbers cool that will likely mean that Suarez's Goals per90 numbers cool also.

This wouldn't be the end of the world. Suarez would continue to perform well, create tremendous shot volume and score at an elite clip. But regression in the conversion% means Suarez may well drop from Messi-like heights and rejoin the mere mortals.

Suarez is a brilliant player, who will deservedly win the golden boot, but I'll stick my neck out and say that Suarez cannot maintain a conversion% that is double his Liverpool career average. The goals may slow down a little, but that's fine.

Incredible hot streaks don't last forever.

Score Effects

One of the most crucial findings of the nascent football analytics community was the discovery of shots ratios and their powerful predictive power. The discovery that year-on-year shot differential at the team level was repeatable, and largely skill driven (86% skill/14% luck), enabled the community to write and talk about a teams dominance without having to refer to league points or placings.

Football was merely catching up with what hockey had known for a number of years.

Shots Ratios/Differentials are, in general (obviously there are exceptions), a proxy for something else - control, territory, scoring chances and they tell us some, but not all, about a teams underlying dominance over it's it's opponents and it's fixture list. A team that takes 60% of the shots in it's games will, over time, be more successful than a team that takes 30% of the shots.

But there's a problem with using basic shots numbers as a cast iron indication of dominance and that problem is called goals. Specifically the effect that the scoring of a goal has on the dynamics of a game.

The team that takes the lead in any given fixture is likely to sit a little deeper and take fewer shots. The team that is trailing will attack more and take more shots - especially as time begins to tick down. The wisdom of this strategy - tactical or subconscious - is questionable, for what team would willingly choose to cede territory and concede an increasing number of shots?

In this post I'm going to present some numbers on Score Effects which will show what teams do when leading or trailing by a goal and why those teams employ the seemingly odd strategies that they do.

*Note: I wish I had more data to use but my database melted into oblivion over the summer. Alas, we have 13/14 season to work with.

TSR

Our entire sample is tens of thousands of minutes of football and nearly 3500 shots. But the crucial game states to look at are those which fall under 'Close': minus 1, tied and plus 1. This is where 85% of game time takes place, 83.9% of all shot events take place and it's also the where we see the best examples of how goals lead to score effects.

I have included all game states in the following charts, but as stated above we are really only interested in the game states which fall under Close. The sample size of +3, +4 etc just isn't big enough to draw any conclusions.

Score_effects_tsr_medium

This is Total Shots Ratio (shots for/shots for+shots against) and straight away we see some things of interest:

  • Tied TSR is 50%.
  • Teams at Plus 1 get out-shot by a decent margin 46.6% to 53.4%.

It's a curious thing but teams who are leading by a goal tend to construct something that is called a 'defensive shell' that sees the leading team, in most cases and especially away from home, tighten up their defensive shape and drop deeper. For the leading team preventing an equalizer is more valuable than trying to score a second goal. All these things lead to the team at plus 1 losing the shots battle and the team at minus 1 winning the shots battle.

We often hear of managers who want their teams to play the same way when winning as they do when they are losing, but the data says that this doesn't actually happen (except for a few elite clubs). Why do teams play differently when leading? It could be tactical or it could be a collective response from players who are risk averse and want to protect the slender lead.

Quick Hit: Team trailing at -1, on average, tends to out-shoot their opponents due to a mix of their own desperation to equalize and the leading teams' tactical conservatism in protecting their game position. Why are teams out-shot when leading by a goal?

Shots On Target Ratio

Score_effects_sptr_medium

This time we are looking at shots on target. Similar results are evident:

  • Teams at +1 lose the shots battle 47.85% to 52.15%.

Teams who lead by a single goal (plus 1) are out-shot by TSR and SoTR but the shots on target battle is a little closer:

Minus 1 Tied Plus 1
TSR 53.36 50.00 46.64
SoTR 52.15 50.00 47.85

The table above likely shows some of the positive effects of a defensive shell. Yes, the leading team gives up an increased number of shots against and thus sees it's TSR suffer, but in defending deeper in a more compact shape it's shots on target ratio doesn't deflate to quite the same extent. Two reasons why, at plus 1, SoTR is higher than TSR:

  1. The defensive shell works and forces the trailing opposition team to take shots from increased distances, from worse angles or under more pressure with less space. The pressure, the bad angles and the increased distances all contribute to the leading team being able to prevent a higher number of the trailing teams shots from finding their way on target.
  2. The leading team is able to exploit the desperation of the trailing team and counter attack into more space with fewer defenders present. That space and lack of defensive pressure leads to a higher percentage of the leading teams shots to find their way on target.

Quick Hit: Teams trailing at -1 shoot their opponents by shots on target but the margin is smaller than when looking at total shots.

Shots On target Percentage

Complete for/against chart with SoT % rating.

Score_effects_sot__medium

This chart shows us the percentage of team shots for that end up on target. In the section above I talked about the space and lack of pressure the +1 team faces when attacking and we see the effects in this chart.

Plus 1 SoT% is 34.93% which is a touch higher than the number teams post at minus 1. The reasons for this can be seen in bold above. It's pretty simple really, trailing teams find it harder to post good Sot efficiency numbers due to the leading teams shell. There may also be a touch of desperation to the trailing teams shots selection.

The trailing team also cheats for offense which leaves them open to effective counters.

Quick Hit: Team at +1 (and further) receives a boost in SoT For% & SoT Prevention%. Team at -1 suffers a decline in comparison to plus 1 in both Sot For% & SoT Prevention%.

Scoring%, Save% & PDO

Pdo_gs_medium

As stated previously, any information outside of +1/-1 is likely too small a sample to be trusted at this point.

Close Game States contain ~84% of the shots information so we shall focus on close. It's also worth noting that there is massive variance in sc% and sv% in small samples (see Arsenal's scoring% at tied which is contributing to the high league Tied sc% for an explanation).

Scoring%

Scoring% at plus 1 sits at 29.8% which is significantly higher than scoring% at minus 1. Again, the leading team, in general, attacks into more space with less defensive pressure so it's no real surprise to see plus 1 scoring% so much higher than scoring% at minus 1. Minus 1 scoring% runs into that defensive shell - lots of bodies/pressure/little space - and suffers for it.

Save%

We see a boost for the leading teams save% (defensive shell, forcing shots to the outside). Save% at minus 1 is significantly when compared  to plus 1. The trailing team may well be cheating for offense which leads to a higher percentage of shots against actually getting on target. That same cheating for offense may also contribute to a lower save%.

PDO

Add the scoring% and save% numbers together for each individual game state and we end up with a PDO rating. PDO gets a pretty big boost at +1 and a pretty sharp drop at -1.

Goal Share %

Score_effects_goal___medium

The final graph is the most telling. Things we know so far: The trailing team is the stronger by the shots count but weaker in terms of efficiency and conversion percentages. The leading team has a tactical advantage in that they have possession of the lead, can tighten their defensive shape and in attack capitalize on the trailing teams desperation in trying to find an equalizer. For the leading team, not conceding an equalizer is more valuable than scoring a second goal, and that tactical mindset is evident in all of the charts above.

The result of all the things we have looked at can be easily summarized: The leading team (+1) scores 52.94% of the goals and concedes 47.06%. And that is despite being out-shot by both total shots and shots on target.

Tactics - defensive shape and counter attacking threat  - actually matter a hell of a lot to the team that is leading by a single goal.

Those tactics reduce the oppositions efficiency and conversion percentages while boosting their own efficiency and conversion percentages. The result of those tactics is a greater likelihood that the next goal of the game will be scored by the team already leading.

Notes & Further Questions

I'm far from happy that I can't publish a study on score effects that features a far larger data sample but I felt that score effects and game states had begun to feature in my work to such an extent than an explanatory post on the topic was necessary.

Some of these numbers may well change over the course of the season, or over the course of the next three seasons but hey, I felt I had to address the topic. The question of shot quality is a hot topic in football analytics these days. The question of how much shot quality matters needs to be answered, and it will be.

But I do wonder to what extent scoring or save% boosts at +1 and +2 game states can sometimes skew our interpretation of teams' overall numbers. We know 'good' teams can sometimes sustain PDO's north of the league average. Is that sustain positive proof of an ability to create better chances (shot quality) and prevent quality chances against or is it merely a function of the boost that good teams receive by spending a lot of time in winning (+1, +2) positions?

Are Arsenal's and Liverpool's save percentages indicative of a well rounded defensive scheme no matter if the scoreline is in their favour or not?

Or are those teams save percentages and defensive schemes boosted by spending above and beyond an average of 45 minutes per game in a winning position?

Teams with good attacking and defensive schemes tend to find ways to get into the lead more often that not.  Not all of a team X's impressive conversion numbers are due solely to score effects but some of it may well be.

On a individual player level who's to say that what looks like a sustained shot quality ability isn't just a function of playing on a dominant team who spend a huge chunk of their games in a positive game state?

Scoring becomes easier when your team is winning by two or three against demoralized opposition.

Lots of questions, more miles to be covered.

La Liga 2013/14: Forwards & Per 90 Numbers

La Liga: Clubs struggling under piles of debt; squads wrecked by the sale of their best and brightest; fans turning away from subscription channels like Canal+ and GolTV in their droves. It's pretty bleak in Spain if you are a football fan.

Not all the news out of Spain is doom-laden, though: Bale's signing broke  the world record for the highest transfer fee; Neymar was (I think) the second most expensive transfer in 2013/14; Atletico are mighty good; Simeone is God and Diego Costa is not only the most improved player, he may also be about to declare for the Spanish national team! There could also be a three-way battle for the title for the first time in years.

During the Summer I made some mental notes about which stats and leagues I was going to track this year apart from the PL. La Liga was due to be the second league tracked.

That tracking lasted all of 3 games before I realized that it was pretty pointless. La Liga is not a level playing field, the TV money is distributed in a cruel and damaging manner to any team not named Barca or Madrid and to put it bluntly: La Liga is dull and at times unwatchable from this writers perspective.

So why an article about la Liga if I have all this hate for the darn thing!? La Liga has some nice players, specifically forwards (non-attacking mids), and as part of my rebuilding of the Per90 database I decided to check in on some of the best forwards that la Liga has to offer.

Some of these players are pretty high in the scoring charts, others are established players and two (Neymar and Bale) are positionally fluid and could of been discarded from this list. But I create the list, so those players stay for now.

La Liga After 12 Games: Forward Per 90's

*An extensive explanation of what these metrics mean can be found here. Penalties are stripped out.


Player Name Shots p90 SoT p90 Goals p90 Assists p90 Sc% SoT% Passes p90 Give- aways ToP%
Sanchez 3.04 1.6 1.12 0.32 70 52.6 43.8 1.9 57.9
Diego Costa 3.87 2.13 1.06 0.1 50 55 31.9 6.2 95.6
Messi 7.16 3.51 0.95 0.54 26.92 49.1 61.9 2.3 68.5
Bale 2.78 1.39 0.83 1.11 60 50 33.6 3 33.3
Ronaldo 8.43 2.59 0.83 0.19 32.14 30.8 37.8 3.3 100
Guerra 2.29 1.46 0.62 42.86 63.6 34.6 4.1 89.1
Dos Santos 3.68 1.59 0.61 0.37 38.46 43.3 29.9 3.1 75.6
Rodri 2.58 1.49 0.6 40 57.7 20.7 4.5 93.2
Benzema 3.49 1.4 0.58 0.47 41.67 40 30.8 2.4 79.5
Villa 3.3 1.82 0.57 0.23 31.25 55.2 22.6 4 81.3
Gamiero 2.27 1.2 0.53 0.13 44.44 52.9 24.1 2.4 69.3
Neymar 3.38 1.49 0.41 0.95 27.27 44 59.3 4 68.4
Seferovic 4.09 1.56 0.39 0.19 25 38.1 34.5 3.5 47.5

This table is set to Goals per90 but you guys can easily scrape it into a spreadsheet to make it sortable.

Diego Costa is the most interesting player for me. Costa is not a prolific shooter, but has a crazy good goals p90 due to what are likely unsustainable Scoring% and SoT% numbers. Worth looking at Costa's giveaways, but I'll have more on that shortly.

Shots & SoT Per 90

La_liga_game_12_medium


This is how some of the best forwards in la Liga are performing shots wise through the first 10 games.

Of the humans, Diego Costa and Villa are two of the more efficient players in the league (fits with Atletico's system). Seferovic is just 21 years old and is a player is of interest for the rest of the season. Bale looks very un-Bale like so far. A bad back, muscle trouble and new systems may explain some of that performance. Bale's last two games have been crazy good though.

There are two players in that chart that aren't human in terms of shots performance. Messi is more efficient and manages to get 3.5 shots on target per 90 (it's a crazy number, really), Ronaldo is the bigger volume shooter with just short of 8.5 shots per 90. Silly, stupid out of this world numbers.

Giveaways & Passes Per 90

Giveaways = intercepted+tackled

Now, I only posted the chart below as I wanted to see how readers felt about giveaways. When we look at this chart it's obvious that Barcelona have a system that focuses on passing and not giving the ball away, but Barca are a rare beast and not too helpful for the giveaway question I want to ask.


La_liga_10_give_aways_medium


Are giveaways a product of the team system or are they a product of where a player is located on the pitch? If Diego Costa is operating and passing in high risk areas of the pitch then surely his giveaways p90 will be high (see Suarez, Sturridge and Aguero who all post higher giveaway numbers than Costa). Or am I being too generous to Costa in speculating that his position on the pitch may be the cause of all those giveaways?

Maybe giveaways merely point to poor decision making and execution. I'm curious though so any ideas are welcome.

Further reading on weighted pass difficulty from the peerless Gabriel Desjardin at Arctic Ice Hockey & BTN

Pass_completion_by_target_zone_medium

Anyhow, food for thought. I'll probably look at another league in the next couple of weeks so if anybody has any specific request let me know.


10 Points: Evil, Regression, Fulham & Striker Per90's (wk 9)

 1) Deep Breath

When do we begin to panic over Man City's 7th place, 16 point haul? NOW! screams the generic fan. Maybe I have mellowed in my old age, maybe I don't care as much, but I am absolutely miles away from panic.

Either way, we must look at Man City's form and be gently concerned at certain traits.

  • Defensive lapses.
  • Goalkeeper having a crazy, uncharacteristic funk in form.
  • Kompany's injury breakdowns.

Here's the thing: I don't see how any of the three points that I quickly thought of are systemic faults in tactics or setup and thus can be pinned on Pellegrini.

Pellegrini can set up his team in meticulous fashion, get his tactics and personnel spot on, Man City can out-shoot their opponents, out-chance their opponents, but he can do very little about the daggers than keep piercing his best laid plans. Those daggers are individual mistakes, 5 second mistakes in a 96 minute game and they are costing Man City dearly right now. Hart, Nastasic, Kompany, Clichy, Negredo. Pick any names you want.

Man City's tactical setup, both in attack and defense is absolutely fine, in fact it is producing some of the best underlying numbers in the league. So we don't need to worry about the system Pellegrini is employing.

Think of Man City team as a huge, elegant steam liner. These individual mistakes are the giant anchor that is stuck fast to the sea bed.

Time for Joe to sit for a game or two. Have a rest, work with him on some technical issues/decision making, bring him back into a side that has Kompany in it.

 2) Torres To Aguero

Niall Quinn made an interesting point during Sky's broadcast yesterday. When asked when we'll know if Fernando Torres is back to his old form Quinn replied "when he is scoring two or three goals a game".

We know Quinn's statement is nonsense, we all laughed. But the discussion had me thinking, just how good does Torres look in the PL this year? Obviously the goals haven't flowed, but maybe the players underlying numbers can point to a return to form?

9 games into the season this is how a select group of strikers are performing:


Name Shots p90 SoT p90 Gls p90 A p90 Sc% SoT% Pass p90 ToP%
Suarez 6.42 3.35 1.68 0.28 50 52.2 48.6 44.2
Aguero 4.12 2.74 1.2 0.34 43.75 66.7 32.8 72
Sturridge 3.98 1.86 0.99 0.25 53.33 46.9 31.3 99.4
Benteke 3.55 1.97 0.79 40 55.6 42.2 62.6
RvP 4.81 1.55 0.78 0.16 50 32.3 25.1 79.6
Giroud 4.67 1.43 0.65 0.52 45.45 30.6 33.9 95.2
Negredo 3.65 1.22 0.61 0.41 50 33.3 29.8 60.9
Rooney 3.82 1.98 0.61 0.31 30.77 52 55.4 80.9
Eto'o 4.88 2.44 0.41 0.41 16.67 50 24.4 30.4
Torres 3.69 1.42 0.28 0.28 20 38.5 26.7 43.5


Torres has pretty similar SoT numbers to Olivier Giroud. Giroud has the hot scoring%, Torres doesn't.

Suarez is out of this world in his shortened season. Aguero is dynamite in every category. Sturridge has some really nice shots numbers but the goals are coming from that unsustainable scoring%, which will cool off. Also, Sturridge needs some rest, he'll become jaded or, worse, injured if he continues to play nearly every minute available.

Torres's shots and shots on target numbers are an improvement on previous seasons but they still aren't super good. The low scoring% is the anchor.

3) Player Of The Week

Suarez v West Brom. Yes, we know that Suarez crushes teams like this, but it's still nice to see one of the league's best operators in top form.

4) Southampton & Stats

Mauricio Pochettino

"I think statistics are evil," he said. "They don't really show anything. "Today it is okay as we win, but when you lose they are not as important. "I think more than anything today it is about how we played aside from the three points, aside from getting the victory. "Statistics are relative and more than anything I am satisfied with how we won today."

Pretty funny, really. Maybe MP meant it, maybe it was something that got lost in translation.

Statistics may be evil, at least in Pochettino's mind, but in the first 9 games they have some dark, evil love for Southampton. Let's see if some numbers which tell us some nice things about Pochettino's defensive scheme can convince him!

SoT Prevention% (how good a team is at preventing the opposition from getting shots on target) 70.47% (3rd)

Save% 88.46% (1st - by a mile)
 
Goals Against three (1st)
 
Final Third Passes Against 1011 (3rd)
 
Shots Against 88 (2nd after the defensive chaos and turmoil that is Man City)
 

All of these numbers tell us that Southampton have some really good things going on defensively. Southampton are able to restrict the opposition passing in their own third of the pitch, they are also able to restrict the number of shots against and how many of those are actually on target. All told, Southampton have some wicked defensive numbers.

But, and there is always a but, Southampton's save% is a thing we must talk about. At 88% it is around 16% points above the league average. It is not going to stay 16% points above league average, in fact the save percentage is going to fall and regress.

When that save% does regress, Southampton's won't be able to sustain their current ppg clip unless they can significantly increase their offensive output to cover for the regression of said save%.

Southampton have a lot of really good things going for them, but that scary good save% is coming down.

Mauricio, un poco de musica para ti...puede aprender algo!


5) Quick Fire

Fernandinho Is starting, ever so slowly, to look really good. Hid performance in the 2nd half v Chelsea reminded me of his Shakhtar days. Quick, good passer, ball-carrier, destroyer.

Cardiff If Norwich can post 31(10) shots against you, then you have some serious issues with defending, control of the game and restricting the opposition.

Swansea Look like Barcelona right now in terms of their ability to get a high percentage f their shots on target. SoT for% currently stands at 43.3%. An interesting attacking scheme for sure.

Villa, of any PL team, have had by far the hardest set of fixtures through the first 9 games. That difficult run has ended, Villa are in good shape, it's now time to get more points on the board against some of the weaker teams. West Ham, Cardiff, West Brom & Sunderland are the next four fixtures.

6) Fulham, We're Worried About You

Fulham, you want to thank Crystal Palace and Sunderland for their utter ineptitude. For if they weren't so inept we may be talking about you a little bit more than we currently are. This may seem odd, right? Fulham have 10 points so far, hell they probably only need another 25 or 27 points to survive, so what's my problem?

Fulham are a horrible team. They are constantly out-shot, they lack pace and dynamism. Hell, the only thing they seem to be good at is getting the shots they take on target (Fulham's numbers are on par with Man City, Arsenal and Liverpool. Sustainable?). Anyway, I am not sure if Fulham can continue to be out-shot to the extent they are in each game they play. Fulham's Rolling Total Shots Count (9 games)

Obviously Fulham's SoT numbers don't look as bad as their shots numbers do, but both numbers are in the bottom two in the entire league. Now, there are no certainties in life but if Fulham continue to be out-shot by this margin or worse (they have faced soft competition so far) then they will be in deep relegation trouble.

Fulham cannot, and should not, believe that a PDO of 109  (above average) will continue to bail them out of the shots deficit.

Fulham are on course to be out-shot by 439 shots and 97 shots on target.

7) Tied GS Shots & Win %

Ever wondered what the w/d/l record of the team who out-shoots their opponents at Tied GS where score effects are at a minimum? Of course you haven't.

Anyhow, I wondered what the answer is so I pulled all 90 PL games this year and looked for the team with the highest number of shots at tied and checked that against the game result. I threw out the games where the shots count was tied (7 games) just because I felt like it!

Tied_shots_win_perc_medium

The dominant shot team at tied GS went W50 D18 L15. That works out at 2.02 ppg for the dominant shots team, which isn't bad at all. A list of Tied TSR teams can be found here.

Not sure it means too much after juts 9 rounds of fixtures (luck and variance etc), but I thought it was an interesting quirk and I was really struggling to fill this point with anything worthwhile!

8) Arsenal: The Good

Arsenal have had a tremendous start to the season and it's been a lot of fun to watch. Things that are going great for Arsenal:

  • Scoring% 35% (2nd)
  • Save% 78% (6th)
  • PDO  113 (3rd)
  • SoTR 58% (6th)
  • Time Spent Winning 49 minutes per game on average.

Shots on target ratio is pretty darn good but once we marry that to the scoring% and save% numbers then it's easy to see why Arsenal have been piling up the points.

At Tied Game State
  • SoTR 60.98%
  • Scoring% 47.61% (lge ave = 30%)
  • PDO 119 (lge ave = 100)

WHOA! Arsenal are a fine shots on target team at Tied GS (no score effects). Again, add the shots ratio to the scoring%/PDO and it's easy to see why Arsenal have had such a fine start to the season. Arsenal out-shoot their opponents and the convert their shots at a more efficient rate.

So far so good...

9) Arsenal: The Regression

Now I am going to be a dick and tell you why it might not continue. Things that will regress:

  • Arsenal's scoring% at Tied Game State. It's going to regress hard.
  • The amount of time spent winning and the booster effects to scoring% & save% that minutes spent in a winning position causes. You may think 49 minutes per game in a winning position is sustainable, I don't.

Another potential reason for Arsenal's excellent numbers is their strength of schedule. I have Arsenal down as having faced (10th game included) the weakest shots TSR teams, the 3rd weakest SoTR teams and the 2nd weakest final third possession teams.

Knowing this, it's understandable that Arsenal have beaten a lot of those teams quite handily, for Arsenal beat sub-par teams better than almost anyone else in the PL. Some of Arsenal's excellent scoring%'s and PDO numbers will regress, the shots ratios are also likely to come down over the coming weeks. Why?

Upcoming Fixtures: Liverpool (h) Man Utd (a) Southampton (h) Cardiff (a) Hull (h) Everton (h) City (a) Chelsea (h).

Wow, I count two easy games there in Cardiff and Hull. The rest? That's six of the seven best teams in the country that Arsenal have to play and those games are sandwiched in-between CL games and the notorious injury months of November and December.

I asked twitter this question: What is the O/U points for Arsenal's next 8 games? Twitter thinks it's around 12.5/13 points. That would leave Arsenal at 35 points from 17 games. A good haul, but not title form.

10) Goal of The Week

Sturridge. Bad keeping but hey, the execution was dreamy.

10 Points: Arsenal, Requirements, Set Pieces & Game State Effects


1) Goal Of The Week

Kasaaaaami! This is what I said on twitter on Sunday morning:

@mixedknuts Unless van Basten, circa '88, scores today then Arsenal's first will be the nicest goal for a long time... — Ben Pugsley (@benjaminpugsley) October 20, 2013

And just like that the Pajtim Kasami scored a goal which had tiny hints of the peerless Marco Van Basten sprinkled over it.

2) Scoring

We've been through this before at 10 Points, but @richardwhittall brought it back up again!

Whittall: While it’s certainly possible that something was up early on and has now smoothed itself out, it’s equally possible that the slow opening was just a tick of the needle in the wrong direction, a quirk of random variation. Perhaps as the games pile up, that number may creep ever higher, or, as is more likely, plateau. We should keep this in mind before rushing off to search for meaning in seasonal goal-per-game trends. Historical trends are far more telling of the health of the sport.

Agreed. From the start of this debate I always maintained that shots on target were pretty stable, shots on target% was also pretty stable and at normal historic levels. Instead, the lack of goals was all due to the weirdness of scoring% (goals/shots on target).

The historical average for Scoring% is about 31%-ish. As we can see from the graph below the PL's first 4 weeks of the season saw pretty low levels of scoring% and, in week 3, a ridiculously low scoring% number. Reasons for that 4 week stretch to open the season? No idea, who the fuck cares, it's probably variance and luck and maybe some system effects in the early season.

As we can see from the chart below rolling scoring% is on the rise. REGRESSION! Scoring%, by the seasons end, will settle at ~31%.

Sc__wk_8_medium

3) Arsenal: Shots Influence

Arsenal are top of the league after 8 games and congratulations to them. They have recorded some excellent results so far, although slight negatives would be the weak quality of opposition that Arsenal have faced and Arsenal's non-stellar underlying numbers.

Anyway, I don't want to be a killjoy about a team who is playing some bloody nice football and should get better when some key players return from injury. Wenger must rotate his players in November and December though, gotta keep the players fresh.

Shots Influence

Shots influence looks at each players contribution to team shots when on the field of play. So, we count a players shots and shots assists and divide them by the team total. Giroud and Ozil are the two players who are driving Arsenal's offensive output thus far. For me, Ramsey is by far the most interesting: why is Ramsey's number rising on a game by game basis? is Ramsey's role changing, which allows the player to be more influential, or is it something else? Confidence or a self belief that he can be an important contributor on the offensive side of the ball? It'll be interesting to see how long Ramsey continues this improvement in terms of shots influence.

4) Set Piece Stuff

Set pieces are funny old things, eh. I can't decide just what the luck/skill split is for set pieces and this makes evaluating some of these numbers problematic. If pushed I'd say shots creation/prevention has far more skill than luck.

Still, here are the set-piece SHOTS numbers through the first 80 games. *Set piece shots= shots from corners, shots from free kicks, shots from direct free kicks. (I wish I could separate direct free kick shots but I can't)


Sp_shots_wk8_medium

Man City are doing some pretty wild things in terms of generating set-piece shots for (1st) and preventing set-piece shots against (1st). This doesn't really fit with Man City the weak set-piece team. City have conceded a low, low number of shots from set-pieces but what about goals?

Sp_goals_wk8_medium

So, City have conceded just 14 shots from set-pieces but those 14 shots have yielded 4 goals. City conceded% is28.7%, league average is 9.2%. In short, City won't carry on conceding goals at that rate.

A word on Fulham who have conceded the most shots and taken the least shots from set-pieces. Fulham have scored 5 set-piece goals from 16 set-piece shots. Unsustainable to say the least.

5) Week 8 = No Shocks

I had a mighty good week in terms of betting on the PL; if I believed in accumulators then the girlfriends shoe collection would look a whole lot better right now!

This was the week of the fav: Chelsea, Arsenal, City, Arsenal, Fulham, Everton and Swansea. Even the tricky picks weren't that tricky. Stoke were a good shout to draw and opposing Liverpool and Man United in last weeks games wasn't too difficult a decision.

Having no shocks in a round of games is a pretty rare occurrence.

6) Requirements: Man United

Man United: Currently have 11 points from 8 games, which is very un-United like. Would it be fair to say 83 points would be in the ballpark to win the 2013/14 PL? That means Man United need 72 points or 2.4 ppg from here till the end of the season.

2.4ppg is a 91 point pace over the course of a 38 game season. Absolutely nothing about this Man United team gives us the slightest hint that they can suddenly become a team capable of 2.4 ppg/91 point season over 38 games.

There is a glimmer of hope for United in that their schedule has been mighty tough so far this season and at some point (last 10 games?) United's schedule will cool down significantly. Still, United are facing a 30 game run of 23 wins, 3 draws and 4 losses to get to 83 points by the seasons end. Even 83 points may not be enough.

6) Requirements: Sunderland

Sunderland have 1 point from their first 8 games. 38 points is the line in the sand for PL survival. 37 points from Sunderland's remaining 30 games works out at 1.23 ppg, or, normalized over a full 38 game season, ~47 points. It seems to be very unlikely that Poyet can turn this Sunderland side into an upper mid table team in his remaining 30 games.

Obviously, we never want to deal in certainties, but it looks pretty clear from this writers point of view that Sunderland are in desperate trouble. If you need further evidence, just go look at Sunderland's SoTR and PDO numbers from this post.

To me, in my dark, attempting to quit smoking mood, this is what doom sounds like. This is Sunderland's sound:

8) Palace: How Low Will You Go?

Two points from 8 games and looking severely over-matched in most games they have played, what will become of Crystal Palace? Relegation seems to be the likely answer and, quite frankly, it was always on the cards what with minimal investment and a thin squad to begin with.

Palace are on course for 9.5 points. Obviously that is not going to happen, but is 20 points a fair line in the sand for this Palace team? Is that too low?

How about 25 points which is the only live line I can find right now. Do Crystal Palace make it to 25 points? I'd be amazed, quite frankly. They appear to be awfully weak right across all positions and without a huge investment in January (unlikely) this looks like the worst team to grace the PL since those glorious Sunderland and Derby County teams.

Obviously, when Palace survive on the last day with 40 points, I expect someone to dig this up and tell me how stupid I am!

9) Game State Effects On Shooting Accuracy And Prevention

Long title, a ton of work but by the end of the season I will have so much information on game state effects that it will make the effort worth it.

For now, I just want to show you how the game state and the tactical effects of the game state affect shooting accuracy% (shots on target/total shots)

Shooting_acc_game_state_medium

Now, the information at +2 game state/-2 game state will need some time to smooth out but there are some interesting things going at the Close Game States.

Tied game state shows us information about teams' behaviour without any score effects so things here look pretty normal.

Plus 1 Game State is mighty interesting through the first 80 games: The team leading by a goal (plus1) manages to get a higher% of it's shots on target than their opponents who are trailing by a goal (35.2% to 33.7%) and we know this is probably due to shelling effects.

Shelling effects? The team that leads by a goal tends to sit back in a tight defensive shell which restricts their opponents ability to get shots on target. Included in this shelling tactic is the counter attacking bonus: it's easier for a team leading by a goal to create better shooting opportunities as it's trailing opponent pushes hard for an equalizer and leaves a lot of space to be exploited. That space allows the team at Plus 1 to get a higher percentage of their shots on target.

Looking at Minus 2 game state, it's easy to see why the game is virtually over with. The team that is trailing by two goals finds it extremely hard to get their shots on target, whilst at the same time leaving their defense horribly exposed to efficient opposition attacks.

In short, if your team falls a goal behind it's more difficult to get your own shots on target and the opposition find it easier to get their shots on target. Falling a goal behind is a lose-lose situation.

10) Team Goal Of The Week

A thing of beauty. Controlled passing, speed of thought and feet, and a snap finish by Wilshere on his right foot foxes the 'keeper. Beautiful goal.

10 Points: Ronaldo, Liverpool, D-Fence, Drunks & Close Goal Difference

By Ben Pugsley

1) Palace Defender Is Drunk!

Go to 1:39 of this video and watch #27 of Crystal Palace stumble around, fight with his balance and get nowhere near the twisting Daniel Sturridge. Now, you may miss it the important section of this video the first time around, but keep watching and be amazed at a pro athlete seemingly devoid of balance and agility.

2) The Progression Of Man City

Saturday's game against Everton was a small 90 minute snapshot of where Man City are at right now: unsure of mind, panicked in defense, caught out too easily by direct attacks; but as time wore on, dominant, increasingly confident and too much talent for their opponents.

City's defensive scheme is troubling many a fan right now: the inability to effectively defend counter attacks and passes over the top or into the channels is something that needs to be fixed, and fixed quickly. But this will take time, just like it took time to fix during the Everton game. Man City's vulnerability to Everton's attacks faded as the game wore on, maybe a deeper defensive line was employed, maybe Pellegrini figured out Everton's attacking scheme and made some tweaks?

Here's the crux: Pellegrini, brilliant reputation and all, is going to need games to figure out the PL and it's varied teams. Each team poses different questions for Pellegrini, but just as he learned on the spot during the Everton game, he will surely learn during the course of a 38 game season. The defensive scheme will be fixed given time and a greater tactical flexibility (two up front/3 in midfield) may become evident as the season rolls on. City's attacking setup looks strong, midfield balance can be worked on and once the defensive system is fully understood by the players, or, fixed by the manager, Man City should be in great shape.

Time and all.

3) Poyet and The (almost) Impossible job

On the Statsbomb podcast we talked briefly about Sunderland and the tall task they already face in securing PL survival. Now, I know it seems ridiculous to talk about a team being doomed after just 7 games but with just a solitary point to Sunderland's name it is already a big ask for the new manager to keep this team in the division.

If 38 points is the relegation line in the sand then Sunderland need to get 37 from their remaining 31 games. Without any maths Poyet's job is simple: Turn this Sunderland side, without a midfield and all, into a mid-table team. Only mid-table form (1.2 ppg) will likely be good enough to ensure Sunderland's survival.

Di canio was a mistake, Poyet is likely an improvement. But I am not convinced Poyet has enough ability to dig Sunderland out of the hole that Di Canio put this team into. The silver lining: an early lopsided schedule may mean Sunderland enjoy a run of easy games at some point in the season. then again, Sunderland are getting so many things wrong that they cannot currently be trusted to beat even the softer opponents in their fixture list.

4) Close Goal Difference

What is close goal difference? The goal difference at Minus 1, Tied & Plus 1 Game States. I use close GD as it's a pretty intuitive improvement on regular GD: remove the (relatively) meaningless blowouts and hammerings teams enjoy/suffer and we get a better picture about a teams ability.

Close_gd_corr_wk_7_medium

There doesn't look to be too much difference between normal GD and close GD (bad scaling) when looking at the charts, but the r2's at the bottom of the chart give us a better indication of which metric is better. The correlation between close GD and points will tighten by the seasons end to ~98/99. Standard GD to ~90/91 (I think).

One we remove the blowout results and settle on Close GD we can put a graph together.


Close_gd_wk_7_table_medium

Obviously these numbers can, and will, change over the course of the season but I wanted to post this info up for the simple reason that it highlights just how bad Sunderland (and Palace) have been.

When the game really matters (close Game State) Sunderland are being hammered. It doesn't matter if the game is tied, or Sunderland are leading or losing by a goal, they are being outscored heavily. Sunderland's league worst PDO doesn't help, but it's the underlying shots profile that is causing this -11 close GS number.

Once we know that Close GD is a better 'fit' with points won, we can roll back and look at close TSR which would be an improvement on standard TSR.

5) West Ham

He may as well be a West ham fan

Dfence_medium

If I had have looked into some of West Ham's defensive numbers prior to the Tottenham game I would have noticed that they were pretty darn good, and that maybe those numbers could have caused Tottenham some problems.

But then again, I would have probably just ignored them if I had have seen them; after all Tottenham, away from home, seemed like a tall task for a poor West Ham away team. West Ham weren't poor away from home vs Tottenham, they were excellent and they restricted Tottenham to great effect.

Wh_sot_rating_medium


League average SOT For% (shots on target/total shots) is ~32.5

League average SoT Prevention% (100-shots on target against/total shots against) is ~67.5

Whilst West Ham are pretty poor on the attacking side of the ball their SoT Prevention % is amazingly good at Tied and Plus 1 GS. West Ham can really restrict an opponents offensive efficiency but in restricting their opponents West Ham are struggling with efficiency when they themselves attack.

I guess there's only so much tactical currency to go around and a good balance between offensive and defensive efficiency is a pretty hard thing to achieve. West Ham restricting a tired Tottenham side may not be that surprising, but West Ham's attacking efficiency, obvious to all by their 3 goal tally, is positively shocking.

6)Goal of the Week

Come on down, Ravel!

Apologies for the video quality, blame the idiots at the PL.

7) Liverpool's Shots Numbers

Here at 10 Points we have previously discussed the Liverpool's tactics when leading in a game; Liverpool tend to shell (sit back, tighten their shape) and protect the lead that they have rather than continue the excellent work that put them into the lead in the first place.

Now, Suarez's return to the team may change Liverpool's tactical setup just a wee bit (LINK Do read this over at Grantland) and we may begin to see Liverpool out-shooting the opposition, at any game state, once again. But, for now, the jury is out:


Liv_shots_wk7_medium 
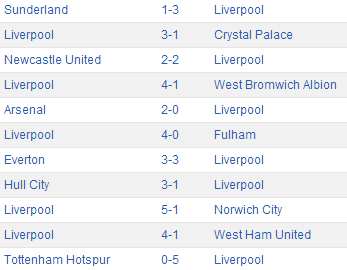
Liverpool are slightly out-shooting the opposition at Tied GS, but once in the lead (Plus 1, 2) Liverpool's shots numbers drop off and the oppositions pick up. Liverpool's +1 GS shots number is the 3rd worst in the league behind Sunderland and Hull, not exactly the type of company one wants to keep.

Nearly all teams in the PL sit back slightly when leading by a solitary goal, but Liverpool are an extreme example of this this effect I call 'shelling'. Maybe, just maybe,  Rodgers felt that Liverpool, sans Suarez, just didn't have the horses to play a controlled attacking game when the opposition would be desperately trying to find a way back into the game.

Worrying if true.

8) Shots Efficiency

Whilst we are on a roll with the graphs ( I don't much feel like opinion points or tactics this week)......

The chart below features each PL teams efficiency in terms of shots on target for % and sot prevention%. The information is pretty easy to understand:

  • If your team is in the top right quadrant they are above league average in terms of offensive and defensive efficiency.
  • If your team is in the lower left quadrant then they are pretty bad on both sides of the ball.
  • Then there's Sunderland.
Note that some of the big hitters congregated at the bottom right of the chart - super efficient in terms of offense, but lacking a little in terms of defensive efficiency.

Shots_on_target_rating__medium


9) Newcastle: For Real?

Newcastle may just be the league's most intriguing team through the first 7 games. Why? It doesn't immediately seem apparent why: 10 points from 7 games and -1 close GD are not numbers to be particularly interested in. But these numbers are:

TSR 57.9 (4th) Great.

SoTR 54.4 (9th) Good (ish)

Unblocked Shots Ratio 57.5 (4th) Great

Final Third Pass Ratio 50.5 (10th) OK

PDO 850 (18th) Terrible

SoT Rating (sot for% + sot prevention%) 93.4 (16th) Mightily Innefficient

There are some things to really like about Newcastle's 7 games so far: Total Shots Ratio, powered by a terrific Tied GS number, is mighty impressive. Shots on target ratio is good, USR is really strong. SO, by the shots info Newcastle are a strong team and may be expected to pick up quite a few points this season if these numbers hold.

But, and there's always a but, Newcastle and their excellent shot ratio numbers are being poisoned by some of the terrible stuff that is going on, namely the PDO and SOT rating.

Newcastle's PDO number will act as an anchor for even the best of shots teams. Whilst Newcastle's SoT Rating - a measure of a teams ability to get their shots on target and prevent the opposition from doing likewise - looks non too clever at the moment.

The verdict: Newcastle are doing some things really well, but unless they fix their ability to get shots on target, and stop the opposition from doing the same, then the excellent shots numbers may only allow Newcastle to climb so far up the table.

10) Cristiano Ronaldo's Shots Influence

Shots influence is a brand new little stat that the good folks at BitterandBlue created (LINK). In short this stat looks at a players contribution, in percentage form, to his teams performance in a given game or over the course of a season.

So far, I have only looked at a few players but Ozil and Giroud show well, as does David Silva. There's showing well (around 40% contribution) and then there is Cristiano Ronaldo: Black=home , Grey=away.

Ronaldo_week_8_medium

No surprises that Ronaldo's lowest contributions as a percentage were against, arguably, the two hardest opponents in Bilbao and Atletico. That previous sentence is the only remotely negative thing I can say about Ronaldo's attacking contribution; everything else is gold.

Just think about it: A team, and a bloody good one at that, has a player who is so good, and so influential, that he is responsible for just short of 50% of that clubs attacking output. FIFTY PERCENT. Ronaldo ladies and gentlemen.


Barcelona's Attacking Scheme


Unless you happen to be one of those strange, macabre souls who actually enjoys International football then this is a quiet time. Very quiet. During these International weeks I do almost anything but watch football; I will read a book (gasp!) or play the guitar, hell, I may even do some DIY. Or, I will goof around with some football numbers if only to fill the gap where watchable football once resided.

During this dullest of football weeks I decided to add a few of Europe's big teams to my intricate Game State database. Bayern Munich, Dortmund, PSG, Real Madrid, Juventus, Napoli and Barcelona were the seven teams I thought to be of interest. This Game State database I speak of looks at things TSr, SoTR, Fenwick and PDO but the one thing I had forgotten that was included in this database was an automatic breakdown of each teams shots type (Missed/blocked/on target) for & against.

Now, I understand it is very early in the season to be drawing conclusions about any given teams' strategy but Barcelona's shots outcomes profile so differently to any other teams (Europe's big 7) that I had to write a short fluff piece about it. Barcelona are weird, they are also incredibly unique.

Barcelona Shots For Outcomes

I have used a traffic light system here: Green=good (Shots On target) Red=Bad (Missed Shots) Blocked=Yellow (Meh)

So_for_barca_wk_4_medium

As previously stated, it is very early in the season but this strange looking graph is a pretty curious thing. Barcelona's ability to get the shots they take on target is pretty ridiculous. Looking at Barca at Tied we can see that they get a staggering ~72% of their total shots number on target and at +1 that number is over 50%. These numbers will probably regress some over the coming weeks.  but we do know that Barcelona have a pretty unique attacking scheme which focuses on taking shots from prime locations.

Barcelona do this by exhibiting a tremendous amount of patience, but it goes further than this. Patience with the ball, extremely good shots discipline and constant movement from the forward players certainly help. But really it's about the attacking scheme: width from fullbacks, creating odd-man overlaps and the wide receiver style routes of most of the attacking players.

To add to all the brilliant little things that Barcelona did well, it seems that under the new management of Martino, an even more visible mixed strategy is in place. Martino's scheme still has that mesmerizing short passing, but also has the through ball down the middle for the wide players who move in centrally which, by my eye, may only be possible due to Barcelona playing a longer pitch (distance from the center backs to the highest forward player) and thus stretching the opposition out. This creates space between the opposition lines and draws the opposition out further away from their own goal.

Let's use the Valencia v Barcelona to explain this stretched pitch tactic and highlight why Barcelona may be getting so many of their shots on target so far this season.

Video

Pitch Stretch

An example of the pitch stretch with the two wide players (Pedro & Neymar) staying high up as an outlet for the more direct ball over the top and thus forcing Valencia's defenders to stay deep.

Pitch_1_medium

The next shot again shows Pedro and Neymar staying high and wide.

Pitch_2_medium

Remember how Pedro and Neymar's high and wide positions stretch the pitch and provide a passing outlet? This is what happens when one of Barcelona's attacking mids gets the ball in a good passing location.....

Pict_3_post_route_medium

Fabregas is going to slot that ball through the middle as both wide players curl in and run a football-type post route.

Pitch_4_post_rout_pass_medium

Boom, through ball to the curling wide players who stay high to stretch the pitch vertically  and stay wide to stretch the pitch horizontally.


Pitch_5_medium

Virtually identical to the previous screen shot, Neymar again curls in from the left and the passer has time to thread the ball through. Again, look at the gap between Valencia's midfield to defence and defence to 18 yard line. This is an option Barcelona just did not have last season when Messi dropped deep and Iniesta tucked in.


Pitch_6_medium

Again, the pitch is stretched and this time Messi is the outlet. Yet again a simple vertical ball exploiting the space between defensive line and 18 yard line.

These last 4 screen shots point to a couple of things:

  • Valencia's defensive scheme was a mess.
  • Barcelona are definitely using the direct through ball as an attacking option.
  • The width and high pitch option offered by Pedro, Naymr and Messi is going to cause some teams problems, especially if Barcelona remain this stretched out thus stretching the opposition out.

Attacking Variety

Returning to the graph that pointed out Barcelona's excellent SoT% numbers I want to quickly show a couple of images of the mixed strategy that generates such high shots on target percentage numbers.

Passing With Width From The Left

Alba joins the passing blitz on the edge of the oppostions box.

Pitch_7_medium

Passing Through The Centre

Here we see Barcelona's big guns trying to work the ball through the middle. In shot: Neymar, Messi, Iniesta, Fabregas and Pedro.

Pitch_8_medium

Passing With Width From The Right

Dani Alves provide the wide right option, Iniesta provides the inside right option. All the players inside the box are providing movement for a pass. This drags the defenders into the box which opens up space for Messi to move and shoot or pass to Fabregas for a shot.

Pitch_9_medium

In short, Barcelona use a multitude of weapons in an attempt to generate scoring chances. They use fullback width on both sides to create passing lanes and shooting options. Barcelona try and work the ball through the middle with utilizing their incredible close range passers and the skill of the individual. And going back earlier in the piece, they use width and players positioned high up the pitch to stretch the field and provide an out ball option which tries to create a shooting opportunity or to get a Barcelona player isolated with an opposition defender which will be, on most occasions, a complete mismatch.

Barcelona already employed a pretty varied attacking scheme but the addition of Neymar, who gives the team a left-right balance, and Martino appear to have given Barcelona even more weapons in which to hurt the opposition.

This scheme needs testing against more robust opponents than Valencia and the real tests will come against European opposition. But it's a bright start from Martino thus far. Tactical tweaks needed to be made and Barcelona may have found a coach (Martino) and a player (Neymar) who can offer even more variety to what was an attacking scheme that felt like it was slowly being figured out by quality opposition.