A beginner’s guide to analyzing teams using stats

The next in our continuing series where Kirsten asks me all (or at least one or two of) the questions you could ever want answered about using stats. This time we’re talking about analyzing teams.

KS: So, even after all this education, I’m not quite clear on which stats apply to individuals, and which to teams. Is expected goals the number one valuation used for both players and teams?

MG: There are a bunch of stats that might be applied to players and teams. Pretty much everything you can count a player doing you can then total up and look at as a team number. So numbers, of course, are more useful than others. And for starting a conversation about team analysis, xG is definitely the way to go. As a metric xG is actually probably more useful at the team level than the player level.

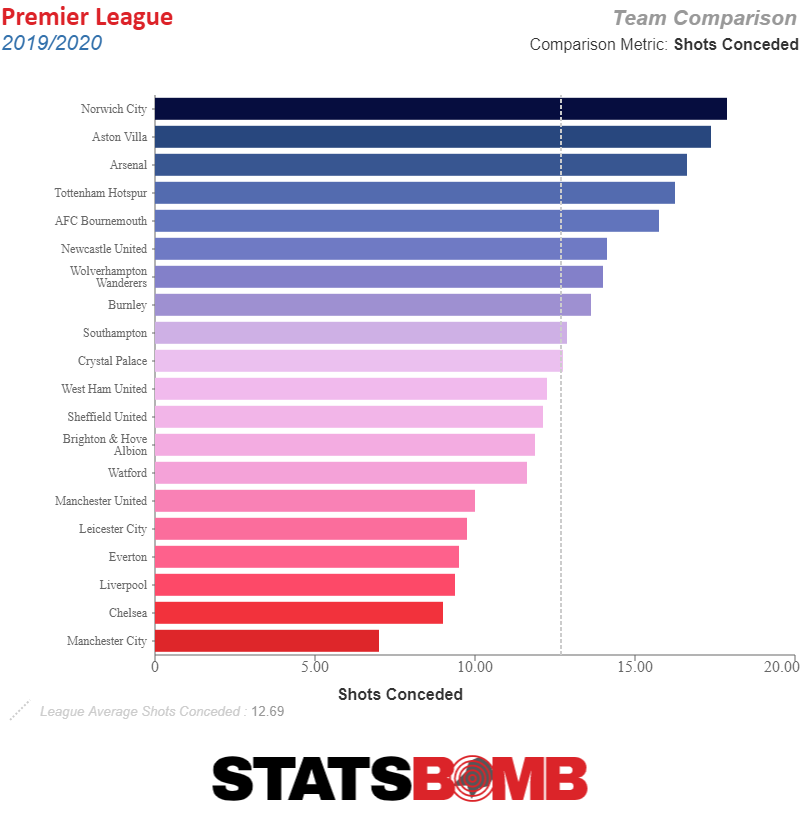
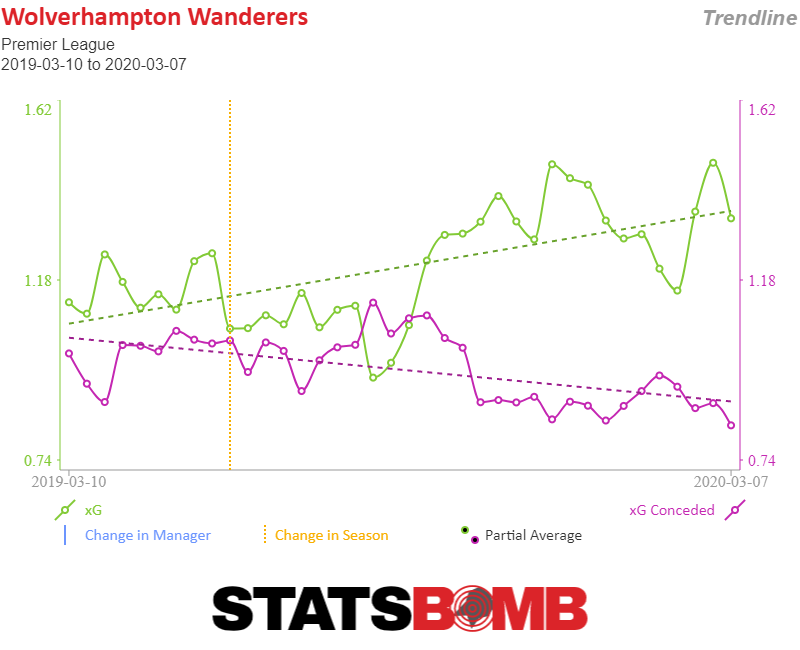
KS: In order for me not to panic about not knowing this teams v individuals numbers, Mike sent me a piece entitled (in hindsight, ironically), “Who’s gonna fix Wolves?” It’s actually a great place to start thinking about team numbers, given that when the FA hit the pause button on the season, Wolves were in sixth—but when the article was written, they were second from bottom and had yet to record a win. Mike asks if it’s time for Wolves to panic, but unequivocally states that it’s not. Turns out he was right, so it’s appropriate to ask what numbers he used to predict the future . . . and possibly to ask what other factors influenced what he saw in the numbers. Obviously the first number he looks at is xG, but for a defensive team like Wolves, it might be more appropriate to ask about what they’ve conceded. What’s the stat for that, Mike?

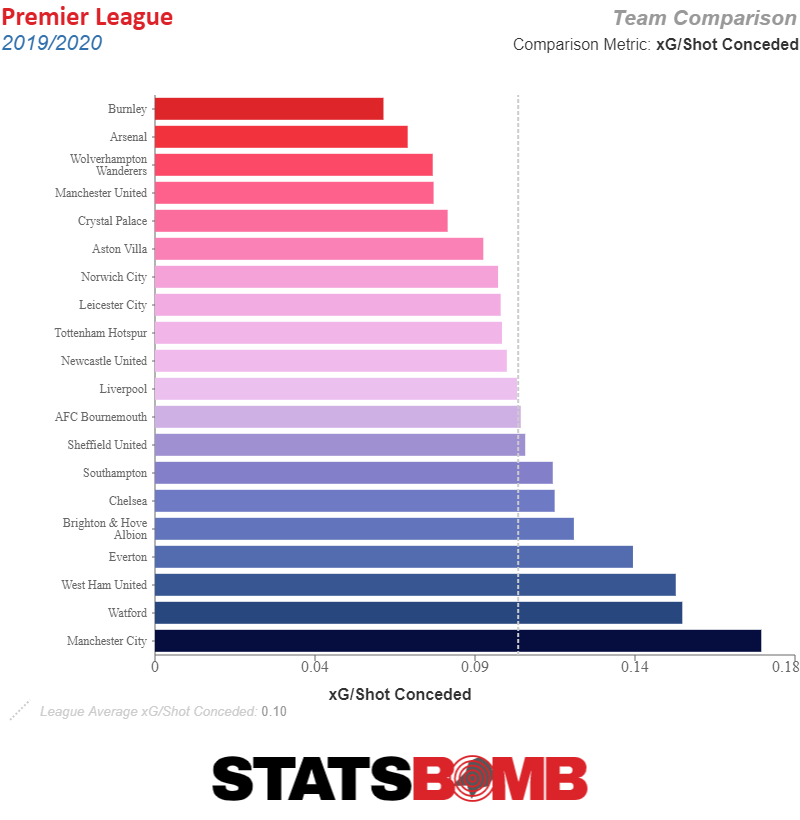
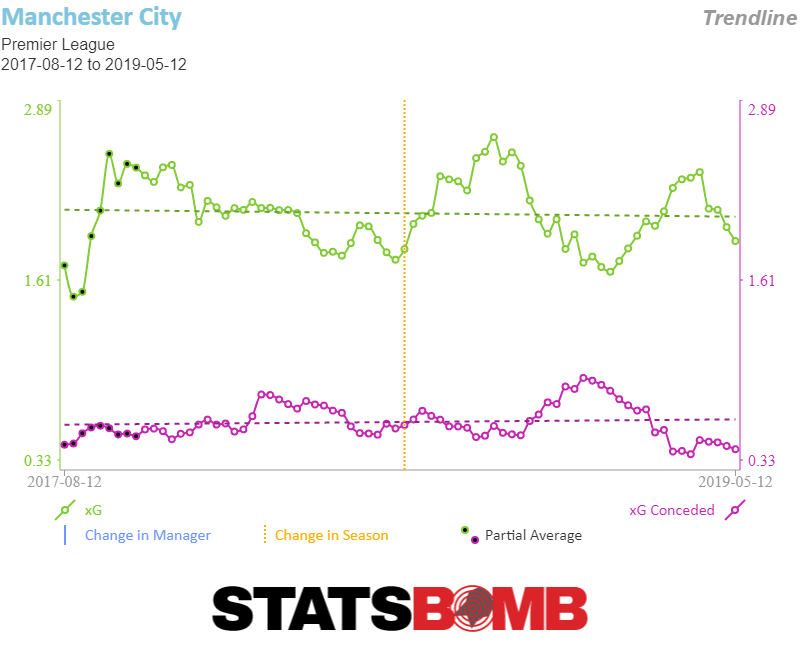
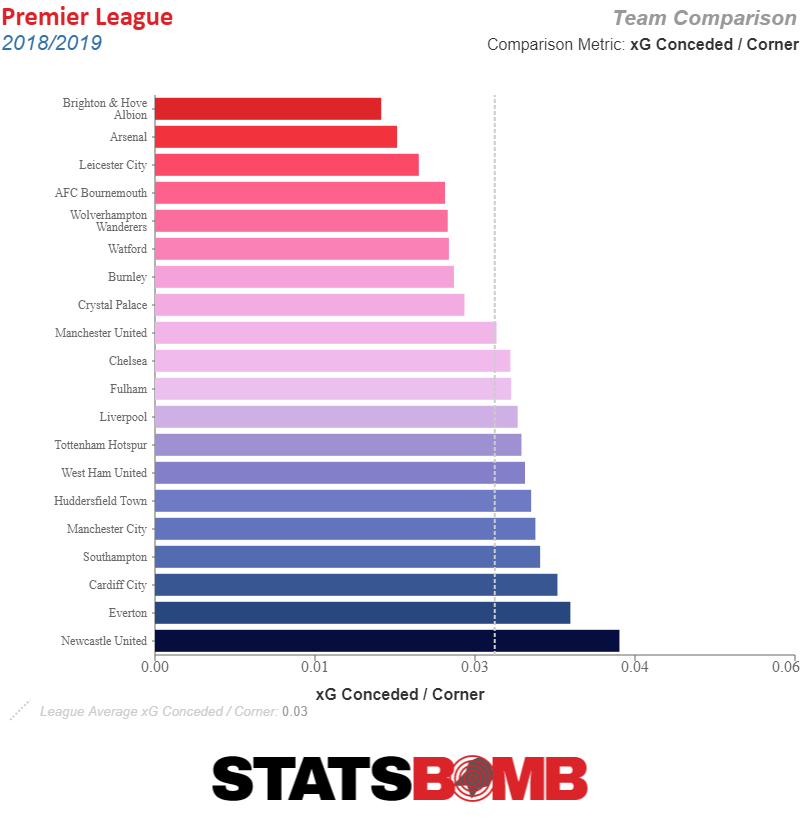
MG: The stat for that is xG conceded, it’s just like xG except on the other side of the ball. Look at all the shots a team has conceded, total up the expected amount of goals those shots might lead to, and then look at the actual amount of goals they’ve given up. The great thing about xG as a metric at the team level is that it operates just like goals does. You look at a team’s xG and the xG they’ve conceded and then the difference between the two, so just like you’d look at a team’s goal difference you can also look at their xG difference. And the basic rule is that we should all expect teams to have their goals and xG converse to the same values. Or, to say it slightly more nerdily, xG and xG conceded predict future goals scored and conceded better than current goals scored and goals conceded does. In Wolves’ case the side had conceded a bunch more goals, 11, than the xG of the shots they’d conceded, 6.49, predicted, so it was easy to predict that their defense would improve going forward.

KS: And you were right! However, when you go on to explain the bad news, you state that Wolves’ xG isn’t nearly what it was last season—enough to land them just outside the top of the table. Instead, they’re in the European places. Does this indicate that looking at just xG and xG conceded isn’t enough?

MG: Well, I think there are three components to that answer. First is that position in the table is always going to be contingent on not only how well one team plays, but how well everybody else plays. So, part of what was going on in this once and maybe future season is Arsenal struggling, Spurs collapsing, and just in general a season where the league’s big six are being underwhelming. So, even if xG is fully capturing the contours of Wolves performance, the side’s performance in relation to everybody else can certainly change.

Second, we need to separate out two different ideas surrounding xG. There’s the idea of how a team’s actual goals stack up against their expected goals. In that arena we can say with confidence what we expect to happen (the goals they score and concede will eventually come in line with xG), but the story of how that is likely to happen is where science meets art. The question of what exactly is causing the divergence is an interesting one and highly relevant for players and managers and fans, even if we can say that whatever it is is likely temporary.

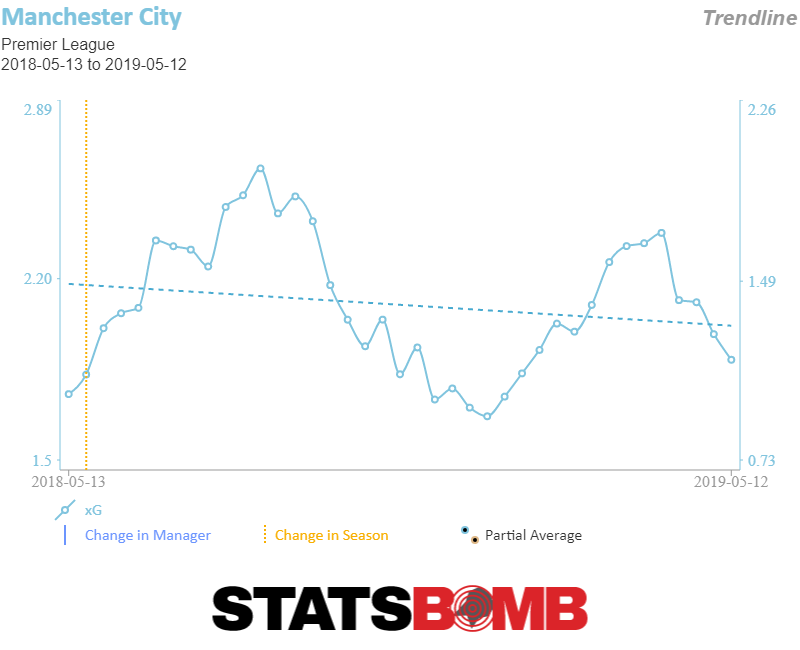
And finally, xG levels can themselves change. While xG is a pretty good proxy for how good a team is, teams get better and worse all the time. So we might observe a team’s xG improve on either side of the ball from season to season, or even within a season, and then we’d want to look for reasons why that was happening. Usually xG is pretty predictive of itself, which is to say that usually teams don’t improve a ton or get dramatically worse over the course of a season, but there are always exceptions.

So, to sum it up. Yeah.looking at xG itself isn’t enough. You need to look at a team’s metrics in relation to the rest of the league, look at how a team’s actual results are in relation to that metric and why they might differ, and then look at the movement of the metric itself and what might be causing it to change.

KS: Now, despite being barricaded inside my apartment, I don’t have time to go back and look for an article in which a team’s expected xG differed wildly from the actual number of goals scored. Here, Wolves were pretty much on track: They’d scored 6 with an xG of 5.61. However, they had conceded 11 goals from 6.49 xG conceded—and this isn’t viewed as a problem. So given that defense is simply attack in reverse (shocking!) I can look at those defense numbers and wonder, what on earth causes this difference between what is predicted and what happens in reality?

MG: Right, early this season the biggest thing that was wrong with Wolves is that the team’s goals conceded was much higher than their xG conceded. And while we’d expect that the numbers would come back in line, fixing the problem, that doesn’t tell us much about how that’s going to happen. The biggest element involved in these kinds of divergence is generally just variance in finishing. There’s really not much you can do if your opponents keep launching into the top corner against you, except rely on the numbers to reassure you it won’t keep happening.

But, there are other things that can contribute that are at least worth looking into. We can isolate keeper performance, for example. StatsBomb has a separate model, a post-shot xG model, that looks at the performance of keepers given the shots they’ve faced (this is different from normal xG models because it takes factors like the trajectory of the ball into account, which you’ll just have to trust me is the best way to go about things because working through those differences is a whole article unto itself). Using those tools we can determine if some of the divergence is down to keeper performance. Or we can separate out set pieces from open play. If the problem is that a team is conceding a lot more on set pieces than expected, it would be worthwhile to examine if there is in fact something going wrong in that phase of the game.

All of which is to say that the fact that a team is diverging from their xG or xG conceded is the start of the story, the fact that they’ll eventually come back to expectations is the end, but there are chapters and chapters to investigate in the middle about why that divergence occurs and what the likely path back is.

KS: Ok, one last question because it’s been bugging me: why are penalty goals removed from the equation? 

MG: Penalties are just not particularly predictive of anything. Just because one team got a bunch of penalties doesn’t mean they’re any more likely to get them in the future. So, including them doesn’t help us get a true picture of how good or bad a team is. It’s mostly just a function of the kind of variance that likely won’t continue. And, since the entire point of xG is to strip out the noise and look at what’s likely to continue, away go the penalties.

The beginner’s guide to reading, writing and pitching about football analytics

Do you find yourself with time on your hands these days? Suddenly staying in on a Saturday night for the good of humanity? And just to top it all off, you have to seclude yourself with no sports to watch. Separately, have you noticed an explosion of numbers in football? A sudden rash of xGs springing up all over the place? Suddenly everybody seems to be spouting off about stats and you’ve got only the vaguest notion of what they’re on about?

Well, you’re in luck. StatsBomb copy-editor and general woman about town Kirsten Schlewitz is just like you! While she’s an expert at correcting the incredibly sloppy copy you’ve all come to know and love from me, she also came in as a relative novice at this whole stat thing. So, I roped her into asking me every question she could think of that she might have otherwise been afraid to ask. So, let’s get started.

K: First of all, let’s get the elephant out of the room. What is xG?

M: xG is short for expected goals. It’s a statistic that attempts to measure how likely any given shot is to become a goal. It’s really good at predicting the future. That is, xG is better at telling you which teams will score and concede goals going forward than any other statistic we have. That’s the most basic barebones definition I can think of.

K: If you already have xG to predict who will score and who won’t, why are so many other numbers needed? I see a great deal of figures and maps when I edit pieces, and sometimes I don’t understand what their purpose is. For example, when comparing two players, you can’t rely on xG for a team. So what numbers would be used there?

M: The answer to your first question is that knowing who is more likely to score goals going forward isn’t a particularly interesting thing to know (unless all you care about is betting, which, fair enough). The interesting questions are the hows and the whys. A single number like xG doesn’t help you very much with that. I like to think of xG as being a statistic that makes sure the conversation starts in the right place, as opposed to one that tells us anything remotely close to what we need to know.

So after the conversation gets started that’s why we need all the other stuff, to examine how teams play, what individual players are doing, basically what’s going on on the pitch that leads to the xG number at the end. And when those numbers come to particular players things can get very complicated very quickly. That’s because while xG works fine for players (specifically it can tell us when a player is on a hot or cold streak that’s unlikely to continue), shots are only a relatively small part of what’s happening. And, quite frankly, the further we get away from the actual shot, the less definitive our numbers become about what’s good and what’s bad, and the more we rely on them to try and accurately describe the game, as opposed to predict outcomes.

K: So you’re saying there are more or less two sets of numbers that a StatsBomb article could use: ones to predict which team will play better going forward, and ones that tell us what happened in a previous game (games?) in a way that dives deeper than simple match reports. If someone wants to write an article about, say, how they think the Champions League would have panned out this year, would they only use the prediction numbers, or would they also examine numbers that show what happened in previous matches?

Or am I way off base here and all the StatsBomb stats are used in conjunction with one another, rather than existing as two separate sets that focus on past and future?

M: So this is exactly right conceptually. The problem is that the numbers often overlap in ways which make the divide not particularly clear cut. For example, xG is an excellent stat for predicting the future, but it’s also a pretty ok one for explaining what happened. We know more about a match if we say that Arsenal had 1.5 xG than if we said Arsenal had 15 shots. Using the xG from a single game is kind of a quick and dirty way to describe what happened, albeit one with plenty of faults.

The best use of numbers though will always combine prediction and explanation. If I wanted to look at upcoming, now cancelled, Champions League matches, I would use general xG numbers as a starting place and say, “Here’s what I think will happen based on these numbers” and then use everything else to say, “And here’s why.” Now that also doesn’t mean xG is perfect. Doing good work in stats means trying to understand the limitations of the numbers as well so that we can understand when they might be missing something. So, in theory, it might be possible to analyze all the whys and hows and decide beforehand that even though a team like Liverpool might seem much better based on xG, they would struggle against Atléti (that’s not a conclusion I would have come to, but it’s not like completely beyond the pale to suggest).

K: We keep talking about “the rest of these numbers.” For someone who’s completely intimidated by stats, to the point they’re afraid to even click on a StatsBomb link, much less pitch you an idea, what other types of numbers would you anticipate they’d need to understand?

M: From a writing perspective, understanding the numbers is somewhat less important than understanding the game. If a writer is making accurate assertions about the game then those claims are going to be reflected in the numbers and in the editing process we can work together so that your friendly neighborhood StatsBomb editor (me) can help give you the appropriate statistical support you need.

So, if a writer wanted to write about how a team relied on a midfielder for a lot of their buildup play, they wouldn’t need to know the ins and outs of StatsBombs numbers. But I’d be able to call upon stats of ours like “deep progressions” to look at how frequently they move the ball up the field, or at passing percentages when they’re pressured and not pressured to explain how they’re cool in the face of a defense, or information and graphics on pass length, etc. etc. etc.

Now, if the numbers don’t match a writer’s argument that makes for an interesting challenge. The question of why a writer perceives the game a certain way while the numbers don’t capture it is generally a really exciting place to do analysis. Figuring out why there’s a disconnect between what the numbers capture and what the eye might see is usually an interesting endeavor for everybody involved.

K: I’m here editing and writing articles, and I fully admit I don’t comprehend exactly what half of these numbers mean. But if I wanted to submit an article that showed I do understand a few of the statistics, which do you think would be most important to understand?

M: You do need to understand the basic mechanics of xG and why it works so well. It’s important to understand that a player having more goals than xG expects he “should” is likely to start scoring less. Beyond that I’m looking less for knowledge of a specific stat than for a way of thinking about questions. Questions like, “Do you have a statistic that measures XYZ” are good, questions like, “How do you go about measuring ABC” are even better.

K: From xG and its variations (non-penalty xG, open play xG etc), it’s relatively easy to assess the offensive strength, or lack thereof, of a side, even if you’re new to stats — and I can attest to this, believing I had no ability to comprehend sports statistics before I took this job. But what still tends to confuse me is the defensive measurements . . . I see the maps and figures, but even those don’t help me quite get it.

M: Yeah. Defense is hard. We can look at xG conceded, or shots conceded, or any number of other things, but those are still fundamentally measurements about what the other team’s attack is doing. And that makes sense, because on some level all defense is is preventing the other side from attacking. But it’s also unsatisfying because defenders are obviously doing SOMETHING and it would be nice to describe what those things are.

The traditional measures are things like tackles, interceptions and blocks, and while those are useful numbers, they have some major problems. The biggest is that you can’t commit those defensive actions while you have the ball, so players on bad teams tend to have more defensive actions than players on good ones that keep the ball all the time. One thing we do is adjust all of those numbers for possession, to try and give a better picture of what’s going on.

On top of that we track pressures. That is, we track every time a defender is close to an attacker with the ball and impacting him in some way. This gives us a lot of information — adding pressures into the mix demonstrates where on the field a team is making defensive actions.That gives us the ability to look at a heatmap of a team’s activity and really get a picture of where on the pitch they like to defend (the redder the square the further above average the number of defensive actions are in the zone, the bluer the square, the further below). Manchester City defend basically in their opponents penalty area, for example.


All of that’s a long winded way of saying that it’s really really hard to evaluate defenses!

K: So we know how offense is evaluated, and we know how defense is judged — somewhat, anyway. With these two necessary halves of the game described, I have one final question: What would you like to see a writer be able to demonstrate with the numbers, keeping in mind that the StatsBomb blog is there to both educate readers and show potential purchasers what they can do with the data?

M: The major thing I want to see isn’t a specific proficiency with data, but rather a framework for thinking about issues. Think about a question you want to answer, and how can you use data to answer that question. That’s what we’re all trying to do, whether it’s determining if a potential signing will be worth it, or why a player is having a career year, or if a keeper’s yips will pass, everybody is fundamentally doing the same thing. Whether it’s analysts with teams, or fans in the stands, or writers for StatsBomb, they’re looking at the game, developing a question and then trying to answer it.

StatsBomb Conference Videos: Valuing Player Influence and Evaluating Defensive Risk in Expected Threat Models

The videos, they just keep coming.

First up today we have Ryan Beal (@RyanBeal95) with his talk, “Valuing Player Influence Within Teams”.


Next up it’s Robert Hickman (@robert_squared) presenting his paper, “Considering Defensive Risk in Expected Threat Models”.


StatsBomb Conference Videos: Estafania Vidal and Thom Lawrence

Happy Friday! We’ve got two more conference videos for your viewing pleasure.

First up, our very own Thom Lawrence (@lemonwatcher) would like you to know, Some Things Aren’t Shots: Comparative Approaches to Valuing Football.

And next, we’ve got Estafania Vidal (@tefavidal) and her talk, Understanding Entry Zones in Football.


Aston Villa have given midfielder Marvelous Nakamba a thankless job, and he’s doing it admirably

Aston Villa have made a surprisingly strong start to the season. It’s not so much their position in the league table, they’re 15th, but only one point above the relegation zone. Rather, the eye opening number is the fact that eight games into a season where the newly promoted team was expected to struggle, they’ve actually scored one more goal than they’ve conceded. Sadly for Villa, the xG numbers don’t exactly back up their goal scoring record.


Specifically on the defensive side of the ball Villa have struggled with a case of the Arsenals. They give up a lot of shots:

And while the quality of those shots are generally low, they aren’t on average low enough to make up for the extremely high volume.

Nowhere is it as clear just how overwhelmed this Villa defense is than in the numbers of Marvelous Nakamba. The poor guy really is doing the most defensive work he can.


Nowhere will you find a clearer statistical example of a midfielder shielding his defenders than what he does. He just sits in the middle of the field and breaks up play after play after play in front of his own penalty area.


The problem for Villa is that it sure seems like their defensive midfielder is their first line of defense. The side simply offers zero opposition until the ball is sitting in Nakamba’s lap.


Villa’s surprisingly lively attack has received a lot of praise, especially after hanging five goals on Norwich last weekend. And it should. It’s no small thing for a newly promoted team to be a Premier League average attack after eight matches. But it’s coming at a cost. And the brunt of that cost is being born by Nakamba.

That’s not to say, that Villa’s defensive midfielder is perfect, or maybe even above average. His numbers in possession are truly terrible. He does very little to move the ball up the field, and despite his relatively unambitious passing, his pass completion percentage is only 84.5%.


Nakamba is as pure a defensive midfielder as you’ll find in the Premier League. His job is to shield the back line and win the ball. On Aston Villa, that’s a near impossible task. Villa is a classic case of a team that’s putting its defensive personnel in a position to fail. Nakamba is performing admirably despite that. If Villa continue to play this way, and manage to remain in the Premier League it’s going to look ugly defensively all year long. If it works, it’ll just barely work, but if it weren’t for Nakamba it would probably have no shot of working at all.

Can any of these Champions League underdogs shock the big boys?

As we role into Champions League match day two, the biggest teams from across Europe will inevitably get the attention. But, as the group stage progresses, a number of smaller teams will look to stake their claim to be this year’s Cinderella story. Here’s a quick look at some of the less heralded teams in this year’s Champions League and what they do, or don’t do well.

Slavia Praha

Things could not have gone better on match day one for the team from Prague. Not only did they travel to Italy and come back with a point from Inter Milan but Barcelona and Borussia Dortmund also drew, leaving the group wide open. Getting stuck in such a difficult group meant that their odds of even making the Europa League were always going to be long, but every Cinderella Story starts with a single invitation to the ball.

If their match against Inter taught us anything, it’s that this team plans to remain true to itself, no matter how challenging that may be. Manager Jindřich Trpišovský has his team press the opposition early, often, and unrelentingly. Through nine games of their domestic season, this is what their defensive heat map looks like.

In attack, their approach is generally to shoot early, shoot often, and then use the defense to get the ball and do it again. With such an active defense, shot quality comes second to simply burying opponents under an unending deluge of attempts on goal, even if many of those individual attempts are somewhere between speculative and downright deluded.


Of course, executing that approach when you have the most talent in your domestic league is a lot easier than it is when you go up against some of the biggest teams in Europe, but as we can see from their first match against Inter, they’re sure going to try.

Advancing from this group remains an extremely unlikely proposition, but if it were to ever happen, this would be the way. First the draw against Inter, and now they get to host Borussia Dortmund at a time when the team seems to be ever so slightly off the top of their game. The German side is coming off back to back disappointing 2-2 draws against Eintracht Frankfurt and Werder Bremen dropping them to eight in the Bundesliga. Slavia Praha probably won’t shock the world, but if they are going to, it helps to catch their group stage opponents at their lowest moments.

Crvena Zvezda

It seems silly to suggest that a team that has started their season with eight wins and a loss is struggling, but sometimes it fits the bill. Sure Red Star sit tied for points at the top of the table and even have a game in hand on Bačka Topola the unlikely co-owners of the league’s best record, and yes the side sits one point ahead of bitter crosstown rival Partizan, but the stats suggest, that at least early in the season all was not quite right with this perennial powerhouse.

It’s hard for Europe’s smaller teams to compete on the biggest stage if they aren’t absolutely dominant at home, and Red Star simply haven’t been. On both sides of the ball it’s been Partizan that is the stand out performer (the following stats don’t include the last two match days, which is important to note were both comfortable 3-1 wins for Red Star). On both sides of the ball Partizan have the stronger xG numbers and thus a significantly higher xG differential so far this season.

This difference clearly showed itself when the two sides squared off earlier this season. It’s one of the most hotly contested rivalries in the world, and while Partizan left it until late to score their two goals, they were clearly the better team over the course of 90 minutes.

Even though their domestic form suggests Red Star might not have enough fire power to threaten any of the favorites in their group, Tottenham Hotspur’s opening week draw away to Olympiakos has left the door ever so slightly ajar. A good result this week at home against the Greek side combined with a Spurs loss to Bayern would actually vault the Serbian team into second place in the group and at least give them a fighting chance in the weeks to come.

Galatasaray

The Turkish giants have been a mainstay of the Champions League for years. They haven’t exactly threatened to do anything historic in the knockout stages, but they’ve always been a hard out for Europe’s biggest clubs, a side good for an upset or two under the right circumstances. This year, with groupmate Real Madrid getting trounced in the opener getting trounced in the opener by PSG’s backups, it at least seems to open the door for Galatasaray to pull off a shocking upset.

This year’s version of the Turkish side is going to have a real hard time driving through that door. Despite being filled with players you know and are at least mildly fond of, the team simply hasn’t been very good this season. Despite the likes of  Jean Michaël Seri, Sofiane Feghouli, Younès Belhanda, Steven Nzonzi and Radamel Falcao leaving viewers in a constant state of “oh yeah I remember that guy” the team hasn’t gelled together at all.

Right now, Galatasaray sit in just seventh place domestically. Despite all those names, they simply struggle to score the ball.

They neither create a lot of shots, 12.87 is the ninth most in the league, nor create particularly good shots, only six teams have a worse average xG per shot than their 0.07.

And the sad reality for fans of Turkish football is that if you’re not good enough to dominate at home, you’re probably not good enough to shock the world and outlast Real Madrid or PSG, even in a year when Madrid are struggling. Not all underdogs are created equal, and this year, Galatasaray have simply shown no signs of being able to do the things that they’d need to in order to upend the expected Champions League order.

Mason Mount, Player Profile

Mason Mount started in the attacking midfield role for Chelsea in their opening Premier League match, away to Manchester United. That’s quite the vote of confidence for a 20 year-old with no Premier League experience under his belt. So, what kind of player exactly is Mason Mount?

Last year, on loan to Derby, under then Derby now Chelsea, manager Frank Lampard, Mount split his time between attacking midfield, where he spent just over 1000 minutes, and the left side of center midfield where he spent 1773 minutes. This makes a quick look at his outputs tricky. On the whole he definitely doesn’t pop on the midfield radar.


He also doesn’t appear as much above average on the attacking midfielder, though it’s a little more encouraging.


Despite those radars, there are reasons to think that Mount might have a strong future. His nine goals from midfield are encouraging, and fairly reflect his underlying expected goals. While there are a lot of speculative attempts on his shot chart, there are also a good number of efforts with his feet from front and central.


Defensively, his pressure map is also fairly impressive. The fact that he only has an average number of pressures on the midfield radar is actually encouraging given that he spent a third of his time at attacking midfield. And the pressure map picks up the range of his defensive activity.


As his career progresses if Mount can either consistently put up the rangy defensive numbers from the attacking midfield spot, or replicate his ability to get into the box if he’s consistently deployed deeper, then there really will be a solid framework to build on.

There is, however, reason to be concerned about his passing ability. He demonstrated neither a particular facility for generating shots for his teammates, nor stood out for moving the ball up the field. His xG assisted for Derby last season was 0.13 per match, fourth on the team. That’s not bad, but it’s not the kind of number that you see in the Championship that makes you think super star in the making. The story of his deep progressions is similar, he was sixth on the team (for players that played more than 1000 minutes). There are all sorts of tactical reasons that this might be the case, but it remains that he has yet to demonstrate at even a Championship level that he is a particularly creative passer. Now he’s being handed the reins at Chelsea. It should be no surprise then that on Sunday he completed exactly one open play pass to striker Tammy Abraham (completed passes are red).


There are definitely things to like about Mount’s game. There are areas where he can legitimately grow and become the kind of star player that every supporter hopes their homegrown talent can blossom into. But, for him to truly become an influential player at the top of the table he’ll have to show some passing ability that he hasn’t yet. If he can add that into the mix then he really might turn into something special.

Manchester City: 2019-20 Season Preview

What’s left to say about Manchester City? They’re two-time champions, coming off the best two seasons in Premier League history. They’re prohibitive favorites to once again win the title. They’ve established, through both performance and economic might, a baseline of excellence that only they can hope to meet. The only question is, will they?

It goes without saying that City are excellent. But let’s say it anyway. StatsBomb has City’s expected goal difference from last season as 1.51. No other team was over 1.00. Liverpool was at 0.99. The only other team even half an expected goal to the good was Chelsea at 0.53. Liverpool managed to run them to the wire in the league, but it took everything going perfect for them to do so. City just kind of had an average season for City. This is two years worth of xG trend, it just doesn’t get any better than this.


The question then, for the second year running, isn’t, will City win, it’s what has to happen for City not to win the title? It’s not enough simply for another team like Liverpool or Tottenham to catch fire, that happened last season, and City withstood it. Instead, another team has to catch fire, and something has to go wrong, perhaps badly wrong, for Pep Guardiola’s team. What might that be?

Let’s start in attack. Manchester City has no plan B. They don’t need one because their plan A is pretty much unstoppable. They pass the ball around forever, the team’s two free eights join the front three pressing five attackers against the back line, interchanging and probing for attacking chances, eventually the defense breaks down, City plays a ball across the face and somebody gets a tap-in. It seems ridiculous to say that a team that shot the ball 17.89 times per game last season, the highest mark in the league, is patient, but City are. They also had the highest expected goal per shot total in the league at 0.12. They took the most shots and the best shots.

One way this patience showed is that when the team struggled, it manifested itself in decreased shot totals. Sometimes when committed defensive sides manage to hold a great team down, its by forcing the favorites to take an enormous number of long distance shots, and then avoiding getting unlucky. City steadfastly refuse to do that. They keep looking for that perfect pass even if it means their shot totals dip. That’s what happened during their brief dip from December to March. They kept hunting great shots, they just stopped finding them.


Part of the reason they’re so good at finding great shots is Guardiola’s ability to customize his attack. Raheem Sterling was deployed equally on the left side and the right side, splitting his time between the two flanks depending on the manager’s plans. He had an attacking season on par with anybody in the Premier League, but not one that involved a high volume of shots.


Bernardo Silva also provided that flexibility. He spent two thirds of his minutes in the right attacking midfield role and one third on the right wing. Over the last season he developed from a player who provided Guardiola with flexible depth off the bench to one who was almost always on the team sheet, even if where he was deployed would change. Silva started 31 games and appeared in five more as a substitute.

Those two players meant that Guardiola could deploy his other great players, who might have been slightly more limited positionally, only when he saw fit. Riyad Mahrez was deployed on the right wing only when it suited Guardiola, for slightly less than 1500 minutes. Through injury and rotation Kevin De Bruyne, exclusively an eight, played barely over 1000. Leroy Sané the team’s dedicated left winger played just under 2000 minutes.

And this is where we come to the first potential problem. Sané will miss most, if not all, of the season following an injury to his anterior cruciate ligament. It might seem at first glance that on a team of attacking superstars (we haven’t even mentions Sergio Aguero and David Silva yet) his 2000 minutes would be easily replaced. And they might be, though we shouldn’t discount his tremendous level of performance last season.


But, without him, Guardiola may end up needing to simply stick Sterling on the left wing and that removes the manager’s flexibility. Not only does it take Sané out of his toolbox it also means that he can no longer play the Sterling, Bernardo Silva combination on the right when he deems that his best option. It has knock-on effects to left back, where Oleg Zinchenko, a player more comfortable, and better suited to, pinching narrow was beginning to establish himself. He’s a better fit with a winger who likes to stay wide than one like Sterling on the left who wants to move inside. These are small issues to be sure, but the process of finding chinks in City’s armor is one of looking for small problems, and wondering what might happen if they become larger. Maybe these potential small tactical hurdles are a place to start.

Then there’s further back the field. City’s fire breathing run the last two seasons has been powered by Fernandinho at the base of midfield. He does it all. Not only is he the first defender tasked with breaking up counterattacks, last season more of the ball progression duties fell to him as De Bruyne played a smaller role. Not only did he distribute it from deep, as his sonar shows:


But he’d often step incredibly high up the field and play a critical role in possession, either circulating the ball side to side as the team prodded for openings, or feeding balls into the box himself (red is complete and yellow is incomplete):


For years, City’s achilles heel has appeared to be that Fernandinho’s greatness was irreplaceable and his backup Ilkay Gündoğan while incredibly skilled in his own right was not enough of a defender to replace the immense contributions of the Brazilian who was closing in on his mid-30s. It never proved enough to slow City down.

Now, there’s a succession plan in place. City acquired Rodri, who seems destined to be Fernandinho’s heir. Looking at the defensive midfielders passing sonars from last season might suggest he’d be an awkward fit. Playing in Diego Simeone’s conservative Atletico Madrid side, he played the ball side to side, and backwards a lot in midfield, rarely progressing it up the field, which will be a big part of the job at City.


But, go back a season further, to his time at Villarreal and the appeal becomes much clearer. There his passing is more expansive, more forward oriented and more like what will be expected of him as he inherits the keys to City’s midfield.


Of course, just because Rodri makes sense on sonar doesn’t mean he will be able to handle the job in real life. It’s both a massive set of responsibilities and a herculean task. He’ll likely be eased into the role with Fernandinho still playing midfield minutes, but the result of it all is that while in past years the risk for City was that they had no capable replacement for an old defensive midfielder, now the risk is that the transition which they have planned won’t come off. City recognized where they were exposed and moved to address the issue with their chosen transfer target, but not all transfers work. Not having a plan in place for covering Fernandinho was an avoidable risk, they’ve now avoided it, and are left with only the unavoidable, smaller possibility that Rodri doesn’t make the cut.

Then there’s the defense. Vincent Kompany is gone and no center back has come to take his place. Instead Danilo, who provided fullback depth has been swapped for João Cancelo a gifted attacking fullback from Juventus. This suggests that the Fernandinho plan also involves him stepping into the back line some, as he did towards the end of last season. Guardiola often plays a system in which no matter whether he starts with a back three or four, when the team has the ball three players are left doing defending work, one of whom has license to step into midfield. Usually that role was played by Kyle Walker from right back, but Fernandinho was occasionally deployed in the middle to do it, and Aymeric Laporte also sometimes had the job when he started at left back.

The reality is that City do the vast majority of their defending well away from their own goal. The responsibility of the 2.5 left minding the back line is to snuff out any hopeful long balls that come pinging their way, to deny the escape valve from this suffocation.


It’s not an easy job, but it’s not a typical defensive one either. The challenge for Guardiola is finding players who can do it, while also being able to do the traditional jobs of defending set pieces and physically controlling the penalty box when called upon to do so. It’s exceedingly difficult to find something that City don’t excel at but dig deep enough, and you see that they’re actually fairly average when it comes to xG per corner conceded (although the margins between everybody are fairly small)


It’s a completely worthwhile tradeoff to make, of course, being slightly average when you give up a corner kick in order to have defenders who can contribute to entirely pinning opposition in their own half. But it is a tradeoff. And it’s one the team looks likely to lean even further into this season.

The distribution of minutes across City’s back line remains a question mark. Laporte always plays (and seems to already be on his way back to the lineup after an injury scare), but the only two other true center backs on the roster are his most likely partner John Stones, and then Nikolas Otamendi who isn’t exactly a rock. The rest of the minutes are anybody’s guess. Maybe Fernandinho just migrates there permanently, or Walker moves inside with Cancelo starting to his right. Maybe we start to see some truly wild alignments, back threes that have both Walker and Fernandinho in them as Guardiola attempts to keep pushing the tactical envelope. Will it work? Probably. Is there a chance it goes haywire? There’s at least a small one.

This entire exercise though has just been a testament to how hard it is to come up with a narrative where City don’t win the title. There are of course the usual ravages of fate. A devastating string of injuries could befall them, or the fates could decide that Sergio Aguero will fall down every time he kicks a ball for the rest of his life. But, within the normal bounds of luck what we’re looking at is trying to find the tiniest of fissures and extrapolating outward into how they might become actual problems. Maybe Sané’s injury handcuffs Guardiola enough tactically to start the ball rolling, maybe the slightly imperfect attacking alignment in front of him causes Rodri to have a harder time adjusting to the more physical Premier League, and maybe that allows opponents to get at a creatively rethought back line more potently. It’s certainly not likely, but given the last two seasons, nothing is. The rest of the league will have to take solace in the fact that it’s not impossible.

Header image courtesy of the Press Association

Tanguy NDombele marks a step forward for Tottenham Hotspur, their first superstar purchase

Tanguy NDombele is officially a member of Tottenham Hotspur. It’s a momentous moment for the North London club. The acquisition marks a change in not only the club’s approach, but their stature in European football. For the first time Spurs have successfully purchased a top line young star, one whose acquisition would not be out of place at any of the top clubs in the world.

Spurs have had superstars before of course. They developed Gareth Bale. They set (or at least tied) a club record to purchase Luka Modrić from Dinamo Zagreb. More recently they’ve developed Harry Kane, and won the transfer lottery with Dele Alli. Both Christian Eriksen and Son Heung-min are talented players bought for reasonable prices who have blossomed along with Spurs.

NDombele, however, is something different. Spurs successes, up until now, have been achieved by doing the things that a team has to do when the biggest players in the world are unavailable to them. Whether it’s developing their own talent, or successfully taking risks on players that other teams decide not to, Spurs, by shrewd management, or dumb luck managed to build a team of stars that other top clubs decided they didn’t want. Now, for the first time, they’ve acquired the kind of young midfield star that every team in the world targets.

NDombele is the kind of midfielder who can do everything. He’s equally adept at patrolling the midfield defensively and bringing the ball forward in attack. Lyon’s success hinged on NDombele doing both. NDombele led the team with 9.08 deep progressions per 90 minutes.

Continue reading “Tanguy NDombele marks a step forward for Tottenham Hotspur, their first superstar purchase”

Japan are struggling, Australia might be fine and other early World Cup statistical nuggets

As far as sample sizes go, two games is minuscule. There is nothing to be found in two games worth of data that a third can’t immediately nullify. The challenge of international soccer is that while two games don’t tell us much, a full third of the 2019 World Cup field will be back on their couches after game number three. So, let’s stretch those numbers to the breaking point and see if they can tell us anything useful.

Here are all 24 teams ranked by their expected goals scored per match.


One thing this list makes crystal clear is that with only two games played, the most determinative factor is the level of opponent faced. It’s not surprising for example that the United States tops the list, but Sweden at the second spot, that’s explained more by having the good fortune of a group with Chile and Thailand in it, than any distinguishing factor the Swedes might bring to the table.

Similarly, Canada and the Netherlands in third and fifth respectively have had Cameroon and New Zealand to hammer away at. And while each of those less heralded sides have had their moments, those matches have largely consisted of the favorite throwing punches and the underdog flirting with being able to absorb them before ultimately succumbing. The same is true of England, sitting in pretty in fourth place on this list.

Which brings us to Japan. Despite, like England, having a relatively easy opening couple of matches against Scotland and Argentina, they are nowhere to be seen at the top of this list. They’re actually below average. Only nine teams have less xG per match than Japan’s 0.60. Given who they’ve played, that’s a really bad sign.

A major part of the problem is that they can’t generate good shots. They’ve taken 12.50 shots per match. That’s a more respectable ninth in the tournament. But they just can’t create good chances.


Mana Iwabuchi scored a banger from outside the box but other than one (soft) penalty, only Hina Sugita’s clang off the post in first half stoppage time against Scotland really moved the xG needle.


If Japan had put in these attacking performances against strong sides, it wouldn’t merit concern. But they didn’t, they put them in against two of the weaker teams in the tournament, the same two teams that England did this to.


Japan’s four points will see them through to the knockouts, but they certainly seem to be limping there. Tournaments are short and all it takes is a game or two to shift things dramatically, but right now 2015’s finalists are heading into the latter stages looking much more like an easy out for a strong side to put out of their misery rather than a contender looking to make a real run at winning the thing.

Australia, on the other hand might be better than their numbers indicate, and their numbers are quite respectable. Down 2-0 to Brazil after an opening match loss to Italy, they were staring down their World Cup mortality before scoring three to complete a stunning comeback victory. Australia’s numbers this tournament are mediocre. They’re eighth in non-penalty xG which is respectable. On the defensive side of the ball, long thought to be their weakness (and where they’ve conceded five goals) they are also eighth.

But, unlike Japan, Australia haven’t had the benefit of playing the cupcakier end of the field. Italy have been the tournaments biggest surprise, following up their surprise opening match win against Australia with a dominating 5-0 performance against Jamaica, one of the tournaments weaker teams. Italy wasn’t tested in that match, but 5-0 is the kind of summary execution of subpar opponent that meets expectations for a top international team. We don’t yet know how good Italy is, but they might be a legitimate unexpected force.

Then there’s Brazil. Brazil aren’t at their best. Marta is coming off injury. Formiga is 41. Their “young” dynamic stars, Debinha and Andressa are 28 and 27. But, they’re still Brazil. They’ve still been above average both in attack and defense. With their own win over Jamaica under their belt they will likely make it to the knockout rounds. Australia’s win against them doesn’t say as much about them as it might once have, but it’s more impressive than some of the wins that the tournament favorites have put up.

And Argentina still have Jamaica left to play in the group. If they put up the same kind of giant numbers against one of the worst teams in the tournament that Italy and Brazil did, Jamaica’s negative eight goal difference is the second worst in the tournament, then their numbers will put them near the top of the pack, despite their shaky start.

The reason these comparisons are useful is that by comparing teams within groups it’s possible to grasp towards some understanding of how the numbers might be misreading their accomplishments. This stands in opposition to groups that have clear divides between the two haves and the two have nots. Group E and Group F have very little for analysts to sink their teeth into. Canada and the Netherlands are obviously better than Cameroon and New Zealand and the United States and Sweden are obviously better than Chile and Thailand.

The order of events has served to further obscure meaningful differences. The top teams have each gotten to beat up on both minnows first. That means that all four teams have already clearly punched their ticket to the knockouts. Their third group stage match, where, for the first time in the tournament, they square off against capable competition is now as much about managing minutes, squad rotation and preparation as it is about getting three points. Happenstance means that we won’t learn much about these four sides until the knockouts start and the margin for error decreases dramatically.

Finding interesting nuggets in the statistics early in a tournament is more of an art than a science. Sometimes the numbers point to something obvious, like Japan not being very good this time around. Sometimes, they point to something contingent, suggesting that given a certain set of assumptions, Italy are good, and Brazil are fine, then the conclusion that Australia is good is justified. And sometimes, like with Canada, the Netherlands, the United States and Sweden, all you an do is shrug and wait for more information.


Header image courtesy of the Press Association

Argentina, Canada and the art of playing ugly at the World Cup

Underwhelming matchups are a staple of international play. A favorite doesn’t quite dominate, an underdog hangs tough, and the result is a scrappy, disjointed affair. Sometimes the bigger team sneaks by, sometimes the smaller one holds on, but either way they can be difficult to love (unless you happen to be invested in said underdog).

Not all annoying defensive matches are created equal. Sometimes a defensive underdog plays out of their minds, other times a favorite coasts, and most of the time the balance is somewhere in the middle. On Monday, as the World Cup entered its first full week, Argentina squared off against Japan and Cameroon faced Canada. Both games were difficult, defensive affairs. In the first, however, it was Argentina’s committed defensive performance that drove the match, in the second it was the favorite Canada’s conservative focus on doing just enough to win.

Argentina did a masterful job of foiling Japan’s approach. The unheralded, underfunded, South American side committed to clogging up the midfield, and when they succeeded, Japan had no fallback plan. Japan played a traditional 4-4-2 and were simply never able to work the ball through the midfield to the strikers supported by wingers. Over and over again Argentina waited for Japan to try and move the ball through midfield and then blew up the play. Japan’s passing network is just a mess of sideways and backwards connections around the periphery. And when the ball went into the middle, Hina Sugita and Narumi Miura, if they kept it, were reliably forced to play backwards and sideways.


In large part because Japan only had two midfielders, and they never committed to having anybody else help in the center of the park, they weren’t able to use possession to force Argentina to defend deeper in their own half. Argentina, for their part, were more than willing to commit their attackers to help blow up midfield. Striker Soledad Jaimes often times was drawn into her own defensive half, leaving winger Estefanía Banini as the only attacking option when Argentina regained control. It was conservative but effective, as Argentina’s defensive pressure map shows, they managed to defend well above their own box, and were not regularly forced into the kind of defensive shell that more talented teams can tee off against.

There are ways Japan could have chosen to combat Argentina’s approach. Instead of trying to go through midfield, the team could have simply played around it. They could have attempted to punish Argentina for contesting the middle so heavily by playing over the top, or tried to push their fullbacks high up the pitch early in possession to stretch the game laterally, making it harder for the Argentinian swarm to do its thing. But they didn’t. It wasn’t until Jun Endo came on in the 73 minute that the pattern of the game changed. Japan got the ball forward more quickly more effectively in the game’s last quarter but by then it was too late.

That’s how surprising results happen. The underdog has a plan, the favorite fails to react until it’s too late and before you know it Argentina walks out of the match only conceding eight shots and 0.24 expected goals while getting five of their own for 0.11 total. Argentina didn’t attack, but their defense, with a little help from Japan’s stubbornness, kept the thing close enough to fully warrant the side’s historic first World Cup point.

That’s a far cry from what happened when Canada defeated Cameroon 1-0. In that match, Canada controlled the game from whistle to whistle, and the favorite, as opposed to the underdog, was directly responsible for the conservative nature of the match. Canada played fairly conservatively throughout the first half, took the lead right before the whistle, and then they really decided to play unambitious keepball for the final 45 minutes.

As you can see from the difference in pass maps, the fullbacks stopped getting forward at all, the midfielders dropped deeper, and Jessie Flemming dropped into midfield from her striker position to collect the ball and knit things together. In the first half it was Sophie Schmidt stepping forward from midfield to do that. Canada had the lead, so what was the point in keeping their foot even moderately grazing the gas pedal.


That’s reflected in the shots they created as well. While they took eight shots in both halves, all shots are not created equal. In the first half, seven of Canada’s eight shots were from within the penalty area. They averaged a relatively unimpressive 0.060 xG per shot (0.058 from open play). That’s not exactly cutting a side open, but it’s still well ahead of their second half numbers.

The team’s eight shots after the break averaged an anemic 0.031 xG per shot (0.019 from open play). And that includes an 87th minute 0.11 xG chance from legend Christine Sinclair which made up the bulk of the scoring that half. For most of the time Canada was content to move the ball, and make sure Cameroon had no space to counterattack into, confident that the African side could not build their own attacks from the back. Given that Cameroon managed only four shots and 0.09 xG it seems like a reasonable plan, even if it was a boring one to watch in action.

The moral of the story is that not all testy defensive matches are created equal. Some are driven by a successful underdog like Argentina stymieing a stronger attacking team that can’t figure out how to turn on overdrive and get the game out of the mud. It’s impossible to fault the underdog for doing everything in their power to claw their way to a point. Others dour matches, though, are brought to you by a favorite that’s decided to do just enough to win. Canada got their goal and then didn’t take a single risk while strangling the life out of Cameroon. The plan worked, and Canada, one of the stronger teams in the tournament, are quite good at executing it. Still, it’s hard not to wonder what the team might be with a bit more ambition. When underdogs win ugly it’s because they have to, when the favorites do, they’re making a choice.

Header image courtesy of the Press Association

Manchester City Season Review: Chasing Perfection

What is success for Manchester City? By any measure, a domestic treble, combined with the second most points in Premier League history, has to qualify. That leaves only the Champions League, where they bowed out in the quarterfinals again to chase, and a question. Going forward, is anything, up to and including a season like the one just completed, that doesn’t include European hardware, enough?

At first glance it seems unfair to group City in a category with the handful of continental teams that dominate their competitions year in and year out. Afterall, this is only their second victory in a row. It only came by a single point, and they had to win 14 matches straight at the tail end of the season to pull it off. It seems categorically wrong to assume that City’s league dominance should be guaranteed as a starting point.

But the underlying numbers are kinder to City than the table was, an extraordinary feat given that City ran up 98 freaking points. City’s expected goals per game total was 2.00, best in the league. Liverpool were second at 1.70. Their xG conceded per match was also tops in the league with 0.56, Liverpool were again second with 0.76. That means that City had an xG difference of 1.44, a full half a goal a game ahead of Liverpool’s 0.94, the second best differential in the league.

To put it another way, expected goals accurately reflects the top three teams in the table, with City first, Liverpool, second and Chelsea third but their relative expected goal differences of 1.44, 0.94 and 0.54 suggest that Liverpool were a side positioned roughly between the two. Instead they pushed City to the wire finishing with 97 points, while Chelsea finished a distant third with 72. If Liverpool had had an average season instead of a great one, City might have wrapped up the league with weeks to go, walking to the finishing line for the second season in a row. In that context, it’s fair to at least consider examining City in the same light as Juventus, PSG or Bayern Munich. Those are teams that can be pushed, or even caught, if everything goes right for a challenger, but start the season as presumed champions until a plucky underdog can convince the world otherwise.

It’s hard to overstate just how dominant City were in the league. The difference between their xG and Liverpool’s was the same as the difference between Chelsea, the third best attack, and Crystal Palace, the 13th. Defensively, their heatmap looks like this. I mean come on. Give somebody else a chance.


This Manchester City team is so scary precisely because their season was dominant without seeming in anyway to be above average for their talent. It’s true that their fire breathing attack outperformed our xG model, thanks in no small part to Raheem Sterling not missing a single chance valued at 0.40 xG or above.


But, despite that, over the course of not just this season, but last season as well, City goal difference hewed fairly close to their xG difference. Most of their overperforming came early, and down the stretch, when they needed to be perfect, they were, without very much in the way of undue help from the soccer gods.


All of this doesn’t matter all that much when looking backwards. The 2018-19 season is going to go down as one of the best title races in history, a three month long staring contest where nobody blinked. But, when looking forward it’s quite clear that City are more likely to win the league comfortable next season than they are to get run down by Liverpool, excellent though Jurgen Klopp’s team may be.

That’s before we even begin to look at what City might do to strengthen the side this summer. How exactly do you improve on a team that flirted with perfection? There are two obvious places to start. Fernandinho, as has been pointed out numerous times over the last two years is both the linchpin of this midfield, and old. If anything his production actually ticked upwards this season as he was asked to do more of the work of moving the ball up the field thanks to the uneven, injury riddled season that Kevin De Bruyne experienced. His production remains astounding, but he’s 34.


İlkay Gündoğan filled in for stretches this season, and did an admirable job, but he’s not really a defensive midfielder. Atletico Madrid’s Rodri seems to be the name their linked to now, a promising midfielder to be sure, but one who is never played in a system that will demand near the on-ball acuity that Guardiola. If Fernandhino has another season in him, which allows his backups to get minutes and experience where appropriate and get worked into the system that might work fine, but if Rodri, if he ends up being the guy, needs to step into those enormous shoes immediately, expect some growing pains.

Elsewhere, Vincent Kompany is going home to become player manager at Anderlecht, ending an era in Manchester. But, given the presence of Aymeric Laporte, John Stones, and Nicolas Otamendi, City again have room to ease in whatever younger prospect they might acquire to fill his shoes (to say nothing of Guardiola’s flirtations with deploying Fernandinho as a hybrid center back and defensive midfielder this season). The one possible weak spot that City really could upgrade is the left side of defense. Over the course of the season all of Benjamin Mendy, Fabian Delph, Danilo, Laporte and Oleksandr Zinchenko have seen minutes there. Given the team’s success, it’s the smallest of nits to pick, but the lack of one to two reliable options in that position has at times given the teams tactical hurdles to overcome.

It would be surprising to not see City address these potential weaknesses this summer. Their endlessly deep pockets mean they can go grab players who are stars elsewhere, and deploy them as rotation options for Pep Guardiola. That is, in effect, what they did with Riyad Mahrez this year, who went from being the creative engine for Leicester City, to a regular contributor, but not automatic starter for this City side. Mahrez was on the field for 1435 minutes, the 12th most on the team.

There are some possible bigger picture questions that loom on the horizon. David Silva is 33 and his ability to both be a creative maestro in the midfield and around the penalty area at the same time started to fade this season. He’s still a wizard in the box, but before too long, like Fernandinho somebody else will need to begin accepting the responsibilities he’s shouldered. Similarly, Sergio Aguero is 30, and while Gabriel Jesus is perhaps positioned to inherit the striker role eventually, despite immense numbers in a largely substitute role, he’s still relatively untested as the man at tip of the spear.

Despite those looming eventual issues, the best course of action for City seems to be to continue tinkering around the edges. Spend 70 million on an extra defensive midfielder to fold into the system here, 40 for a leftback to be first among equals. Use superstar money on players who will slot in the system, and keep the juggernaut running smoothly. The only question is will that be enough to win the Champions League, and if not does it matter.

Fairly or unfairly, teams who break the leagues they’re in get judged on the European competition. PSG are largely considered underwhelming, Bayern Munich hired Guardiola specifically to get over the Champions League hump (and then in one of the more ironic moments of European football over the last decade won the thing before he got there), Juventus have gone chasing stars, first Gonzalo Higuain, then Cristiano Ronaldo to give them the little bit of impetus to get over the top. It’s not clear that any of those teams became better chasing the Champions League, but at the same time their dominance domestically hasn’t waned.

The question going forward for Manchester City is have they transformed the big six to a big one, and if so, what comes next?

Header image courtesy of the Press Association