Author: Marek Kwiatkowski
A toolbox for football analytics

My article "Towards a new kind of analytics" published on this site several weeks ago has received a lot of attention, for which I am very grateful. Most feedback I received though was along the lines of "this is all well and good, but how do I go about doing this kind of stuff?" This follow-up is designed to answer this question in a narrow sense, by listing some of the basic computational and statistical tools that I found indispensable in "proper" analytics work. As I argue in that previous article, the lowest-hanging fruit in football analytics has been picked and basic tools aren't sufficient anymore. To put things bluntly, the vast majority of analysts active in the public sphere today need to make a qualitative methodological leap forward or lose contact with the state of the art forever.
The narrative link list below is divided in three parts: databases, programming and statistics.
*** Databases ***
You must kill every thing you love, and that includes Excel, because a well-organised data store is critical to your analytics pipeline. It ensures that you have a single cross-linked source of data that you can curate and keep up-to-date, and it minimises the time required to extract and prepare datasets for analysis. In practice, this means a relational (SQL) database. SQL is an industry standard language for extracting ("querying") data from highly optimized databases. It was designed to be relatively easy to use by people without programming background, and I would say that this goal has been achieved -- I have personally converted several non-technical people into able SQL query-writers.
To use SQL you must operate an actual database containing your data. There are two basic questions here: what database variety to use, and where to run it. Starting with the latter, it is certainly possible and an entirely reasonable initial step to maintain a database on your personal computer. However, having it in the cloud is the superior option, because you don't need to worry about setup, backups or power failures. Amazon Web Services (AWS) offer a year's worth of free database hosting, so you can start with them and after a year either pay to continue or move to another solution. As to what flavour of SQL to use, I recommend MySQL if you have no previous relational database experience, and PostgreSQL otherwise. My impression having used both is that PostgreSQL is vastly superior to MySQL in a number of aspects, but trickier to tame without experience. If you go down the MySQL route, the MySQL Workbench is the leading front-end to MySQL databases.
*** Programming ***
In an ideal world, analytics requires little actual programming: the right data emerges from the database in the right form for a machine learning algorithm to analyse it and report the results to you. The practice makes a cruel mockery of this vision, and as an analyst I spend most of my time programming rather than designing models and analysing results. The three most common programming tasks that I have to perform are: loading raw data into databases; transforming the data extracted from a database into the form required by statistical software; and validating and reporting the results of my analyses. I suspect that the experience of other analysts is broadly similar.
Thus, unless you work in a team or have a programmer accomplice, you need a decent grasp of a programming language to do football analytics well. Two languages are the overwhelming favourites of the community: Python and R. My general advice on which one to choose is this: if you know basics of one of these, stick with it and put in the effort to learn it to a good standard. If you don't know either, learn R. Personally, I believe that as a programming language, R is an abomination and it really ought to be banned; but it is also the pragmatic choice for football analytics, because of the breadth of statistical methods available, and because two truly game-changing packages due to Hadley Wickham, dplyr and ggplot2 can take care of 95% of your data manipulation and visualisation needs. RStudio, also from Wickham, is the leading environment for R development. The Advanced R book (guess the author) is in fact not that advanced in the first few chapters and is a decent guide, unless you're truly starting from zero.
If you go down the Python route, install the Anaconda distribution, which pre-packages Python 2.7/3.5 (either is fine) for data science, including the scipy, numpy, matplotlib, statsmodels and scikit-learn add-ons essential for data analysis. PyCharm is a wonderful, feature-rich Python editor. An added benefit of Python is that you can use it to structure and query your SQL database using so-called ORMs, that is a technology that integrates the database with the language so closely that database records appear as variables directly in the code and you can manipulate them without SQL (I have no doubt that R has ORMs too, but the mere thought makes me shudder). The two leading Python ORMs are Django and SQLAlchemy. I use the former, which is actually a complete framework for database-driven websites, but SQLAlchemy is a perfectly fine choice too; Soccermetrics use it, and you can find plenty of code samples in Howard's repos.
Lastly, whether you end up with R or Python, version control software (VCS) is essential. VCSes let you move easily between multiple versions of your code and thus make sure that nothing you ever write is lost and also help you understand how your code evolved over time and why. There is no better VCS than Git. If you can afford it, pay GitHub 7 money/month and they will host your code in private repositories, and you can use their excellent web interface which adds tons of genuinely useful features on top of Git itself. If you'd rather not pay, Bitbucket will host private repos for free, but the interface is atrocious. The last option is GitLab -- it is free and the interface is perfectly decent, but you have to host the code repository yourself. In all cases, you will have to learn Git itself, which is a command-line program of considerable complexity, but understanding the basic commands (checkout, status, add, commit, push, pull, branch) takes no more than a day and is all you are going to need. The official Git webpage linked above has plenty of good educational resources.
*** Statistics ***
Perhaps my main complaint with the public analytics today is that the analysts do not use the proper statistical machinery to tackle their questions. As I have said before, all progress on the key analytics questions than can be achieved with counting and averaging event data has been achieved. Football is complex and football data is noisy, and to derive robust insight, powerful, specialist tools are necessary. Unfortunately, learning advanced statistics on your own is a challenging and long process, and despite having been engaged in it for the past several years, I have only scratched the surface. Perhaps the more efficient way of doing it would be to attend an online course, or follow a general statistics textbook. I can't recommend any particular course but I can't imagine that a randomly chosen one can do harm. As to textbooks, Cosma Shilazi's draft is very decent, as is Norman Matloff's (Thom Lawrence's find), and they are both free. Gelman et al.'s Bayesian Data Analysis is a comprehensive, advanced treatment of, erm, Bayesian data analysis, and if you google hard enough there is a PDF of that on the web too.
One concrete statistical method that I believe is simple enough to get a grip on very quickly but could instantly improve a majority of your analyses is Generalized Linear Models (GLMs). GLMs generalize linear regression in two ways: first, the dependent (predicted) variable doesn't have to be a linear function of the predictors variables anymore, and second, the distribution of errors is not necessarily Gaussian. Because of these two areas of added flexibility, many of the common football analytics models fit in the GLM framework. An expected goals model can be a GLM but so can a score prediction model or a power ranking, and so on. R has the in-built glm function, which allows you to specify GLMs with a single, powerful command, and the payoff is great: you get the coefficients, statistical significance and fit diagnostic all for free.
***
My objective in this article is to enable budding football analysts to build a platform from which they can analyse the game in the most efficient way possible, meaning maximum insight for unit of time spent. Unfortunately, unless you're already half-way there, this entails a heavy initial time investment. In my view it is not just worth it; is it a necessary precondition for serious work. If serious work is what you have in mind, do not hesitate for ask me on Twitter (@statlurker) for further pointers. Many thanks to Thom Lawrence for his feedback on this article.
Towards A New Kind Of Analytics

I have been involved in football analytics for four years and doing it for a living since 2014. It has been a wonderful adventure, but there is no denying that the public side of the field has stalled. But this is not really a "crisis of analytics" piece or an indictment of the community. Instead, I want to point out one critical barrier to further advancement and plot a course around it. In short, I want to argue for a more theoretical, concept-driven approach to football analysis, which is in my opinion overdue.
It is going to be easy to read this short article as a call to basic, as opposed to applied, research and consequently dismiss the ideas as impractical. Try not to do this. I like applied football analytics and I firmly believe that it has value -- even the public variety. But I also believe that we have now reached the point where all obvious work has been done, and to progress we must take a step back and reassess the field as a whole. I think about football analytics as a bona fide scientific discipline: quantitative study of a particular class of complex systems.
Put like this it is not fundamentally different from other sciences like biology or physics or linguistics. It is just much less mature. And in my view we have now reached a point where the entire discipline is held back by a key aspect of this immaturity: the lack of theoretical developments. Established scientific disciplines rely on abstract concepts to organise their discoveries and provide a language in which conjectures can be stated, arguments conducted and findings related to each other. We lack this kind of language for football analytics.
We are doing biology without evolution; physics without calculus; linguistics without grammar. As a result, instead of building a coherent and ever-expanding body of knowledge, we collect isolated factoids. Almost the entire conceptual arsenal that we use today to describe and study football consists of on-the-ball event types, that is to say it maps directly to raw data. We speak of "tackles" and "aerial duels" and "big chances" without pausing to consider whether they are the appropriate unit of analysis. I believe that they are not.
That is not to say that the events are not real; but they are merely side effects of a complex and fluid process that is football, and in isolation carry little information about its true nature. To focus on them then is to watch the train passing by looking at the sparks it sets off on the rails. The only established abstract concept in football analytics currently is expected goals. For good reasons it has become central to the field, a framework in its own right. But because of it focuses on the end result (goal probability), all variation without impact on xG is ignored. This focus on the value of a football action or pattern rather than on its nature seriously undercuts our understanding of the fundamental principles of the game. Just like isolated on-the-ball events, expected goals tell us next to nothing about the dynamic properties of football. Indeed it's the quantitative dynamics of football that remains the biggest so-far unexplored area of the game.
We have very little understanding of how the ball and the players cross time and space in the course of a game, and how their trajectories and actions coalesce into team dynamics and, eventually, produce team outputs including goals. This gap in knowledge casts real doubts on the entirety of quantitative player analysis: since we do not know how individual player actions fit in the team dynamics, how can we claim to be rating the players robustly? And before the obvious objection is raised: these dynamic processes remain unexplored not for the lack of tracking data. The event data that is widely available nowadays contains plenty of dynamic information, but as long as our vocabulary forces us to consider every event in isolation, we cannot but glimpse it. Luckily, a newer concept is emerging into view and taking a central place: the possession chain (possession for short).
A possession is a sequence of consecutive on-the-ball events when the ball is under the effective control of a single team. A football game can then be seen as an (ordered) collection of sequences. It is a very positive development since possessions make much more sense as the fundamental building blocks of the game than events. This is because they are inherently dynamic -- they span time and space. I believe that they should be studied for their own sake, and if you only compute them to figure out who should get partial credit for the shot at the end of it, then in my opinion, you are doing analytics wrong - or at least not as well as you could be.
To give an example of such a study and why it is important, consider the question: what makes two possessions similar? To a human brain, trained in pattern recognition for millions of years, it is a relatively easy question. It is however a quite difficult, basic research task to devise a formal similarity measure given the disparate nature of the data that makes up a possession (continuous spatial and time coordinates, discrete events, and their ordering). For the sake of argument, assume that we have a measure that we are happy with. It has an immediate, powerful application: we can now measure the similarity of playing styles of teams and players by measuring the similarity of possessions in which they are involved. This method is bound to be much more precise than the current, purely output-based methods, and as we know, playing style similarity has a wealth of applications in tactics and scouting. But that's not the end of the story.
Our hypothetical measure, having already provided a considerable applied benefit, can now be fed back into basic research. Under a few relatively mild additional assumptions, the measure gives a rich structure to the set of all possible possessions, potentially allowing us to deploy a century of research in general topology and metric spaces to make statements about football. But for all these potential rewards, the subject remains unexplored because of the twin obstacles of inadequate conceptual arsenal and perceived lack of immediate applied benefit.
* * * Based on what I sketched above, my suggestion for everyone involved in the field is to be more ambitious, to think more expansively and to not settle for imperfect investigations of lesser questions just because the data seems to be limiting us in this way. It isn't, at least not all the time. Instead of counting events in more and more sophisticated ways, let us focus on possessions, ask broader questions and interrogate the data in more creative ways than before. I firmly believe that the payoff of this approach will be far greater than anything we have achieved so far.
I want to thank Colin Trainor (@colintrainor), Ted Knutson (@mixedknuts), James Yorke (@jair1970) and especially Thom Lawrence (@deepxg) for their feedback on earlier versions of this article.
3'781 ways to score a goal

Is every goal unique? The instinct says yes, but one needs only to remember Steven Gerrard to realise that it is possible to make a fine career out of scoring the same three goals over and over. The truth sits somewhere in the boring middle, but it's undeniable that many goals share similarities, including how they are created. It is this similarity that I set out to explore here.
My analysis rest on the notion of possession chains. For every on-the-ball event -- such as a goal -- it is possible to find the unbroken, ordered sequence of previous events leading to it. This is the idea on which Colin Trainor based his recent article about players' attacking contributions. My definition of a chain is likely different from his, and too technical to give it in full here, but the broad outline is as follows:
- I only look at chains terminating in a goal,
- The events in the chain are strictly consecutive (ie. no intermediate events are excluded),
- Only actions by the scoring team belong in a chain,
- A set piece can only be the first event in the chain (ie. we never look past a set piece),
- Ditto possession regain events (tackle, interception, recovery).
The numerous minor choices I had to make on top of these may mean that the overall definition is so arbitrary that I am unsure how much of what follows is insightful (never mind useful), and how much is just having unwholesome fun with the data. Caveat emptor.
The data I looked at was kindly provided by Opta and comprises all games from 2010/11 to 2013/14 in the top divisions of England, Spain, Italy, France and Germany. For every goal I derived the possession chain and grouped identical chains. It turns out that the 50 most common goals look like this:
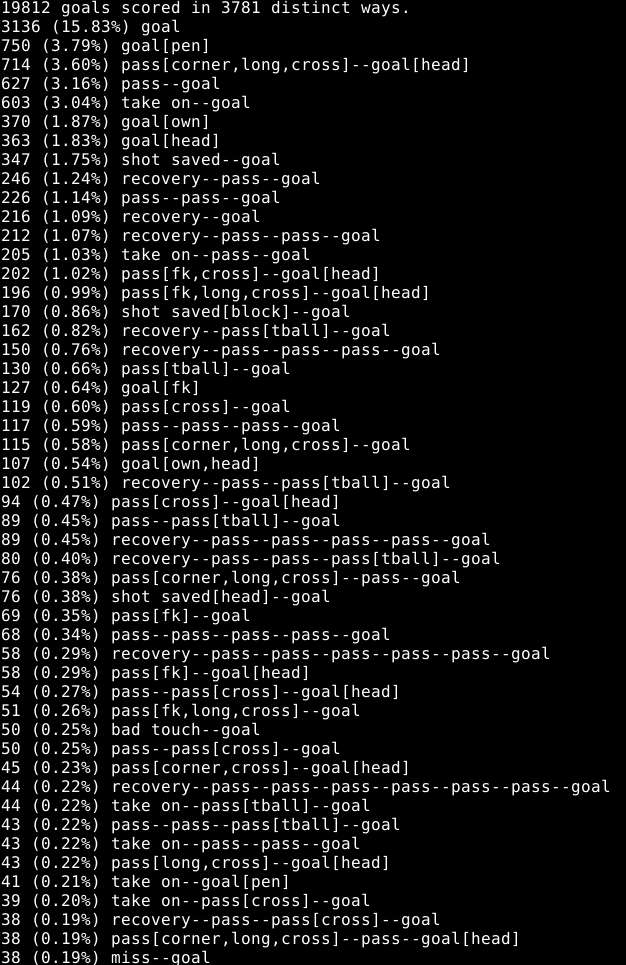
[Yep, that's a screenshot.]
As you can see, by far the most common goal is scored with the team's first touch in the chain. I think this is partly a testament to the randomness of the game itself, but also to the strictness of the definition of the chain: if a defender manages to get a touch just before an intricate move is about to be crowned with a goal, none of the move will count in the chain. A penalty and a header from a corner complete the top 3.
Another summary of the results is provided in the figure below. Apologies for the terse, but hopefully still unambiguous codes for individual events. Note that listed event can occur anywhere in the chain for the goal to be counted, so for example the "head" bar comprises not only the headed goals, but also any goals where there was a headed pass in the move.
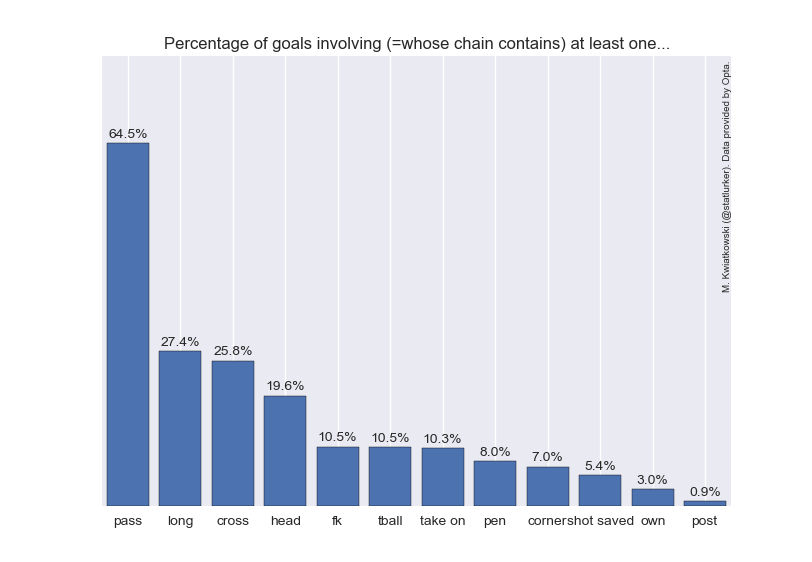
It turns out that only 64.5% of goals have a completed pass in the buildup (again, under my restrictive definition of buildup). I was delighted to discover that this agrees nicely with the classic analysis of Reep and Benjamin ("Skill and Chance in Association Football" J. R. Stat. Soc. 134(4):623-9, 1968, cited here after The Numbers Game), whose number is 60.6%. A quarter of goals involve a cross (but not necessarily as an assist), and about 1 in 19 see a shot saved before the ball goes into the net. Own goals are 3% of the total.
Finally, for the theory minded, here is the distribution of frequencies of individual chains on a log-log scale. It's tempting to drop some names here (cough Zipf cough), but in truth so many things look linear-ish on a log-log plot that it's best not to. Perhaps if and when the definition of the chain is made more robust, the distribution plot will be more interesting.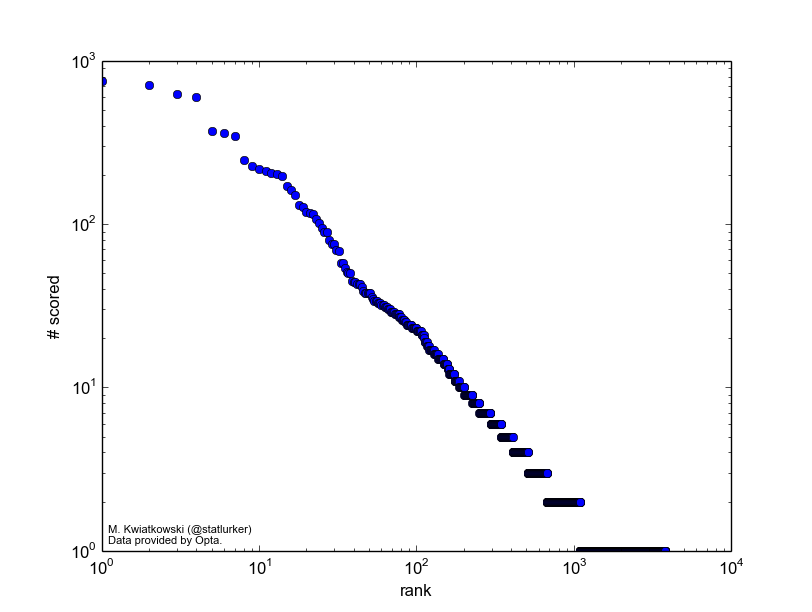
How low can you go: Assorted thoughts about crosses
There is a pass that David Silva and Mesut Ozil, Premier League's outstanding playmakers, are very fond of. Standing just inside the opposition penalty area close to a corner, with options inside and outside the box, they slip the ball instead to the overlapping fullback who crosses it in. Why do they do this if, as the common wisdom has it, crossing is low percentage play?
The obvious answer is that not all crosses are equal, and with good setup play a cross is a dangerous weapon. I think it is particularly true of short, low crosses, precisely the kind Ozil and Silva encourage. I set out to investigate this hypothesis, only to realise that I don't have a clean way of separating low and high crosses in my database. What follows are two simple analyses trying to work around this problem.
Completion and conversion
Two definitions: I consider a cross completed if the next on-the-ball action is performed by the player from the crossing team. A cross is converted if the crossing team scores within 5 seconds of the cross. This is an arbitrary window, but it should catch all the goals (including own goals) which are "due" to the cross in significant degree. This will include own goals, rebounds and goals from brief goal-line scrambles. Note that conversion and completion are independent in this formulation: a completed cross may be converted or not, and a converted cross needn't have been completed. I looked at the last four full seasons of the five big European leagues and only considered locations where I have more than 1000 attempted crosses. Unless indicated otherwise, only open-play crosses were considered.
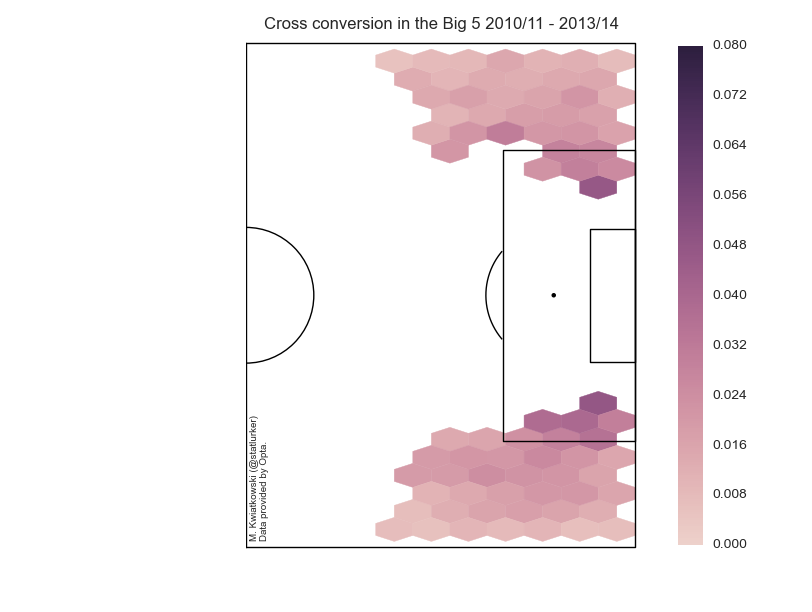
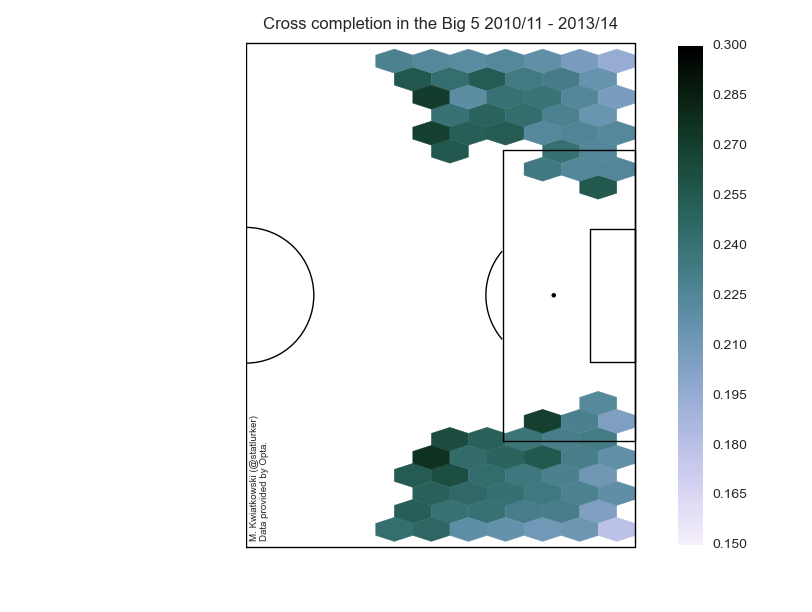
As expected, the premium crossing area is on the edge of the penalty and inside it (shall we call it the Zabaleta Zone?), where around 5% of crosses are converted. If this sounds low, then consider that the average cross conversion rate is just 1.76%. What was a bit of surprise to me is that it seems to be easier to complete a cross from the wide areas, farther away from the box. I suspect this is due to the fact that with a short cross the area is on average more crowded and who takes the next touch becomes more random. Average completion across all areas is 23.58%.
Crossing and success
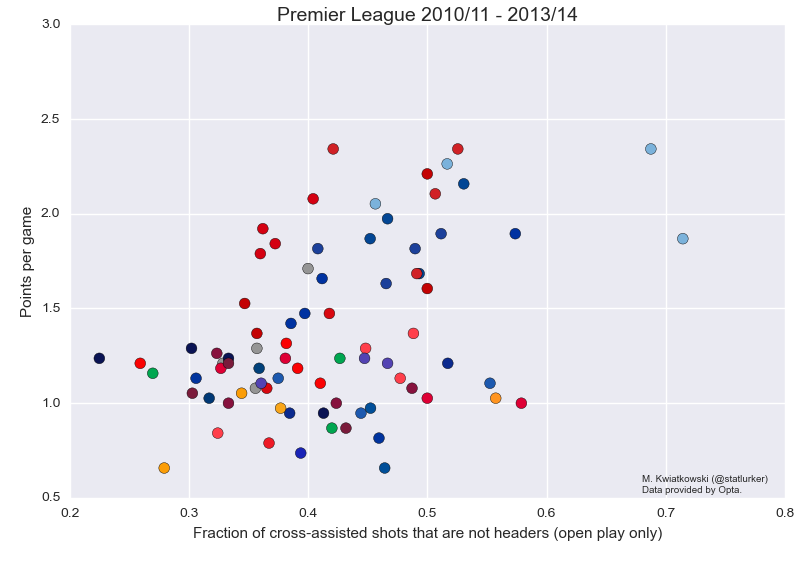
There is a weak positive relationship between success (measured in points per game) and the proportion of cross-assisted shots that aren't headers. (Here assist is taken in the strict sense and not in the sense of conversion defined above.) The correlation coefficient for the attached graphic is 0.43, which drops to 0.32 when Manchester City, the ultimate low-crossing team, are removed. Interestingly, this relationship doesn't exist in the Bundesliga and Ligue 1.
I don't want to speculate on the nature of this relationship beyond what Devin Pleuler said on Twitter on Monday:
https://twitter.com/devinpleuler/status/519196963129294850 https://twitter.com/devinpleuler/status/519197095887380481
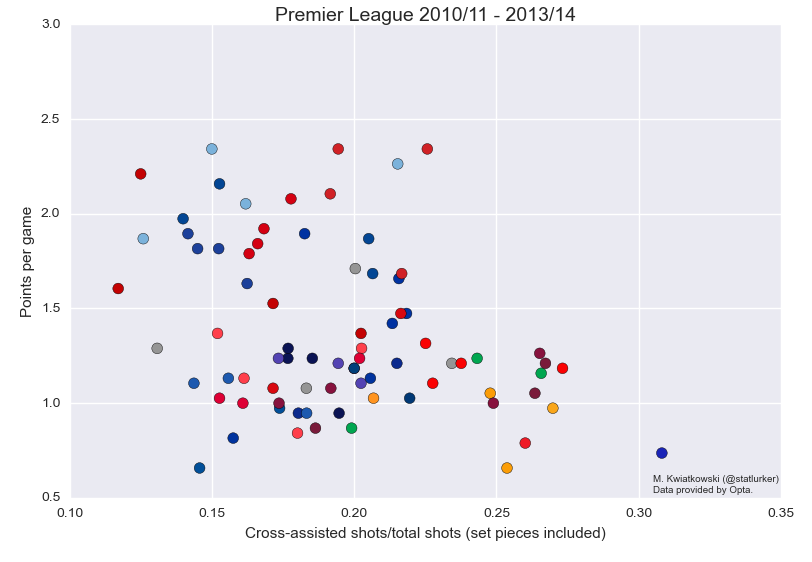
That is, a preference for low crossing will come naturally to better teams. Success and reliance on crosses are inversely related: the higher proportion of a team's shots come from crosses, the lower points-per-game. The strength of this relationship is similar to the previous, and, once again the effect is not found in Germany or France.
Conclusions
There can be no firm conclusions until I find a way of separating low crosses from the rest. However, it does appear that not all crosses are equal, and that a team that relies heavily on crosses for chance creation should make sure they know what they're doing. Data provided by Opta.
Picking the optimal Colombian XI for the World Cup
This article is part of the Goalimpact World Cup series. The Colombian XI was picked by Bobby Gardiner. Bobby regularly writes about a variety of football topics on his own blog and other outlets. To read more from him, follow him on twitter at @BobbyGardiner or have a look at www.falseix.com. The eminently skippable subjective introduction to player ratings and Goalimpact is by Marek Kwiatkowski (@statlurker).
Player analysis is a big deal given the sums spent in transfer fees and player wages. Accurate measurement of players' actions is now possible in a number of areas thanks to the detailed data collected by companies like Prozone, Opta and Infostrada. But individual output is at best a proxy for performance, and the same has to be true of any player rating built on top of individual action counts. Often there will be players with excellent output who are clearly less valuable than some of their peers with lower output. You could call this effect the Podolski Paradox, only it is anything but a paradox: it is a logical, mundane consequence of the fact that at the low level, football is not bean counting but a complex, non-linear and, above all, densely interlinked dynamical system, where individual events take place in a rich context.
Consider for a moment the steps necessary to turn actions into a rating: a single-number performance score for individual players. First, you need to select the relevant actions, and these will be different for different player positions. Incidentally, "position" is not a very well defined concept at all, but we plough on. Now you need to weigh the actions: how many tackles is a key pass worth for a full-back? How about for a forward? Hmmmm. But let's go on; say we scored all actions separately. Now we need to normalise these scores for various factors such as time spend on the pitch (easy-peasy), quality of opposition (feasible) and opportunity to perform every kind of action (errrrrr). But say we've managed to do that, so now it's time to combine the scores into a single rating. Is it a straight sum, or at least a linear combination? No it isn't, and so on. The multi-dimensionality and complexity of the game bites you in the ass as soon as you begin and doesn't give up until you do.
In other words, what we need before we can build a robust player rating system based on individual actions is nothing less than a complete theory of football: a set of axioms that would allow us to put a precise value on every action in every context. We often -- always -- proceed as if such theory were not a prerequisite for bottom-up player evaluation, and as long as we do ad-hoc comparisons and the signal is strong we can get away with it, too; whatever that elusive ultimate theory is, it contains rules like "more goals is better" and "give-aways are bad". But a comprehensive player rating system developed on such a flimsy basis is guaranteed to be bad -- witness the WhoScored ratings, whose chuckle:insight ratio is somewhere in high single digits. Lastly, even if we ever arrived at an apparently robust action-based rating and tied it to real-world outcomes such as wages, chances are it would be gamed by players before you could say "Hang on, Mr Mendes".
But once we free ourselves from thinking in terms of individual actions, a new perspective opens. Football is a team sport, as the cliché goes, so how about giving equal credit for every goal scored (and equal blame for every goal conceded) to all players on the team, regardless of who scored it, who assisted it, who intercepted the ball for the move and who made the decoy run? This simple, elegant and fair approach is the basis of top-down player ratings, chief among them the Goalimpact, developed by Jörg Seidel. Goalimpact has its weaknesses, but in my opinion is still miles ahead of any other systematic, public player rating scheme. To give you a flavour of Goalimpact, the most recent update (February 2014), has Ronaldo, Lahm, Fabregas, Schweinsteiger and Messi, in that order, as the five best players in the world. I wouldn't be a lapsing academic if I didn't use this list as a starting point for a quick overview of the strengths and weaknesses of the model.
Ronaldo makes perfect sense and provides basic validation of the model. Lahm is a fantastic pick, highlighting the core strength of top-down ratings: independence from individual output, the scoring of which is as a rule more difficult (or at least less settled) for defenders. By way of strengthening this point: Lahm is not in the top 50 players according to WhoScored, who instead have Wolfsburg's attacking left-back Ricardo Rodriguez as the 5th best player in the world (good player; no further comment). Messi in 5th seems low, but perhaps it's a sign that his otherworldly performances over the years should be also credited to his excellent Barcelona teammates? Schweinsteiger on the other hand looks too high, but maybe he is responsible for Bayern's runaway success -- or maybe his position is a signal of an unindentified (by me, as yet) bias in the GI formula. That leaves Fabregas, who can be a poster boy for Goalimpact's major weakness: a standout player who remains at a level lower than that to which he belongs will be overvalued. This refers to Fabregas' time at Arsenal, and we also found similar issue with the Goalimpact of the Colombians who made it to the big European leagues being often lower than that of the best players in the Colombian league.
Over to Bobby.
* * *
Thanks to Jörg Seidel of Goalimpact for the data. If you're wondering what Goalimpact is/entials, check it out here - http://www.goalimpact.com/p/blog-page.html (or, indeed, scroll up --ed).
After a sixteen year wait, Colombia are returning to the World Cup Finals. Inspired by a ‘golden generation’, Los Cafeteros have risen to fifth in Fifa's World Rankings and given their notoriously passionate fan-base cause for genuine hope. Their first obstacle is escaping unscathed from what is possibly the most even of Rio’s groups – Greece, Côte D’Ivoire and Japan join them in C.
The XI crafted from GoalImpact scores alone:
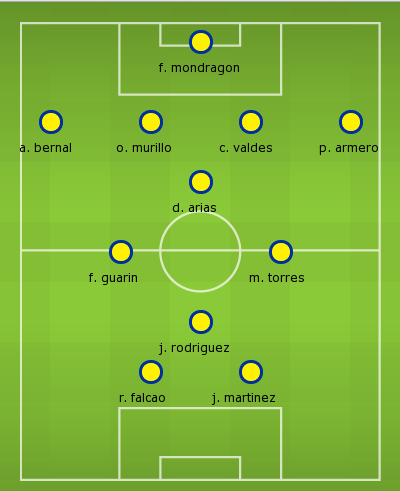
This particular set up is quite far off a likely XI, probably due to a combination of old defenders (Perea, Yepes and Mosquera are all in their 30s and in Pekerman’s squad) and a lot of players in the Colombian League. That isn’t to criticise GoalImpact as a measurement, though, as we all know that players aren’t always picked or not picked based on ability and/or output alone (ask Samir Nasri or Carlos Tevez). Context is needed, and so I’ll somewhat systematically rifle through each area of the team:
Defence
In between the posts, David Ospina of Nice is likely to start. His GI of 92.6 is quite noticeably lower than the 123.67 of Faryd Mondragon, but he is 17 years younger and fast establishing himself as Colombia’s first choice keeper. They’ll be joined in the squad by the uncapped Camilo Vargas (102.78).
Oscar Murillo (110.46) and Alejandro Bernal (110.78), both of Atletico Nacional in Colombia, failed to make Pekerman’s initial 30 man squad and so are out of contention.
Pablo Armero (116.39), recently on loan at West Ham, is likely to start at LB while PSV’s Santiago Arias (94.5) should take up the other full back spot. The young right back may have been capped just 4 times by his country but he is only 22 and has been linked with the likes of Manchester United recently.
I’m not sure what the oldest centre back pairing at a WC is, but if Luis Perea (93.92) and Mario Yepes (40.97) start together as they did in Colombia’s most recent friendly against Tunisia, their combined 72 years may just break that record. Although their GIs (especially Yepes’) are very low, their peak GoalImpact scores are 123.67 and 138.33 respectively and so an experience vs current output trade-off may be Pekerman’s thinking here. I would personally start AC Milan’s Cristian Zapata (102.17) over Yepes. At 27, he’s not far off his peak but still possesses the necessary experience for the occasion.
Midfield
The general rule of thumb with the Columbian team is the more you push into the attack, the higher the quality of the players. Sadly, Diego Arias (110.86) will not play a part in Rio - like his aforementioned Atletico Nacional teammates, he failed to make the provisional squad.
If you didn’t know who Fredy Guarin (115.04) is, you probably did come January after a frankly confusing transfer fiasco with his club Internazionale and a whole host of English and Italian clubs. In the end the talented all-rounder stayed and he is extremely likely to start in Rio. One of Abel Aguilar of Toulouse (94.08), Elche’s Carlos Sanchez (92.35) or Monarcas’ Aldo Ramirez (93.6) will probably start next to him at centre-mid. I’d go with Aguilar myself. In terms of GI, there’s almost no difference between the three, but the first two are a tad more defensively minded than Ramirez while Aguilar edges it over Sanchez because of his ability to (albeit occasionally) score.
James (pronounced Ha-Mez) Rodriguez (122.87) is one of my favourite players in the world. At 22, he is quickly becoming the perfect combination of dangerous pace and brilliant creativity; managing an extremely healthy NPGA90 of 0.65 this season at Monaco. A lot of attention directed towards the Columbian team will focus on his Monaco teammate, but keep an eye on the man likely to start as a winger but equally adept in a 10 role. On the opposite flank, Juan Cuadrado (106.87) is my choice. An extremely important part of Fiorentina’s attack this season, the skilful winger has improved tremendously in terms of efficiency with a NPGA90 of 0.52. If Pekerman wants a more central attacking midfielder, Macnelly Torres (116.13) is almost a certainty for the squad. Although now plying his trade at Al-Shabab in Qatar, the quirkily named creator is renowned and feared in South America for his trickery.
Attack
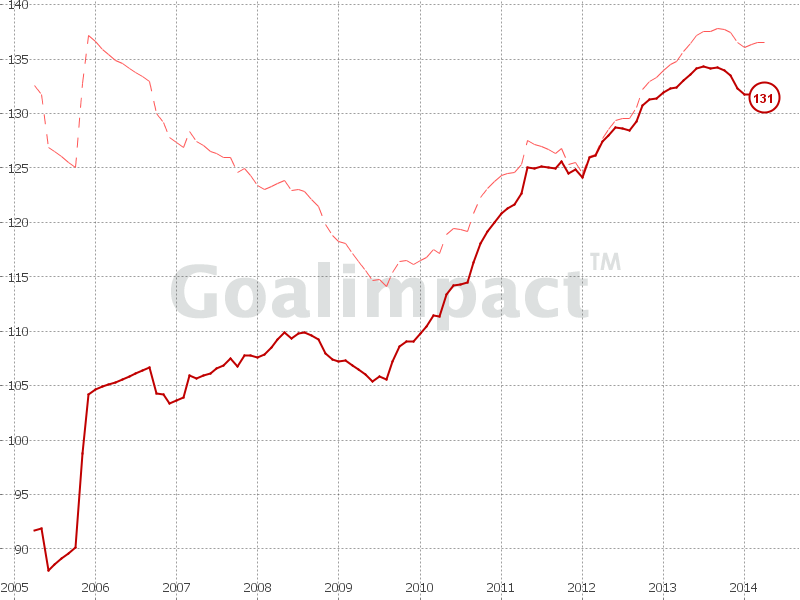
To be honest, the shape of Columbia’s attack is entirely dependent upon the fitness of one man – Radamel Falcao, whose GoalImpact score is the highest of any of the squad at 131.46. Any ‘golden generation’ comments or ‘dark horse’ bets are almost entirely focused on him. Seen by many as one of the best strikers in the world, his race to fitness has encouraged Pekerman enough to include him in the provisional squad and we all hope that he makes it.
The thing is…it might not be THAT big of a deal if he doesn’t. Before I’m thrown into some kind of metaphorical football taboo dungeon, let’s have a look at Columbia’s other striker options. Jackson Martinez of Porto (119.5), soon-to-be Dortmund’s Adrian Ramos (109.4), Sevilla’s Carlos Bacca (112.46), Luis Muriel of Udinese (105.08) and Cagliari’s Victor Ibarbo (99.52) have all made the provisional squad. That’s an incredible amount of good quality strikers, and Ramos and Bacca especially are coming off the back of very strong seasons with their club sides. As for which of those start if Falcao is out, I’d go with Martinez and/or Ramos depending on the formation. Both are adept target men, but deceptively good with their feet and I think they’d provide the best outlet to James.
My XI, combining context and GI scores:
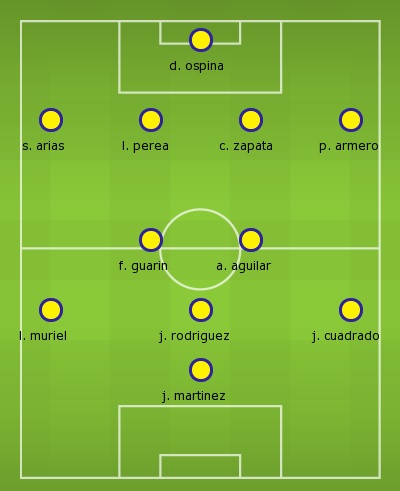
Formation wise, it’s quite difficult to predict what Pekerman will do. A 4222 type set up helped him through the qualifiers but he was equally reliant on a more defensive 4231 away from home. Against the offensive prowess of Cote D’Ivoire and Japan, the latter might be the better option.
Muriel has been regularly used by club and country as a winger and putting him there allows James to unleash his creativity more centrally. Obviously, if Falcao is fit, he starts either over Martinez or alongside him (or any other one of their billion strikers) in a 4222. The average GoalImpact score of this particular team is 107.60 which is pretty low, but a lot of these players are either young and having their first few good seasons (Muriel, James, Cuadrado) or old and likely to bow out after the World Cup.
‘16’ is an important number for Los Cafeteros in another sense - the furthest they've been in a World Cup was the round of 16 in 1990. Maybe, with or without Falcao, Pekerman's men will be able to better that this summer.
From Awesome to Average to Awful: Goalscoring Stat Distributions
Thanks to Ted Knutson's work, we know the players with the best attacking output between 2008/09 and 2012/13. (For all the usual reasons I hesitate to say the "best attacking players".) But his litany of superstars (a few surprise names notwithstanding) says nothing about how we should evaluate the performance of more ordinary players. We know Olivier Giroud isn't as good as Messi, but can we quantify that gap? And how does he compare to the rest of the field? In short, we need to see how the basic performance metrics are distributed across all players in the game. This is what I'm setting out to do, in what will hopefully be a series of articles. Today, I focus on attacking production, ie. goals and assists.
I use two simple metrics that you probably have seen before: non-penalty goals scored per 90 minutes spent on the pitch (NPG90), and non-penalty goals plus assists per 90 minutes (NPG+A90). Ted has already written about the need of discounting penalty goals from analyses and the importance of normalisation by time in the article linked above, so I don't have to. Naturally, normalisation for other factors, most notably team and opponent strength, would be nice, but I don't do it since there is no canonical method of doing so. Caveat emptor.
The dataset I used consists of players from the five big European leagues, and spans almost five full seasons (full 2008/09 to 2012/13 and 2013/14 until last weekend). For this article I restricted it to the players who can reasonably be termed "attackers", because I didn't want the low attacking output of defenders and deeper midfielders to overwhelm the distributions. The actual algorithm used to determine whether a player should be counted is rather complex, and I will not describe it here, except to say that it did not rely on the goal and assist numbers and so didn't introduce bias. I wouldn't expect it to be 100% accurate, but the collection of players considered here should contain most forwards, wingers and purely attacking midfielders from my dataset. Playing 900 minutes or more over the course of a season was also required for inclusion in this study.
The histograms of NPG90 and NPG+A90 are shown below:
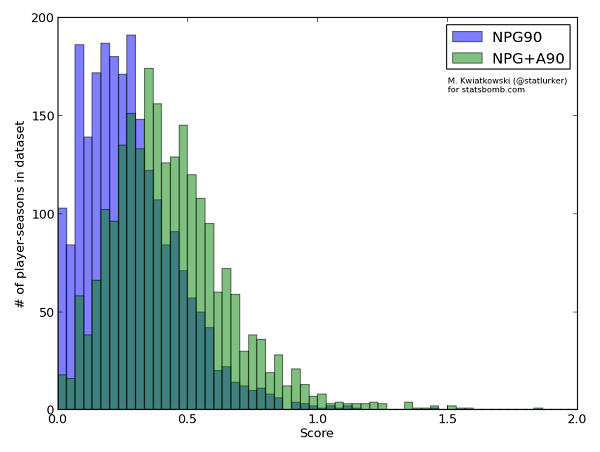
(NPG90 mean: 0.28, std dev: 0.18; NPG+A90 mean: 0.44, std dev: 0.23)
Now, I am not a statistician, but to my eye both distributions resemble the normal distribution, but with the left side thinned out and the left tail chopped off by the boundary. This makes sense intuitively: with the multitude of factors contributing to player's performance we'd expect it to be normally distributed; and the missing players in the left half are simply those who are not good enough for a team in Europe's big 5 leagues, and ply their trade elsewhere.
Another, and perhaps better way of visualising this data is the cumulative distribution plot: 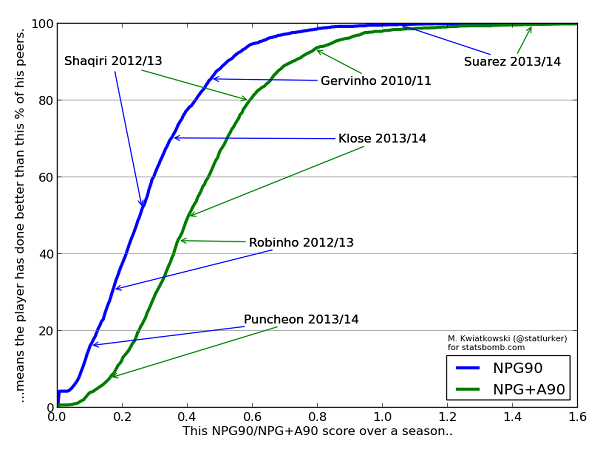
Here we can see for example that to be in the top 20% of attackers in Europe, a player should score at least at the rate of 0.42 goals per 90 minutes, and have a "goal involvement rate" of 0.59 per90 (NB. For a top-class #9, these numbers are not enough -- they are biased downwards by all the midfielders in the dataset). We can also see why Arsenal believed in Gervinho, and that Miroslav Klose is not doing badly for a 35 year old.
With thanks to Ted Knutson for discussions on this subject. Data collected by ![]() .
.
Classifying Central Midfielders
By Marek Kwiatkowski
Go to Squawka or StatsZone and find the passing graphic for Mikel Arteta's last performance. Do the same for Andrea Pirlo. Both are deep-lying playmakers, yet the graphics are different: more long diagonals from Pirlo, more ground covered laterally by Arteta, and there is likely a number of subtler differences, some of which you don't notice right away.
This is hardly news, of course; Arteta and Pirlo are high-profile players and their playing styles are scrutinised by fans and pundits. Everyone knows they're different. But what can you say about, for example, a young Dutch deep-lying playmaker whom you have never seen play? Is he more like Pirlo, or more like Arteta or maybe unlike either? Maybe he's unlike any other player? You find his passing chart, and you can't quite tell.
Annoyingly, the summary statistics don't help either: all three players have completed a stellar number and percentage of passes, forward passes, key passes, final third passes...
My point is that there is a wealth of information in the detailed passing data, especially geometrical information that is currently unused, at least outside of the impenetrable world of clubs' performance analysis departments. Leaving aside pesky factors like technique, positioning of the opponents, the run the target player etc., a pass is pure geometry: the starting point, the angle and the length.
In this article I attempt to use this information to compare passing patterns of Europe's top central midfielders. The data was provided by Opta, and comprises of every pass made in 2012/13 by the 137 central midfielders from the top division in England, Spain, Italy and Germany who played in more than 20 games and completed more than 1000 passes in total.
ON-FIELD POSITION
The first comparison looks simply at where the different players play the passes from. The obvious way to look at it would be to compute the average initial coordinates of a pass, but that's too reductive: it ignores the fact that players may play slightly different tactical roles and occupy different zones of the pitch in different games. So instead I take the average pass position for every game. This results in 20-40 points, depending on how many games the player took part in, and nicely delimits the zone the player typically occupies, especially after outliers are removed.
This process is illustrated on Figure 1, where I determine the on-field "zone" of Mikel Arteta. For two different players, I take the ratio of the overlap of their zones to their sum as the measure of similarity. In fact, for technical reasons, measuring *dissimilarity* is better, so I take one minus the ratio above. In this formulation, if two players occupy exactly the same zone, their dissimilarity would be 0; if their zones are disjoint, the dissimilarity is 1.
ANGLE, LENGTH AND VOLUME OF PASSES
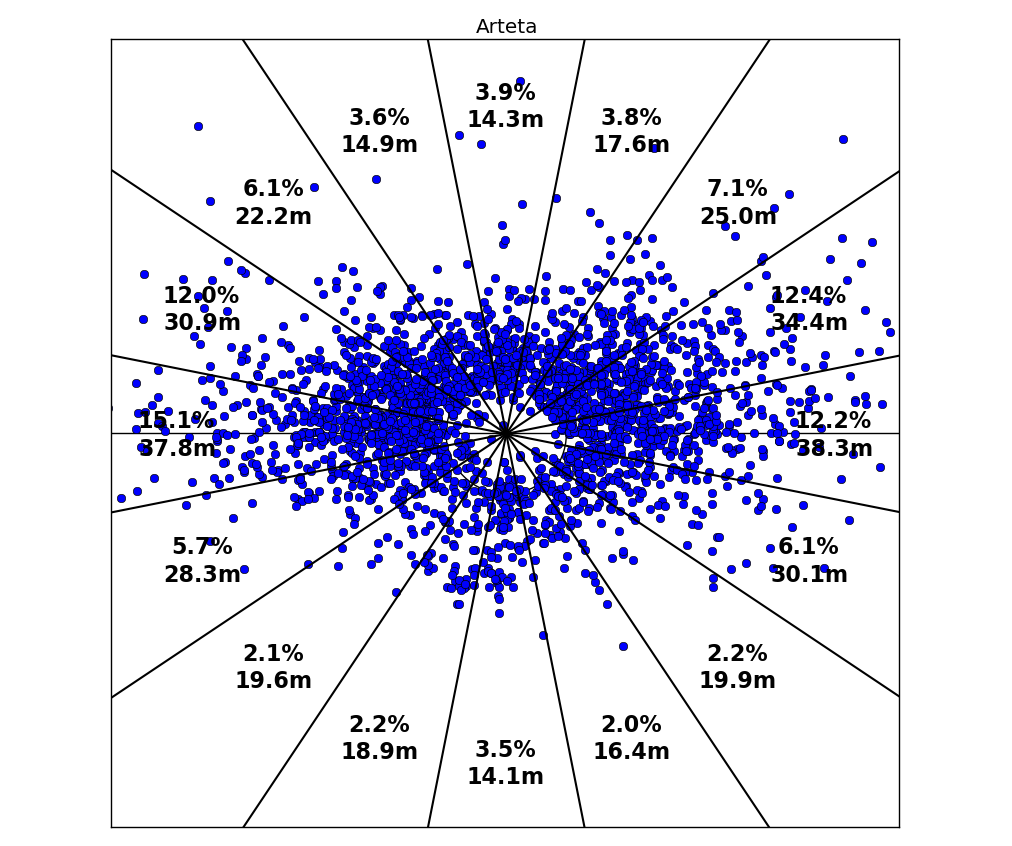
To compare passing lengths and angles we'll do something crazy, and pretend that all passes are played from the kick-off spot. It's a little less crazy than it appears though, because we can now control for the position the passes are played from. So if due to this simplification, the angle/volume model tries to tell us that Cattermole and Silva are similar because they both play a lot of short sideways passes, the position model will warn us this is probably not the case.
Figure 2 shows how we go about quantifying the length and number of passes that a player plays in different directions. The 360 degree circle is split into 16 slices, and we record the percentage of passes in each slice as well as the average length. In this way, the data on length and direction of 1000+ passes is reduced to 16 numbers each, and to compare two players we now only have to compare two pairs of 16-long vectors. This is easily done with standard math, by taking the sum of absolute differences between the 16 matching coordinates.
PUTTING THE TWO TOGETHER
For any two players in the dataset we are now able to quantify their dissimilarity in three respects: the typical position they take up on the field of play, the directions in which they pass the ball, and the average pass length in each direction. In other words, for each pair of players we have three numbers, each number quantifying the dissimilarity in a different aspect of their passing game. Visualising all this information in one go is hopeless, so I will instead focus on individual players.
Each of the following plots compares one chosen player to all the others in the dataset. The volume and length dissimilarities are plotted on the two axes, so the closer the player is to the origin (0,0) point, the more similar to the focus player he is according to the angle & length model. The position dissimilarity is color-coded: the colder the colour, the more similar the player's position to that of the focus one: blue means very similar, brown and red means very dissimilar.
CASE STUDY 1: DAVID SILVA
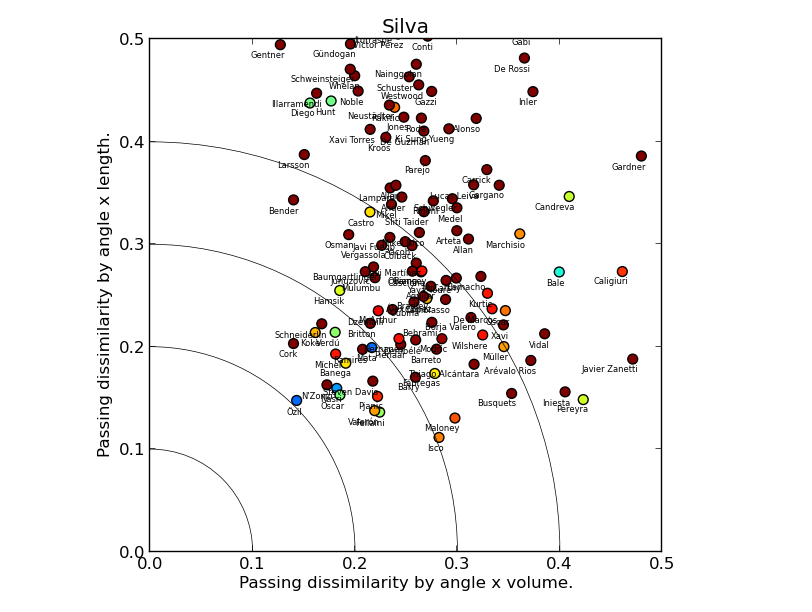
(Click for a larger version)
David Silva's plot suggests the model is sane: it picks Mesut Özil as the most similar player, with a trio of creative midfielders: Nasri, Oscar and Mata not far behind. Steven N'Zonzi appears close to the origin point, but his marker is brown red, which means that he differs from Silva a lot by position. Marouane Fellaini is an interesting outlier, quite similar in all three metrics (the dataset covers 2012/13 when he played in an advanced position for Everton), suggesting that the model would benefit from an extension taking into account pass completion rate, or maybe just the number of passes.
CASE STUDY 2: ANDREA PIRLO
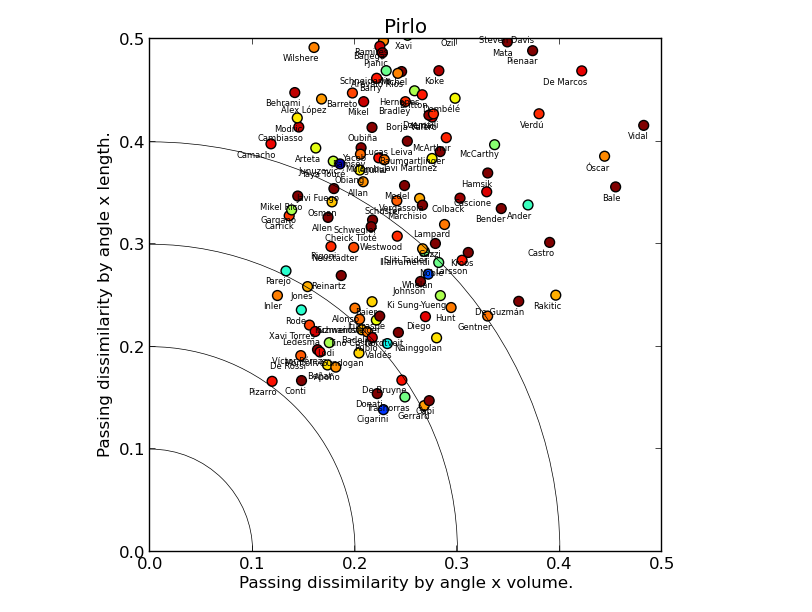
There are a couple of things we can quickly read off Andrea Pirlo's chart. First, despite a fair number of registas in the dataset, all markers are far from the origin point, meaning there are few players similar to him. The dissimilarity by length is higher on average than by volume, reflecting Pirlo's penchant for hitting long balls. Second, Luca Cigarini is clearly the most similar player, with David Pizarro, Steven Gerrard and Roberto Trashorras not far behind (albeit the two show low similarity-by-position to Pirlo), which fits nicely with Ted Knutson's scouting articles here on StatsBomb.
CASE STUDY 3: SERGIO BUSQUETS AND YAYA TOURE
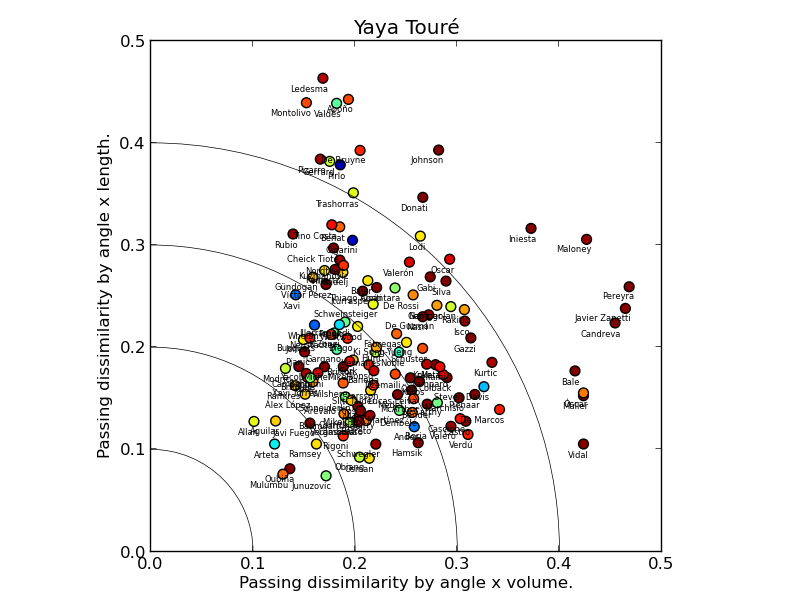
Sergio Busquets and Yaya Touré are rightly seen as unique players. What does our model have to say about that? Let's look at Touré's chart first. In fact, we find a lot of players close to the origin point, and with cold-coloured markers, i.e. similar to Yaya in all respects. This doesn't mean Touré isn't unique, just that what sets him apart from other players is not his passing. The fact that Mikel Arteta is overall the most similar player to Touré according to our model rams the point home.
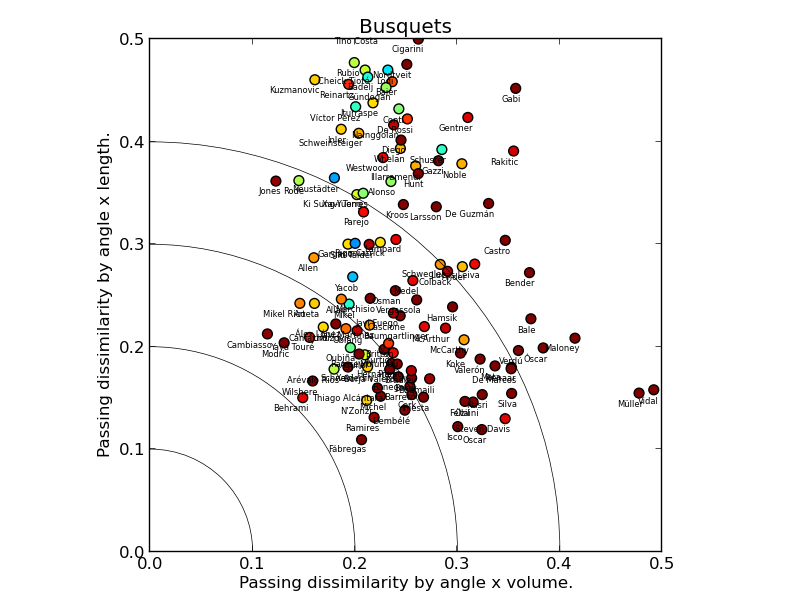
Busquets’ chart tells a different story: the players similar to him in the length & volume model play in different positions, as indicated by the red/brown cloud closest to the origin point. In contrast, the players who occupy similar on-field position to Busquets pass the ball very differently: the blue/green cloud is far from the origin. Sergio Busquets is indeed unique and it is largely his passing that makes him so.
LIMITATIONS AND POSSIBLE IMPROVEMENTS
The passing data is rich, but of course oblivious to many facets of central midfield play, so many that I won't bother enumerating them. So the model I presented here is not a comprehensive player comparison algorithm, and even in its limited domain of application it has a few wrinkles.
The biggest possible improvement, and my next step if there is interest, would be to work with passing data directly in 4 dimensions. Because it takes four coordinates to specify a pass (two for origin point, two for endpoint), passes are inherently 4-dimensional objects. Because 4-dimensional geometry comes with considerable challenges to computation and intuition, I have attempted to reduce it to 2 dimensions here: this is why we looked at the starting point first, and at directions and destination later.
I hope you've enjoyed the read. Comments are welcome here on StatsBomb. If you would like to see the comparison chart for your favourite central midfielder, ask @statlurker on Twitter.
Marek Kwiatkowski (@statlurker) is a scientist living and working in Switzerland.
Data provided by Opta.
![]()
Don't Tank!: The Four Phases of NBA Franchises
Supposedly, the Phoenix Suns, Philadelphia 76ers, and Orlando Magic are all “tanking”: purposefully losing games in order to get a better pick in the 2014 draft, which has been forecasted as completely incredible for years. If that’s the case, they all suck at tanking, since the Suns and Magic have scored more points than their opponents, and the 76ers are 5-6. The Suns are even above .500. The nerve of those players, playing to the best of their ability. When the 76ers started the year 3-0, there was a combination of shock, amusement, bewilderment, and panic. ESPN even published a post about how they needed to blow up the roster, in order to tank better. You know… blow it up again, after trading away their All-Star point guard for a rookie who won’t play this season. This is, in fact, not what the 76ers should do, and articles like that betray a lack of understanding as to how to build a good team for the future. Regardless of how many games the Suns are winning, they are rebuilding the right way. They traded off players that were old, expensive, or otherwise not useful to a rebuilding franchise. In exchange, they get up to four picks in the 2014 first round, and three more in the second. They also have some great young talent on the roster, and even better, their highest-paid player is Goran Dragic at $7.5m (whom I’ve already discussed them trading). Losing games is overrated. Sure, it gives teams better odds of getting that #1 pick, but that’s all it gives: odds, not a guarantee, and it doesn’t shift the odds that dramatically. The worst team in the league only gets a 25% chance at the #1 pick. Playing reasonably well, on the other hand, makes their players more valuable: Markieff Morris, as of this writing, is #10 in the league in PER, and #8 in win shares per 48. During the offseason, you were more likely to hear jokes about Phoenix’s twins than genuine interest, but now people are genuinely impressed with him. Young players, playing well, get you trade offers. And trade offers lead to more draft picks, and more good young players. Sure you and I might know how sample size works, but do New York Knicks executives? As I see it, there are four rough stages to building a team:
- Acquire long-term assets
- Get a superstar
- Build around your star
- Contend for the title
The tanking that people talk about is usually just acquiring long-term assets, in the form of draft picks and project players. These teams can afford to think five years down the line, and exploit that by nabbing assets from teams that are in a later stage of building their team (commonly referred to as “win now.” The 76ers are a great example here: their oldest players are three 25 year-olds. They have talented players in Evan Turner, Spencer Hawes, and the current Rookie of the Year frontrunner Michael Carter-Williams. They traded a second-round pick (top 50 protected!) for Tony Wroten, the 25th pick in the 2012 draft, from a team that couldn’t give him any minutes. He’s played more minutes in 11 games with the 76ers than he did in his rookie season with the Grizzlies. He made sports news with a triple-double in his first start (an arbitrary and meaningless measurement, but still kinda cool), and SportsCenter with some impressive plays. [youtube id="7CV0xTc4EV0" width="633" height="356"] Ask yourself: if the 76ers asked teams about a trade involving Tony Wroten, what do you think they’d get in return? Probably more than a relevance-protected second-round pick. These teams aren’t going to keep up their initial hot starts, of course. The 76ers have already come back to earth, and with a DRTG (points allowed per 100 possessions) of 108.6, they’re the worst-defending team in basketball. Their margin of victory puts them at 27th overall. But they’ve made people notice them. Defenders of tanking often point to the "Thunder model," of how the Oklahoma City Thunder swiftly built a championship contender seemingly out of nothing. The way I look at history is that they got absurdly lucky. If we go back to the 2007 draft, when they picked up Kevin Durant, they only had the fifth-worst record, which gave them an 18.5% chance of getting one of the first two picks. But getting the first pick would have probably led them to picking the consensus #1 pick, Greg Oden, so the only situation where their franchise ends up so well is exactly at the #2 slot. The following year, they got slightly unlucky to not get one of the first three picks in the draft, but both Michael Beasley and O.J. Mayo have massively underperformed expectations after going second and third in that draft. Russell Westbrook wasn't really thought of as someone with massive superstar potential, at the time. Serge Ibaka wasn't even a lottery pick, and they got him in the same draft, and turned him into one of the better forwards in the league. In the next draft, they seemingly reached for James Harden with the third pick (after once again dodging the #2 pick bust Hasheem Thabeet) when mock drafts had Ricky Rubio as an "easy" pick. Obviously, lottery chance affects every franchise, leading to an infinite number of "what-ifs." But it's pretty obvious that a team's expected value from three lottery picks in consecutive years is a lot lower than that of Kevin Durant, Russell Westbrook, and James Harden. That's an incredible run of draft picks, and most teams would be overjoyed to have one of those players emerge from a non-first-overall pick. Imitating a team that got where they are by that much luck will not lead to very good results. An alternate plan: if you give minutes to a bunch of recent draft picks, project castoffs from other teams, and D-League callups, most of those players will not be good. Some of them will even be atrocious. Back when the 76ers thought they were a decent team, they had a rookie named Nikola Vucevic that they drafted 16th, and got buried in their lineup. He played pretty well for a rookie in his 800-ish minutes. He ended up as a throw-in from the 76ers to the Magic in the four-team Dwight Howard/Andre Iguodala/Andrew Bynum trade, and the Magic actually gave the guy some minutes. He had a startlingly good sophomore season with them, and is exceeding it this year, becoming more efficient on more shots. This will not happen every time, or most of the time, or half the time. But if you’re an asset-acquiring team, you can afford to play a bunch of young guys and find out who’s secretly a pretty good NBA starter. “Pretty good” might sound unexciting, especially in a league where so much depends on the best ten players, but if a guy is winning games for you while making less than $2m a year, as Vucevic is, that’s an incredible deal. All the guys who didn’t work out, the team is free to decline their rookie options, and they’ll probably get 10-day contracts or play overseas after that. If your team can find a couple starters at bargain-bin prices while sifting through junk, that’ll pay off when you move to the next phases of team-building. Teams leave the asset-acquiring stage when they acquire a legitimate superstar. The traditional way (and the expected one from people that talk of tanking) is to acquire one with an early lottery pick. Just like the worst team has better odds, but a low overall chance, of the best pick in a draft, the #1 pick has the best odds, but no guarantee, of being the best player in their draft class. Looking from 2003 (when LeBron was the first pick) through the 2012 draft, the first pick has been superstar-quality six times (LeBron, Dwight Howard, Derrick Rose, Blake Griffin, Kyrie Irving, Anthony Davis), a very good player twice (John Wall and Andrew Bogut), somewhat of a bust in the case of Andrea Bargnani, and derailed by injury in the case of Greg Oden. 60% chance at a superstar is fantastic, there’s no doubt about that. But looking at things from the opposite direction, the picture is muddied a bit. Of the top 20 players by PER who came into the league in 2003 or later, only three of them were the #1 overall pick. 17 of them were from the lottery, though, with only David West and JJ Hickson being drafted in the non-lottery first round, and Paul Millsap from the second round. The first pick is unquestionably better, there’s no doubt about that, but getting a collection of lottery picks can, taken collectively, give a team just as good odds at a superstar. Drafting a star is so prone to random chance that many teams decide to use their assets to trade for one instead. This has worked out really well for Houston with James Harden, and not quite as well for the some more famous teams, but we’ll get to that. The opportunities to trade for or sign legitimate stars don’t happen often, and when they do, they inevitably result in year-long media assaults that make me want to follow curling or competitive Magic: the Gathering instead. By the nature of the bidding war that teams go through to acquire that player, the acquiring team almost inevitably ends up overpaying, leaving the team with a skeletonized roster ill-equipped to compete alongside that player. In the long run, this is fine and necessary for the franchise to move forward, but it can lead to a lot of doomsday predictions when the “new and improved” team underperforms. The team will probably be saddled with the overpaid castoffs that the star’s former team demanded the acquiring team take with, and the best of the young assets the team got in the previous phase have to get shipped out. At any given time, there are probably fewer than 15 players that I’d consider to be legitimate superstar-quality. It might even be as low as five. This isn’t to disparage the second tier, or to start a meaningless fight over who is or isn’t “elite” a la ESPN screaming head shows, but to caution a team against blowing everything to acquire that most dreaded player: the False Superstar. Some of them are great players, but, as the sports media catchphrase goes, aren’t good enough to be the best player on a championship team. The more sinister ones put up empty numbers. If a team trades their assets and takes on the enormous contract of the false superstar, they might be completely screwed for half a decade. Their assets are all sunk into one big, untradeable contract, and due to sunk costs, they’re resigned to building around their false superstar, leading to early playoff losses or worse. Fans more accustomed to other sports might raise an eyebrow at the importance given to acquiring one single superstar, rather than a solid overall team. What difference does it make if you have one player contributing 20 wins above replacement, or two players contributing ten each? There are a few reasons for this: the easiest is to look at a game of basketball. More than any other sport, an individual player can have a huge impact on every single play. It’s not an exaggeration to say that both team’s gameplans, on both sides of the ball, center around LeBron James every second he’s on the court. Even football quarterbacks can, at most, be the focus of 50% of a team’s attention, unless Peyton Manning takes up free safety at some point. Second, superstar players have an even bigger impact when it comes playoff time. During the regular season, these players might average 36 minutes per game. In the playoffs, it will very often be over 40. LeBron has a career playoff average of 43.1 minutes per game. This is enough of a change to completely exclude the lower parts of a team’s rotation, and the killer second units that propel certain teams through the regular season become less relevant. Lastly and perhaps most importantly: contracts. NBA contracts are capped at a certain amount, according to an unbelievably complex formula that I can neither explain nor comprehend. The gist, though, is that there’s a certain dollar amount that’s a “max contract,” and that’s the most that player can get paid for that time period. Salary cap genius Larry Coon wrote an analysis (behind ESPN’s paywall, unfortunately) of the league’s most underpaid and overpaid players. The two most underpaid players, in terms of absolute difference between salary and value created, are… LeBron James and Kevin Durant. Those are the two best players in the NBA. If a player creates $16m in value per year, and your team pays him $15m per year for this, your team is basically getting screwed. The value in a superstar comes from their surplus value, because all that unspent salary can be spread among the rest of a team’s players. If your highest-paid player is only creating wins at the rate you’re paying them for, that’s a one-way ticket to the middle of the league. Good luck leaving there when you’re paying someone $15m per year. The only way around this is if a team somehow gets stuffed full of Kawhi Leonard and Kenneth Faried clones; ie, players who aren’t stars, but have a star-like gap between their expected and actual salaries. This is impossible, though, because these players are rare (they have to be low draft picks who produce way more than expected), absurdly valuable as trade assets, and their incredible surplus value lasts only as long as their four-year rookie contract. So how does a team avoid a false superstar? A real superstar is either a true two-way monster, like Paul George, Dwight Howard, or LeBron; or they’re so outrageously productive offensively that their defense can be mitigated, like James Harden, Steph Curry, or Kevin Love. A false superstar produces offense, but gives up just as many points on defense. They might also chuck up tons of shots, and expect people to be impressed with their nightly double-double. Do not trade for these players. They will hurt you. As the Knicks have learned since they acquired Carmelo Anthony, getting a star is not the end. The next step is finding where he fits, and getting players that fit around him. For a while, this was looking pretty good: they were playing Carmelo at power forward, where he is excellent offensively and less-bad defensively, next to defensive powerhouse Tyson Chandler and an array of three-point shooters to stretch the floor while Carmelo went to work. Then, they took this extremely solid gameplan and handed it to James Dolan, who used it to wipe his sweaty testicles. It was disgusting, and now they have a roster composed entirely of players who play the same position as Carmelo.  Chandler and shooters are a great fit for a team built around Carmelo, because the former players are all low-usage guys, and Carmelo creates value by taking a ton of more-efficient-than-average shots. In theory, this should lead to those low-usage players all being efficient with the shots they end up taking, and playing great defense to compensate for Carmelo’s laziness on that end. This plan is not limited to New York. The general team makeup of a star scorer, a defensive big, and a roster of shooters is on full display in Indiana, San Antonio, Houston, Golden State, and a few other teams are moving toward it. This has led to the increase in emphasis on three-and-D guys, and they’re getting harder to find. It’s not much of a stretch to see a future where the best of this archetype are getting max contracts from teams with money to spend, if they already have the superstar to build around. Andre Iguodala, the rocket-powered version of that player, might not have been the build-around player the 76ers were looking for, but he’s having a grand old time with the Warriors: leading the league with an absurd true shooting of .715, at the lowest usage% since his rookie year. All that’s left after those stages is title contention. Sign the veterans that other teams bought out, trade your near-useless draft picks for bench depth, and cross your fingers that Michael Carter-Williams doesn’t beat you in the Finals.
Is Masai Ujiri Really That Great?
Everyone should be skeptical of “best executive” awards. This is part of a larger contention that people should be more skeptical in general, but “best executive” awards are a great example. People like to credit the executive with everything that went right in their organization, and blame them for everything that went wrong. The best estimate is that CEO ability has about a .3 correlation with company performance,[1] meaning that the better CEO’s company will outperform a worse-run company about 60% of the time. Luck affects the NBA’s general managers in a big way. If they make a blockbuster trade or have a good season, they’ll look like a genius; if they go years without winning, they’re likely to get fired. It’s an extremely results-oriented, rather than process-oriented, field. If you want to get sad, take a look at the NBA’s past Executive of the Year awards. Bryan Colangelo earned his second EotY honor with the Raptors after the 2006-07 season, when the Raptors won 57% of their regular season games and made the playoffs. Their win percentage after that: .500, .402, .488, .268, .348, .415. Then he gets fired and replaced with Mr. Masai Ujiri, the reigning Executive of the Year. Geoff Petrie had an even worse trajectory. The Kings put him in charge in the mid-90s, and he assembled a fantastic squad in the early 2000s that will be remembered as one of the most fun teams to watch of all time. This got him two EotY awards in three years, the only person to do that until Calangelo did the same a half-decade later. The following year, Petrie’s Kings improved again to 61 wins, winning the West. Their decline started after that, slowly but surely moving from a team that lost game seven of the Western conference finals to the Lakers with prime Shaq and Kobe (in the most bullshit playoff series of all time), to a team that missed the playoffs seven years in a row, including a 17-win season in 2008-09. Not all of this is the fault of the executives, of course. But that’s part of the point: they didn’t have perfect control; they probably made some good decisions that turned out poorly, but on their ascent, they probably made some bad decisions that turned out well. Luck cuts both ways, and any great seasons that seemingly come out of nowhere are going to regress to the mean the next year, whether you’re executive, coach, or player. Why do I bring up all these downer lookbacks on previous EotY winners? Because I wanted to set the stage for talking about someone that I’ve come to think of as a legitimately fantastic executive: Masai Ujiri. I was shocked for him to win the award, not because I didn’t think he was the best… I was shocked that the league agreed with me. This was a year when his team ended up underperforming in the playoffs, and their team didn’t send a single player to the All-Star game. When going back over his previous transactions, I want to be really careful to separate when he made a deal that was just fantastic, and when he did something that simply ended up turning out well. This is a tricky thing, and hindsight can never perfectly reproduce the information people had going into a decision. First, let’s start off with That Big Trade, the one that put Ujiri on the map: the Carmelo Anthony trade.[2] Denver traded away: Carmelo Anthony, Renaldo Balkman, Chauncey Billups, Anthony Carter, Kosta Koufos, Shelden Williams, 2015 second-round pick Denver acquired: Wilson Chandler, Raymond Felton, Danilo Gallinari, Timofey Mozgov, 2012 and 2013 second-round picks, 2014 first-round pick, cash The Knicks certainly got the best player in the deal, but it shows the price a team has to pay to get that: three above-average starting players, two of whom were in their early 20s at the time, along with a project big man and an upgrade in second-round picks. Billups was an extremely effective player at the time, but he was aging and earning $13m in that year, and eventually got amnestied. Since it happened, this trade has been held up as the model for trading off one’s star player: clearing roster room and salary, dumping your biggest contract, acquiring several starting-quality young players, and picking up an extra pick in the process. It was thought of as a near-miracle at the time for Denver, and hindsight has made it look even better: Gallinari is coming off his best year ever, and Chandler, though hobbled by injuries, produced much better on a per-minute basis than he ever had before. Raymond Felton was turned into Andre Miller, Jordan Hamilton and a second-round pick in a deal that did more for the lob pass than any trade aside from the Chris Paul one. Kosta Koufos is a noteworthy player here, and I suspect Ujiri just got lucky with this one. He was the only player from Minnesota that Denver acquired, and at the time, he was thought of as being a pretty bad end-of-bench guy. If he was any good, Minnesota would have thought more of sending away a seven-foot center making just over $1m a year on his rookie contract. At the time, he had played just over 1000 career NBA minutes, and had already been a throw-in on a trade from Utah. His true shooting was under .500 midway through his Minnesota season when he got shipped out. Whether Denver had scouted him and seen something that could be developed and cunningly swiped him, or thought nothing of him and Denver’s player development squad had turned him into the defensive presence he is now… I have no idea. The next trade is the one with the most uncertainty still around it. Denver traded away: Nenê Denver acquired: JaVale McGee Analysis of this one comes down to a few things: how much should a good, young team value getting more young players? If a player has played on a high level for many years, and starts playing worse after injury, are they likely to regress back to their higher level of play, or is this the new norm? And, the almost philosophical question: if a person raised in a bad environment ends up bad, can they change when moved to a better one? The Nuggets had, some months earlier, signed Nenê to a monster five-year, $65m contract… the kind that can ruin a team if he turns into an injured shell of his former self. Nenê wasn’t clearly headed in that direction, but he was missing time for injuries, and wasn’t the hyper-efficient Nenê he had been in years past. So, whether by design when they signed the deal or whether they just thought better of the contract afterward, Denver sent him away for the… um… ‘inconsistent’ JaVale McGee. This is an area where I have to be very careful to divorce my non-statistical reactions to watching him play with the factual realities. For people who haven’t done it, watching McGee play is a great time. He catches lobs. He pulls off some amazing moves. He goes for sky-high blocks, and on some of those attempts, actually connects with the ball. But no matter how good his efficiency, rebounding, and block numbers look (quite good, in fact), the plus/minus data tells the real story here: with very few exceptions, his team plays worse on both ends of the court with JaVale on the floor. Nenê does not have that sort of discrepancy between his personal stats and team stats; he has monstrously improved the Wizards when he’s out there for them. JaVale, somehow, made the Wizards worse. But his talent is so obvious. Can Denver’s excellent staff train him to unlearn all those horrific years in Washington, and play like a reasonable basketball player? Watching him, I keep tricking myself into seeing improvements. Then I look back at the numbers, and they’re basically the same as they were with the Wizards: good personal stats, makes his team worse. So, a playoff team sent away an older, injury-prone veteran, effective but waning, for a younger, highly talented player who makes his team worse (at the moment). This is a tough one. I will reluctantly call it a positive for Denver, but it’s extremely close, and part of it hinges on the possibility of a pump-and-dump: acquiring JaVale, convincing the league he’s way better now, shipping him out for someone who’s actually effective. Mr. Ujiri only made four notable trades while in Denver, and we’ve already covered three. The last of his deals seemed to be, at the time, The Big One: Denver traded away: Arron Afflalo, Al Harrington, 2013 second-round pick, 2014 first-round pick, 2014 second-round pick (clause on this so that Denver will send the worse of their two 2014 second-round picks) Denver acquired: Andre Iguodala When this trade happened, my jaw was on the floor. The Nuggets managed to join in a trade they seemingly had no business being in, and gave up Afflalo (a decent-though-overrated defender and very good shooter with illusions of iso prowess), a first, and somehow dumped the Harrington albatross contract to get Iguodala. How on earth? This one is a difficult in-hindsight trade to evaluate, since Iguodala was a free agent after the season. Making trades based on what a player will decide to do in the future is a bit dicey, and as third-party analysts we’re not entitled to the in-person discussions that players have with their team and agent about where they’d like to go. Iguodala ended up leaving in a sign-and-trade with the Warriors after Ujiri left, and who knows what would have convinced him to stay? If the team had won that series against the Warriors, and the Nuggets had retained Ujiri and Karl… well, maybe the result would have been different. But what Ujiri did was give the Nuggets one of the best wing defensive players in the league, and someone that the transition-based offense put to very good use. With the information we have available, then, I’m going to conclude that this was a great deal, and one any GM would be ecstatic to make, even if it didn’t work out as well as the Nuggets would have liked. Ujiri did other things other than those trades, of course. Drafting is super-important, and he deserves credit for correctly picking Kenneth Faried… sort of. Every mock draft had him going at the 21st spot, to the Portland Trailblazers, which Portland fans will always bring up in discussions of Faried. All Denver did was take the guy that should have gone one slot higher. Also worth noting: many of the basketball analytics-oriented people, including myself, had singled out Faried prior to the draft as someone who was way, way, way better than his projected draft position. Kevin Pelton’s SCHOENE model projected him as being the second-best player in the draft, after Kyrie Irving, and there’s a very good case that’s been how things worked out. Saying he only picked him 22nd because he didn’t go 21st is a cop-out, though, since players fall unexpectedly in every draft. MarShon Brooks was expected to go in the mid-teens and fell ten slots below that, and he’s been a solid bench scorer, but nothing to get excited about. Drafting Faried was, both at the time and in hindsight, a blatantly obvious move, but being obvious doesn’t mean it wasn’t correct. Instead, I’d say that about 20 general managers made a mistake by not listening to the advanced stats people and taking Faried sooner. The jury is still out on the rest of his draft picks, since we’ve barely see them play. Fournier could end up being a steal in the late first, but the sample size is way too low to tell. There’s an important aspect we haven’t addressed though: even if Ujiri is the best GM in the league, how much is that worth? Could he be replaced by some guy off the street earning a fraction of his salary? The notoriously cheap Kroenke family aims to find that out, and so far, the answer is: no, and you’re getting a bad value for even trying. Reportedly, the Raptors persuaded Ujiri with an offer of $15m over five years, and the Nuggets wouldn’t even offer half of that annual salary. Instead, they hired Tim Connelly at what must logically be a far cheaper rate. If he could do the same job, then that’s a great deal. So far, he cannot. He has made two trades so far: shipping Kosta Koufos, who I’ve already laid my praise all over and think of as one of the league’s most underrated players, to the Memphis Grizzlies for the near-worthless Darrell Arthur, an offensively inefficient bench forward who’s way worse offensively after a ruptured Achilles. This results in JaVale McGee as the team’s only real center (Mozgov is awful), a log jam at power forward, and a downgrade in talent whether measured by conventional player rankings (150 vs 201 on ESPN’s rankings) or advanced statistics. His other trade is the sign-and-trade to send Iguodala (and cash) out, and receive the thoroughly mediocre 30 year-old Randy Foye in return. As any angry 70 year-old will note, professional athletes are paid a lot. Even Darrell Arthur makes $3m a year, which just happens to be the salary of Ujiri with the Raptors. All it takes for Ujiri to pay for himself over a bargain-bin $500k GM is to produce more than $2.5m a year in value for his franchise. Connelly, in that single Kosta Koufos transaction, probably cost the team far more in value than that, and that’s not even a trade involving players anyone has heard of. Because of how easy it is to sign a player to a bad contract that will burden a team for years (Amar’e Stoudemire, Andris Biedrins, Ben Gordon, etc), it’s pretty crucial to hire a GM that won’t make mistakes that outright terrible. A single year of paying Emeka Okafor to be mediocre costs about the same as Ujiri’s entire five-year contract, and he’s the highest-paid GM in the league. On the other hand, let’s check in with what Ujiri is doing over at his new Toronto home: Toronto traded away: Andrea Bargnani Toronto acquired: Marcus Camby, Steve Novak, Quentin Richardson, 2014 second-round pick, 2016 first-round pick, 2017 second-round pick When Ujiri went over to Toronto, I was incredibly curious whether he’d be able to duplicate those Denver trades where he seems to get way more value than he should have. And holy god, is this a value-laced trade. Bargnani makes almost $12m in his first Knicks season, had a TS of .482 last year, and (depending on who you listen to) is somewhere between average and a train wreck on defense. That contract is something that, seemingly, Toronto would want to dump at all costs, and they somehow got a first-round pick for him… and one of the best three-point shooters in the game… and a couple second-round picks, I guess just to see if the Knicks would go for literally anything. This trade goes beyond lopsided and into the realm of hilarious. When Ujiri went to Toronto, I was crossing my fingers that Denver was on some next-level statistical analysis, paying attention to the aforementioned research on how luck-based executive performance is. But the A vs B of Connelly’s transactions compared to Ujiri couldn’t be clearer: Ujiri is the game’s best general manager, and teams need to start paying their general managers like the crucial decision-makers they are. Because who’d you rather have: him or Darrell Arthur?
[1] James H Steiger, via Daniel Kahneman’s absolutely essential book Thinking, Fast and Slow. Summaries of CEO performance and related subjects are mostly summaries of Chapter 19 in that book.
[2] I’m using basketball-reference for transaction histories (and everything else), but you can get the same info just about anywhere.