Measuring Tactical Variance by League

tactics  

Manchester City won the 2013-2014 Premier League with a diverse and international (and very expensive) squad.  Of the players who made 20 or more league appearances, a full eight different nationalities were represented (nine if you count their Chilean manager, Manuel Pellegrini).  Only one first choice squad player, goalkeeper Joe Hart, was English.

In many ways Manchester City is representative of what many see as the future of European football, one in which hyper cross-pollination of playing styles and tactics renders our old heuristics (Spain = tiki-taka, Italy = catenaccio , etc.) useless.  In this future world of European football, then, we might expect the distribution of formations/tactics to be fairly consistent across different leagues. Of course that is not the case now, and quite possibly will never be.

 In the complex world of game theory and football formations, sometimes it behooves a manager to stick with an unsuccessful setup for no better reason than it is what everyone else in the league is doing; many people do not like to take risks, especially if their job is on the line.  Conversely, in a league like Serie A where using different formations/tactics from game to game is almost an obsession, an adherence to one formation might be frowned upon.

 It should be stated that while this piece is about “tactical” variance our only measurement tool is “formation” variance.  Formations and tactics are not necessarily the same thing.  For example, a 3-5-2 might in practice more resemble a 5-3-2 and any formation can exist in an attack-minded or defensive form.  However, to the extent we are measuring tactical heterogeneity/homogeneity it seems self-evident that measuring formation variance is probably as good of a proxy as any.  Formation information comes from Opta, whose analysts watch every game for each team they are assigned.  Also noteworthy is this data does not include any in-game changes and is merely how each team lined up at the start of the game.  Information is from the last completed season (’13-’14) and includes only formations used more than 3%.  Formations are listed from left (most used) to right (least used).

formations by league

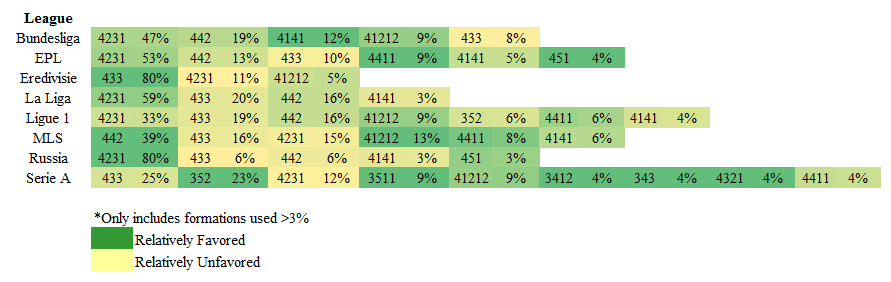
A couple things stand out here:

1. The Eredivisie loves the 433 and Russia loves the 4231, almost to the exclusion of any other formation.

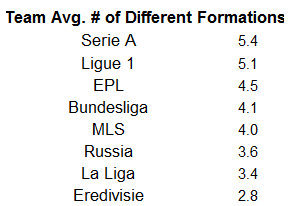
2. Serie A demonstrates a tactical diversity not seen in other leagues (see below).

team avg formations

The “favored” and “unfavored” formations are partially a symptom of the fairly eclectic mix of leagues included in the analysis.  If we just aggregated all the teams from the “Big 4” leagues (Bundesliga, EPL, La Liga, Serie A) this is what the results look like:

Big 4

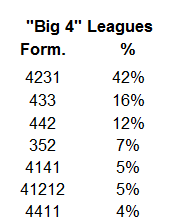
The 4231 is certainly the fancied approach at the moment, but things can change.  For example, MLS has seen a rise in the use of the “diamond” 41212 in 2014. Unfortunately, this analysis does not include any data from previous seasons.  Will the homogeneity in the Dutch approach and heterogeneity in the Italian approach hold in the face football globalization?  It will certainly be worth watching.

Splitting Possession into Offense/Defense

Does Possession % Matter? Any analytically inclined soccer fan (a.k.a. you) is probably well-aware of the limits of possession % as a meaningful metric.  In fact, its faults are so numerous and well documented that the ubiquitous  ironic mentions of “but what about possession?” every time Barcelona loses have (mostly) stopped.  I understand the collective derision, but if we look at the metric in a deeper way can we glean some interesting information?  I think so. One thing that I think does need to be stated is that there is a relationship between possession % and points (at least in the EPL – see graph below). epl poss v points   The causes of this relationship are complex and difficult to disentangle, but probably the best way to think of possession % is as a symptom of playing winning football as opposed to the cause, though of course sometimes it is the cause! Confusing! A must read on this subject is  Devin Pleuler’s  interesting take on possession as a defensive weapon. How is Possession % Calculated? Based on some good work a couple years back by Graham Macaree, we know that the possession % that the majority of media outlets use is really just a pass ratio.  The pass ratio approach is pretty simple: team possession % = team’s total passes / both teams’ total passes. This methodology was confirmed to me by an Opta employee.  We can debate the merits of this approach until we are blue in the face, but for many sensible reasons I think it is probably the best proxy. Splitting Possession % into Offense/Defense Not all pass ratios/possession % are created equal.  For example, let us assume that an average EPL match sees 900 passes on average between the two teams (450 for each team).  On this particular match day Arsenal outpasses Swansea 600-400 (60%/40%).  Across town, West Ham outpasses Crystal Palace 300-200 (60%-40%).  Both Arsenal and West Ham have the same possession % (60%), but they have achieved them in vastly different ways.  By comparing their passing #’s to the league average, we can essentially allocate Arsenal and West Ham’s 20% possession advantage (60%-40%) to an offensive and defensive component, as demonstrated below.  You start by comparing how many passes each team attempted and allowed and compare them to the league average.  Arsenal, in this example, were 150 passes above an average offense (600-450).  West Ham, by contrast, were 150 passes below an average offense (300-450).  But, West Ham makes up this difference by allowing 250 less passes than an average defense (450-200). possession differential example   That was a hypothetical, but what does this approach look like for this year’s EPL? (stats are two weeks old) epl pos diff   Talk about a tale of possession haves/have nots.   The difference between the #1 possession team (Swansea) and the #10 team (Chelsea) is closer than the difference between Chelsea and the #11 team (Newcastle)!  Another thing that jumps out is the comparison between Southampton and Arsenal; both have similar possession #’s, but achieve it in a very different fashion: Arsenal with offense and Southampton with defense.  You also might notice the larger variance in the offensive component compared to the defensive component.  This makes sense, as a team might face a variety of passing styles over the course of the year, but their offensive style is more persistent.  Running some regressions (based on past five years of EPL data – 100 teams) backs this up, as the offensive component has a much stronger correlation with total possession differential than the defensive correlation.  Interestingly, while you would expect a strong relationship (R2  > 0.7) between offensive and defensive components, the R2 was only 0.49, which I think demonstrates that this exercise of decoupling possession into offense/defense has some merit. offense defense rsquared   offense v defense