Author: Ted Knutson
On Burnley and Expected Goals
Expected goals has found itself outside the confines of the analytics community this season, which has brought renewed questions regarding its flaws, foibles and failures. The poster-child for expected goals flaws has been Burnley and their over-performing defence, even finding themselves in the New York Times courtesy of Rory Smith. Smith's article is a fine piece blending comments and insights from the analytics community and Sean Dyche himself. Smith quotes Dyche describing Burnley's game-plan when defending:
The way it is designed is to put a player in a position that it is statistically, visually and from experience, harder to score from.
Several analyses have dug deeper into Burnley's defence last season, including an excellent piece by Mark Thompson for StatsBomb. In his article, Mark used data from Stratagem to describe how Burnley put more men between the shooter and the goal than their peers, which may go some way to explaining their over-performance compared with expected goals.
Further work on the EightyFivePoints blog quantified how the number of intervening defenders affected chance quality. The author found that when comparing an expected goal model with and without information on the number of intervening defenders and a rating for defensive pressure, Burnley saw the largest absolute difference between these models (approximately 4 goals over the season). If there is a quibble with Smith's article it is that it mainly focuses on this season, which was only 12 games old at the time of writing. Much can happen in small samples where variance often reigns, so perhaps expanding the analysis to more seasons would be prudent. The table below summarises Burnley's goals and expected goals conceded over the past three and a bit seasons.
Each season is marked by over-performance, with fewer goals conceded than expected. This ranges from 5 goals last season to a scarcely believable 15 goals during their promotion season in the Championship. The above table and cited articles paint a picture of a team that has developed a game-plan that somewhat flummoxes expected goals and gains Burnley an edge when defending. However, if we dig a little deeper, the story isn't quite as neat as would perhaps be expected. Below are cumulative totals for goals and expected goals as well as the cumulative difference over each season.
In their 2014/15 season, Burnley were actually conceding more goals than expected for the majority of the season until a run of clean sheets at the end of the season saw them out-perform expected goals. After the 12 game mark in their Championship season, they steadily out-performed expected goals, yielding a huge over-performance. This continued into their 2016/17 season in the Premier League over the first 10 games where they conceded only 12 goals compared to an expected 19. However, over the remainder of the season, they slightly under-performed as they conceded 39 goals compared with 36 expected goals.
The above illustrates that Burnley's over-performance in previous Premier League seasons is actually driven by just a handful of games, rather than a systematic edge when examining expected goals. This leaves us needing to put a lot of weight on their Championship season if we're going to believe that Burnley are magical when it comes to expected goals. While the descriptive and predictive qualities of expected goals in the Premier League is well-established, there is less supporting evidence for the Championship. Consequently it may be wise to take their Championship figures with a few grains of salt.
This season and last has seen Burnley get off to hot starts, with what looks like a stone-cold classic example of regression to the mean last season. If we ignore positive variance for a moment, perhaps their opponents got wise to their defensive tactics and adapted last season but then you have to assume that they've either forgotten the lessons learned this season or Dyche has instigated a new and improved game-plan. The cumulative timelines paint a different picture to the season aggregated numbers, which might lead us to conclude that Burnley's tactics don't give them quite the edge that we've been led to believe. In truth we'll never be able to pin down exactly how much is positive variance and how much is driven by their game-plan. However, we can state that given our knowledge of the greater predictive qualities of expected goals when compared to actual goals, we would expect Burnley's goals against column to be closer to their expected rate (1.3 goals per game) than their current rate (0.6 goals per game) over the rest of the season.
Time will tell.
Some Notes on Passing - Another Way Lionel Messi is Completely Ridiculous

We have a model at StatsBomb we call Passing Ability. You've probably seen the percentile numbers in newer radar charts, and if you want more on the detail work, you'll find it here. It was created by the very talented DOCTOR Marek Kwiatkowski. We use this model in place of passing percentages because as I explain in the link, passing percentages actually tell you very little about whether someone is a good passer. We think this is better, and we use it professionally every day.
Anyway, many of you probably already believe Lionel Messi is a great passer. His skill in this area is pretty easy to pick up just from the eye test, and from a stats perspective, if you had to say one area that Messi is quantifiably better than CR7, you'd pick his passing. However, when you plug the info into an expected pass completion model, Messi's passing takes on an entirely new dimension.
Below is a visualisation we produced to help uncover a little more information about each player's passing and how it's graded by the model. The top set of bars is volume of passes per 90 in each expected passing percentage (xP) bucket. So the bucket to the far right are passes the model expects to be completed between 95 and 100 percent of the time. The grey line is the league average volume for players in his position.
The second set of bars details whether they are performing better or worse than the model expects in each bucket.
![]()
Tom Huddlestone is in the 50.9th percentile of all passers in the data set, and as you can see, his completion by bucket ebbs and flows. It's not a perfect model, but in the vast majority of cases it passes the sense test. It thinks Xavi and Toni Kroos and Mesut Ozil and David Silva are awesome and so does everyone else.
Which brings us back to Messi... Messi is awesome in a way almost no one else ever has been or ever will be. The next chart is from Messi's passing output in 2014-15.
![]()
Now what you have to remember about Messi is that he's marked more than any other player. He's subject to more double and triple teams around the box. He's bodied constantly. And his teammates are also often marked more heavily than other players in the model, because teams always collapse the box against Barcelona.
The environment he's completing passes in is tougher than what's faced by almost anyone else.
And the model doesn't KNOW...
So the model is out there thinking, "Yeah, this guy is pretty awesome. And not only is he awesome, but he has an insanely high volume of passes for a forward in almost every difficulty range, which is even more impressive. But I have to treat him like all the other students because I am a lowly event data model and can't tell the pressure he's under for every pass... here you go: 99.89 percentile."
But in reality, the degree of difficulty is closer to whatever the Chinese divers always do to obliterate everyone else at the Olympics, and Messi pulls it off just as easily.
This season has arguably been Barcelona's weakest in terms of available weapons. Suarez has struggled. Dembele is injured. Neymar is gone. So it's very much The Lionel Messi Show, and more so than it's ever been. How has Messi's passing graded out this season?
![]()
Just when you think you have investigated all of the ways Messi is ridiculous, he finds another way to blow your mind.
This Was a Bit of a Xhaka
One of the things that's been weird about Arsenal's start to the season isn't the results - the squad is quite good - but Granit Xhaka's drop off in pass completion. He's still completing 83% of his passes, but that's down from nearly 90% last season. Volume is also up slightly to 80 a game vs 72 in league play last year, and Arsenal are winning, so who cares?
This doesn't have to be a big deal. Xhaka could simply be attempting more difficult passes regularly and his passing percentage would go down. I kind of shrugged my shoulders until I pulled up the info from the passing vis and it was unhappy as well.
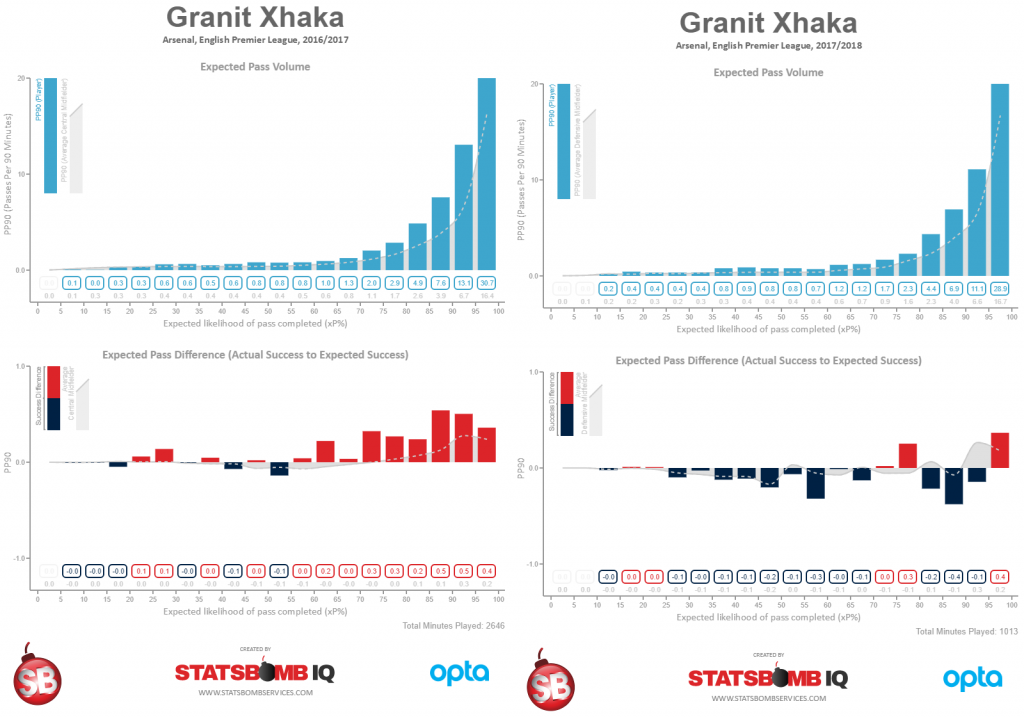
This is probably a blip. It's early in the season, the volume of passes isn't that high, and maybe teams are playing Xhaka differently on the ball. But it's also something to pay attention to going forward, because this year is different than every other Xhaka season I have data on.
As an analyst in the team, I'd take a close look at this and see if I could figure out why this has happened, because maybe there's a tactical element to it we can solve going forward. Or maybe this is a happy trade-off for a style of play that is bringing us more success, and you're fine with it. Sometimes potential problems are simply something you want to know more about before dismissing.
A Note About Imperfections
The passing model does not like Ousmane Dembele. It grades him quite low, despite the fact that he's one of the best creative wide players in football. The vis I've been using in this article was built to help explain why this big ass model that uses 20 million open play passes is unimpressed.
![]()
As you can see above, it thinks Dembele doesn't complete nearly enough of the "easy" passes. However, it also flags the fact that he's pretty good at completing the hard ones, which are exactly the types of passes that create goals for his teammates.
Now there are options available to "fix" this problem. We could skew the weight of the rating to account for high risk/high reward passers to help boost their numbers. Or, we could scrap the model and start over, attempting to account for this problem, but potentially open up other issues in the process. OR, since we've learned a bit about where the holes are in this current model and we like how it performs almost everywhere else, we can just account for this with human judgement layered over the top of the data algorithm.
Using data in sport is always challenging. A bit like being an athlete on the pitch, nothing you ever do will be perfect. You are typically faced with a series of sub-optimal choices, and have to choose the one that is least wrong. There are valid critiques of almost everything we do, but my response these days is often, "I agree with you, but show me something better." This is exactly why you can't let perfection get in the way of progress, because in a sport with the complexity of football, perfection does not exist.
Except maybe in the case of Lionel Messi.
Ted Knutson ted@statsbombservices.com @mixedknuts
Set Pieces and Market Efficiency
At this point, the world transfer market for strikers is fairly efficient. Guys who can get you goals command high fees, are highly paid, and very few good ones get overlooked. They might also get overpaid, but a lot of that has to do with scarcity of elite forwards, and a preponderance of a lot of clubs with a lot of money who need the best. One of the reasons for general efficiency in this area is that the value of forwards is obvious.
- Goals are valuable.
- Lots of goals are very valuable.
- We need to score goals in order to win.
Conclusion: Forwards who score lots of goals are very valuable to us.
It helps that they are also easy to identify.
Why are we talking about forwards and transfers when this piece is about set pieces? Because the market for coaching expertise is laughably inefficient, and better set piece attack and defense comes from coaches.
A couple of weeks ago I was on a panel at the Royal Statistical Society conference in Glasgow when Omar Chaudhuri made exactly this point. “Premier League clubs barely blink at spending £10-20 million on a player, but almost none of them are willing to pay even a few million in compensation for a top coach.”
This is weird when top coaches actually have the most impact of what happens on the pitch of any single person at a football club. Granted, many coaches are average and average coaches seem to have very little impact overall, but coaching impact is a U curve - the good ones and the bad ones cause huge swings in team performance.
Ironically, one of the few managers where I can remember hearing a compensation fee was paid was Alan Pardew’s move from Newcastle to Crystal Palace. Handsome Pards may be many things, but he’s probably one of the last managers you would want to shell out extra money for. Good process, bad result?
It’s even more ironic because there was a strong rumour that Thomas Tuchel was also part of the extensive search that lead to Pardew being hired. He was on sabbatical then after leaving Mainz, would not have required a fee, but is one of the few coaches in the world you’d be happy to pay for. Ouch.
*Looks at where Palace currently are in the table.*
Ouch again.
I wrote two different pieces on hiring coaches last week, so if you want more information about it, please read these.
What You Really Need to Know About Manager Recruitment
The Right Way To Hire Football Coaches
Talking to Clubs About Set Pieces
As you may or may not know, I own StatsBomb, which has a cutting edge analytics platform called StatsBomb IQ, and offers consulting for clubs across a variety of topics including player recruitment, manager hiring, club valuations for potential buyers, and… set pieces.
Why set pieces? Based on research conducted in summer 2014, I discovered that set piece execution was one of the great overlooked edges in football. As a result, I developed a set piece program that played a tiny part in helping FC Midtjylland win their first Superliga crown (FCM scored 3 goals in every 4 games from set pieces alone before clinching the title). After leaving Brentford and Midtjylland, we continued developing the program, and now offer expertise in this area to clubs.
Now this is the type of edge that people usually don’t talk about once they find it. You don’t want clubs keying on what you are doing in this phase of the game, and certainly don’t want anyone else to find it either. However, owning a consulting business that offers this as a product means you need to tell people about it, which is exactly what I did in detail here.
Changing How the World Thinks About Set Pieces
I understand some general scepticism, and at this point I’m pretty used to initial disbelief [Yo, Alvaro], but justifying investment in this area is incredibly easy.
- A single goal in the Premier League is worth about £2M
- Players who can score you goals are very expensive.
- Players who obviously prevent goals are also very expensive. (Top centre backs command fees of 50M and big wages. Manchester City spent about 150M on fullbacks alone this summer.)
Conclusion: Finding additional ways to score and prevent goals has tremendous value.
Now combine that with my point above
- The coaching market is currently very inefficient
Cross it with these...
- Set piece expertise is rare
- Getting better at set pieces in attack directly leads to more goals without a transfer fee or massive player wages
- Getting better at defending set pieces directly leads to fewer goals, again without a transfer fee or massive player wages
And you wind up with: Set pieces are both horribly misunderstood and undervalued.
BUT!
Don’t just take my word for it! There’s a strong case to be made that set piece dominance helped power Chelsea to the title last season.
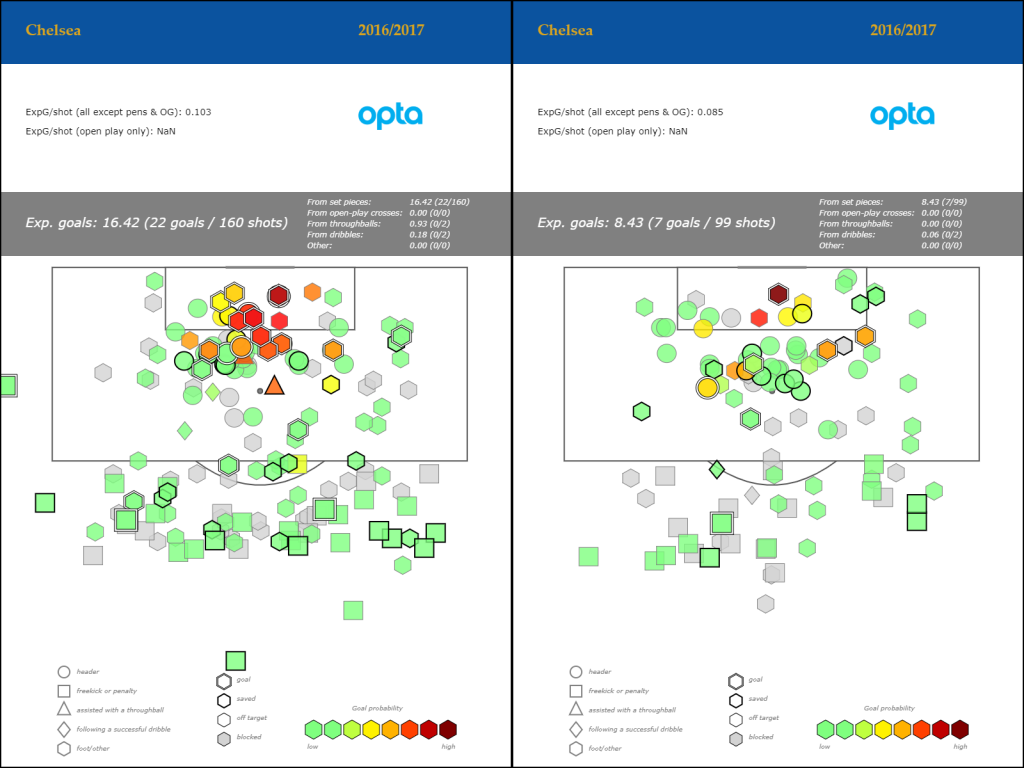
Chelsea were +15 in this phase of the game.

Man City were +2.
They scored nearly identical amounts of goals from open play, but the goal difference in the table between Chelsea and City was +11 in favour of the champions.
There’s also a decent case to be made that set pieces helped save Swansea as well. Swansea were abysmal for years in this phase of the game, but I know for a fact it was a weakness discussed with the owners before the season started. Last season the Swans finished 3rd in the league in set piece goals scored behind only Chelsea and West Brom. That's quite a departure from the 8 they scored in 15-16 and the 4 - yes, FOUR - they scored in 14-15.
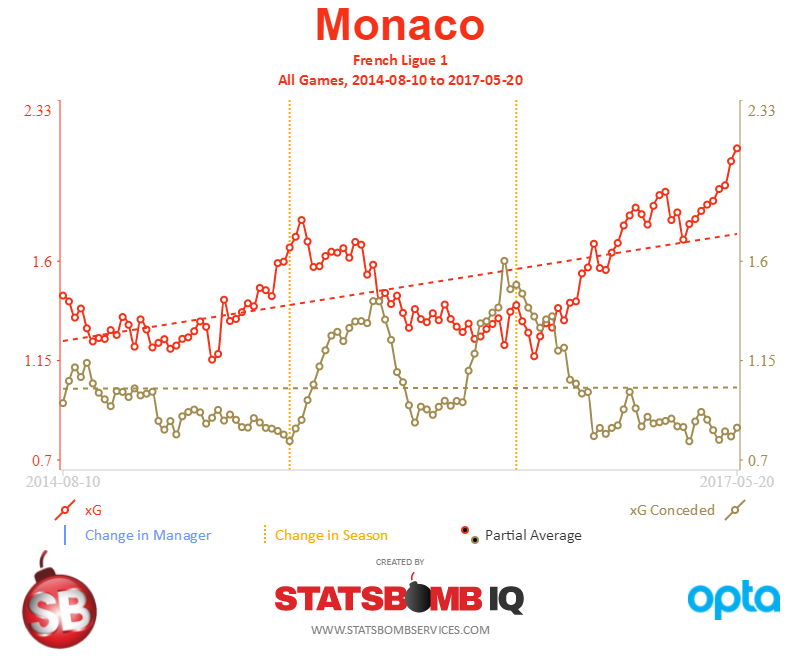
Outside England, Monaco beat PSG to the Ligue 1 title last season on the back of 23 set piece goals (PSG scored 13), and they’ve already scored 8 in 7 games this year, despite selling what felt like half their squad in the summer transfer window.
So the first edge comes from knowing you can move the needle significantly in this area if you start to focus on set pieces and give them training time.
Just so we're clear, this has not been common sense or common knowledge in football. A few years ago the analyst community thought performance in this area was largely random, and it’s still treated as an afterthought at the vast majority of football clubs.
A Story
Last year I was invited to talk to a big club outside of England about using data and competitive edges. The discussion rolled around to set pieces, and I gave a presentation similar to what I linked in my intro piece above, highlighting different areas you can focus on with corners, free kicks, etc At the time I was there, the club was doing terribly on attacking set pieces, so I flagged a few quick things they might want to work on to improve.
One of the easy ones was discussing the use of screens on direct free kicks. Allow me to explain…
For goalkeepers, reaction time equates to distance.
The quicker your reactions are, the further you/your hands/your body can travel in order to make saves. Additionally, the further away a goalkeeper sees a shot, the more time they have to react and move to make a save. We even mix up the jargon here when describing what happened in commentary. “He saw it early, so he was able to make the save.” Early is a word associated with time, but what we really care about with GKs is how far they can travel before to intersect that ball before a shot gets past them.
So yeah, time equals distance. Goalkeepers and quantum mechanics for the win.
With direct free kicks, this is quite a big deal. Walls tend to impair goalkeeper sight at least a little bit, and one of the things I learned from Gianni Vio is that attacking teams can make sightlines absolutely miserable for keepers if they want to.
Why would they want to?
Because the later a goalkeeper picks up the ball in flight, the less distance they can move to make a save, and the bigger the target the free kick taker has in order to score a goal.
Translation: it makes scoring a goal from a free kick a lot easier.
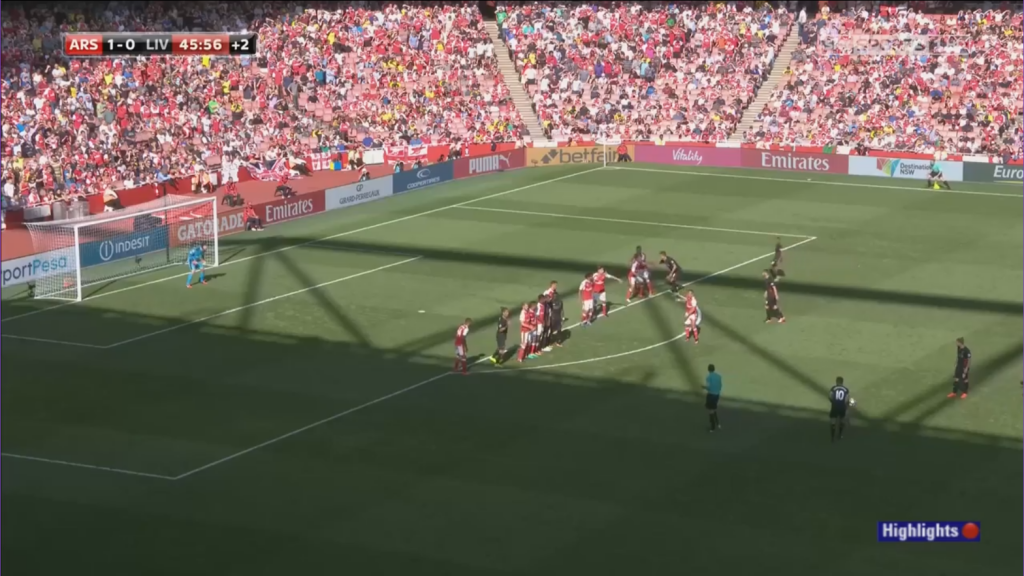
I was reminded of this when watching Liverpool face Leicester this weekend. Coutinho’s goal Saturday might have been unsaveable, but he had a goal against Arsenal last season from a free kick that I broke down at the time in a frustrated email to friends at [redacted].
Notice the two-man Liverpool screen in Arsenal's wall. They are standing there to help obstruct Cech's view of the kick as it's taken. There are actually better things they could do to cause problem, but it's a solid start.
Also note how far out this kick is taken. Cech should have ages to see the ball and make the save, even though he's probably a bit too far over in positioning to the far post.
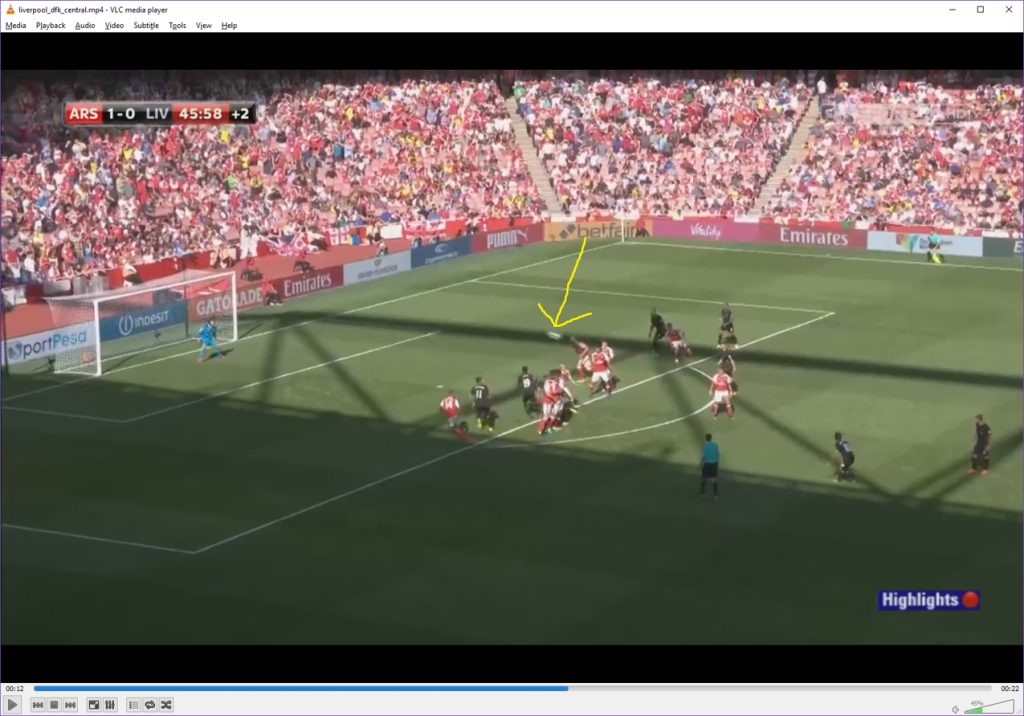
But this is approximately where Cech finally sees the ball. It's hit pretty hard, which creates huge problems (remember, time = distance).
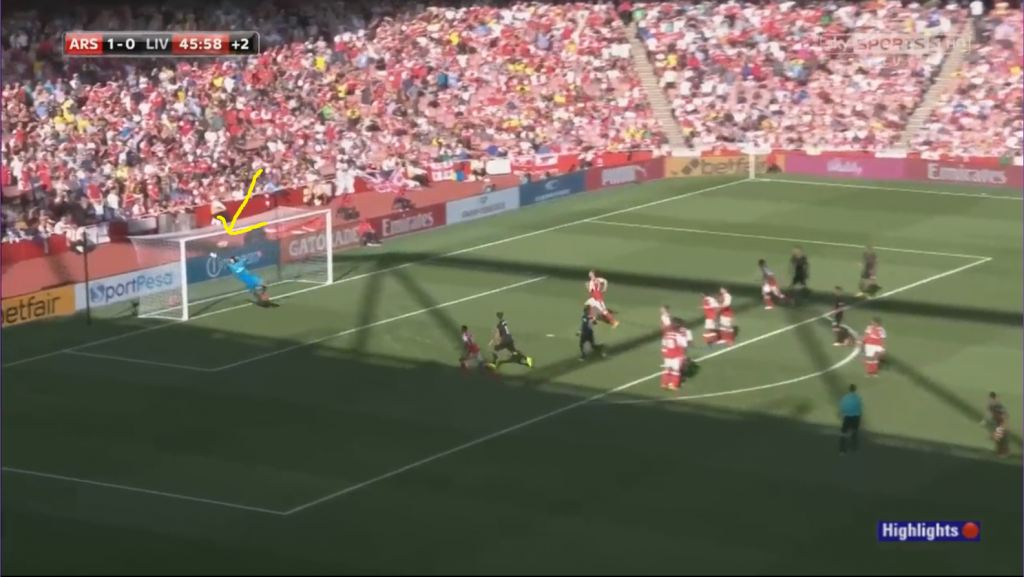
And finally, it's a bit fuzzy, but this is how much Cech missed the ball by. It's a tiny amount.
The reason I bring this up is because of the reaction I got from the coach I was presenting to at the time.
“Well that’s very simple and obvious,” he said.
And he’s right. It’s a gobsmackingly obvious thing to do…
IF YOU KNOW ABOUT IT.
In fact, it's one of the very basic tells Nikos Overheul and I use to see if teams are paying a lot (or even a little) attention to set pieces when we scout them for tactics.
“You’re probably correct,” I agreed. “On the other hand, before travelling here, I watched every direct free kick your team has taken for the last year and your players never screen the keeper.”
*silence*
“I'm with you though, this one is easy to fix once you know about it. Thankfully there are a lot of less obvious things we do to help in this phase of the game as well.”
Sadly, we did not get a chance to help them on set pieces last season.
And despite how obvious my point may have been, I checked their video for this season before writing today - they still don’t screen DFKs in any reasonable way.
For those of you looking to learn a little more about the game, you now have one of our dirty little secrets: always add screens to attacking free kicks.
Wrapping Up
I don’t talk about set pieces much because I don’t want to give away edges to competitors of our clients or ruin the value we offer to future customers. That said, even with more awareness around the value of this phase of the game, most clubs place little or no emphasis on it, despite the fact that it's clearly a cheap way to get extra goals and can both help keep clubs up and win them titles.
We’re currently determining our schedule for the winter break and next spring regarding tutelage for coaches and analysis of set pieces for teams. If you work for a professional club who could use help in this area, please get in touch.
Ted Knutson
@mixedknuts
ted@statsbomb.com
Inferior Tactical Strategies - The World of Brentford
Back in 2014, I pitched a document I called “The Blueprint” to Brentford owner Matthew Benham. In that document were four pillars for style of play that when combined created a superior strategy for how to play football. These were based on significant research and analysis across a vast dataset of winning teams and the tactical traits they possessed. My hope was that The Blueprint would form the basis for a future style of play shared by Brentford and Midtjylland, and help guide successful player and coaching recruitment.
One pillar of tactical style (obviously) involved Expected Goals. In attack, we want to create the largest volume of high xG shots possible. You can do this in various ways, but it boils down to creating shots from as close a range as possible, and mostly from central areas.
In defense, you are faced with a few different choices. You can pick from a couple of varieties of aggressive pressing and attempt to limit shot volume, often at the expense of giving up good shots when opponents do break the press. [Yo, Liverpool.] Or you can concede game control, deep block, and let opponents take mostly bad shots from long range. [Examples: Arsenal. The Fighting Pulises] Or you can pick the Italian/Portugeuse middle block style where you cede the opponent’s half, but blow up everything central in your own half, and try to constrain both volume and quality at the same time. [Conte’s Chelsea, Mourinho’s Manchester United] I have my own preferences with regard to defensive scheme, but whatever you choose, it needs to successfully limit opposing xG somehow.
Brentford are currently in 23rd place in the Championship, with 0 wins from 7 matches so far this season. This comes on the back of 5th, 9th, and 10th place finishes the three seasons prior to now. The narrative is that the Bees’ results have largely been caused by “bad luck”, so I thought it might be interesting to dig a bit deeper and see if that was the case.
The Attack
As I mentioned above, generating high quality shots was something we felt the team should focus on as far back as 2014. The coaching staff were made aware of this, and it was adopted as a core element in Brentford’s style of play moving forward.
What was cool is that this actually seemed to work. Brentford’s open play xG per shot went from around 11% under Warbs in 14-15, and up to 12.2% under Dean Smith last season, which is very good for the Championship. Shots were generally getting closer to goal, and the attack was consistently very good.
Then this season happened. Through 7 matches, Brentford are generating over 18 shots a game in attack. That’s excellent. But…
Average xG per shot? A horrific 6.9%. That’s the second worst figure in the league next to Bolton, who somehow have a 5.5% xG per shot and look doomed already.
And on average distance of shots from open play, Brentford are dead last at 20.4m a shot. Now as noted above, Benham owns two clubs. Here are Brentford and Midtjylland’s shots this season plotted side by side.
(Note: BFC have played 7 matches, FCM have played 8.)
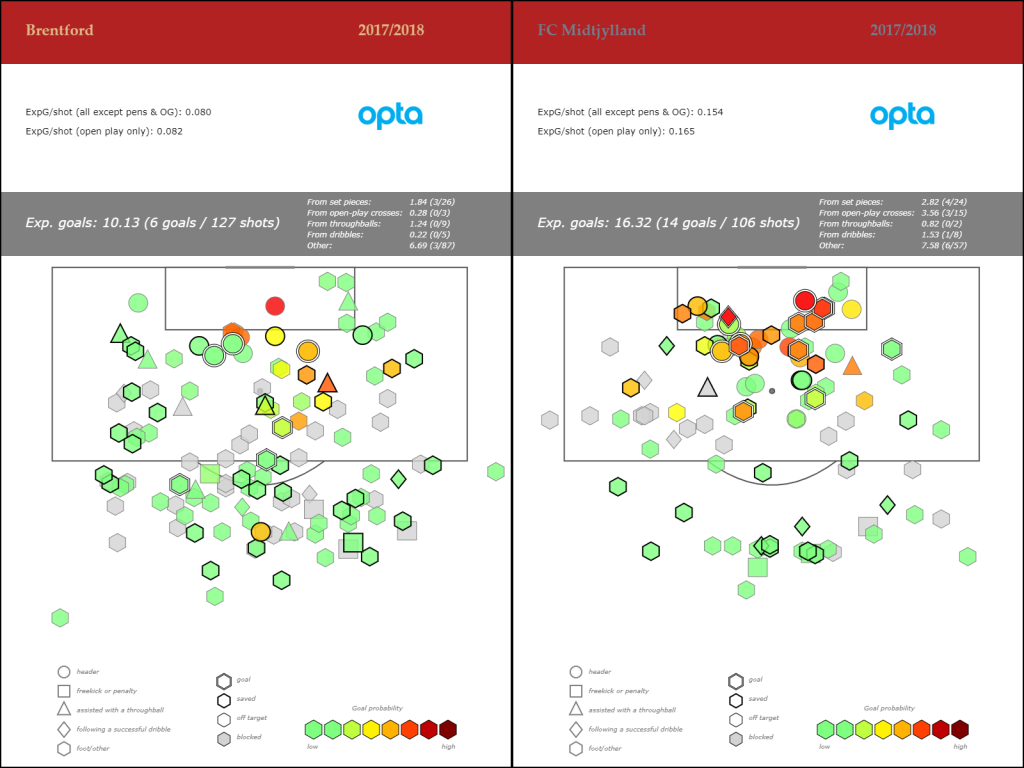
That’s genuinely weird. Midtjylland are churning out amazing quality open play shots. Brentford have tons and tons of shots, but largely from range or wide, while the bulk of Midtjylland's seem to be clustered around and even inside the six yard box.
FCM take fewer shots – only 13.25 compared to Brentford’s 18.14 - but the quality difference is so vast that they could take half the shots BFC do and still post slightly better xG numbers.
[Note: The numbers in the shot map differ from the numbers stated in the text above because each shot that is part of the maps is granular, whereas the stated numbers are part of calculated values that include possession chains. The chain numbers are more correct, but the maps represent unique shot values and not end-result possession values. These are more likely to differ from one another early in the season. ANYWAY…]
The xG distribution charts make the differences even more stark.
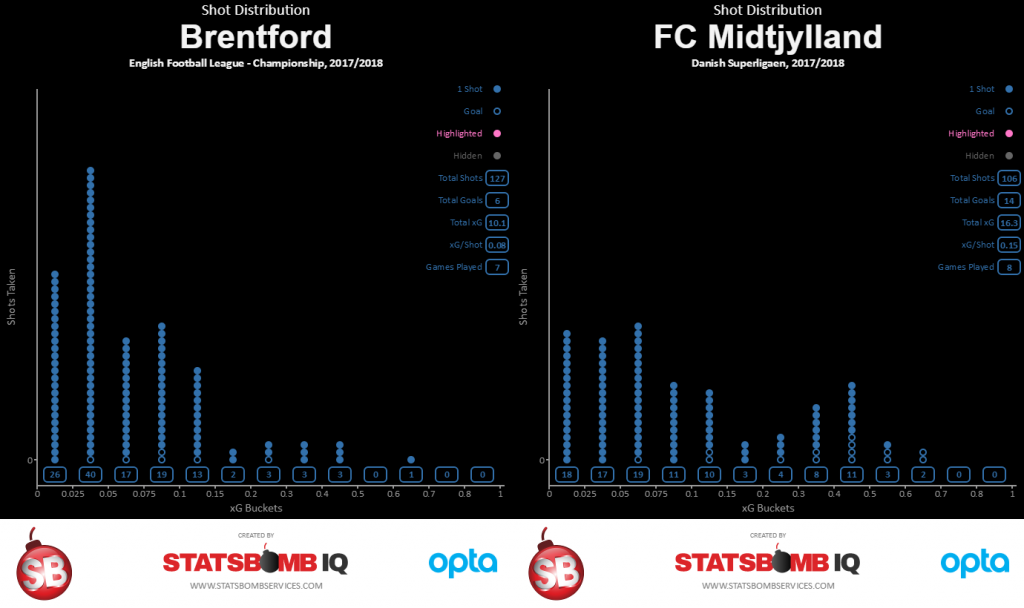
In basketball terms, this usually gets analysed as per possession efficiency. The Bees play a high-tempo, run-and-gun style but end up shooting almost exclusively long-range twos.
The Defense
Outside of Lee Carsley’s brief tenure as head coach, Brentford haven’t been a particularly good defensive team at any point since their promotion to The Championship. This year is by far their best performance at limiting opposition shots, solid 10.9 a game, but the quality on those shots is in the bottom 10% of the data set and tied for 4th worst in the league with fellow strugglers Birmingham.
Now to be fair, Brentford are mid-table in xG conceded, which is solid. In fact, if Brentford were to match Midtjylland’s attacking numbers and keep their own defensive numbers, they’d be candidates for promotion. But despite the presence of Danish coach Thomas Frank on the coaching staff, it doesn’t seem likely that there will be a Voltron-esque merger of Danish attack and English defense any time soon.
The real issue only becomes more apparent when you look at the numbers across both phases of play.
The Variance Problem
- Brentford are currently taking a high volume of low quality shots in attack.
- They are also conceding a moderate volume of high quality shots in defense.
It’s a mathsy concept, but these two combine to form a toxic variance cocktail that makes poor results more likely to occur.
This goes back to a piece Danny Page wrote in 2015 discussing distributions from various quality shots. In the example of Team Coin vs Team Die, two teams create identical xG numbers per game. However, because they differ greatly in quality, they will end up with different point expectations throughout the season. If you had make a choice, you would prefer to create fewer, top quality chances than many low quality chances because the variance in the latter would potentially yield fewer points in the league table throughout a season.
In nerd terms, Brentford are practically rolling a 16-sided die right now when they shoot. Their opponents get to roll a D8. That's not a healthy situation.
This problem is further exacerbated when you realise that most of the error in xG models is going to be at the extremes. If teams are taking a lot of long range chances against packed boxes, then those chances might actually be worse than the model thinks (and the model already thinks Brentford's are bad). Conversely, if they are regularly giving up high quality chances, those chances might also be quite a bit better than the model’s already beefy assessment.
Back to Brentford…
Someone on a Brentford forum recently noted that even at Walsall, Dean Smith was considered a “streaky” manager. That’s certainly been true in his time at Brentford, where his teams have combined prolonged losing and winning streaks each season to eventually land mid-table. However, as shown above… there might be a reason for that.
The best coaches implement tactics that help control for variance. They can’t eliminate it completely – football is a low-scoring, and inherently variable game. However, coaches that focus on the details and prepare their teams to handle them consistently seem to do better in the league table. For whatever reason, this season Brentford have embraced the opposite. They are highly variant on both sides of the ball right now, underperforming a lot in attack, and currently paying the price.
Equally frustrating is despite a high pace and enormous shot volume, Brentford are near the bottom 5% of all teams in xG from set pieces.
In a similar vein to the attacking shot maps above, it’s not as if Brentford don’t know about the value of set pieces. This was another one of the key pillars of playing style in The Blueprint document from 2014 and helped power Midtjylland to their first ever league title in 14-15. Unfortunately, as I’ve explained many times before, having useful knowledge and executing the concepts well are entirely different things, especially when it comes to football.
At the end of the day, execution on and off the pitch is what really matters.
Will Brentford Get Relegated?
Looking at the broader numbers across the league, at this point it seems possible but also highly unlikely the Bees will go back to League One. Unlike Burton and Bolton, who already seem mostly doomed to be flushed from the Championship toilet bowl, Brentford are probably more deserving of a mid-table placement. This doesn’t mean they absolutely won’t be relegated – decent teams have been sent down from the Championship before – but with 39 games left, it’s fairly improbable.
Hopefully the explanation above shows that the Bees aren’t entirely undeserving of the current plight either. Brentford’s outputs in attack and defense right now contain of high degree of variance, and are possibly even worse than most xG models expect them to be. Ironically, they also run counter to all the advice we gave them back when various members of StatsBomb were part of the Benham football project.
Ted Knutson ted@statsbombservices.com @mixedknuts
The Right Way to Hire Football Coaches
Yesterday I discussed what you actually get when you hire a new head coach or manager. Today I want to talk about a better way to go about hiring the most important position in the club.
Manager/Head Coach Searches is one of our core offerings at StatsBomb Services, and the feedback we’ve had from clients has been overwhelmingly positive. Because of how messy and haphazard normal coaching searches tend to be, I thought it would be good to shed some light on our process and why that’s a dramatic improvement over the status quo.
On What Criteria Are New Head Coaches Normally Hired?
- Reputation (They were a big name player. They worked before at a big club.)
- Their teams always managed to beat ours when we play them
- Advice from friendly coaches on who would be good
- Advice from friendly agents
- Past Success
The last one is the only factor that actually matters, but it's usually the product of a lot of confounding factors that can be difficult to separate from managerial impact (budget, luck, players, etc). The rest of these are potential disasters in one form or another that don’t do anything to help find what you actually need at the top of your club.
On What Criteria Should New Head Coaches Be Hired?
- Do they fit our current club needs? (Some managers would be terrible mid-season hires for relegation threatened teams, but great ones if you get them at the start of the year.)
- Does their tactical style match what we want to do as a club?
- Have their teams actually been good?
- Do we have the budget to recruit for them so WE can succeed?
- Does their personality work within our structure?
- Do they speak the language? How do we overcome this for candidates who don’t?
- Can they communicate clearly with players? With management?
- Can they develop younger players?
There are a host of other criteria a club might care about but these are most of the major ones. Notice how reputation has absolutely nothing to do with any of these.
We care about facts. Data. Objective, actionable information that helps you make decisions. The club itself can decide to care about reputation as well, but we feel strongly that it’s only a minor part of the new coach equation.
How Do You Find A New Head Coach?
When we start this process with clients, one of the first things I ask is, “Do you have an ideal club style you want to play?”
Get rid of concrete examples at the beginning because when you are dealing with the entire world as your potential hiring market, it doesn’t make sense to initially limit yourself. Start with the concept… what would you LIKE to do? What is your academy producing? Why? Should it be aligned with the first team style, or should you keep it more generic in case something changes down the road? How does that change what you are looking for in a head coach now and in the future?
Once you flesh out the conceptual ideal, then you can start the practical discussions.
- Do you have the squad to play this style currently?
- If not, will you recruit players that can execute it in the next window?
- Do you need a bridge coach between what you have currently and where you would like to end up?
- What does your salary budget look like?
Once you’ve fleshed out what the club wants/needs/is actually looking for, then you start the multi-layered search process.
The first layer data analysis. We have a number of models we use to evaluate manager and team performance over time and compare that to expectation based on budget and squad strength. We can also accurately profile tactical styles to find better candidates that meet club requirements who may be off the beaten path.
Another layer is the usual avenues that potential names come in, via friendly coaches, DoFs, agents, whatever. We’re not discounting these as viable, interesting recommendations – we’re simply applying more scrutiny to them than they might normally get.
Then you throw everyone into a hopper and start to evaluate how closely each name fits the job requirements, quickly coming to a long list of potential decent candidates, and then to a short list of highly qualified individuals.
Why Do You Need Data?
There are a couple of key reasons why we feel the use of data produces a dramatically better process. The first one is that by increasing the supply of potential candidates, you are likely to find more qualified coaches that meet club needs and potentially find cheaper candidates as well.
The second key reason is probably more important though, and only becomes apparent after you’ve conducted a few job searches:
People. Just. Lie.
It’s a natural part of the human condition, and one particularly present during job interviews, head coach or otherwise. If you want the job, you are likely to embellish your qualifications or knowledge on a subject the employer feels is important, even if you don’t have any.
The only way to really combat this problem is to use data. Remember, coaches don’t generally change tactical styles. Therefore, if that style has not been present previously, it is unlikely to magically appear in the future without significant supplemental learning. In general, if a coach hasn’t already proven they can execute what the club wants on the pitch historically, then they probably should not be part of the interview process.
The other thing that happens in interviews is that candidates will agree to execute the team’s required style, but once they have a guaranteed contract, they go back to coaching whatever style is most comfortable for them.
Don’t just take my word for it though… This is another case where the NBA and football overlap in surprising ways. At the Sloan Sports Analytics Conference this year, Daryl Morey of the Houston Rockets and Bob Myers of Golden State were on a panel on negotiation. At one point during the panel, the topic of hiring coaches came up, and Morey pointed out that they had started writing game model + style execution into coach contracts and using it as a trigger for guaranteeing future years. If the coach they hired follows through with the agreement to coach the style the team wants (based on some agreed set of Key Performance Indicators), then everyone would be happy and the contract would continue as normal. However, if the coach was not coaching the required style of play, then the contract would terminate after a single year, thereby limiting the liability on the club side if they have to sack him.
Golden State, who clearly had a superior style of play to most of the league early on, had similar issues with their coach before Steve Kerr (Mark Jackson). This forms a hugely important alignment of analytics, owner fiat, and coaching execution. The personnel on the basketball court are recruited to play the tactical style, which was developed through analytical research. However, if coaches get out there and for whatever reason choose not to coach that style, everything falls apart.
The only way they could protect themselves from coaches saying they would execute the style in interviews and then choosing not to do so was by writing the agreement into the coaches’ contracts. We have seen similar things start to happen with football contracts as well, and expect to see many more of these in the future.
It’s Not Just Data Though…
Unlike in yesterday’s anecdote about the football club who got down to a short list of new head coaches and no one had watched any of their teams play, we view this as a critical final step in the hiring process. You have all this information… now does it withstand scrutiny from actually analysing the matches?
As part of the viewing process, we also analyse at in-game tactical adjustments, substitution patterns, squad rotation, incorporation of young players, and honestly whatever else the customer thinks is important. We then deliver detailed reports on short-list candidates that highlight strengths and weaknesses, and combine both objective and subjective analysis so clubs have as much information as possible to make this very important decision. Hiring new head coaches is fantastically expensive. Average Premier League salary for the head coach alone is probably close to £3M now. Add in compensation costs for their staff, and sacking a new head coach early could cost between £10-15M just in salary, plus whatever additional impact it has in lost performance, transfer investment, and increased relegation probability.
Conclusion
Hiring a new manager or head coach is one of the most important decisions a club makes, and even successful managers tend to last only three years in a job these days before they move on. Misunderstanding the support needed to make new coaches successful is common, and that can have hugely expensive repercussions, not only from a monetary perspective, but also in the transfer market and league table. Because of this, it is absolutely imperative clubs move to a better, more robust process in their hiring practices like the one outlines above.
If you work in a club and want to talk about this more, please get in touch.
Ted Knutson
@mixedknuts
What You REALLY Need to Know About Football Manager Recruitment
Managerial recruitment is possibly the most important thing a football club does on a bi-annual basis. Hiring a poor manager or a bad fit can set off a chain of events that could see a club plummeting through multiple relegations. Hiring a good manager can take an average team and catapult them into title challengers.
However, at the club level managerial hiring is also the activity that might have the single most chaotic, backwards process of anything in football.
Here’s an example a friend of mine relayed to me a couple of years ago:
We got down to the final list of three candidates and something struck me as incredibly, almost impossibly strange…
I looked at the Sporting Director and I asked him, ‘Has anyone actually watched these teams play football?’
*crickets chirping*
No one had. Verifying that what these guys were telling them about their teams and what style they preferred them to play somehow wasn't part of the process.
What’s fascinating is that nowadays you can get video on almost any professional football team in the world. You can even find video down through U18s at a lot of top clubs that’s readily available online. Given the preponderance of potential evidence weighing in either for or against a candidate, not watching their teams actually play football is a baffling choice.
But my point earlier is that recruitment of managers and head coaches is filled with one baffling decision after another. Way more so than modern player recruitment. This is despite the fact that firing a manager and his staff costs millions to tens of millions in compensation costs, and can have serious knock-on effects for the club as a whole.
Because of this, today I want to discuss what teams are getting when they hire a new manager and why that matters.
What do you get when you hire a new manager?
- The Person
This seems obvious, but it’s often overlooked in the same way that footballer’s personalities are overlooked or brushed aside. This is the guy that sets the stage for every discussion you have within your club for the life of their contract. If they are closed off to new ideas, then that will have ripple effects for years. This is especially important to know for clubs that have undertaken a project to become more modern.
It sounds like a cliché, but man management matters. If you have a big squad to cope with things like European competition, you’ll have fringe players that are mostly there as cover in case someone gets injured. Some managers hate having big squads and that can cause huge issues if they aren’t also able to handle squad personalities well.
That said, sometimes a new manager is so good that you are willing to accept possible personality clashes in exchange for better performance. This is exactly the type of thing you really want to know ahead of time. What are the trade-offs we have to make when hiring this person and is it worth it?
Is your new coach a good teacher? A good communicator? A good leader? All of these things matter in general, but they become very important if you have a young squad, your club coaches need to learn their style to train academy players in, or if you have a lot of big personalities in the squad that need managing.
The person you are hiring deals with other people constantly. You really want to know before you hire them how that is likely to impact your club as a whole.
- Their Staff
This one can be strangely overlooked, but the staff that comes with a head coach can be very important in executing their style, and they can also fill certain roles your head coach as an individual might not be very good at (like man management, logistics, etc).
Here’s an example: some clubs allow new managers/head coaches to only bring two staff members with them when they join. The theory is that institutional knowledge inside the club is important and they want to maintain that, so instead of losing knowledge every time they have to change coaches, they limit potential change. This also forces the new coaching staff to communicate more with club staff as a whole, which generally should be seen as a good thing.
The problem here is that every coaching group is different. In some groups, the most important person after the head coach is the guy who does the fitness training. In others, you have explicit roles and subject matter expertise. (Like the head coach, an attacking coach, a defensive coach, a set pieces coach, the GK coach, etc.) Breaking that when you don’t have ready made roleplayers to fill the needs of the tactical style is a problem.
Finally, over the last few years we have heard of certain coaches waging war on their medical staffs. In some cases, having a trusted physio on staff is a hugely important dynamic because it means new managers get more comfort and clarity about player injuries and when they are likely to return to performance. In the high pressure world of football, a second trusted medical opinion for important players absolutely matters.
I generally agree with minimising change at clubs and at providing a good way for new managers to impart their knowledge to long-term club personnel. However, you need to be sensitive about breaking a whole that is greater than the sum of its parts.
- Their Style
This is perhaps the most important, obvious thing you get with football coaches but also the most misunderstood.
The common myth: Football coaches can change/learn new styles.
I covered this last year, explaining that how coaches learn is very different from how most of the population learns, and therefore it is difficult and time-consuming for them to take on new things. Expecting wholesale stylistic change is a near impossibility. Coaches can’t learn almost any of what they need to know about new tactical styles from books, so where is the information and execution coming from? Who is teaching it to them? What training sessions are they using to impart this knowledge to the players?
To be fair, some coaches are far more adaptable than others. Part of the education at Italy’s Coverciano is to learn to adapt your tactics and coaching to different requirements and not to be too married to one style. Italian coaches often seem more pragmatic and adaptable precisely because of how they are educated for their licenses. Most coaches can’t do that and expect any degree of success. On the other hand, plenty of people criticise Italian coaches for being too adaptable and too willing to change – the criticism cuts both ways.
So yeah, the vast majority of coaches are strongly married to whatever style they have displayed in the past and are unlikely to change much after you hire them, no matter how hard you wish it were otherwise.
With a particular style comes a whole host of other things including the most pressing and expensive concern: recruitment.
Tactical styles require players that fit the style. It’s easier if they also understand the style, but you need players with the right skill set for any chance of success.
The recruitment team needs to know the tactical style the coach wants to execute. Then they need to talk to the new manager and pull out specific role requirements for each position on the pitch and compare those needs to current playing staff. Once they do that, you can construct a recruitment plan based on the new requirements compared to squad weaknesses.
There is no generic football style. Different managers require different players. This is what makes changing managers regularly almost catastrophically expensive for clubs, especially if you let those managers also run recruitment.
Some tactical styles require pace and endurance at every position on the pitch. Size is a “nice to have,” but you will take a smaller, faster guy over a bigger one every time. Tony Pulis’s requirements are basically the opposite. Pace matters up front, but everywhere else you need beef.
Jurgen Klopp and Pep Guardiola’s teams both press. But their positional requirements for who they can recruit are almost surprisingly different.
Conclusion: Your recruitment team really needs to understand the style of play of your new manager in order to succeed.
Conclusion 2: If you do not recruit for your new manager’s style, you will fail. Especially if it differs significantly from the style that your team has played in the past.
The Case of Crystal Palace and Frank de Boer
In practical terms, the part about style circles immediately back to Crystal Palace’s situation this summer and the hiring of Frank de Boer.
As a manager, I think de Boer is actually pretty decent. He has proven he can coach a defense over the years, and though his attacking style is often regarded as boring, given the right players he has been successful. Palace hiring FDB was a bit of a risk, but also a decent shout if they wanted to raise the ceiling of the club. De Boer is perhaps not as good as hiring Marco Silva or Roger Schmidt might have been, but those guys went elsewhere, and Schmidt at least would have had even greater recruitment needs to succeed.
What de Boer also brings to the table is a very clear tactical style. His clubs are going to play a variation of Dutch/Ajax press and possess football. To pull this off, you need players who are understand how to execute this style, especially in the center of the pitch. And unlike the German zonal style, individual players probably have higher style-IQ requirements because it’s largely a man-marking system.
Right, so clear tactical style. Very unlikely to adapt it. Data analysis also shows zero indication he’s capable of tactical variation. Because of all this, you need to provide him players that can succeed and PROBABLY quite a bit of time to teach the team his system.
Remember, Pochettino’s first season at Spurs was bad defensively. He needed a year to imprint the learning on the squad and also multiple transfer windows to get players capable of playing the system at a high level.
So to support their new style that comes packaged with their new coach, Palace bought Jairo Riedewald (age 20), and loaned Timothy Fosu-Mensah(19) and Ruben Loftus-Cheek (20). They also added Mamadou Sakho on deadline day.
This is a complete and utter failure to recruit for the stylistic needs of a new manager/head coach. They also brought in Dougie Freedman as Sporting Director this summer, which was nearly as interesting/baffling as their recruitment when it comes to joining up style/head coach/club needs.
This is why clubs need to clearly understand the impact their choices on head coach/manager have on their future. If Palace weren’t going to do a lot of recruitment this summer because they didn’t have the budget, they should have gone a different direction with their coaching hire. Save the money you’re going to have to pay from sacking FDB and his staff in the first half of the season and use it in the next transfer window.
Hiring FDB and not recruiting for him is basically lighting money on fire.
To be fair to Palace, the squad as a whole is decent. There’s just this huge problem in that it doesn’t fit de Boer’s tactical needs at all. This is something every single football club needs to be aware of when making new managerial hires.
Later this week, I’ll discuss an improved process we've developed for coaching hires that delivers a better chance of immediate success and a brighter future.
xG is on TV. Now What?
It's been ten months since I wrote xCommentary, which came out of frustration from hearing my 7-year-old, who is fully addicted to Sunday morning Match of the Day binges, parroting factually wrong commentary.
I don't want to repeat what I said there because I think the piece stands on its own quite well. However, with the announcement that Match of the Day will now be using expected goals as part of the program combined with what is a clear push for Sky to move forward in this area, I did want to cover a bit about how to use these silly numbers in the first place.
The short answer, at least at first is: with caution.
First of all, this move is a good thing.
The fact that broadcasters in the UK are willing to move in this direction is a positive for analytics in the sport. Period. Huge credit to Opta, Sky, and the BBC for making this possible. I'm still quite staggered that it is happening at all, and using and explaining these numbers daily has been my job since 2014.
Yes, there may be rough patches to start, but everything new has those. Yes, there may be quibbles about the precision of the model(s) used, but the remarkable fact here is that a model is going to be used at all. I have barely seen the numbers, but if there is a backlash about general discrepancy, then presumably there will be a push to improve the error of the models.
That's part of the natural process of data science. Yes, expected goals discussion might be best served by having a smart stats guy on air to explain them clearly and concisely, but let's give all of this a chance before we kill it.
Second of all, please be gentle...
Okay, so we've got an expected goals model.
What do the numbers it spits out actually mean?
This is where you have to be really careful in making claims about what single shot xG numbers do and do not convey. The analytics community are all guilty of treating these as defaults, largely because the venue where we usually discuss these things is limited to 140 characters.
That doesn't allow much room for caveats. In reality, every tweet about xG values of single shots or even single games comes with a whole host of legal fine print that no one really cares about except the data scientists.
However... since this is going to be on TV, some caution is advised. An xG value like .40, means that 40% of the time a shot with these qualifiers from this location has been scored.
This means all previous shots are factored into that number, which will include a whole range of very simple chances as well as insanely hard ones. So why do we care about this? Because it doesn't actually say much about this particular shot we are discussing right now. It's more like "in the past, this has happened."
Now the reason we're here at all is because most TV commentators have previously been really bad at estimating historic likelihood. (This is a verifiable claim.)
For some reason they seem to think the modern incarnation of football is a much easier game than when they played, which makes them far too critical of whether any particular chance should have been scored. I don't know why this is, but it's an epidemic across the entirety of European commentary and there isn't a way to change it without some sort of objective information.
This is where xG shines, because it provides an anchor point based on history. All the players in the data set taking these shots are/were professional footballers. It's not like we're comparing the expertise of children against the Sergio Agueros of the world - these are mostly like for like comparisons.
And this is where the commentators get to apply their expertise...
Because as noted above, xG models have very little information about the particulars of any one chance. Commentators, on the other hand, have all the information, including expertise in knowing what it's like to be on the pitch trying to score those goals.
They can then apply their expertise and tell us why a single shot is likely easier or harder than all the other shots from that location. It won't generally turn a 9% chance into a 90% chance (see also: wide angle headers from 10 yards out), but it could easily be double or treble what the model estimates.
I stated in my article last year, I feel like the commentators don't get enough chance to apply their expertise in place of cliche. Adding an underlying xG model gives them exactly that opportunity.
My show pitch
Opta have a lot of data from the entirety of the Premier League at their disposal. It would be brilliant to see someone walk ex-players back through the stats and data from their own careers and discuss it, especially when paired with video highlights. It could also potentially be a huge conversion point for players and coaches on the value data represents to the game.
Example: Alan Shearer is easily one of the best forwards ever to play in the Premier League. This isn't a claim anyone will argue with. However, as good as he was, Shearer probably only scored about one in every five shots he took. 20%. Maybe less. If one of the PL's best ever forwards only scores at that rate, and you prove this info to him with his own stats, maybe it will soften/improve his commentary when evaluating others?
Football has changed.
I've been saying this all summer, but even compared to 12 months ago, I am seeing massive differences in how interested clubs are in adding data analysis into their football process. The fact that media are picking up on this and moving forward is a clear sign that football itself is in transition. Whether certain groups of fans like it or not, the world is progressing from viewing data analysts as "xG Virgins" (as someone recently tweeted at me), into people that work inside of football clubs and have their analysis appear regularly in the mainstream.
My suspicion is that this transition won't be an entirely smooth one, but it is unequivocally positive. It's also going to create an entire new generation of highly educated fans and coaches who view the game itself in a more knowledgeable light.
In the meantime, my only request is please, be gentle.
With feedback, with drawn conclusions, with criticism. With everything.
Ted Knutson
ted@statsbombservices.com
@mixedknuts
Trend-ing Topics. How Basic Data Vis Can Reveal Incredibly Important Football Info
One of the things we’ve been doing with StatsBomb IQ since we started is incorporating almost all the analysis tools that we use on a regular basis for teams and players into a simple, attractive interface.
Want to pull up radars of every player across your entire data set? We can do that.
Want shot maps with active filters for 34+ leagues? Already done.
A guided wizard that helps you choose your own metrics, including xGBuildup and our passing ability score, to find the best players to scout? It’s called IQ Scout and we released that early in the summer.
The new vis set we’re releasing this week is actually one of the simpler ones we’ve done but also one of the more powerful: trend lines. The wow factor here is less about the vis itself, but more about what you can do with them and why they are incredibly important.
Why Do I Care? 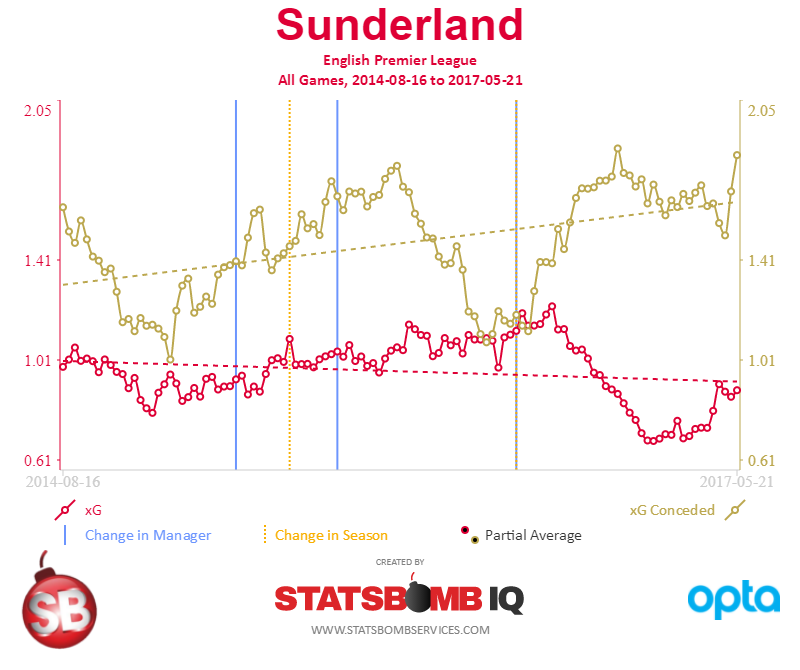 What you see above is Sunderland’s 3-year trend, with 15-game rolling averages. xG in attack is red and xG conceded is in gold.
Why expected goals (or xG)? Because xG Difference is one of the stronger metrics in the public sphere for predicting future performance. There are plenty of other potential metrics to plot, and we will be incorporating them gradually, but at the team level xGD is something we really care about.
Plotting attack and defense here also gives you an idea of how the team is doing in each aspect of the game.
Now if you manage or own a football club, you want this information. You need this information. This information is one of the clearest indicators of how your club is performing currently and the long-term trending of team output. If I were Ellis Short (or Chief Football Officer Simon Wilson) looking at my team trends, I breathe a huge sigh of relief that Sam Allardyce finally managed to stabilise the team after years of teetering on the brink of relegation.
Then Allardyce goes to England and they need to find a new manager. On the surface, Moyes is a perfectly sensible hire. He speaks the language, knows the league, and did a great job at Everton.
Then you watch the trending and concern sets in. By mid-October, I would be worried that there is a problem. By late November, it’s clear that all the good work that Allardyce had done has been unwound. Our results haven’t been “unlucky” – we deserve to be at or near the bottom of the table. I am almost certainly looking for a new manager because it’s now clear that, if we perform like we have the rest of the season, we’re strongly likely to get relegated.
Sunderland were interesting because of the massive change in team performance compared to every other manager they had previously, but think about bad teams that had lucky starts in recent years that were clearly relegation candidates in the numbers. Paul Lambert’s horrible extension at Aston Villa comes to mind, as does the initial start of Hull under Mike Phelan. Making change early to avoid disaster, or reviewing objective data before extending a coach on a "lucky" run can save teams tens of millions of pounds.
Single game results can certainly be lucky. Long-term trends make real performance of the team much more obvious.
Meeting Team Goals
Obviously you care about this type of thing to make sure you aren’t getting relegated from the Premier League, but what about teams with clear aspirations, like clubs that have been recently relegated and are looking at automatic promotion?
Now we know that in order to try and guarantee promotion from the Championship, teams need to average a .75 xGD or better over the course of a season. Teams can and do go up with less, but if you are a yo-yo club that wants to make certain you go right back up, this is the goal you are aiming for.
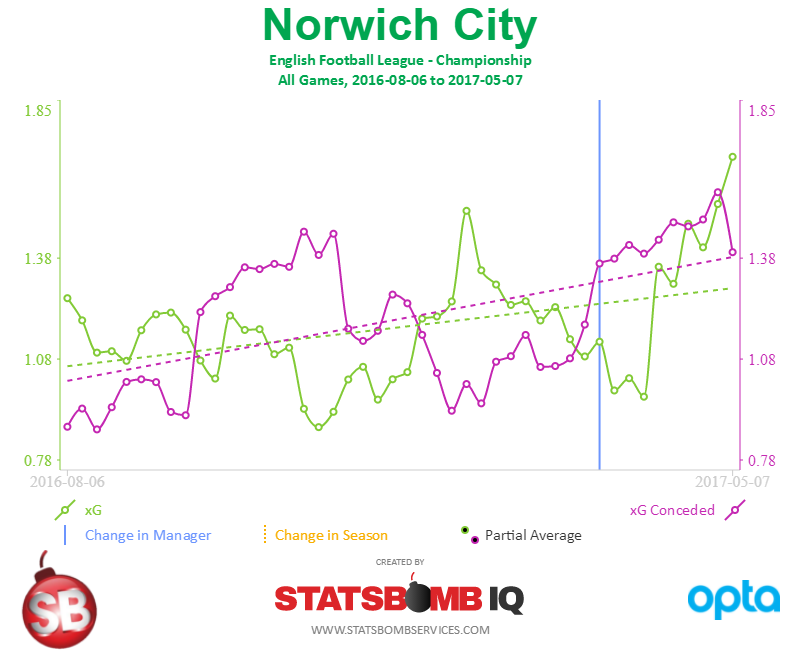
This is Norwich City last season, on a 10-game rolling average. It’s clear at the ten-game mark that the performance isn’t really meeting the goals for the season and suddenly automatic promotion might be a long shot. That doesn’t mean you have to change head coach at that point, but you certainly want to take a closer look to figure out what the problems are and how to fix it. Though fairly basic, this type of information is crucial in running a football club.
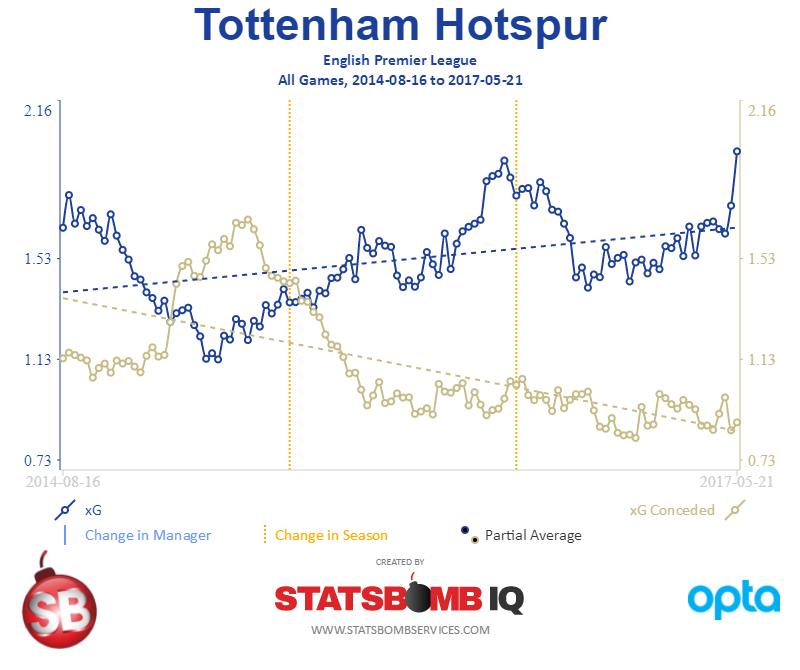
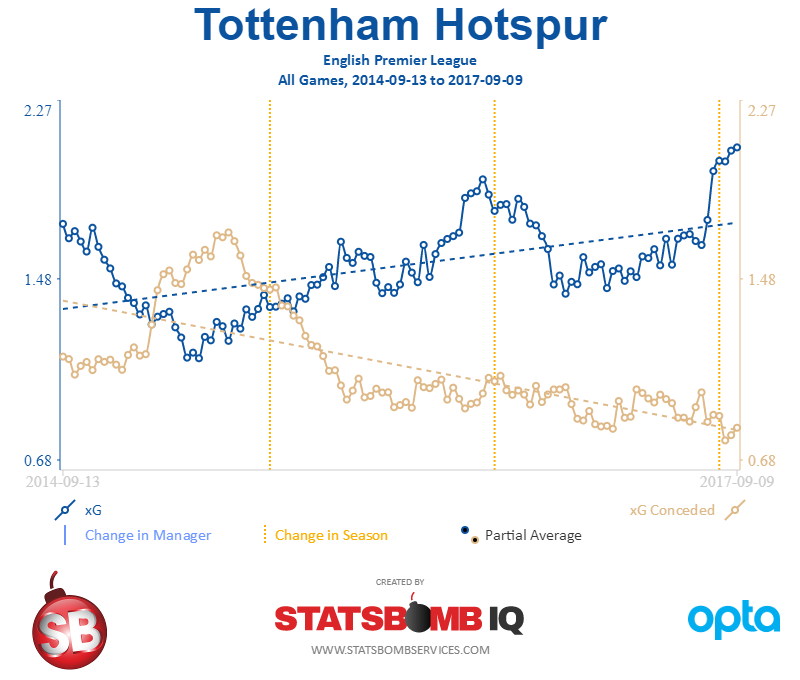
Tottenham
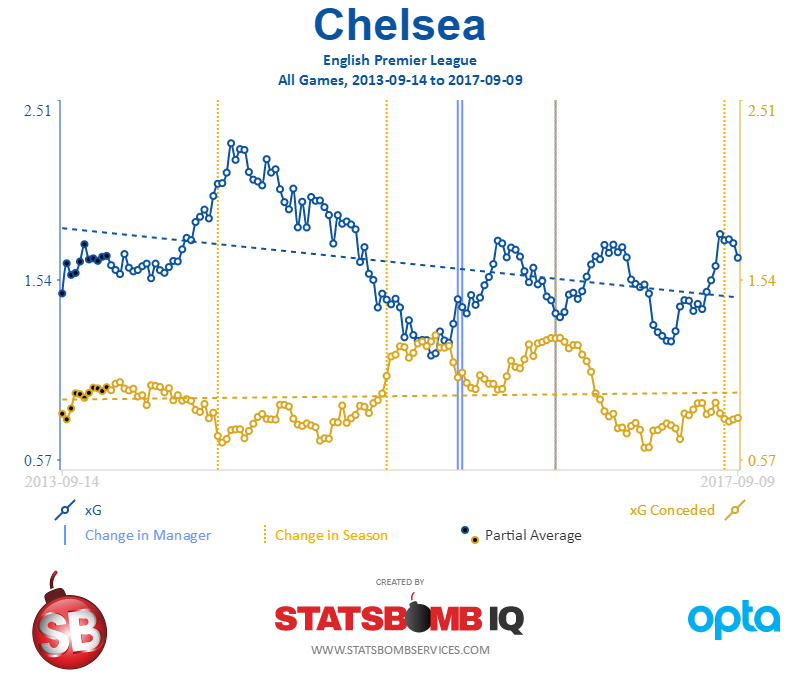
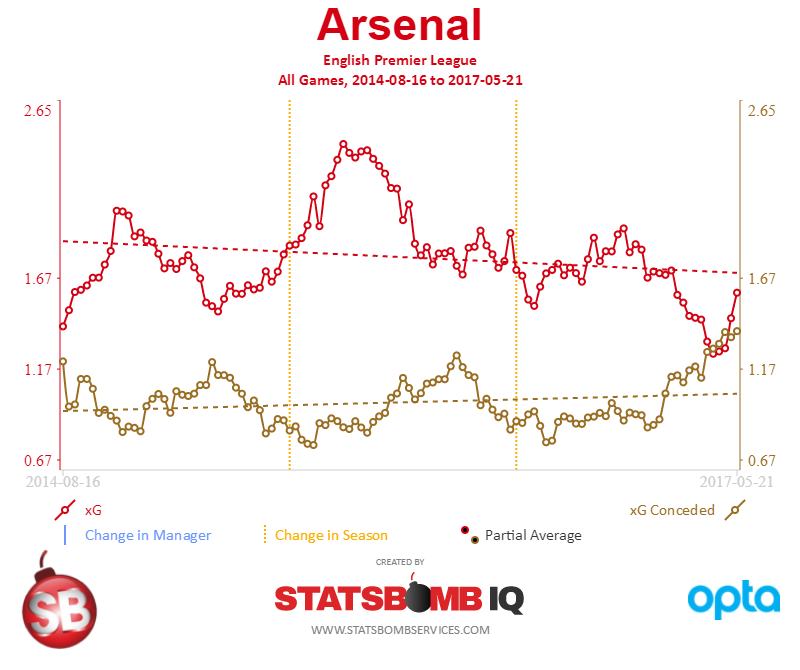
What you see above is a 36-month plot of expected goals in attack (blue) and conceded (gold) with a 15-game rolling average to smooth everything out.
What’s interesting with Spurs is that this plot shows a) how rough that first season under Pochettino was – they were actually negative for a while in xGD, and the press was shambolic – and also how good they have been since. Poch’s teams seem to have a tendency to outperform normal xG metrics as it is, but even with that caveat, the trending is quite clear here.
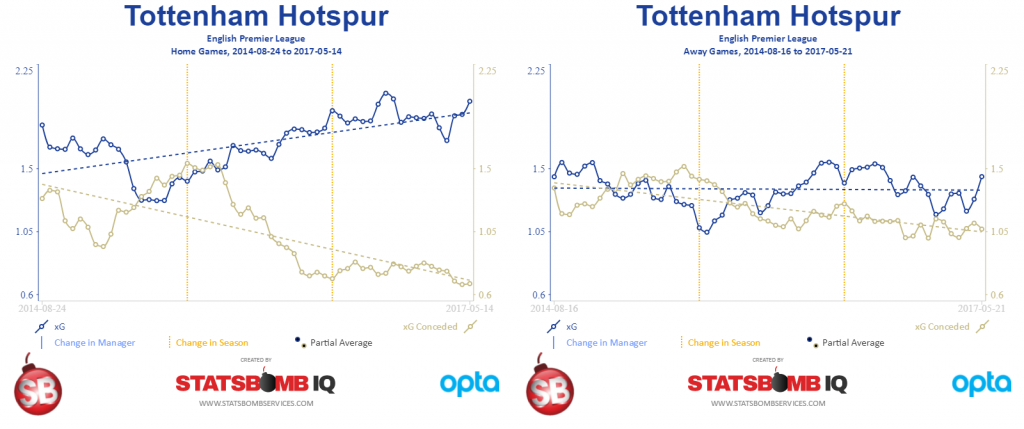
Want to see just home or away performances? We’ve added easy filters for that as well.
Arsenal
There are so many interesting storylines around Arsenal in the last year, it’s almost hard to know where to start.
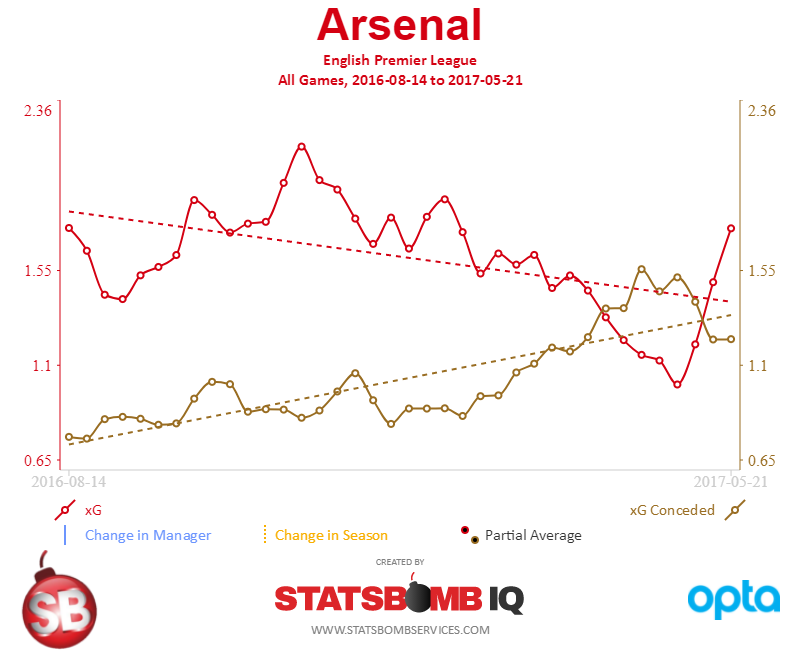
Here’s the one-year plot with 10-game rolling averages. Note the point where xG conceded actually ends up above xG in attack. In most big clubs, that’s a strong indicator that manager change is coming, but Arsenal is Arsenal and Wenger is back for another two seasons. I’m not saying he doesn’t deserve to stay – I’m just pointing out what happens almost everywhere else.
That particular dip in the trend is also interesting because it doesn’t exist in the previous 36 months and it coincides with the early part of the switch to a back 3. From an xG perspective, Arsenal’s April and early May was one of the worst in the data set. They were absolutely clubbed by Spurs and Palace, Boro lost but 55% of the time they win that one, and then Leicester and Man United were virtual standstills. The trend shot upward from late season trouncings of Sunderland, Stoke, and Everton, but despite a lot of spending recently, Arsenal look far from the ranks of an elite team.
Non-xG Trends
There are plenty of stats in football you might want to track, but the vis below shows one I think certain head coaches care about deeply.
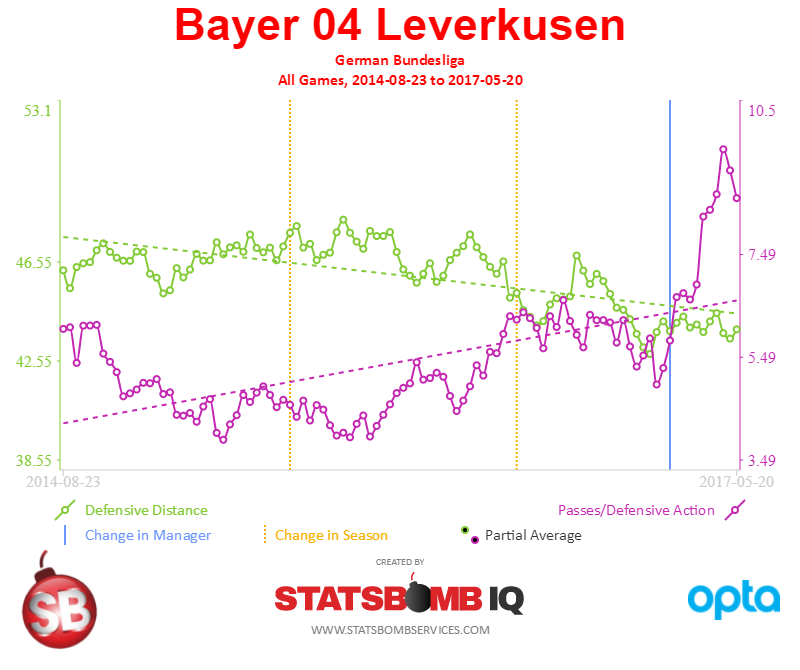
The green line here is Defensive Distance, the purple one is Passes Per Defensive Action or PPDA. Both of these combine to make a fairly robust look at team pressing, which for some coaches is the lifeblood of both their attack and defense.
This is Bayer Leverkusen's output over the last three seasons, most of which was under Roger Schmidt. It's interesting to contrast the output of the first two seasons where they finished in Champions League places, and the final season where results went south and Schmidt eventually left.
At a coaching level, this provides a very clear data indicator of what is or is not working to use alongside your own eyes, which in turn probably helps dictate the agenda for what to work on in training. This is pure game model analysis. Data informed coaching is a useful next step in football tactics, and trend lines help in surfacing problems quickly. [Vis Note: Yes, there are two different Y-axes here. For good reason. Deal with it, Luke Bornn.]
Conclusion Trend lines aren't groundbreaking visualizations, but they are one of the most useful, powerful ways of displaying recent team performance across a wide array of metrics. If you run a football club and don't have access to this sort of information at your fingertips, you are missing an important piece of information on which to base decisions.
--Ted Knutson ted@statsbombservices.com @mixedknuts
[Credit note: Nat James, who did the early mockups for radars, did the programming and most of the design work on the trend lines vis. They will be available to StatsBomb IQ customers starting tomorrow.]
A Quick Lesson on Forward Stats featuring Zlatan Ibrahimovic

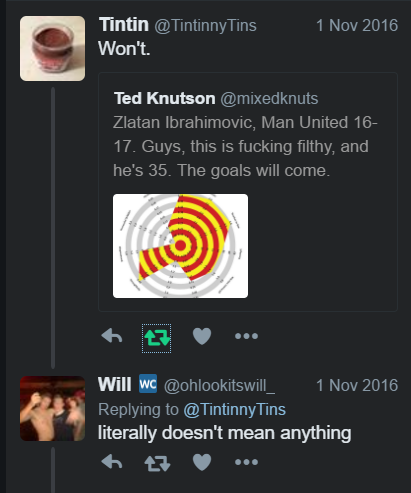
At one point in the 16-17 season, I posted a radar featuring Zlatan Ibrahimovic's xG stats and basically exclaimed that his output so far was exceptional and that goals would come.
This was... controversial. And as with almost anything that's controversial on Twitter, I took a bit of a battering.
We've recently added date filters for radars to the StatsBombIQ platform, and Zlatan's Manchester United season is a fantastic case study for a boring old stats concept called "reversion to the mean."
Applying the concept to Zlatan, despite the fact that he scored few goals for United in the first three months of the season, I was predicting that his future output would revert toward the mean expected output, and he'd start scoring a lot of goals.
The first image below is his actual output vs predicted output from the start of the season until November 1st.
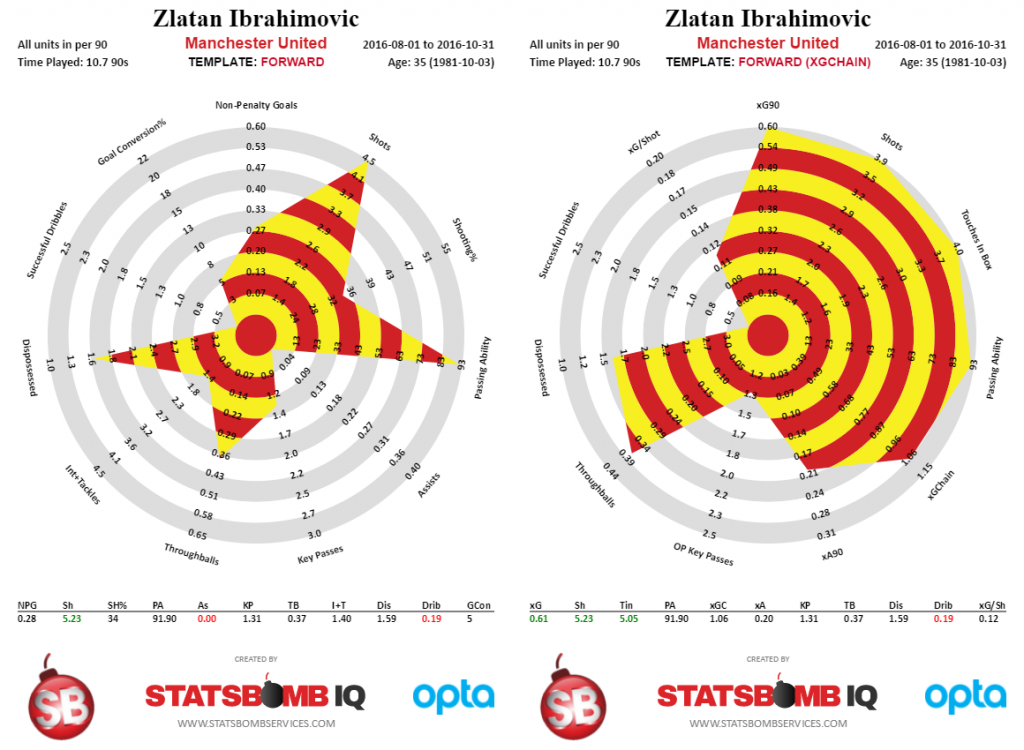
The formats here are slightly different, but from a stats perspective, my contention was that his scoring output was going to move toward to his expected goals (xG) and expected assists (xA) at some point in the future.
Here is Zlatan's production from November 1st onward, the left side representing real world output, and the right side containing the xG info.
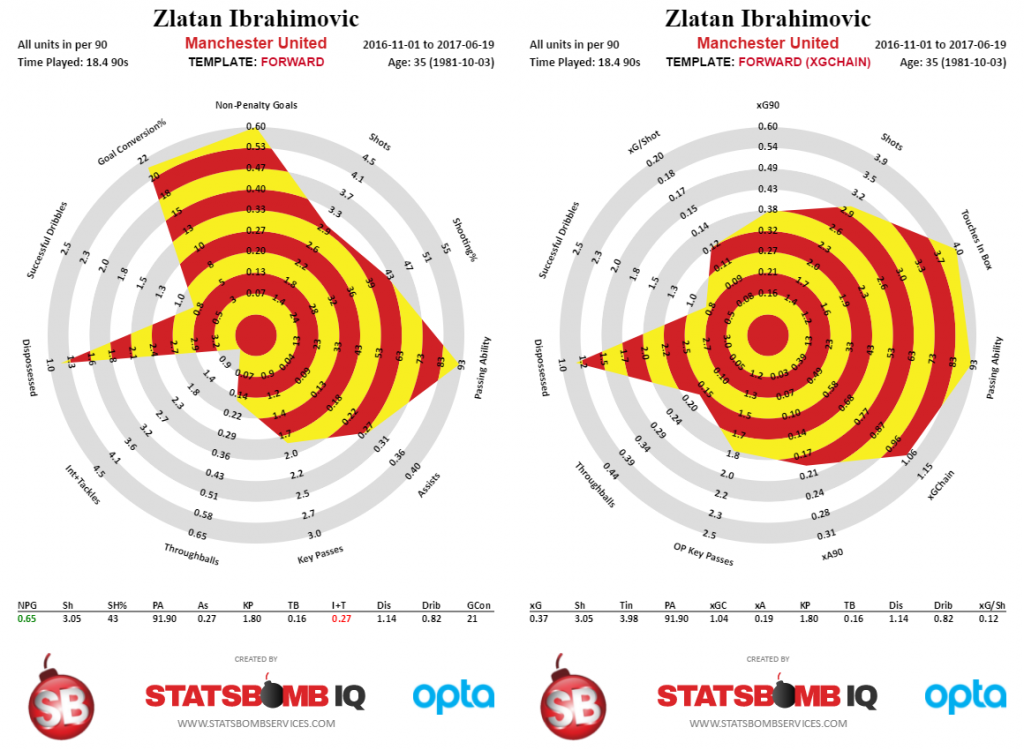
So from November onward, Zlatan actually outperformed his xG numbers by scoring more goals than expected. As my colleague DOCTOR Kwiatkowski might say, "Welcome to the world of averages and variance!"
The final Zlatan radars below are his output for the full season, which was unfortunately cut short by a brutal cruciate ligament tear.
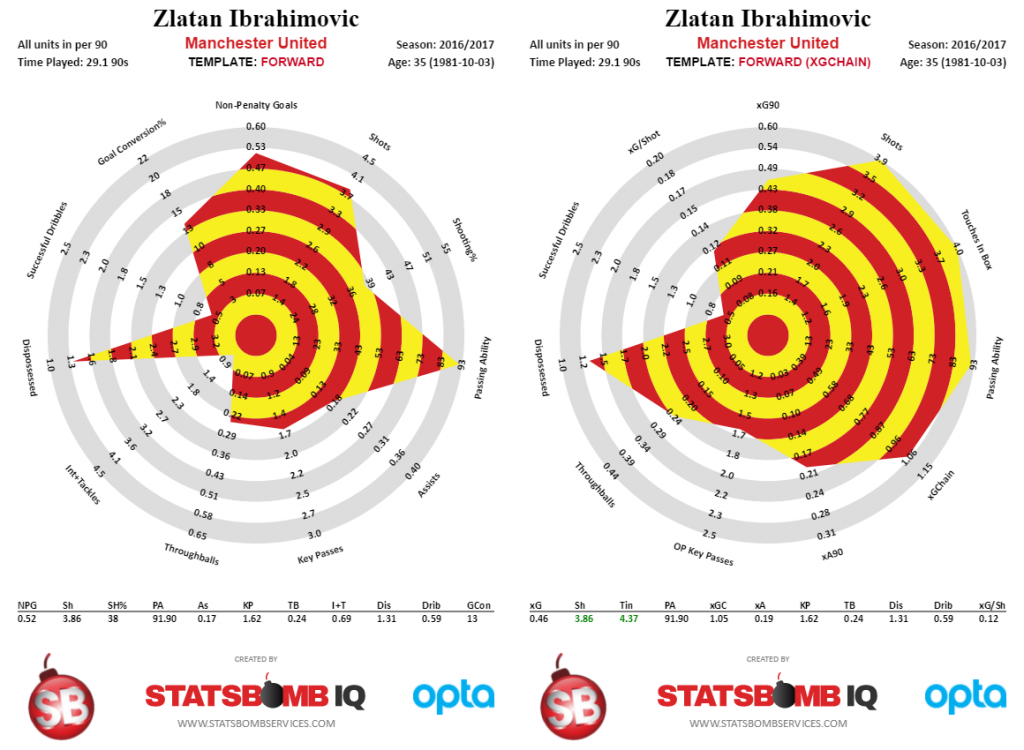
And BEHOLD, actual production and expected production ended up being very similar to each other, which was what I was suggesting would happen in the first place.
Now this happens in football all the time. A hot scoring streak that isn't backed by high xG numbers should not be expected to continue indefinitely. On the flip side, players with strong output like Zlatan above might be very good candidates for a discount transfer move, assuming you can't find obvious flaws in their game.
We actually had a situation like this happen at Brentford with regard to Alan Judge. Coming into the 15-16 season, our group really liked him. He had a great defensive work rate, some very good assist numbers, and he was pretty good with the ball.
On the other hand, by midseason, he was viewed as Brentford's only really good player. The reason for this can be seen in his shot maps.
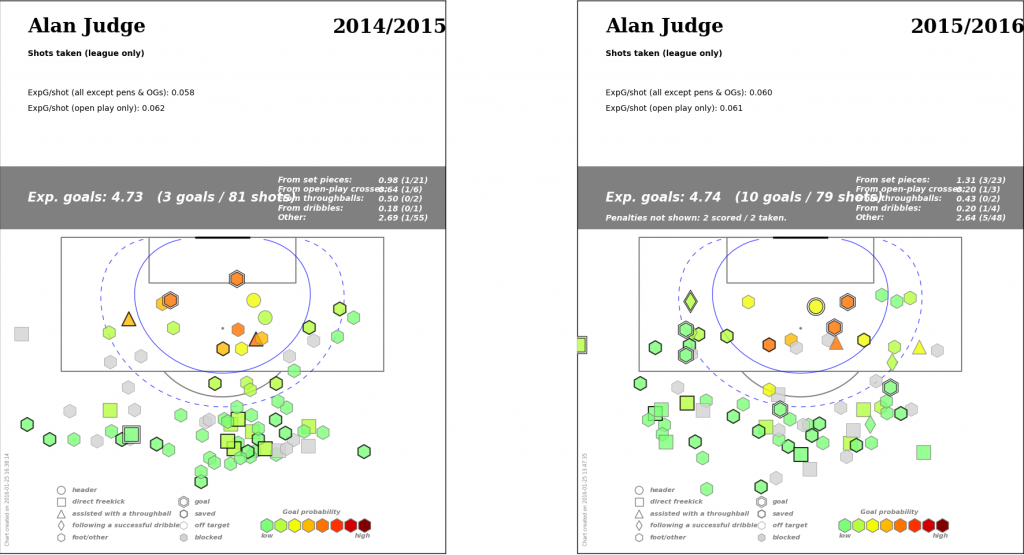
In an amazing piece of serendipity, the point that I pulled Judge's shots for a shot location presentation I was giving was within two shots of his previous year's output. One of the things I wanted to talk about was yes, Judge was playing very well, but don't expect that level of output to continue. There was also a subtext there of, if he didn't want to sign an extension and good offers came in, maybe we should consider selling him.
The cool part about the Judge shot maps is they cut through a lot of the usual arguments you get into about player over/under performance. This was in a player
- in the same team
- in the same league
- with mostly similar teammates
- only one year older
- With IDENTICAL SHOT QUALITY from similar locations overall
And yet one season he scored three goals and the next he scored 10 + 2 penalties, which was completely changing how everyone thought about the player, including our own club personnel.
Unfortunately, shortly after I gave the presentation, Judge suffered a horrible leg break and hasn't played since, so the concern about a reversion was replaced with an entirely different set of concerns.
In practical terms, reversion to the mean combined with not all shots being equal is exactly why we moved from using actual output to analyse players and started to use expected output. Both of the examples above are practical use cases that happen thousands of times across football every year, and when used correctly, stats help you see likely future performance far more clearly than you ever would via traditional methods.
Ted Knutson
@mixedknuts
ted@statsbombservices.com
Passing Percentages Are Mostly Useless - Quantifying Passing Ability
Revisiting Radars

As you may have seen, Luke Bornn set Twitter on fire yesterday (to the tune of nearly 500 RTs) re-posting something that Sam Ventura mentioned previously on why radar charts are bad.
A reminder, blatantly plagiarized from @stat_sam, of why radar plots are misleading. Eye focuses on area, not length. pic.twitter.com/Dk3gcn1GD1
— Luke Bornn (@LukeBornn) May 17, 2017
Obviously, a lot of eyes turned toward me, since it is probably my fault they exist at all in soccer/football, and possibly my fault they have crept into other sports. Daryl Morey then managed to do a drive-by on my career so far, posting this tweet
@LukeBornn @stat_sam No analytics person worth his salt uses radar plots or pie charts or 2 Y axis. Probably more if I think on it. All super misleading.
— Daryl Morey (@dmorey) May 17, 2017
Which I don’t think was calling my entire analytics career into question, but could be interpreted as such. THANKS DARYL. I am pleased to note that at least I don't use pie charts or 2 Y axes. Anyway, none of this is personal to me and please don’t assume I took it as such. I do have incredible respect for Luke, Daryl, and Sam though, so I thought this topic was actually worth revisiting. In addition to hot takes, that thread under Luke’s tweet generated a lot of great discussion.
The fact that lots of people have reactions to this type of work is a good thing, not a bad one. Anyway… many smart, analytically savvy people hate radars mostly for the reasons explained in that thread.
They can be misleading. Ordering of variables matters. There are more precise, accurate ways to convey the data.
The thing is, I knew all of this before I started down this road.
My stuff used to just feature tables of numbers. Then I spent the better part of six months doing a deep dive into data vis before I ever spat out a silly radar. And yet, some might say despite my education, I still did it.
Why?
It's obviously the result of a choice, not of ignorance. Before I’m tried and hanged for data visualization crimes against humanity, I’d at least like a chance to mount my defence. Often when someone allegedly smart (that’s me) continues to do something somewhat controversial in the face of some serious criticism, there are things we can learn.
Learn to Communicate
I have been to a lot of analytics conferences at this point, and the biggest point of emphasis on the sports side is always communication is key. You need to understand your audience (usually coaches, sometimes executives), and take steps to deliver your analysis in a form and language that they can accept. Rephrase that a bit, and you end up with:
Audience. Dictates. Delivery.
In order to succeed, you need to take account of the audience you are pitching to and give them something they can understand. Even better, give them something they want to understand. (It helps if it's pretty.) In soccer/football circa 2014, the fanbase had no real statistical knowledge. The media was just glomming on to the idea that maybe stripping out penalties from goalscoring stats made sense, assists might be vaguely interesting, and the concept of rate stats wasn't completely insane.
I’m not being glib here, this was how it was.
“xG” (or Expected Goals) was seriously weird and controversial and people seemed to think, presumably via the result of someone else's misguided analysis, that possession had something to do with the probable final score. In situations like this, visuals go a long way toward opening the conversation. If you show a table of numbers to a coach who isn’t already on board, you’re dead.
Bar charts?
Only mostly dead.
Radars?
Interesting... Tell me more.
The same was true of the general public. Radars grabbed people in a way almost nothing else did. I think part of that is related to the fact that various soccer/football video games had used spider charts for a long time already, so they were somewhat familiar. Math = bad. Familiar = less scary = good.
Right, we have a vis style that grabs attention - can I fix the flaws?
Rewinding, when faced with a cool visualisation framework that would allow us to talk about player stats in an accessible way – something ALMOST NO ONE WAS DOING IN SOCCER at the time – I set about seeing if I could correct radars for some flaws. Major flaws with radars:
- Order of variables matters
- Area vs length issue means potential misinterpretation
- Axes represent different independent scales
So what did I do?
- Added the 95th/5th percentile cutoffs to normalize for population. Suddenly axes weren’t really on independent scales, even if it seemed like they were
- Broke the stats we care about for different positions into their own templates
- Clustered similar element stats together. Shooting over here. Passing over here. Defensive over here, etc.
One thing I was also clear about up front was that I wanted to include actual output numbers, not just percentiles. This was another choice about audience impact. Sports quants mostly care about percentiles. Normal fans barely cared at all about numbers, so percentiles would be even more abstract.
Plus no one had ever done percentile work for most of the stats in football.
What is a high number of dribbles per game? No one knows. Putting percentile info made even less sense then, because we were just starting to have conversations about basic stats. Going back to my youth collecting baseball cards, I wanted people to be able to talk and argue about Messi vs Ronaldo from a stats perspective, and the only way to make that happen was to have some actual numbers on the vis. I don’t even know if this was successful, but it was a design impetus that was constantly in my head.
Impact vs Accuracy
Most of the people ranting about radar charts on Twitter yesterday are pretty hardcore quants. To many of them, sacrificing precision for anything is strictly verboten. The problem with this perspective for me was: radars aren’t for you. Hell, radars aren’t even for me. I work in the database, and my conclusions are largely drawn from that perspective.
The minor inaccuracy issues of radars don’t affect my work.
BUT I wanted to talk to a resistant public about soccer stats, and this enabled discussion. I needed to talk to coaches about skill sets and recruitment, and this was a vital way of bringing statistics into that discussion while comparing potential recruits to their own players.
As I designed them, radars exist to help you open the door with statistical novices, and from that perspective they have been wildly successful. Even in 2017, football/soccer doesn't have the volume of knowledgeable fans that basketball and baseball have in the U.S. We also don't have coaches who are comfortable with almost any statistical discourse, although that is definitely changing in the last year.
Actual, practical feedback
So a funny thing happened on the way to the boardroom: In football, radars became accepted as a default visualization type. I’ve visited a number of clubs who just incorporated the work as part of a basic suite of soccer vis, only occasionally to my chagrin.
“My coaches love these. They want us to do physical stats in this form because they feel like they are easy to understand.” “This is cool. I like the way the shapes become recognizable as you use them more, and clearly indicate different types of player.”
At Brentford, we took two non-stats guys, taught them the basics of interpretation, and churned through over 1000 potential recruits in a year. Football isn’t like American sports. Players can come from a ridiculous number of vectors, and radars were the best, most easily understandable unit of analysis I could find.
Combine no money, huge squad needs, and limited recruitment personnel, and the only way we could hope to succeed was via efficiency and volume. They were not the end of the analysis. In fact, for recruits we liked, they only comprised a tiny portion of the evaluation cycle. From a volume perspective though, radars were the most used form of evaluation in the process.
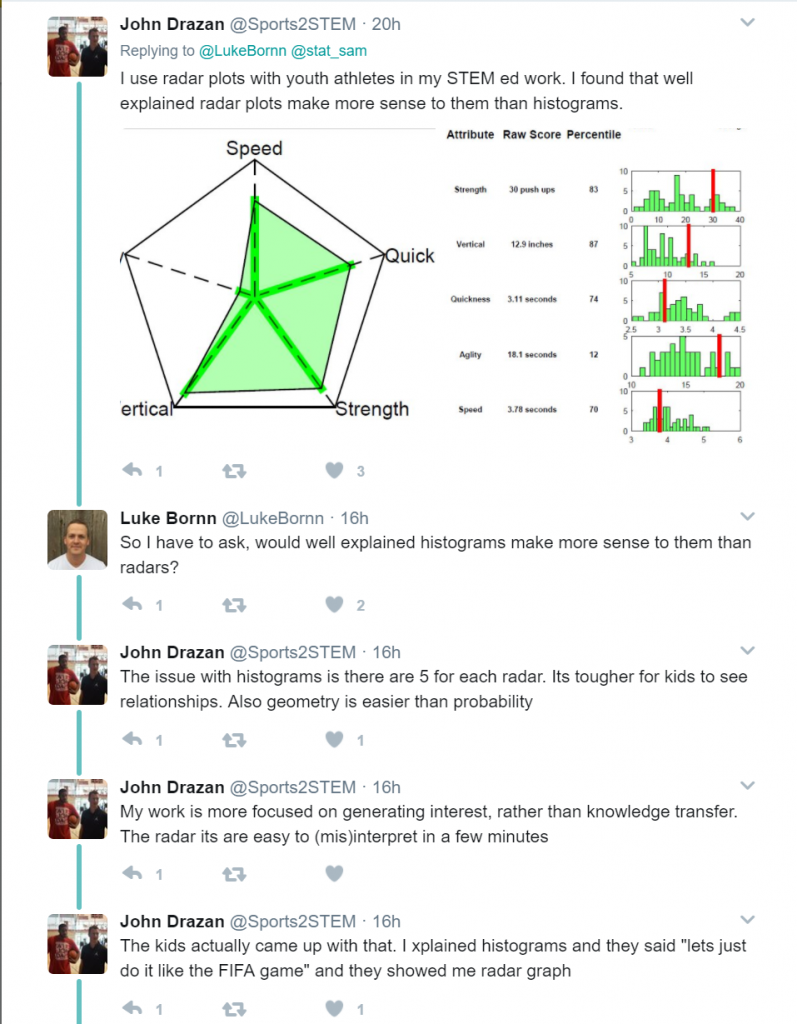
On StatsBomb IQ, our analytics platform, even non-recruitment people seem to be taking a deep dive in a way they never have before. One person researched nearly 1000 players and teams over the course of the first two weeks, just because they liked learning about the game and the stats in this way.
In my own opinion, having researched many alternatives, I feel like radars are the fastest way to get a handle on what skill set a player may or may not have, and include some basic statistical context.
You can’t prevent misuse of statistics
This tweet from Luke yesterday made me laugh
@stat_sam In case people think this is well-known, last month I met a pro soccer team using radar plot area as a global metric to value players...
— Luke Bornn (@LukeBornn) May 17, 2017
Two words: competitive advantage. If you’re going to take the research for free and apply it while failing to understand how to actually use it, you deserve what you get. I’m 98% certain this club never talked to me, or else I would have forcefully steered them away from that type of analysis. And the problem is, you can’t prevent people from doing bad analysis on any type of stats.
Single numbers?
Mostly useless.
Thinking the wrong stats are important?
Happens all the time, even from smart, highly educated individuals. Bad interpretations of basic visualizations? Check newspapers almost every day. Bad/useless visualization? So many, it’s a surprise we don’t all walk around with our eyes bleeding.
Look, everyone makes mistakes in their jobs.
We try to be objective, but everyone in stats and analytics also makes mistakes. Daryl Morey drafted Joey Dorsey, even though understanding age curves and competition cohorts is a pretty basic concept. Soccer stats once thought possession% was important. Pep Guardiola apparently thought he could win a Premier League with a bunch of fullbacks over 30. I said nice things about Luke Bornn.
It happens to the best of us.
The fact of the matter is, unless you are there talking to the users every day, you can’t prevent people from taking your work and potentially using it poorly. It doesn’t matter if that work is in tables or numbers, or bar charts, or radars, or fans, or code, or in a shot map, or whatever. The interpretation, application, and execution of analysis will remain more important than simply having the information from now until the end of time.
What next?
The bashing of radars is almost a yearly event at this point, and like I said at the start, I concede that there are flaws in the vis style that even my adjustments haven’t completely overcome. With that in mind – and despite the fact that customers actually seem very happy with our current style of vis – we will probably add an alternate form of player data vis to StatsBomb IQ by the end of the year.
I’m not sure exactly what it will be, but as football clubs move from novice to intermediate to advanced statistical analysis, precision will become more important and I want us to stay ahead of that curve. In the meantime, I hope my defense of radars above has at least explained why I made this horrible, unforgiveable visualisation choice in 2014 and continued to stick with it over the years. Communication and opening doors to talk about stats in football with coaches, analysts, and owners remains the most important hurdle we have to overcome.
Radars start a conversation.
They get a reaction.
And for whatever reason, football people are often more comfortable talking about and digesting them than almost any other vis type I have encountered.
Maybe that will change in the future. Until then radars remain a pretty damned good visualisation for displaying most of the different elements in player skill sets*, which is the most important conversation topic we have in player recruitment.
Ted Knutson
@mixedknuts
*In my opinion at least, and provided you correct for their flaws and educate your users.