Match Simulation: Score Effects and Beyond

During the short time that I've been involved in football analytics I've learned a few things about match prediction, or more specifically win percentage prediction, which is very interesting from a betting perspective because it allows you to directly compare your own predictions to the bookies’ odds and see if there's value in a specific bet.

As I see it odds prediction consists of two major parts: predicting the relative strength of the two teams involved in a match, and estimating the likelihood of a certain outcome given this relative strength. This article is about the second part. It’s common knowledge that given an ‘expected goals’ value for one team in a match, you can calculate the probability of that team scoring a specific number of goals quite easily by using a Poisson or binomial distribution, which can then be turned into win percentages. This actually gives remarkably good results, but it’s not perfect.

It can’t be. It’s ‘only’ simple mathematics so it assumes that the probability of a goal being scored during the time frame of a match is fixed and independent of other events. We know that this isn't the case in reality. For example there’s something called ‘score effects’. The ‘game state’ (in this case the goal difference) influences the probability of scoring, and obviously the probability of scoring eventually influences the game state.

Measuring Effects

After analyzing data from the last four full Premier League seasons I've identified some more of these effects and by putting them together you can see a sort of ‘system’ taking shape that explains/models how a match progresses and that can be used to simulate a match and figure out the chance of a certain outcome.

To do this I've divided each of the 1520 matches into 10 sections and measured team performance (ExpG) during each section, comparing different initial game states (in the broadest sense, not just the score).

Here’s the theory: assuming a random team at a random time and a random game state, all we know is a theoretical average scoring probability. For any extra ‘information’ (about the team, the game state, etc.) we can measure the effect that is has in terms how much it causes the probability to deviate from this theoretical average.

The probability of scoring is influenced by these (independent!*) effects:

  • Initial, pre-match expected goals (how good the team is on paper, including home advantage etc.). On average this causes a 43% deviation.
  • Time (it’s well known that the amount of goals significantly increases as the match goes on). Average deviation: 14.5%
  • Response to goal difference (score effects): 8.5%
  • Red card state (being a man up or down): 2.5%

This might seem counter-intuitive in the sense that a red card obviously has a much bigger effect on scoring probability, but the chance of the situation occurring in the first place is also taken into account here, and a team being a man short happens less than 10% of the time. Similarly a goal difference other than 0 only happens about half the time, while the factor ‘time’ itself is always at play.

A note on score effects: I've noticed that score effects are much more pronounced in games where the teams are evenly matched. If a team is really dominant (on paper) they seem to stick to their plan and continue to create a similar amount of chances even when ahead.

It’s also interesting that the total amount of goals scored has no clear effect on the future probability of scoring. Something can seem like an ‘open game’, but that’s mostly in retrospect, as it has little predictive value. Finally you can take this one step further because the probability of a red card occurring isn't fixed either. It’s heavily influenced by:

  • Time. Most red cards occur late in the game: 52%
  • Goal difference: the chance of receiving a red card somehow increases by about 50% when a team is trailing by one goal. On average this causes a 14.4% deviation.

At this point I’m really stretching my data though, and as sample size is becoming a problem that’s as much detail as I’m daring to go into.

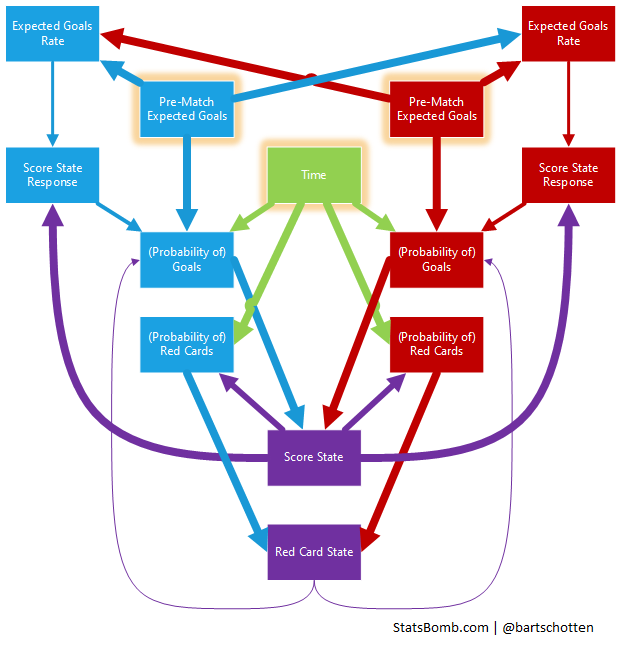
The full picture looks like this (the size of the arrows roughly corresponds to the strength of the effect):

Match Simulation

To test this I've built a little “simulator” based on the underlying numbers. It works by taking only initial ExpG values and running through the match in a number of iterations in which the game state influences the scoring probability and the probability (potentially) influences the game state.

It does seem to produce reasonable results, although the jury is still out on whether it’s a significant improvement upon Poisson. As far as betting goes it does have the potential added benefit of being able to quickly run some numbers as the state of the actual game changes (for example after a red card).

*For example: to see the effect of goal difference, the performance I measure is relative to pre-match ExpG and after correcting for the influence of time.

DOGSO and Punishment

This week UEFA revealed plans to make a case for an end to the ‘triple punishment’ of a penalty, a red card and a suspension for denying an obvious goal-scoring opportunity in the 18-yard box. It’s true that this punishment often seems harsh on first glance, but this move by UEFA seems like a good time to try and back this up with facts.

The best way to do this is to assign an expected goals value to all of the factors that are involved, which are:

  • Penalties
  • Red cards
  • Suspensions
  • “Obvious goal-scoring opportunities” (OGSOs)

For example, we know that about three out of four penalties are scored, so we can say that a penalty is worth about 0.75 goals.

The other factors are quite a bit harder to determine though. I’ll even leave suspensions out of the equation altogether because that would require an accurate measurement of the influence of an individual player on a team’s performance. A bit too ambitious…

Obvious goal-scoring opportunities

"OGSOs" in this case are almost by definition hard to assign a value to, because we’re specifically interested in those that are denied. That means we’re trying to measure the effect of something that didn’t happen. We also know that not all OGSOs are created equal, and that nobody can even agree on an all-encompassing definition. We can, however, look at some typical OGSO-situations.

For example, there’s the classic one-on-one with the goalkeeper. We have no readily available statistics on this either, but we do have this:

“From 1977 through 1984 the NASL had a variation of the penalty shoot-out procedure for tied matches. The shoot-out started 35 yards from the goal and allowed the player 5 seconds to attempt a shot. The player could make as many moves as he wanted in a breakaway situation within the time frame.”

This crazy American experiment may turn out to be pretty useful, as this seems to be a decent simulation of a similar situation in a match. As the video below shows, five seconds is not a lot. It puts quite a bit of pressure on the attacker, not unlike having a defender on his heels. As you can see it’s not at all easy to score.

From the available historical data on the internet I’ve gathered that in these kinds of shootouts about 48% of attempts were scored. That means this kind of one-on-one OGSO has an expected goal value of 0.48.

I take it that this is the kind of situation UEFA has in mind, but of course there are also cases where it’s not merely an opportunity that is denied, but a (near-)certain goal. Think of Suarez’s infamous handball on the line to deny Ghana in the 2010 World Cup, or a keeper intentionally bringing down an attacker who only has to walk the ball into an empty net. Surely these have an expected goal value of >0.95.

Red cards

That leaves us with the factor of the red card. In theory the effect of a red card on expected goals can be measured well, but it’s a complicated matter:

  • Unlike penalties and goal-scoring opportunities, the effect of a red card isn’t constant over time. A red card in the 85th minute obviously doesn’t leave the opponent much time to capitalize on the advantage, while a red card early in the match can be a huge deal.
  • There’s a risk of confusing correlation and causation. Teams ship more goals after conceding a red card, but worse teams get more red cards anyway, so if the team simply has an off-day they can expect to concede more goals and more red cards.
  • When counting goals after a red card, we should exclude penalties resulting from the same incident, if we want to consider both factors separately.

Mark Taylor has done some interesting work here. As he points out not only is the value of a red card not constant, it’s not even linear, since on average more goals are scored in the second half than in the first. This means that the rate at which the value of a red card degrades increases a little as the match goes on. I’ve confirmed that this is true even if matches with red cards themselves are excluded (which would be one explanation for this effect).

Mark comes up with an expected goal value of 1.45 for a theoretical first minute red card, but because I’m not entirely sure how he got there (and because double-checking is simply good science) I decided to take a shot at it myself.

I've taken minute-by-minute data from 4.5 Premier League seasons and looked specifically at the 204 matches in which exactly one red card was given. For these matches I've taken the average number of goals scored by the 11-man team and the 10-man team, both before and after the red card was given.

After adjusting for the fact that the average dismissal is after 66% of the match, taking into account that more goals are scored near the end, and subtracting the value of penalties given for the same incident as the red card (12% of cases), I get a value of 1.08 goals for a red card in the first minute. In this theoretical case in which they still have to play the entire match the 11-man team can expect to score 0.61 goals more, and the 10-man team will have to do with 0.47 goals less.

If I exclude matches with red cards given before 20%, or after 80% of the match has been played (cases which provide too little information to compare events before and after the red card), I still end up with the same number of 1.08.

The Ole Gunnar Solskjaer guide to taking one for the team

Is UEFA right? Well, the graph shows that the combination of a red card and a penalty can be almost four times as valuable as the goal-scoring opportunity that was denied. Harsh indeed! On average it will be about 2.5 times as valuable as a one-on-one situation. This has the nasty effect of making it very tempting for the attacker to go down easily instead of staying on his feet and taking the shot.


DOGSO and Expected Goals


This also serves as a handy guide for defenders. When they’re chasing an attacker who is through on goal I suggest they refer to these simple rules that they will now surely keep hidden in their sock before deciding on how to proceed:

  1. As long as you still run the risk of getting both a red card and a penalty, it’s never a good idea to make a foul inside the area…
  2. …Unless you are avoiding a near certain goal and it’s during the last minutes of the match (Suarez did the right thing).
  3. If he’s still outside the box and at least an hour has been played, go ahead and take him out (the Solskjaer special seen below).
  4. If UEFA’s suggested change goes through and you’re still in the first quarter of the match, let him enter the area and then take him out. You’re better off with a penalty than a red card.
  5. Under the new rules, a near-certain goal should be stopped by any means in almost all cases.

The last point makes clear that in reality a distinction would have to be made between DOGSOs and the denial of near-certain goals (DNCG?) and that the triple punishment would still have to apply to the latter. I feel that on average this new rule would be more fair, but I’m afraid that in specific cases there would be even more room for controversy.