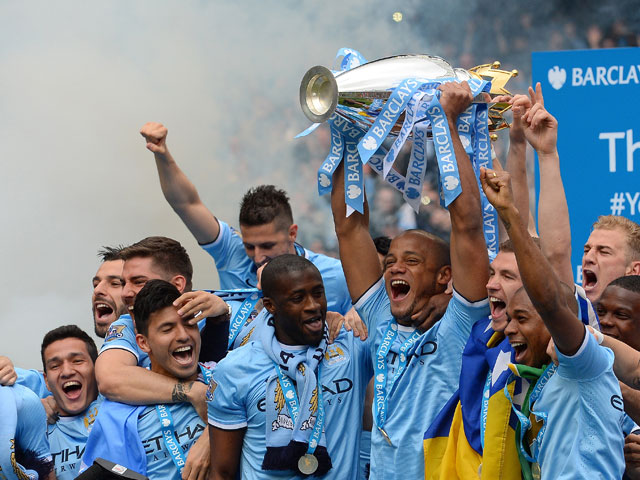
In years past, on warm summer nights and with a new Premier League season upon us, one could close their eyes and easily imagine a scenario in which Manchester City would be crowned champions for the upcoming season. One could picture swashbuckling attacking football, goals-a-plenty, the thoroughbreds of Agüero, Silva and Toure destroying opposition defenses: a winning team.
This was certainly the case in 2011/12 where Agüero's arrival and Silva and Toure's 'year 2' seasons were enough to believe City could go supernova. The squad additions of 2012/13 felt like enough to ensure Manchester City would retain their crown. And 2013/14 with the addition of battle-ready peak players like Negredo, Fernandinho and Navas. Plenty were optimistic that City could win the title in 14/15.
Yet, it's not so easy to close the eyes and imagine Manchester City winning the title in 15/16. Things feel different somehow. Confidence in a Manchester City title win in 15/16 is low. The great unwashed don't think Manchester City can win it and neither do the pros. Just 2 of 11 Guardian journalists predict a title win for City, 1 of 14 Daily Mail journalists, and 2 of 10 Telegraph journalists. This a vote of no confidence by the men paid to write about football by national newspapers.
Why the lack of confidence? ¯\_(ツ)_/¯
Well, I can guess. And I'll get to it in the reasons for pessimism section.
What Happened in 14/15
Manchester City were a very good team in 14/15, but there was streakiness throughout the season. A very strong first 20 games, a flawless last 6 games and a shit show in between those two points. To illustrate:
(scrollable on mobile, click and use arrow keys on desktop)
That dip between game 20 and game 32 was severe: 15 points in 12 games. That ain't good nor is it in any way title form. This dip cost Manchester City a chance at the title. That dip in form is even more perplexing considering Manchester City posted numbers like these:
2014/15 Team Metrics
(scrollable on mobile, click and use arrow keys on desktop)
Link to actual stats table
That table runs across the whole spectrum of stats from TSR to SoTR to expected goals methods, and hell, even crazy PDO is in there. Whichever way you slice it Manchester City were a dominant team and score effects weren't an issue in Manchester City padding shots numbers. Excellent performance in underlying numbers doesn't mean the team was without problems. Folk said:
- Pellegrini seemed to be stumbling through parts of the season locked-in to a stubborn twin striker system.
- The midfield, when bypassed, exposed a shaky looking defence (this is more of a systems issue with City being a dominant territory team).
- Mangala was a mess.
- Kompany's injuries and hyper-aggressive style appeared to finally catch up with him.
- Full-backs looked old.
- Toure struggled with a multitude of issues.
- The team is old.
- Scored 19 fewer league goals year-on-year.
That is a lot of bad narratives and despite all those issues it was a team who finished second and posted extremely good numbers across the board.
Transfers In
Raheem Sterling £47m
Fabian Delph £8m
Patrick Roberts £4m plus £7m in futures
(Kevin De Bruyne £40+ *this probably happens at some point)
Promoted from the youth team: Kelechi Iheanacho (fwd), Jason Denayer (cb) and Marcos Lopes (am)
Transfers Out
Dzeko, Jovetic, Milner. Maybe some others.
Evaluating The Summer Window So Far
Raheem Sterling addresses a need for speed and trickery in the left midfield position. His creativity, intelligence and an ability to break lines was needed. If Sterling is this good at age 20, then what will he be by age 24?
Delph is an excellent pickup for that price: a depth midfielder who can cover the ground quickly, is good in transition and offers left/right balance to a midfield pair.
Roberts is a future consideration. Extremely talented and in possession of a familiar gait. 2 or 3 years down the road we should hopefully see him start to push through.
The promoted youths are exciting: City's depth gets younger (but probably worse) with these moves.
Denayer and Lopes both project to be starters of varying quality, given time. Yet it is Kelechi Iheanacho who is the jewel in City's youth setup: quick, aware, and a finisher who is also more than able to create. Kelechi is only 18 years old, but he doesn't look the slightest bit out of place with City's first team players. Kelechi is pegged to be the #3 striker for 15/16. There will be good days, and bad days, no player develops in a straight line.
As for player sales. James Milner decided to leave for first team football, thus saving Manchester City from themselves and a soon-to-be 30 year old depth player on a big 4 year contract. Dzeko will be remembered as an important player for City; as talented as he was frustrating. Jovetic: forever injured, never trusted.
Current Needs
Manchester City have a talented and deep squad, but there are still holes. A shiny new center midfielder would have been nice, as would a solution to the center back issues. The future of the full-backs will be addressed at some point in the near future.
Reasons to be positive
Manchester City posted excellent underlying numbers in 14/15 and there isn't much evidence to suggest that this improved squad of players are going to fall off a cliff and start posting terrible numbers in 15/16. Greater pace and creativity in attack (Sterling and possibly De Bruyne), an improved midfield (Delph as depth, Toure rested), a more aware Mangala, and a permanent switch to a 4-2-3-1/-4-3-3 one striker system should, hopefully, see City improve upon the 79 points they posted in 14/15.
More firepower means a greater ability to score their way out of problems.
Reasons to be negative
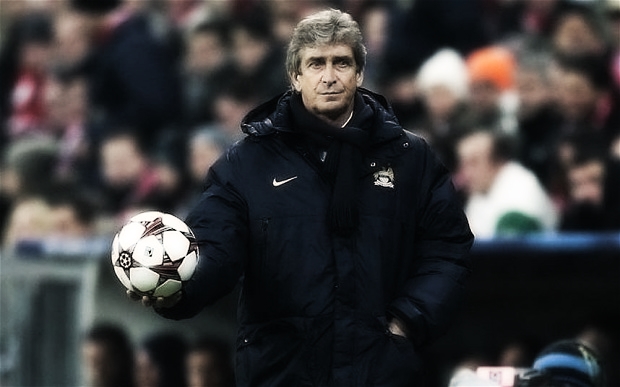
There are real concerns about Manuel Pellegrini's ability to coach this team to success in the Premier League and the Champions League and until this very morning there was a concern that in entering the last year of his deal he could have become a lame duck coach whose players down tools at the first sign of trouble. The new contract at least on the surface addresses this issue and provides a needed perception of stability.
The age of the squad is a concern also. The great core of this City side over the past few years is aging and we should be near the point where we start to see some performance levels dip slightly. Rest and rotation will be key to getting the very best out of what these players have left to offer. It is also worth noting that world class players will age at a very different rate to league average players (a 32 Toure looks very different to a 32 year old Joey Barton), so dismissing the likes of Toure, Silva or Fernandinho the moment they edge past 29 may lead to some crazy-eyed evaluations. The team isn't getting younger, the window to win is shrinking rapidly and a lot of these guys will need replacing in the next year or two. All that said, it doesn't make them terrible players.
The defense has problems: aging full-backs, a captain who appears to be morphing into peg leg, and an expensive junior partner who doesn't appear to be comfortable playing in this system. Ah, the defensive system! When a team plays possession football and they dominate the territory to the extent that Manchester City it comes with a cost. That cost is a high defensive line that can, at times, be exposed by pacy counter-attacking football.
Manchester City were the best territory team in 14/15 with the ball and the best territory team without the ball. This was a team whose games were mostly played in the middle third or the oppositions third and when that happens that leaves a lot of space at the back to be covered by few defenders. This means fast attacks by the opposition can cause chaos in the defensive zone. Chaos makes people look bad. Man City's whole defense looked bad by eye last season, and if difficult questions are repeatedly asked of defenders with a ton of space to guard then quite often those defenders will get some of those questions wrong. Defenders can look bad when asked to do too much.
Pellegrini's system can be hard on defenders (Kompany wouldn't look nearly as bad in Chelsea's deep block) but what his system does is create tons of offensive chances for the team whilst being effective at suppressing shots against; sometimes those shots against will be of high quality and sometimes the defense will look like hell. This is the balancing act of Pellegrini's system.
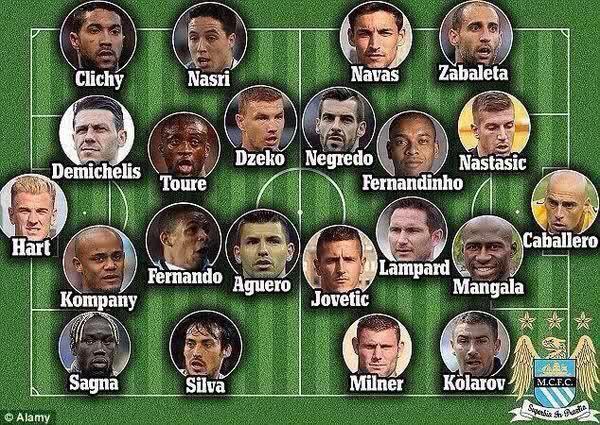
Lineup
This should be, if all things break right, be Manchester City's power lineup.
What does it all mean?
Manchester City remain an elite side. They control the territory and play like few other teams can, they rack up shots at a terrifying rate while suppressing shots against. Nothing that happened over the summer in terms of personnel or coaching should change Manchester City's excellent processes.
If the excellent processes continue into this season and Manchester City enjoy a dollop of luck in terms of conversion percentages and injuries then this team may well, once again, win the Premier League title. If Chelsea enjoy another season of near-perfect health to their core players, then I am unsure if any team could wrestle the title from them. But if injuries catch up with Chelsea and Manchester City's forward group clicks then City should well be close.
Manchester City possess the deepest squad in the division, but it's an aging squad and this season may well represent the last chance for this core to win it all, together.
Do not go gentle into that good night,
Old age should burn and rave at close of day;
Rage, rage against the dying of the light


 Ronaldo is a laughable 4/11 anytime goalscorer. (nice photoshop)


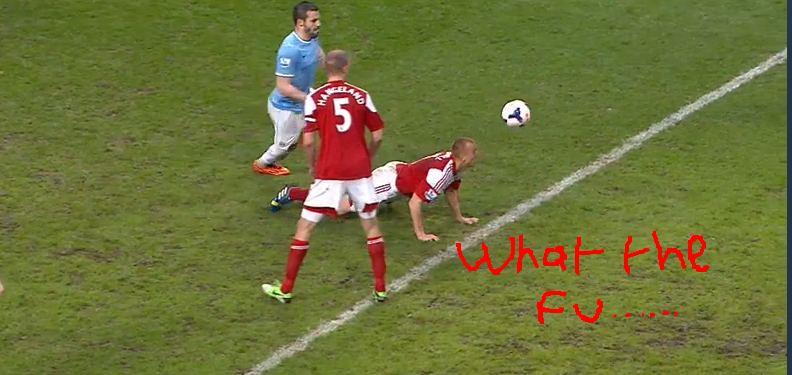
![Not even booked! Seb Larssons terrible tackle on Javi Garcia [GIF]](http://d3j5vwomefv46c.cloudfront.net/photos/large/820924805.gif?1384095707) FUCK! F%$&*! It's a red card! In all seriousness, City boast a fine squad that should be more than capable of absorbing injury to players, no matter how key those players may be. Man City failed to create too many clear chances despite the imbalance in the shots and territory count. I have passed through most of the stages of grief in regards to City's away form and I'm now at total acceptance. We've have had problems with away form for the past 3 seasons, so it's probably not personnel or coaching strategy, which have both improved, so what is City's problem away from home? If you know what is ailing City away from the fortress let me know!
FUCK! F%$&*! It's a red card! In all seriousness, City boast a fine squad that should be more than capable of absorbing injury to players, no matter how key those players may be. Man City failed to create too many clear chances despite the imbalance in the shots and territory count. I have passed through most of the stages of grief in regards to City's away form and I'm now at total acceptance. We've have had problems with away form for the past 3 seasons, so it's probably not personnel or coaching strategy, which have both improved, so what is City's problem away from home? If you know what is ailing City away from the fortress let me know! 
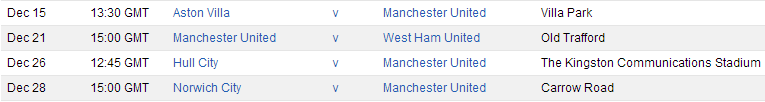
 Swansea's small squad, the European games and the Thursday-Sunday fixture list may take it's toll on team selection and, ultimately, Swansea's ability to claim points. European teams suffered last year in terms of Injuries and December was the real hot spot. Swansea seem to be a prime candidate to suffer injury and a possible drop off in points. Ditto Arsenal?