Tag: Expected Goals
West Ham: Better Expected?
 Despite finishing eleventh, West Ham endured a pretty miserable season. The only real highlight was killing off the last 3% of Tottenham’s title challenge by beating them 1-0. A stream of transfers failed to impact the first team, some weird numerical skews killed their chances early on and the question of whether Slaven Bilic was the right man for the job started to linger. He had elicited slight structural improvements in performance in his first season and got a tidy bounce from positive variance. A string of great results against big teams away from home, in which West Ham took early leads and fended off the cavalry, were the bedrock of a seventh place finish and fewer defeats than Man Utd and Man City. Season two was very much a return to prior and lesser form. Broadly West Ham are a reliable outfit. In eight of the last ten Premier League seasons they have participated in they have scored 40-something goals. In seven of those seasons they have landed between 40 and 51 points. One time they bounced forward (2015-16, 65 goals, 62 points), one time they got relegated (2010-11, 33 points, 20th). Is this good enough though? What should West Ham be aiming for? Stadium, revenue, an opportunity? The move to the Olympic Stadium is the first aspect of the club that gives them a huge opportunity to transcend from the mid-table and aspire to more. Although attendances this season were often less than reported, the new ground has the potential to add 20,000 or more on top of the 35,000 that used to pack the Boleyn Ground. Even allowing for discounted seating in less appealing fixtures, that’s a huge jump in income. And that could move West Ham into a category of their own. The TV money jump helps everyone, but West Ham's latest (2015-16) revenues placed them seventh in the league with income around two thirds that of Tottenham. Their London rivals’ spell in the Champions League and general success will move them forward again, but adding extra match day income can put daylight between West Ham and the other mid tier clubs; Everton, Southampton, a returning Newcastle and others. They also hold the added appeal of being a London destination for potential transfers. Overall it’s an appealing structure, and they appear as well set as any time in their recent history, but really, and this is the kick: they should be doing better than they are. Metrics Seventh was slightly flattering in 2015-16 and metrics pegged them as somewhere around the eighth to tenth best team in the league. Seventeen points vanished last season but the underlying basis of this only took a comparatively small step back. Expected goals pegged them around tenth to thirteenth and they finished eleventh.
 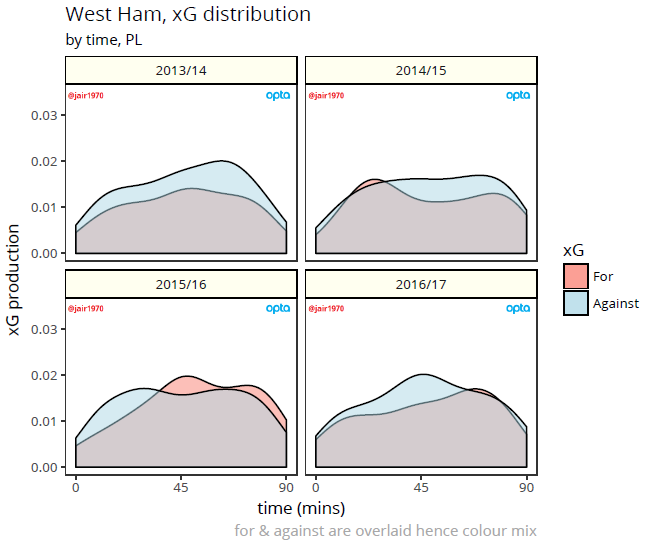 The simple tale is thus: West Ham during Bilic’s reign, and before, have projected as a mid table outfit, which is more or less what they were under Sam Allardyce. In 2015-16 they got the breaks and landed high in the table, in 2016-17 they didn’t get the breaks and eventually lugged their way up into the midfield. The difference between Allardyce and Bilic in this regard was that Allardyce was consistent in defying relatively mediocre metrics to land safe, primarily through overshooting against defensive expectation. Each of the last three seasons has seen a big focus in attack on heading the ball--to be expected for an Allardyce team with Andy Carroll in the ranks but it has continued with Bilic. A third of expected goals generated in 2014-15 were via the headed route, and a quarter in each of Bilic's seasons, all compared to a league average of about 17 to 18%. *As an aside/curio, Michail Antonio scored six headers in the first 12 league games of the season (to add to 6 more from the back half of 2015-16), then only managed seven headed efforts in total for the remaining 17 starts he made, none of which landed on target. I guess teams started to mark him. Bilic has had two seasons of high variance, one positive, another the opposite and the staid control that Allardyce inevitably brought has been replaced by a more unstable outlook. Formation indecision, soft centre Part of the problem for the team in 2016-17 was an inability to settle on a formation. West Ham finished the season with a run of games playing three at the back, a basis that they had previously tried and ultimately abandoned after their very slow start. Perhaps Bilic was unsure how to set up his team to get the best out of them? They were uniformly terrible against the top six and went 1-2-9 with the Tottenham result the only victory. They played an even six games apiece with a back three and a back four. With a back three they got steamrollered at home 0-4 by Liverpool and 1-5 by Arsenal, with a back four, Man City, Chelsea and Man Utd all arrived and won, though with less dominating shot profiles. Nine times across the season, Bilic switched between the three and the four but results remained erratic, with no great overarching pattern emerging, perhaps until the end. But if we keep digging, we find they achieved eight clean sheets from just 16 games with the three centre backs (compared to two from 22 with four at the back), and against their peers conceded just four goals total in ten games. Now this begs the question: does this mean Pablo Zabaleta’s aging legs will be utilised at wing back? Or will the formation changes continue? The three has become fashionable in the league once more, in the wake of Antonio Conte’s usage, but West Ham had tried it to little avail on three occasions in 2015-16. Overall Bilic’s team has struggled to create an identity, and his relentless tweaking has not helped here. Regardless of formation, it seems the defence wasn’t always in step. Only Sunderland conceded more chances than West Ham from logged completed throughballs--25 to West Ham’s 18--and both teams conceded a league high seven times from such opportunities. These are relatively scarce events and liable to fluctuate but nonetheless it represented double the volume of 2015-16 and a headscratcher for their manager. Retained existence in the Premier League will always be the first target, and last season's early season scares showed that they aren't immune from that yet, but much more should be the aim. What factors are hindering that progress? Transfers and continuity The specific performance conditions that Allardyce effected felt like they had a ceiling, and moving on from him was a positive move. Bilic’s first season indicated that he might have been a good appointment, and he is still carrying just enough kudos to justify the continuity of retaining him into 2017-18, but that doesn’t get to the crux of the issue. The club has failed to progress on the field and one of the primary issues here has been its short sighted use of the transfer market. Until Dimitri Payet forced through a £25m transfer back to his homeland in January--for what were rumoured to be “non-football” reasons--James Tomkins’ £10m move to Crystal Palace in the preceding summer was a notable outlier. West Ham are not a selling club. They are not a selling club insofar their players are rarely coveted by larger clubs. Since returning to the Premier League in 2012-13, they have consistently spent at a deficit, but have rarely pulled in any more than token income from turning over their squad. I hammered their 2016-17 transfer policy before, but the truth is it goes back a lot further and while the team maintains its position it’s unlikely to be classed as a problem. However, the team lacks continuity. Pablo Zabaleta’s swift arrival is endemic of the lack of foresight that has afflicted West Ham’s recruitment in recent years. At 32 and past his best in a high energy position, Zabaleta can fill a gap, but is unlikely to move the needle. Often mid-tier clubs are seduced by the profile of decorated players moving out of larger teams and see them as worth a gamble. In moderation, such players can give a fillip to a younger squad but when the team’s last two signings in January were a 33 year old centre back (José Fonte) on a two and a half year deal and a 29 year old winger (Robert Snodgrass)--another likely energetic role--on a three and a half year deal? It’s an unfortunate trend. Talented players, sure, but at entirely the wrong end of the age curve, with zero resale value and potentially about to fall off a performance cliff. The idea that Bilic staying gives continuity is undermined by such a short sighted transfer strategy. And the blueprint for what the club should look to be doing exists one hundred miles down the M3 in sunny Southampton. Here’s a club that has such a strong structure in place that their down year was a point better that West Ham’s reversion to the norm, and underlying metrics were still sound enough to rank them in the top seven for expected goals for the fourth consecutive year. A tough to measure blend of Claude Puel’s methods and variance meant they bottomed out, but their bottom is significantly higher than West Ham’s right now, and their background structure is built to survive not just changes in playing staff but managerial moves too. Their player development and identification means they can comfortably rejig their team while supplying the rich with new toys, while maintaining a solid position. With Puel gone, they are a positive managerial appointment away from again challenging the outskirts of the top four, and continue to punch well above their weight at exactly the time building a club while remaining in the league has a huge upside. So Bilic continues... With Rory Campbell at the club and analytically minded, and Michael Caley having previously been consulted, it's not as if West Ham have zero smarts in this direction, its just there is precious little evidence that more recent Bilic era recruitment is switched on, at all. Perhaps meandering around in mid-table is enough for the club's hierarchy, but David Sullivan and David Gold are fans too, and they're currently missing out on maximising the return on their investments by operating a reactive recruitment model. West Ham's future can be much more, but only if the influencers can see the bigger picture. @jair1970
Pep's Struggles, Rashford vs Abraham, and Teasing xGChain

The Premier League has transformed from a very good football league into one of the world’s greatest soap operas, and perhaps my favorite storyline right now is the struggle of Pep Guardiola.
- Take the world’s greatest current manager.
- Add him to one of the world’s richest teams.
- Profit.
Before the season, most people thought it would be that simple. Halfway through the year, it is clear it has been anything but. The question is why? Pep didn’t struggle like this at Barcelona, nor at Bayern Munich. What makes Manchester City – just two seasons removed from the title when he took over – so much harder? For the answer to this question, I want to briefly cast back to some stuff written at the start of StatsBomb’s existence in 2013 by myself and Benjamin Pugsley. That summer City recruited Fernandinho, Jesus Navas, Stevan Jovetic, and Alvaro Negredo at the top end of the scale, aged 28, 27, 23, and 27 respectively. The problem we flagged up at the time was that these were clearly “win now” transfers that would have a stonking replacement cost down the road. You can’t sign guys in their late 20s and expect them to contribute at the same level as players in their prime at the end of 4- and 5-year contracts. It just doesn’t happen. Add in 32-year-old Martin DeMichelis for salt and City had signed fairly old. The next summer saw the arrival of Mangala, Fernando, Willy Caballero, and Bacary Sagna. Now Mangala was 23, but ended up being a disaster. This happens, especially with center backs. Fernando was 26 and has hardly contributed at a level commensurate with his fee. Caballero is a backup GK, and Arsenal fans will tell you that as much as they loved Sagna, he was already approaching washed up as a two-way fullback when City signed him at age 31. In his last season in North London, you could have Sagna attack. Or you could have him defend. Do not expect both. Two years, lots of fees, and no players in their prime that stuck. This is a problem for a club that wants to contend for titles every year. Last summer, City spent about £150M on Sterling, De Bruyne, and Otamendi to start digging out of the mess, and all three have proven to be good/great additions. Unfortunately, this equates to “normal” turnover spending for a super club. It didn’t improve the spine much, nor solve the growing geriatric issue. Fast forward to this summer, and the great master arrives along with John Stones, Leroy Sane, Nolito, Gundogan, and Claudio Bravo. Nolito and Bravo are 29 and 33, and neither one of them is a fullback. Gundogan is a world class talent and midfielding brain packed into a Mr. Glass body. Sane provides good depth and youth, but probably a year away from being good, and John Stones is a center back project that Pep desperately needs to succeed. The point of all this is that yes, Pep’s system might be the most fundamentally superior tactical system we have seen in modern football. And yes, Pep Guardiola is still a goddamned Footballing Jesus. But even Jesus was going to have a tough time resurrecting this squad and romping the league this season because of the issues created by years of ineffective squad planning before he ever got there. And all of that was before the entire league chose to collectively get their shit together on the manager front, giving the Premier League probably the greatest collection of coaching talent it has ever had at one time. City might have the best manager in England, but they could spend £200M in January and still need to stump up more in the summer in order to have the best squad in the league. It is great to see Guardiola struggle, and try to adjust his tactics to both the league and his squad at the same time. That very struggle has not only created a great story for this season, but it’s also enhanced the reputation of the Premier League by proving to be a tougher title to take than anything Pep has faced in recent times. Young Rash and Tam Tam I was asked this week on Twitter whether I would pick Marcus Rashford or Tammy Abraham as the bigger talent. This came out of a broader discussion on what “the analytics world” thought of Rashford this summer, after a fiery debut season. My point then bears repeating: there is no such thing as “the analytics world.” There is no monolith of opinion with regard to stats and football. There is a loosely-connected community of people who work with stats, but that’s about it. The site you are reading this on right now is not called TedBomb, and even here on StatsBomb you will see differing opinions and analysis of the exact same data by different writers. Lumping all analysts into a group sells the great work everyone does short in the same way lumping all journalists into one misguided, monolithic opinion group would. We are all unique snowflakes, dahling. 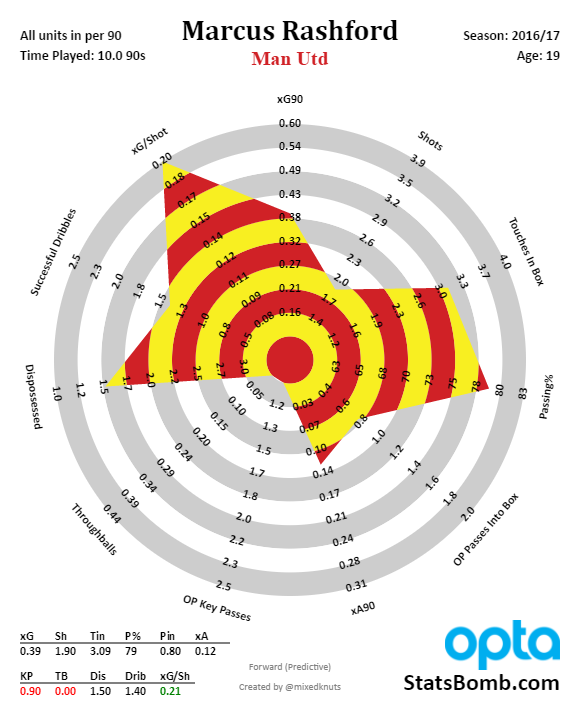
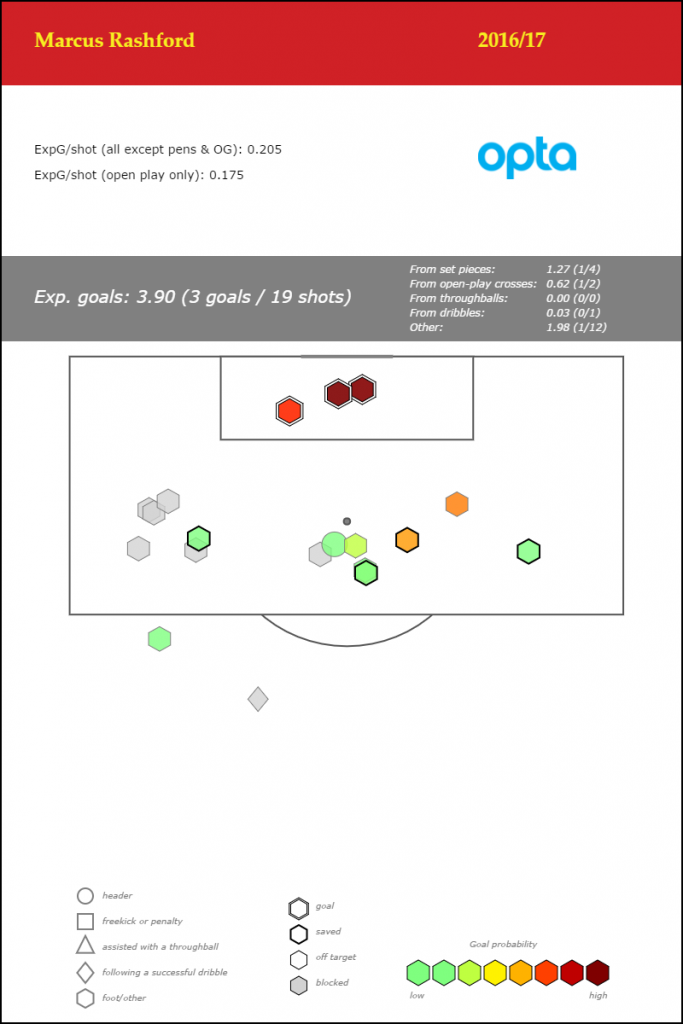 My opinion from this summer on what Rashford was and what he could be is largely unchanged. The fact that he is scoring goals regularly in the Premier League at his age is notable by itself. Add to that a serious commitment to run at defenders this year and a bit more creative passing, and he looks like one of the best prospects to come out of Manchester in ages. He’s clearly still learning, but also good enough to start for most teams in the league right now, either as a center forward or as a wide forward. Tammy Abraham may be a less common household name right now, but he has been lighting up the Championship at Bristol City this year in his first season of senior football. The Chelsea loanee is only 19.
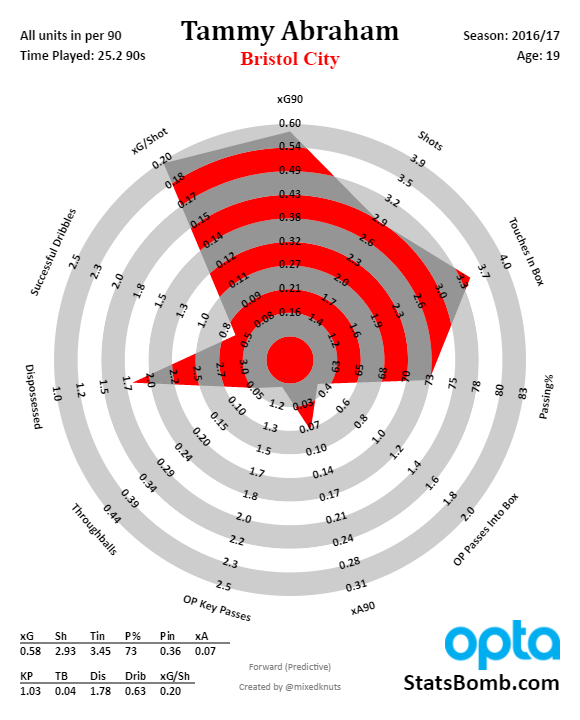
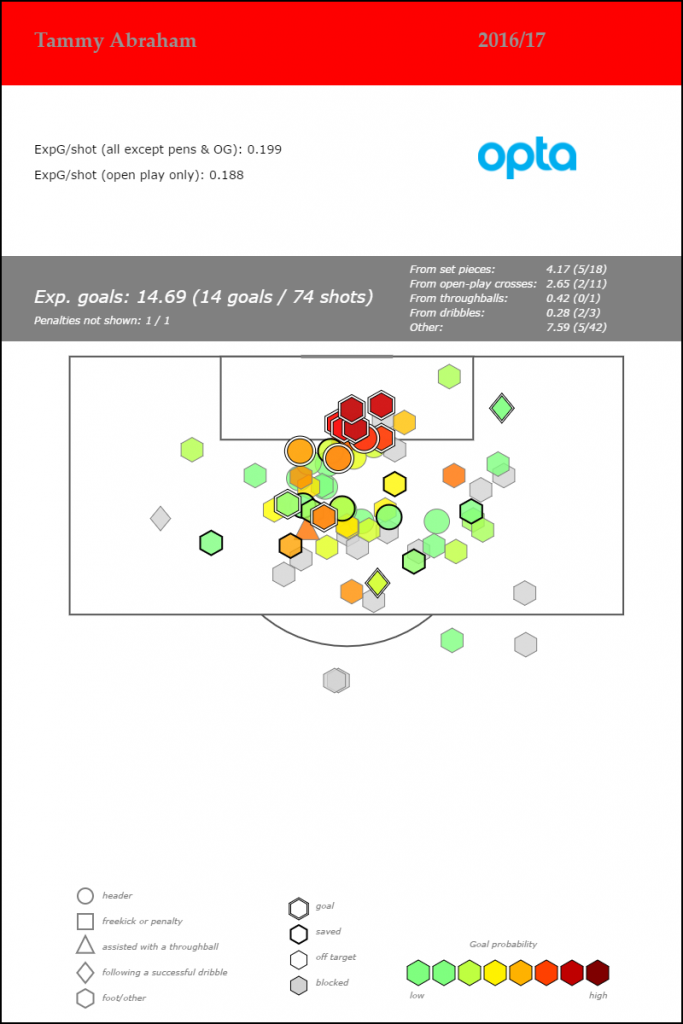 This is extremely unusual for a young forward, and looking backward one of the most similar profiles I can find at this age is another Chelsea loanee: Romelu Lukaku. Yes, Lukaku’s season came against Premier League competition and TamTam’s is in the Championship, but Lukaku certainly looked a bit more physically mature when he did it while Tammy still has some teenager left on those lanky bones. Back in February, my group at Brentford produced a list of young forwards that we thought would contribute to our club this season, and Abraham was at the very top of that list*. He is a breathtaking talent who is producing incredible numbers without being surrounded by particularly good teammates at Bristol City. So you know I'm legit on this, here's a tweet from the first day of the season in August.
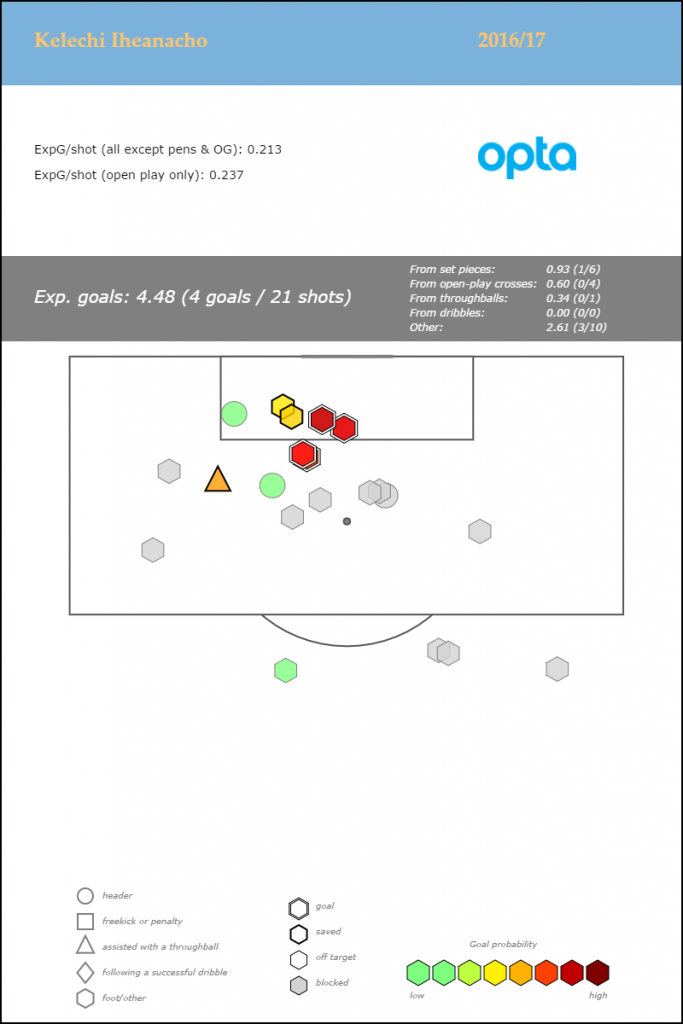
 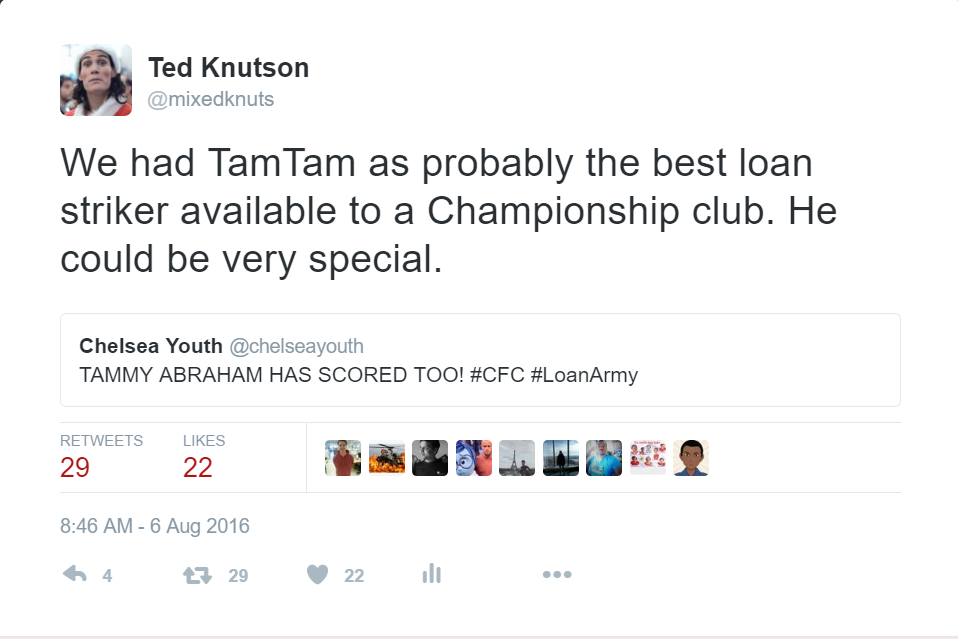 (* The previous season we flagged up Sergi Canos and John Swift as good loanees, both of whom were excellent contributors, so pretty happy with the process there.) Anyway, back to the actual question: say for the next five seasons would you rather have Rashford or Abraham? The statistician in me leans Rashford. Obviously he’s performing against better competition, and the success he is having as a wide forward at his age is more rare and unusual than Abraham’s profile. Yung Rash is the real deal already, and who knows how high his ceiling is? The scout in me leans Abraham. He’s killing it week in and week out, in a very physical league, without the help of United’s amazing squad around him. His passing as a CF is probably better than average, and he has pace, strength, and surprising technical ability for a player his size. He’ll be in the Premier League next season and will likely not look at all out of place. Both of these guys are part of the English National Team setup, and England is absolutely spoiled for choice at the attacking positions for what looks like a decade to come. Oh, and before we change topics, Kelechi Iheanacho at City still looks really special.
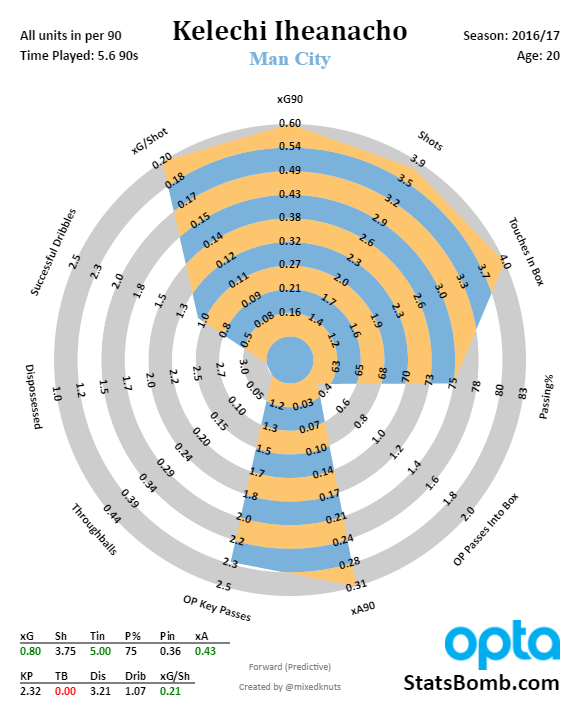
 The Premier League Cliff Some years the relegation battle is all we have left for excitement by the end of the season. Others, it’s the race for the final Champions League spot. Once a generation you might get "AGUEROOOOOOOOOOOOOOOOOOOOOOOOOO!" This year, the entire table seems to be in motion every single week, but I find the bottom of the table particularly intriguing. Two early, improbable wins disguised it for a while, but Hull have been the worst team in the league since the start. They have a squad stuck between Championship and Premier League calibre and though they were probably improving a bit in recent months, they still hadn’t beaten anyone since *scrolls through fixture list* *still scrolling* Uh… Jesus, November 6th against Southampton. Even that was *ahem* a bit fortunate.
 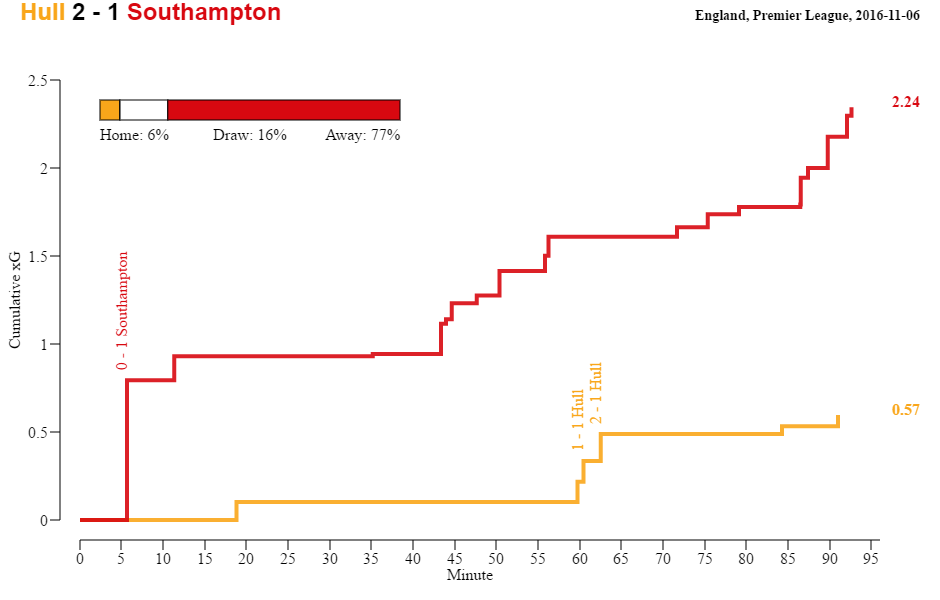 So yeah, change was needed and Hull went way off the beaten path to hire former Sporting Lisbon and Olympiakos boss Marco Silva. I like this appointment for lots of reasons, not least that it should give them an actual chance to survive pending additional recruitment this month, and it doesn't recycle old names. They are 4 points off safety with 18 games left. It’s an ask, but I am saying there's a chance. Moving up the table, we have The Swansea Debacle. A club that can’t stop shooting themselves in the foot has named Paul Clement as a perfectly reasonable head coaching appointment that also gives them a shot at survival. Like Hull, their squad is also a mixed bag of talent, with two solid forwards, some decent pieces dotted around the pitch, and yet huge need for upgrades in about five positions. Like we discussed above with Manchester City, if you recruit poorly for a couple of seasons in a row, you will eventually pay a price. Swansea’s Premier League dreams will live or die on Clement’s ability to solidify the defense while still allowing them to create enough goals to get 3 points on a regular basis. One simple barometer of doom that I discovered a couple of seasons ago is the 16 Shots Rule. If your club is giving up 16 shots or more a game, you have a strong probability of being relegated. Burnley are defying this metric this season because Sean Dyche has somehow crafted a Jekyll and Hyde tactical team who are surprisingly good at home – 5th best in the league right now with 22 points - while being the worst team in the league on the road. Their home return means they are almost certainly safe this year, and if Dyche can figure out how to bring similar output to Burnley’s road performances, they may become mainstays in the PL, at which point the media will suddenly appreciate him more and begin referring to him as Dutch tactical mastermind Jan Dijks. (Shout out to @noverheul for the nickname.) The doom clock doth toll, and it tolls for Sunderland. David Moyes's team are giving up nearly 19 shots a game, and circling the Premier League toilet bowl, waiting to be flushed. We know Moyes’s Everton teams were difficult to beat, but Sunderland are tied for most losses in the league with 13. Something is clearly lacking at the Stadium of Light beyond funds for additional transfers. That said, given Moyes's history, it’s tough to completely rule them out either. Directly above Sunderland, one point away from being flushable, are Crystal Palace. The complicated reign of Alan Pardew is now over, and The Great Allardici has been tasked with his usual magic act of keeping a struggling club up. Their underlying metrics were actually pretty good even before Pardew was sacked, but the table position is precarious enough that a bad run will cause normally sweaty Big Sam to look like he’s managing in a sauna. Who doesn’t want to see that? Finally we get to the clubs that appear in relative safety. Aitor Karanka’s Middlesboro are dreadfully boring to watch, but are also 4 points plus strong goal difference away from the drop. They could get sucked down to the bottom, but it would take a strong final 18 matches from two clubs below them to cause any real trouble. Every other club from Leicester on up should surely fight on for another season and another massive injection of TV money. Maybe it’s just me, but I’m kind of looking forward to the relegation run-in of nearly competent teams desperately hanging on for another year. It's SCRABBLING FOR SAFETY SUNDAY, AND IT'S LIVE... Random xGChain Trivia I teased a new metric that Thom Lawrence has developed for StatsBomb Services on the podcast this week. I’m not going to steal Thom’s thunder – he will write about it in detail next week, and then I will follow-up with more analysis after, but I am going to provide random historic trivia with absolutely zero explanation right now. I will say that we’re currently breaking it into xGChain/90 and what I refer to as xGChain Residual, but Thom may end up calling Pre-xGCh**. Either way, please enjoy.
- Arsenal’s highest xGChain player in 14-15 was Santi Cazorla. He was also Arsenal’s highest player in 15-16. Pretty interesting, given their struggles without him.
- I knew Atletico Madrid’s Angel Correa was good, but he has the top xGCh value for them so far this season, above Gameiro and well ahead of Antoine Griezmann.
- Neymar actually had the highest xGChain/90 at Barcelona last season, and not Lionel Messi.
- Xavi 10-11 has the highest residual xGChain score in the data followed closely by Jerome Boateng at Bayern last in 15-16. Yes, a center back.
- The highest non-Bayern, non-Barcelona players in residual xGChain values are Ozil at Real Madrid in 12-13, Cazorla at Arsenal last season, and Gundogan at Dortmund also in 15-16.
Oh, and back when I first started toying with Manager Fingerprints in 2013, I described Mark Hughes as a bang average Premier League manager. Stoke are currently 11th in the table, having finished 9th, 9th, and well... 9th in the previous three seasons. Some times "average" really is a bit of a compliment. Have a good weekend! --Ted Knutson @mixedknuts mixedknuts@gmail.com ** If you want to complain about names, feel free to develop your own metrics instead 😀
Explaining and Training Shot Quality
Decision Making And Expected Value
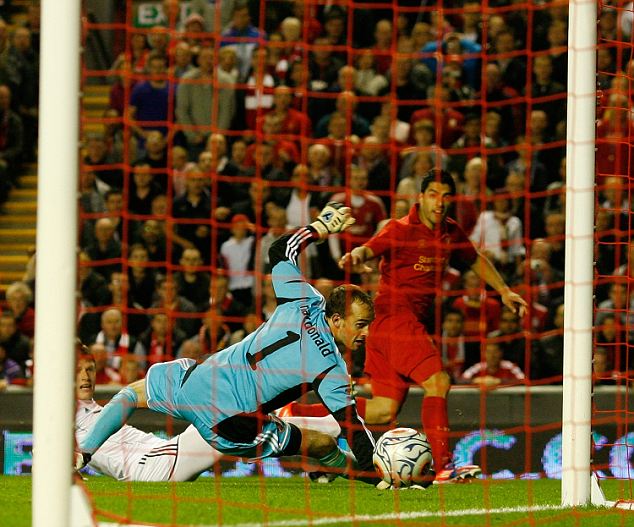
In the 69th minute of the most important derby in English football (that's still the case right?) Manchester United lead Liverpool 1-0 with the game obviously still very much open. An average team in Liverpool’s position would still expect to draw or win the game about 21% of the time, not ideal but nowhere near a lost cause.
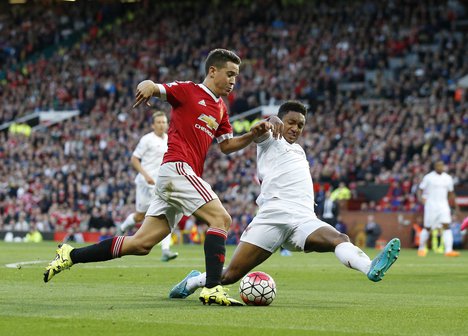
With United on the attack and the ball in the final third Carrick plays a weighted ball through to Ander Herrera who latches onto it on the edge of the penalty area. Right here Gomez has a decision to make, he can accept that his positioning wasn't great but just try and track Herrera as quickly as possible, or he can try and redeem himself with a last-ditch tackle near the byline.
Unfortunately for Liverpool Gomez attempted to make up for his poor positional play with a rash tackle on Herrera, fouling him in the process, and greatly diminishing Liverpool's chances of getting anything from the game. It's alright saying it was a stupid decision to dive in with hindsight, but let's try and put a value on the decision Gomez made.
Say there are two different options for a defender in this position, he can either:
- Act aggressively - Attempt to win the ball, or block the ball by sliding in.
- Act conservatively - Stay on his feet and apply as much pressure to the forward as possible without possibility of fouling.
We can have a look at the possible outcomes for each scenario and try and evaluate the value of each action. We're going to define value as the probability of a team scoring from a certain event, adjusting for the possibility of the opposition scoring as a result of the event's outcome when possible.
Aggressive defending: Going to try and split this up into 2:
- Value of a penalty
- Value of every other possible situation
Value of a penalty
- Penalty given away- in the past 15 years in EPL 80% of penalties have been scored so
Value of a penalty = 0.8
Value of other situations
- Player shoots - Shot conversion from wide penalty areas are converted about 5.6% of the time , more pressure probably reduces this probability, especially if the block rate is higher, so let's say 4-5%
- Player crosses - Let's assume high pressure on cross makes cross more difficult. A cross inside the box is converted about 5% of the time but let’s be generous and say pressure causes value to be about 4%
- Player is tackled before he takes an offensive action - Three things could happen here
- Tackle goes for a corner - 3%
- Offense retains possession - about 2-3%
- Defense obtains possession - 0%
I'm going to assume they all happen at a similar rate and take the average of these at 2% I haven’t got data on the probability that each of these events occur but they're all within range of a value around 2-5%. Based on what seems right, just from a spectators standpoint, I'm going to assume again that these all occur at a similar rate and just find the average to get a value of 3.5%. Obviously I'm making pretty loose assumptions but I'll show why this isn't too important in this particular situation later.
Value of everything else = 0.035
Conservative defending If a defender is conservative the possible outcomes are:
- Player shoots - Shots from this area are converted about 5.6% of the time, let's say 7% when not pressured.
- Player crosses – Crosses in the box are usually converted at about 5% similar to shots from this area, let’s assume slightly more and again say 7% in box when not as pressured
Value of conservative play = 0.07
Since both possible outcomes have about the same chance of conversion the total value is equal to the conversion rate. We are assuming that being conservative makes the opposition twice as likely to score compared to when defending aggressively, I’d like to think this is an assumption which , if biased, is favoured towards aggressive defending.
Expected Value
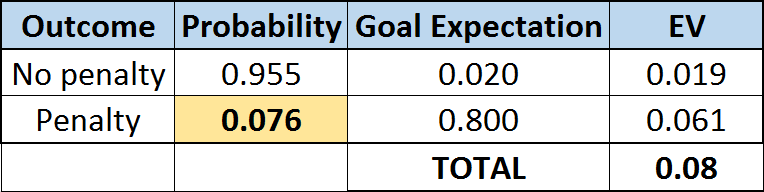
Okay then let’s do some math. The expected value of each decision is the number of goals the opposition would expect to score given a certain defensive strategy. In this instance (defending) we would want the lowest number possible. So the expected value of playing aggressively is p(0.8) + q(0.035) where "p" is the probability of giving away a penalty, “q” the probability of not giving away a penalty, and therefore p+q=1. The expected value of playing conservatively is 0.07.

From an expected value point of view it only makes sense to defend aggressively if p(0.8)+q(0.035)<0.07, or the chance of the opposition scoring is less than 7%. It turns out that this is only true if “q” (probability of giving up a penalty) is less than 4.6% which seems extremely low. Even if we assume aggressive defending decreases the value of attacking play to 2%, whilst reserved play increases it to 8% you’d need to have a less than 7.6% chance of conceding a penalty in order for being aggressive to make sense. So even when scoring is 4 times more likely when being conservative (which seems pretty extreme), you’d need to be very confident of not fouling in order for this to make sense
To endeavour to find an approximate value for the proportion of tackles that end up as fouls I decided to collect data for tackles attempted, tackles made, and fouls for premier league defenders over the 2014/15 Premier League season. Now not every foul made is during a tackle, although a foul is an indicator of aggressive defensive play so I decided to include all fouls. With these assumptions I calculated proportion of fouls as.
Foul% = Fouls / (Fouls + Tackles attempted)
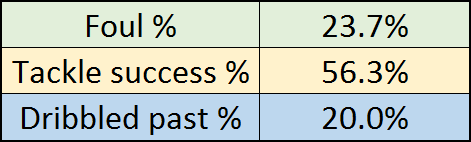
This worked out as 23.7% for Premier league defenders last year, Tackle success rate was 56.3% and defenders were dribbled past without committing a foul 20% of the time. From this it’s quite obvious to conclude that defenders should probably never be aggressive in the wide areas of the penalty area since the value of a penalty is far too high to make it worth risking a foul.
Even if you take into consideration referees swallowing the whistle, meaning refereeing calls are usually given less frequently in high leverage situations or in this case fouls in penalty area, it still doesn't make sense. In order for the foul percentage to fall from 23.7% to less than 7.7% there's got to be some serious whistle swallowing going on. If we go back to our original expected values of 0.8, 0.035, and 0.07, and assume the probability of a foul to be 23.7% we can work out the expected number of goals this would cost a team.
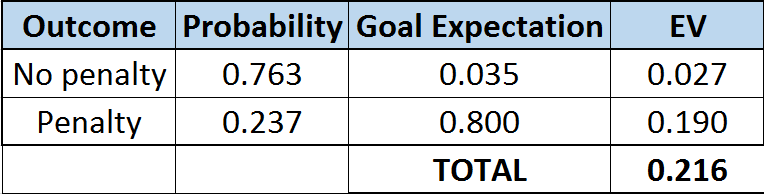
You can see from the table that attempting a tackle in the wide areas of the penalty box on average costs the team 0.146 goals (0.216 - 0.07 = 0.146), which may not sound much, but that’s about half of the goal advantage that an average team playing at home has over the away team.
Managers should be telling their defenders not to dive in or stick a leg out when opposing players are in the wide areas of the penalty box as it never seems to be worth the risk. I think the reason many defenders are too aggressive in this situation is that since defending is reactive compared to attacking being proactive, defenders may feel they need to be risk-seeking in order to make an impact, and in this case it isn't the optimal choice.
It's quite strange that this is the case because teams are usually too risk averse, although maybe attackers are risk averse and defenders are risk seeking, but the proactive attackers have more influence on the game overall, just spitballing but it's an interesting discussion. Just as I was writing this a perfect example of reckless decision making popped up on my twitter feed from the Barcelona vs Rayo Vallecano game, although I'm not even sure if you can class this as decision making.
There are many other situations like this where decision making can be analysed based on expected value and although this may seem like an obvious one from a spectators standpoint defenders still play aggressively in the wide sections of the penalty area. More accurate data will be needed for decisions less obvious than this one but it can still be done and can inform teams where they are losing goals based on decision making. If a team can save themselves .15 goals a game based on simple decisions like this they would save themselves 5.7 goals over the course of the season. In the end that really could be the difference between the club having a successful year and an unsuccessful one.
Have Expected Goals Caught Up With Gladbach?

 Gladbach were the hot topic around the soccer stat Twittersphere last Friday as they were hammered by generally woeful Hamburg. This dropped the Foals to 4 games, 0 points, 2 goals for, 11 goals against and very much in last place in the Bundesliga. First some context as to why this blew up: Gladbach have had 3 very good seasons in succession despite posting average-to-really bad xG numbers. This chart should help tell the story.
 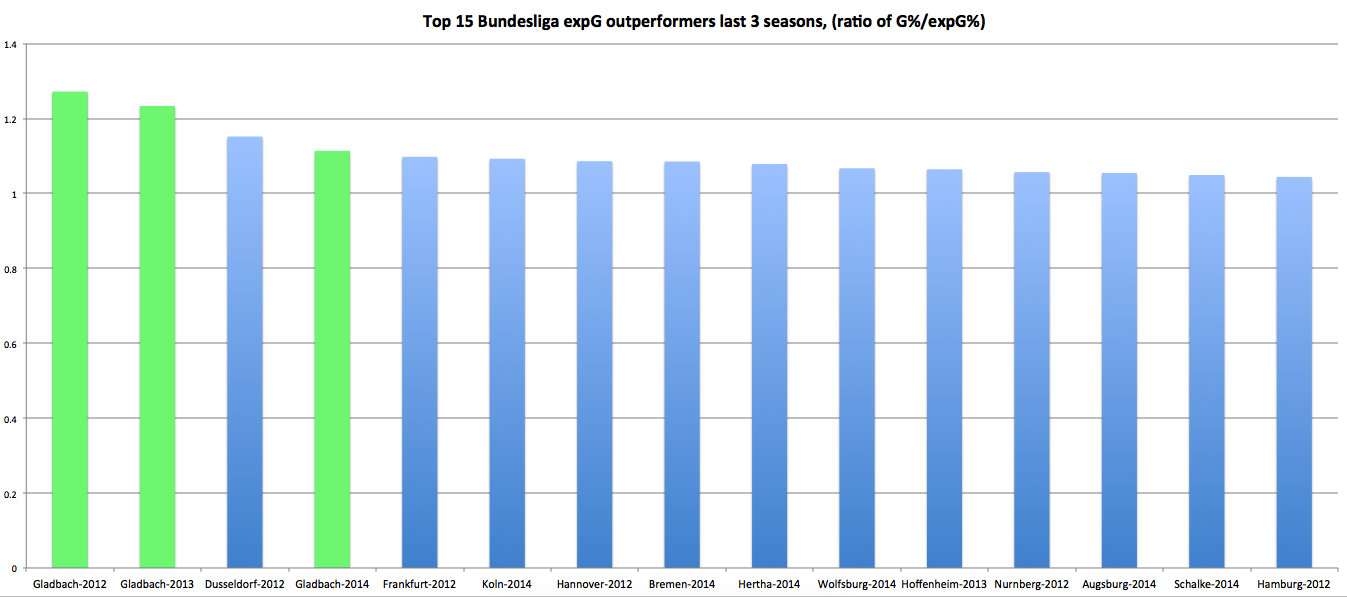 They had 3 of the 4 largest xGR outperformances in the past 3 seasons in Germany. I made the case in this article that they weren’t just a below-average team getting incredibly lucky, they were actually a good team being shorted by a model that didn’t cover what they did very well (mainly pressure opponents while shooting and then last season using a patient, multiple attack to get higher quality shots). The debate on twitter featured two StatsBomb legends coming out and basically saying Gladbach cannot beat xG long-term. Ben Pugsley said “Given enough time….barely any team is special” and Colin Trainor said it would be normal for some team to overperform xG 3 straight years given enough trials, which is true enough. Michael Caley hinted he thought the tactic had been collectively found out and that certain tactics could beat xG for a little bit before falling back to their underlying shot numbers. The 3-year run was over. In general the tone seemed to be, well this team has been lucky for so long, that now it is evening out. The insinuation being their true talent level during past seasons was reflected by the xG models and not the results on the field. I think in general this is a dangerous assumption to make and disagree in this case as well.
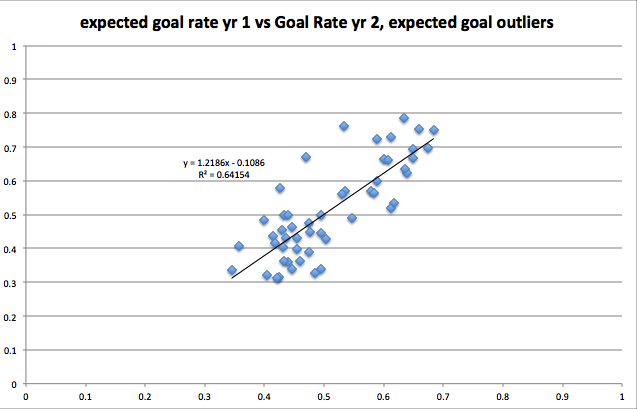
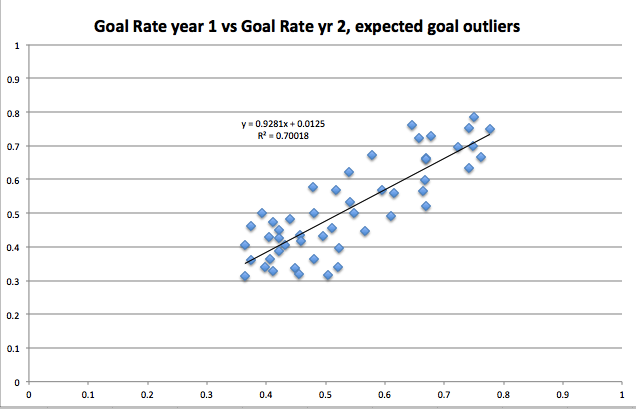 xG hasn't nailed enough outliers for me to be confident in proclaiming teams drastically lucky or unlucky based only on xG rate. I disagree with Colin and Ben, both of whom I have great respect for. I do so knowing I might be wrong and willing to engage with anyone who wants to bring their case in the comments or on twitter. Let me lay my case out first. I don’t think this is a team simply playing as well as they always have been and midnight has finally struck. There are clear indicators that this year, the performance is significantly worse compared to years past. So even though it’s been 5 games*, I took a look at what has changed for Gladbach. *For me, 5 games is plenty to look at trends of how a team possesses and defends passes. Passing stats stabilize a lot quicker than shooting stats, so they can reveal trends quicker than shots/goals. If 1000 player minutes is enough to start making judgement calls on some player shot metrics, team pass metrics have now had nearly 5000 player minutes so should be able to tell us something. Offense
 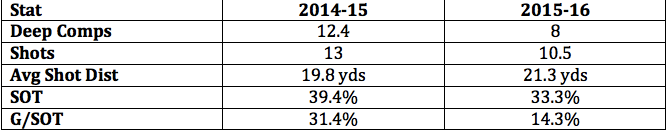 The raw numbers show the offense is clearly worse, but some digging shows things are acutally even worse than a 2.5 drop in shots seems on the surface. Last year they were the best team in the Bundesliga when it came to completing passes in dangerous areas. They were 2 standard deviations above average in deep areas. This year that is not close to the case. Let's see why. They can’t get up the field A league worst 1.2% of Gladbach’s completions come in the Red Zone (within ~20 yards of opp goal). The league average is 3% and the Foals rate would easily be the worst single-season rate in the last 4 seasons in the Bundesliga if they keep it up.
 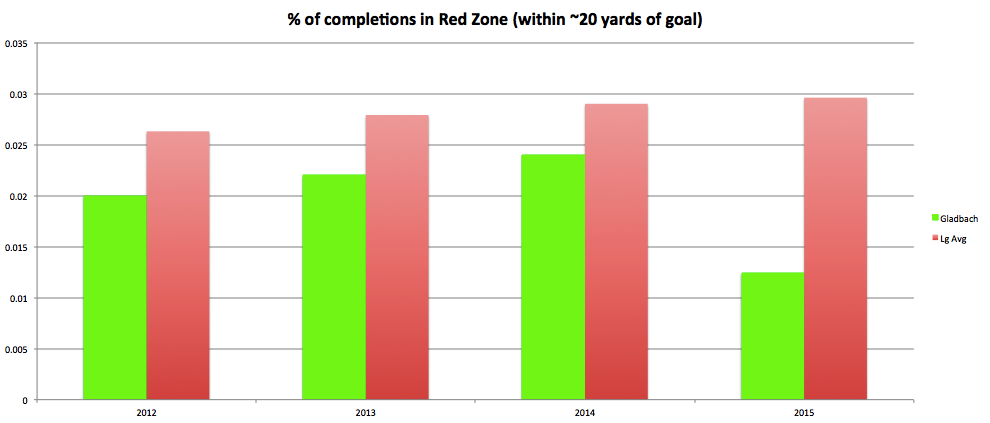 The problem intensified vs Sevilla as they had just 4 of their 353 completions in the Red Zone (1.1%). These completions are coming as a result of much longer passes as well. Last year their average pass distance for a Red Zone completion was the 2nd shortest in the Bundesliga at 14.1 yards, this year so far it has been the 3rd longest (behind only Ingolstadt and Darmstadt) at 21.6 yards. An increase of nearly 7 yards makes a significant difference in the amount of attempts you can expect to complete. So we see the problem, but where does it originate on the pitch? The Dortmund and Sevilla games were the largest hammerings and it seemed they couldn’t get out of their own half so I thought maybe they are just getting stuck close to their own goal. My eye test was not correct (a disappointingly common occurrence): Gladbach have moved into the opposition half slightly more often compared to last year. One possible problem this far from goal is that Xhaka has had to do way more offensive work in total and starts his work closer to goal as Stindl hasn’t quite replaced Kramer’s offensive production. Being so focused on one player to move the ball upfield doesn’t seem like it’s a great tendency for a team to have.
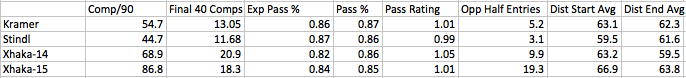
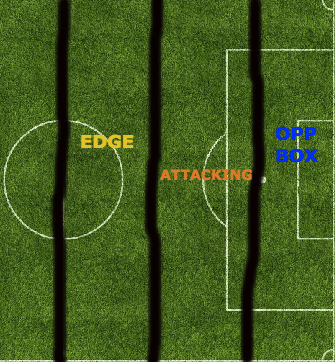
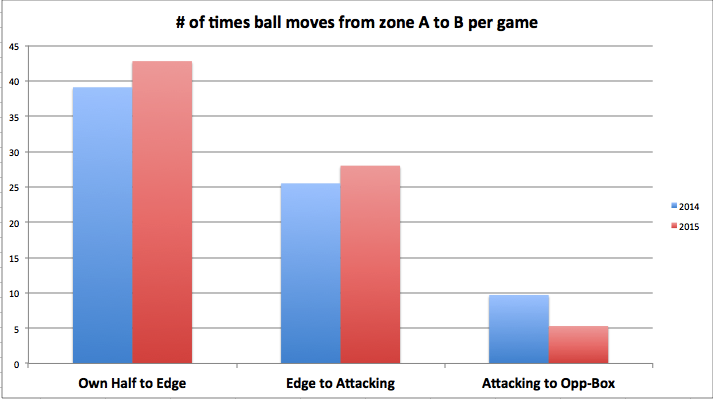 The big problem comes making the final leap, from the “attacking” area into the “opp box” area. Last year nearly twice as many completions were played into this area. It’s not a one-man problem when you see such a huge fall but the Max Kruse-sized hole shows up big-time here.
 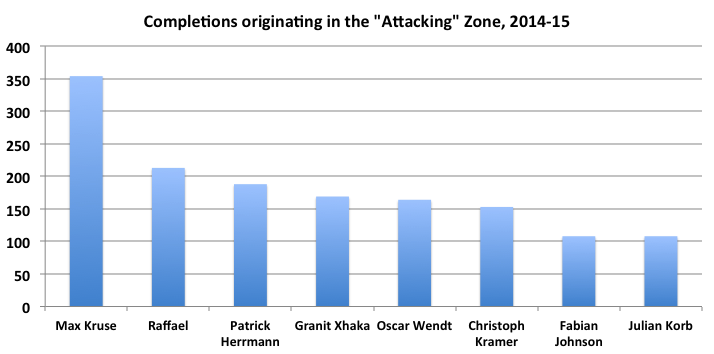 Losing Kruse meant when Gladbach gets deep this year they need to rely on players who were not as good a passer as Kruse was like Hazard, Traore and Hahn (who graded atrociously last season). Now the ball gets close but doesn’t get into a dangerous area as often. No one has increased their load to pick up the slack. When you can’t get the ball deep, you can’t get the number of options needed forward that allows you to have a multifaceted attack. If you want to get open shots playing at a deliberate pace, it’s not going to happen as often with hoofing long balls to a single striker. Gladbach aren’t getting as many different players up the field. Players like Xhaka, Patrick Herrmann, and Raffael are simply possessing the ball much less close to goal.
 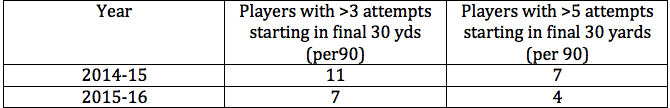 attempts here refers to passes Their extremely patient approach (.77 shots per pass attempt inside 20 yards last year) isn’t effective when you can’t get players forward and have the ball for long periods deep in opponent territory. They are now taking 1.13 shots per pass attempt, well above the league average. Defense
 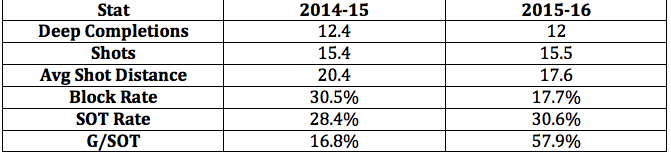 Here the raw numbers look essentially similar but the block rate and distance per shot are certainly worrying. So what’s changed on defense? Worse closer to goal In my piece on them last year, I concluded that their strategy of conceding the middle of the pitch and focusing on congesting their own box led to forcing opponents into more harried shots than normal and cutting off passing lanes that could lead to a better shot. This is seen by the “Last 3 Seasons” bars in the chart below. Also in that chart, you see that there is no such effect this season. Essentially the Gladbach defense is basically as good stopping passes near the goal as they are the rest of the field, which makes it hard to conclude they are getting good pressure on shooters.
 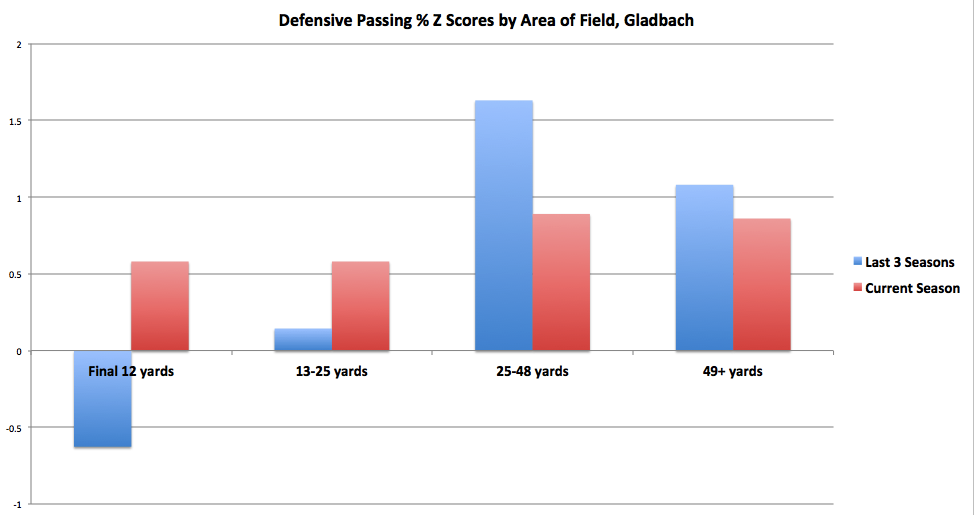 (Final 12 and 13-25 are combined in this season to get a reasonable sample size) The Film Room After inferring decreasing close-to-goal pressure from these passing numbers, I wanted to check with my own eyes. I watched film of every shot from the 5 games so far this season to count Gladbach defenders in the box. I then did the same with the equivalent fixtures from last year (except subbing in Hertha for Hamburg and missing a few shots in the Mainz/Dortmund games, shots that weren’t important enough to make a thorough highlight reel). The clear-cut chances stood out in a big way. Last season in 33 charted open-play, in-box shots, zero came when Gladbach had fewer than 3 defenders inside the box. This season in 45 shots, 6 have already come with fewer than 3 defenders. 3 of those shots have been converted into goals.
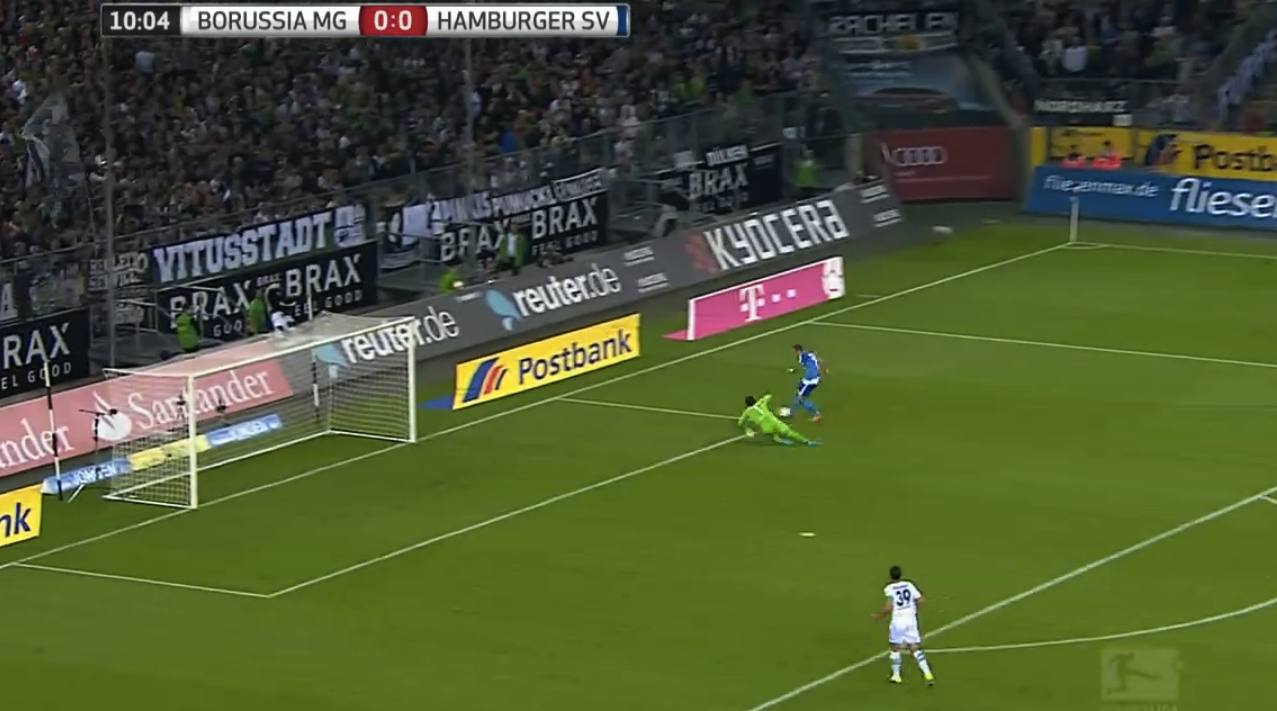
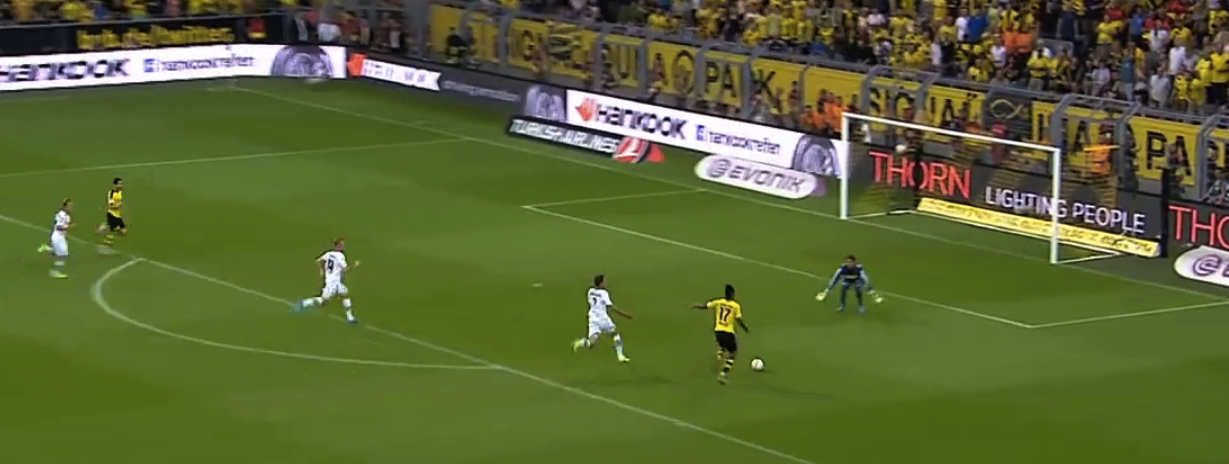
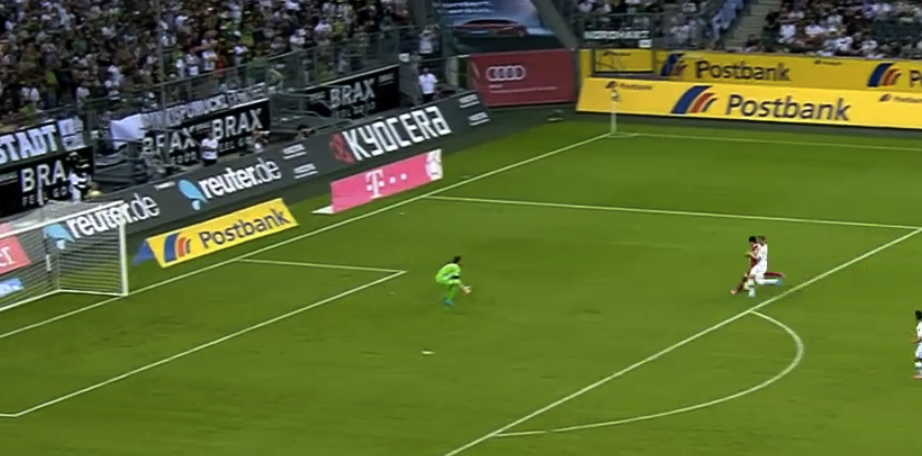
 There were zero shots like this last season in the sample. It’s clear that the pressure they have always applied in the final 25 yards, increasing the closer you get to goal, is simply not there so far this season. Teams are passing very well in these areas and have broken through over once a game to take a shot against a basically abandoned box. Those are things that simply never happened last season. Now teams can spend more time picking and choosing their shots, which will certainly increase the chances of a goal. So while their raw shot numbers look about the same, under the surface there are massive problems. There are no individual defensive metrics I feel comfortable enough to divvy out the blame on this one. I will say losing Kramer, a sometime starter on the German national team cannot have helped. Fabian Johnson was injured in the opener and hasn’t returned. Maybe most importantly Martin Stranzl and Alvaro Dominguez, center-backs who started 41 combined games last season have both been out injured with Stranzl just returning for the last game. Replacing them have been mainly kids (19 and 20 year old started at center back vs Dortmund). That’s 4 key players from last years defense who have played 2 combined games this year. I don’t know how much that hurts, but it certainly is imaginable that a system like this is hard to simply plug and play at 4 key defensive positions. Conclusions Maybe Gladbach just didn't have enough talent to withstand the loss of stars like Max Kruse and Christoph Kramer. Maybe those two are way better than most people thought. Maybe this style of football is very precarious and when you downgrade certain parts, it all falls apart more quickly than other, more normal styles. Maybe things will totally turn around over the next two months. Any of those might be true. I can't say for sure, but what I do think is there has been enough in these 5 games to say Gladbach are playing much worse than they did last season. We aren't seeing a continued true talent level from last season with the only change being a correction in the luck category, there has been a significant performance drop. I certainly don't think I have completely explained everything about this drop above, soccer is much too complex a game to have supreme confidence about basically anything, much less something like this after just 5 games. Their performance will certainly change going forward but conclusions about xG in previous seasons should not be drawn from this team right now. They are not doing the things that pointed to xG outperformance. Gladbach were the team that kind of re-focused my energies away from fine-tuning a xG model and more toward looking at how teams pass and play on the entire field. Even if in a few months it turns out that proof emerges that xG was absolutely correct all along, I don't regret shifting focus. I have a clearer picture in my head of how Gladbach from looking deeper into passing stats, and I hope you do as well. Expected goals is a great stat and I love seeing the xG table compared to the regular table, but it's not always infallible and even when it turns out correct it's best use might be as a starting point to further investigation. I feel comfortable saying Gladbach over the past three years have shown us weaknesses in xG models and that's exciting to me. It means we haven't really solved how teams become good. The wide, wonderful world of excel spreadsheets, R consoles, and Tableau maps still has much to reveal.
Top 6 Teams in the Premier League (by xG)
As was the case last time, these are offensive and defensive efficiency rankings for the Premier League teams. I’m defining offensive efficiency as xG created, divided by number of games played. So for example, if Man United created 10 xG in 5 games, its offensive efficiency would be 2.0 xG per game. Defensive efficiency is similar, but uses xG conceded instead of xG created. I’ve posted the big xG chart that ranks all the Premier League teams at the bottom, but for today, I’d like to focus on the best six teams of season so far. Thanks again to Michael Caley for providing me data from his ExpG model. So there you go. If you have any questions about my definitions or other things, please feel free to hit me up in the comments section. 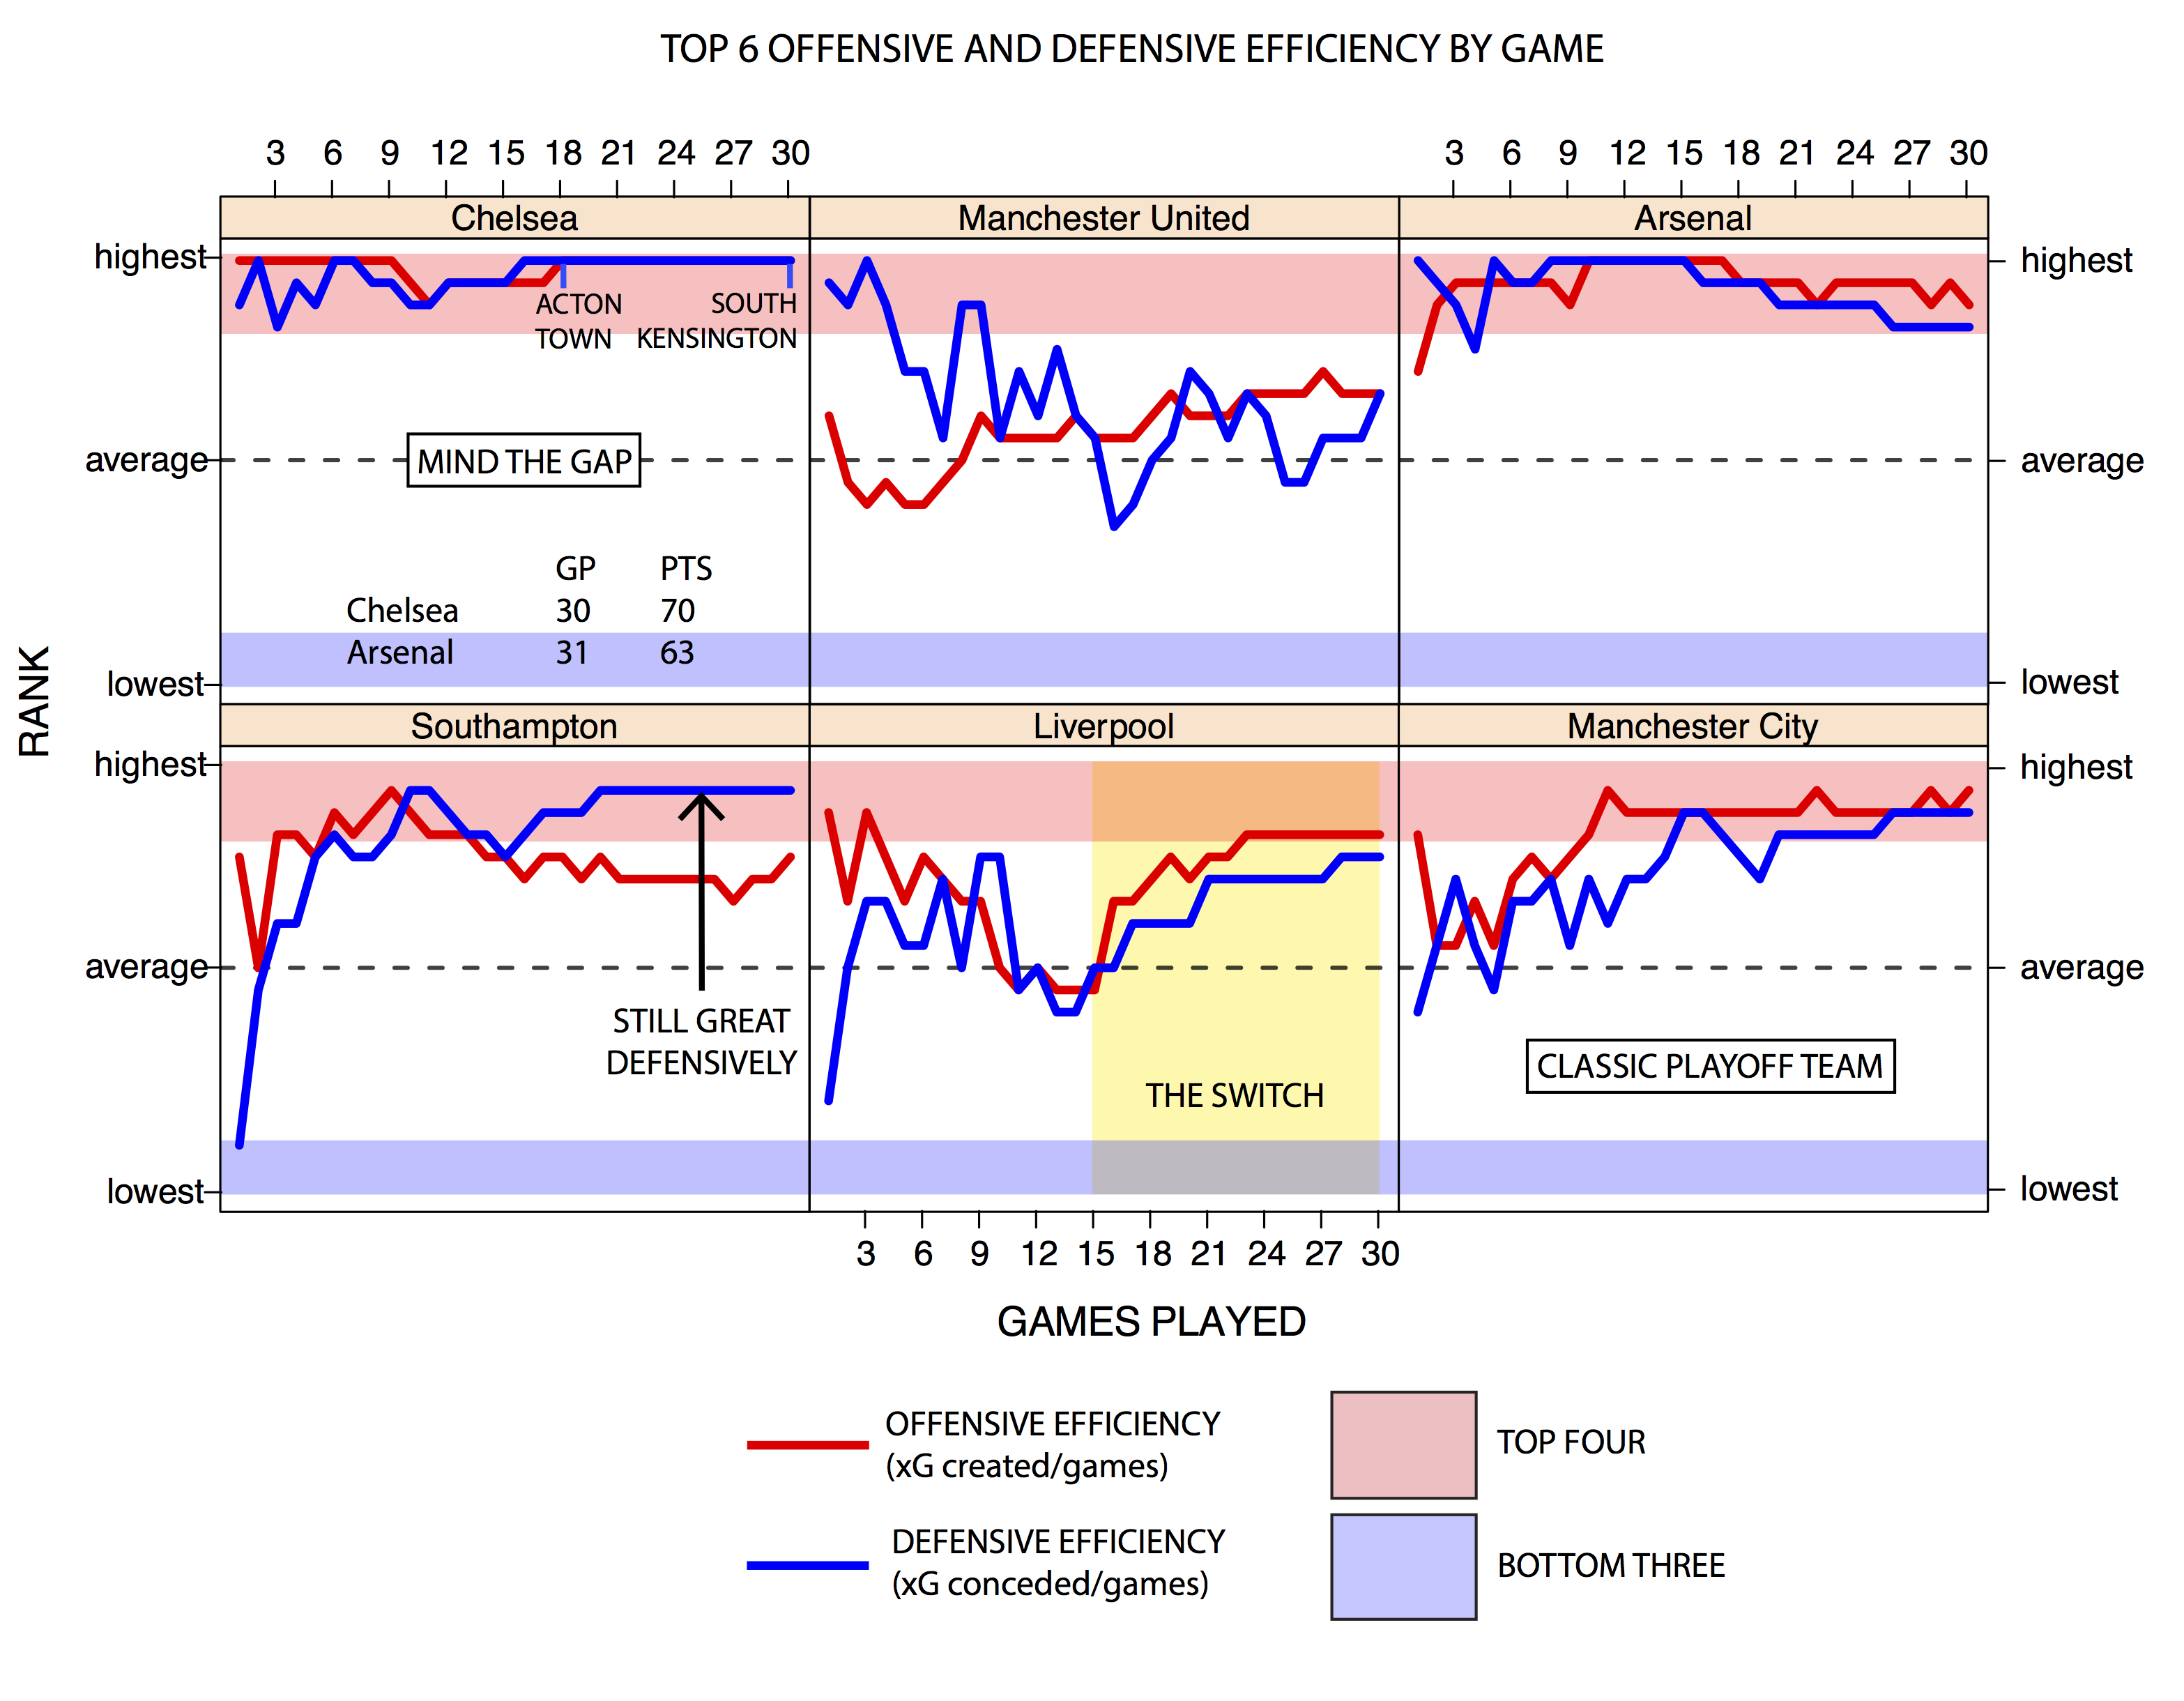 Green Shoots Losses to Arsenal and Man United may have slowed Liverpool’s roll, but Brendan Rodgers’ side has re-established itself as a serious force after a sticky start to post-Suarez life. As has been well documented, Brendan Rodgers made a tactical switch mid-season by shifting the creative burden to Philippe Coutinho in a playmaking role behind the striker. I’ll leave the curation of a more detailed narrative to Michaels Caley and Cox, but since Coutinho’s Arrival (yes, capital ‘A’), the Reds’ offense has developed into the shifting, cutting monster that we all hoped was still possible after the Suarez transfer. Liverpool has gone from a middle of the pack offensive efficiency of 1.22 ExpG/game, to a dazzling 1.69 ExpG/game, which comes in just below Chelsea’s league-best mark. You can cut that with all the qualifiers you want, but allow me one of my own - that’s without a fully fit Daniel Sturridge, who was one of the 10 best players in the league last season. The efficiency chart also shows that Liverpool have improved defensively since ‘The Switch”. The change isn’t quite as dramatic as what happened on the offensive end, but the Reds have squirmed their way to respectability. At 1.06 xG conceded/game, they are the midpoint between elite and league average. It will be interesting to see whether Fenway Sports Group (FSG) will delve into the transfer market to bring in some more talent on the defensive end. Lucas is good, but struggles with injuries each season. Emre Can is a talented footballer who has played well at
 left right back, but he got found out against Man United and might be better suited to a midfield role in the long term. There’s work to do, but this team is young, solid on both sides of the ball and has plenty of room to improve. It took a while, but this team has adjusted to life without Suarez and the future looks a lot rosier than it did even a few months ago. That’s why all this Sterling contract stuff sounds like hot air. FSG may have played hardball with Manny Ramirez back in the day, but this isn’t baseball. Football is just different, it’s a team sport and losing your most important player, which is what Raheem Sterling has become for Liverpool, will affect every facet of your team’s play. John Henry has recent, firsthand experience of what that’s like. This season’s reboot cost Liverpool Stevie G’s last chance at a title, Champion’s League qualification and years of Brendan Rodgers’ life! Why oh why would Henry have any interest in doing the same thing next season? King Louis It’s news to no one but your auntie, that Louis van Gaal and Ronald Koeman don’t like each other. This season, Koeman had the chance to deliver a body blow to his fellow Dutchman’s career, but he appears to have missed his opportunity. Think about it for a second. Last summer, van Gaal steered an unfancied Dutch team deep into the World Cup knockout stages. It was great news for the Oranje, but terrible news for the Red Devils, since it meant that Van Gaal took charge at the tail end of the preparation stages for the new season. He inherited a team that wasn’t so much ‘broken’ as not yet constructed. If you imagine Jose Mourinho starting this season at the head of a mutant crew sailing the Black Pearl, then spare a thought for Van Gaal who turned up at the docks ready to set sail, only to find a feverish Ed Woodward pointing excitedly at a bathtub filled with stacks of marginally different, mahogany Captains’ Wheels. By the time King Louis realized what he was working with, the only players available were overpriced and didn’t really fit into the scheme he intended on implementing. So he bought them anyway. For almost the entire season, Southampton has been a better team than Man United. The Saints pair elite defensive efficiency (0.96 xG conceded/game) with above average offensive performance (1.46 xG created/game). That’s good for an xG differential of 0.50 xG/game (1.46 – 0.96), or more than double Man United’s current xG differential of 0.21 xG/game. What we’ve seen unfold over the course this Man United season wasn’t a coaching masterclass, but a testament to the value of top class strikers and goalkeepers. Overtraining led to an injury crisis of biblical proportions and inflexible tactics meant long spells on the bench for some of the team’s most talented players. All season, Van Gaal’s team has been little more than above average on both sides of the ball. Yet with 7 games left, Man United sit comfortably among the Champion’s League places thanks to a sky high PDO (still the highest in the league according to @ObjectiveFooty’s ‘Main Table’). Despite the pedigree of some of their players, the Red Devils are rather Pulisian in the way they try to muck things up. Just like Pulis’ teams, they slow the game down; they don’t mind trading in attacking opportunities for solidity on the defensive end. This tactic works for Pulis, because his teams are usually underdogs. Slowing the pace down condenses the game, and a shorter game means a greater chance of a random outcome (e.g. that the lesser team gets a result). It works for Van Gaal because he’s willing to bet that in a game of few opportunities, his strikers and his goalkeeper will be more clinical in taking their chances than yours. And that is exactly what has happened. Wayne Rooney and Co. have scored 36.9% (again from @ObjectiveFooty) of their shots on target. That’s the best team scoring percentage in the league. Also best in the league is David de Gea’s 75.0% save rate. That’s impressive on it’s own, but things get really crazy when you look at where he’s saving shots from. 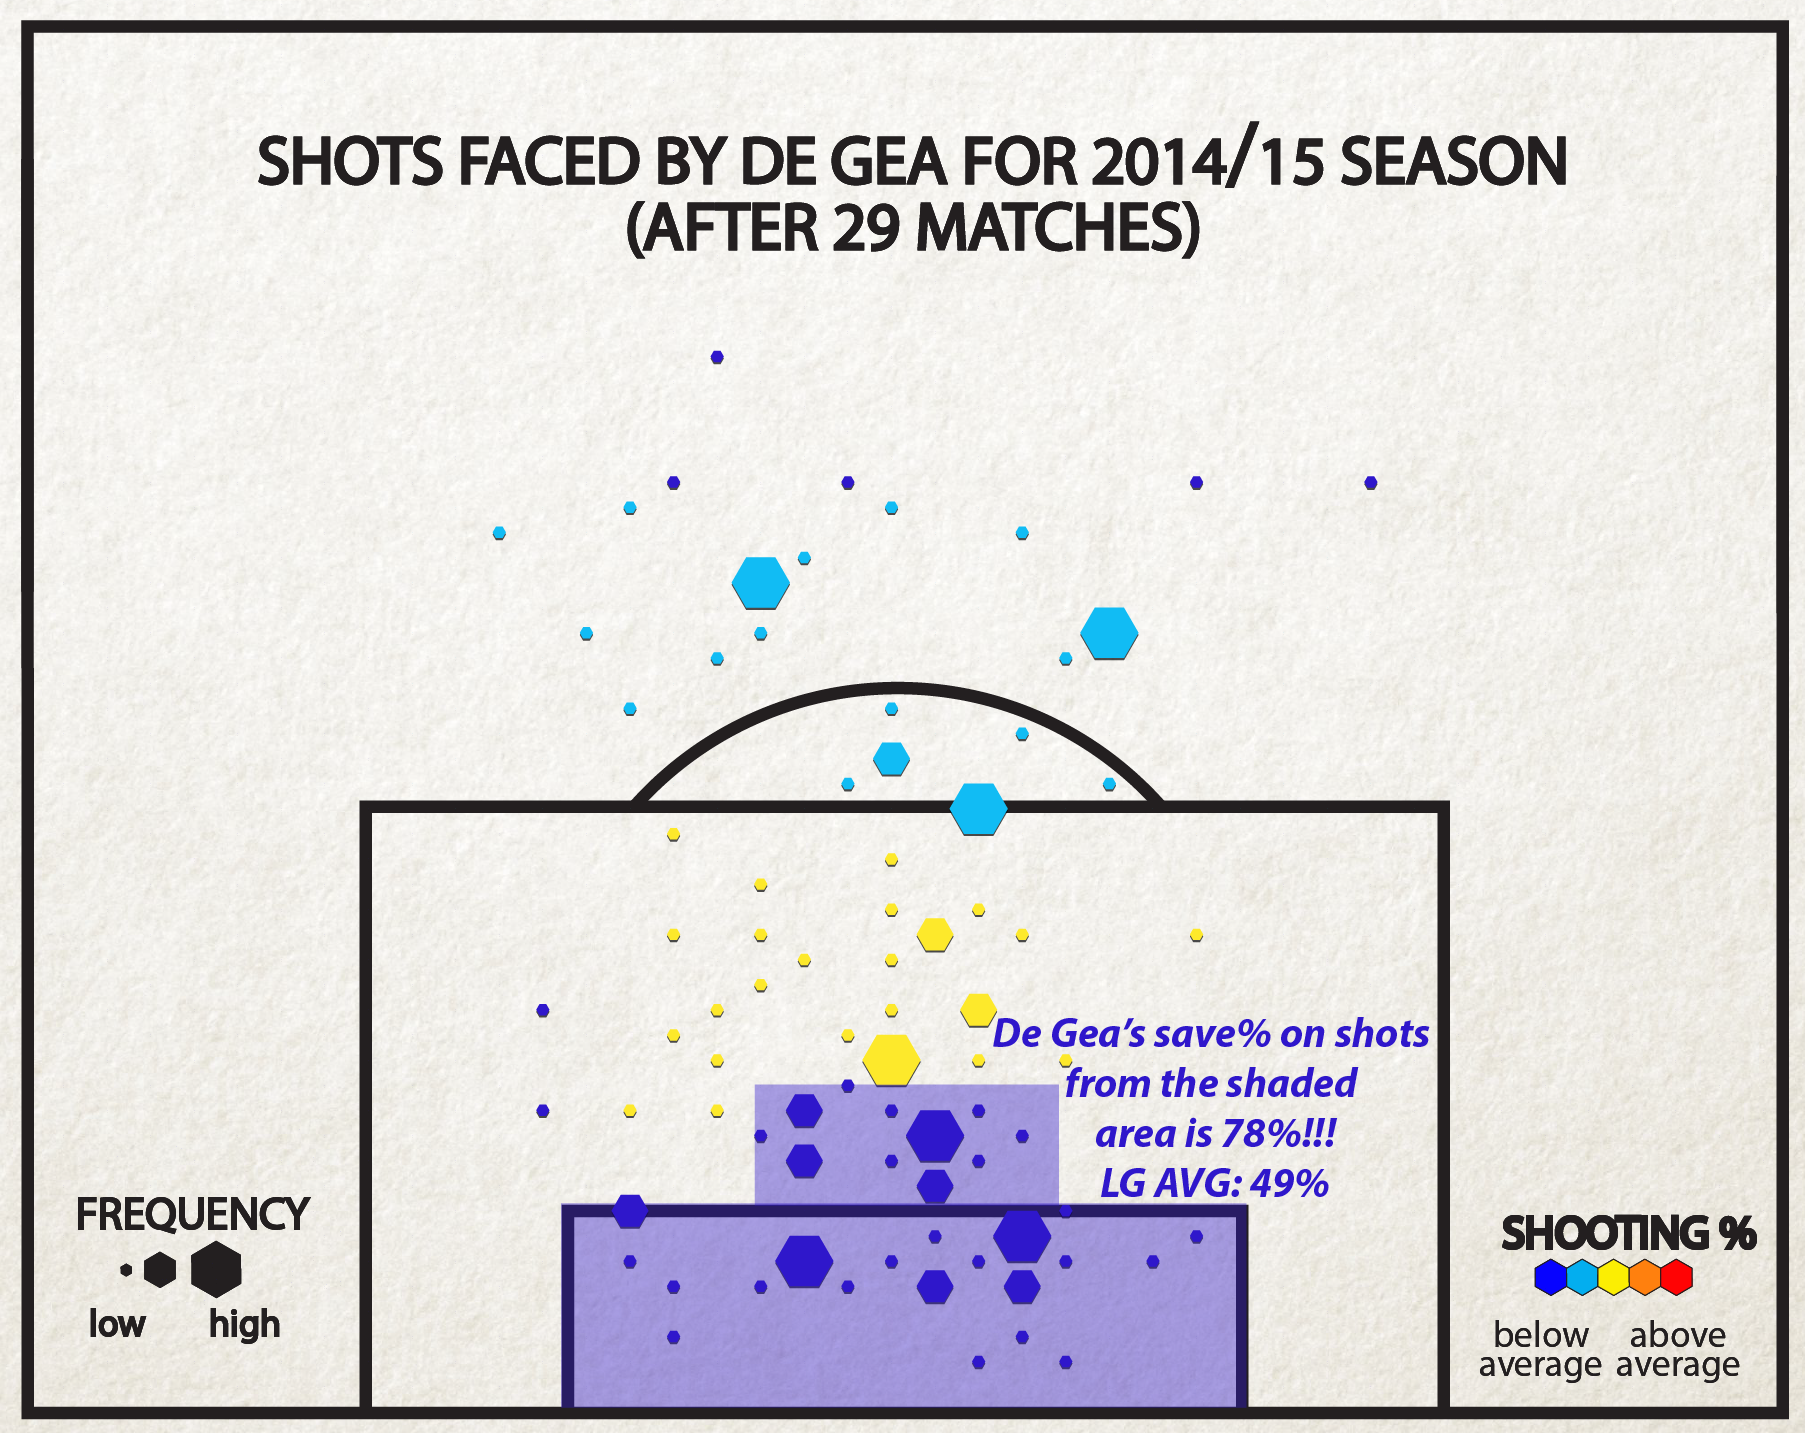 Shots on target from the shaded area are normally scored at a 51% clip, yet Man United’s opponents are converting these shots at a meager 22% (6 of 27). A league average keeper could reasonably be expected to concede 13 goals on that many shots from these areas – De Gea has conceded only 6. Clearly this is unsustainable; his save% from these areas close to goal is better than his save% from the other less dangerous areas. But it may not matter… Van Gaal’s men are 8 points clear of the chasing pack and look like a better side each passing week. This summer, King Louis will spend again, but this time, he’ll have time to pick his targets and an uncluttered offseason to mold his team’s identity. Had Southampton managed to clinch a Champions’ League spot, it might have been curtains for Van Gaal, as ownership grew skittish over the terms of team’s lucrative shirt sponsorship. Instead, it’s Koeman looking for answers ahead of Morgan Schneiderlein’s probable departure and, God forbid, the potential burden of Europa League qualification.
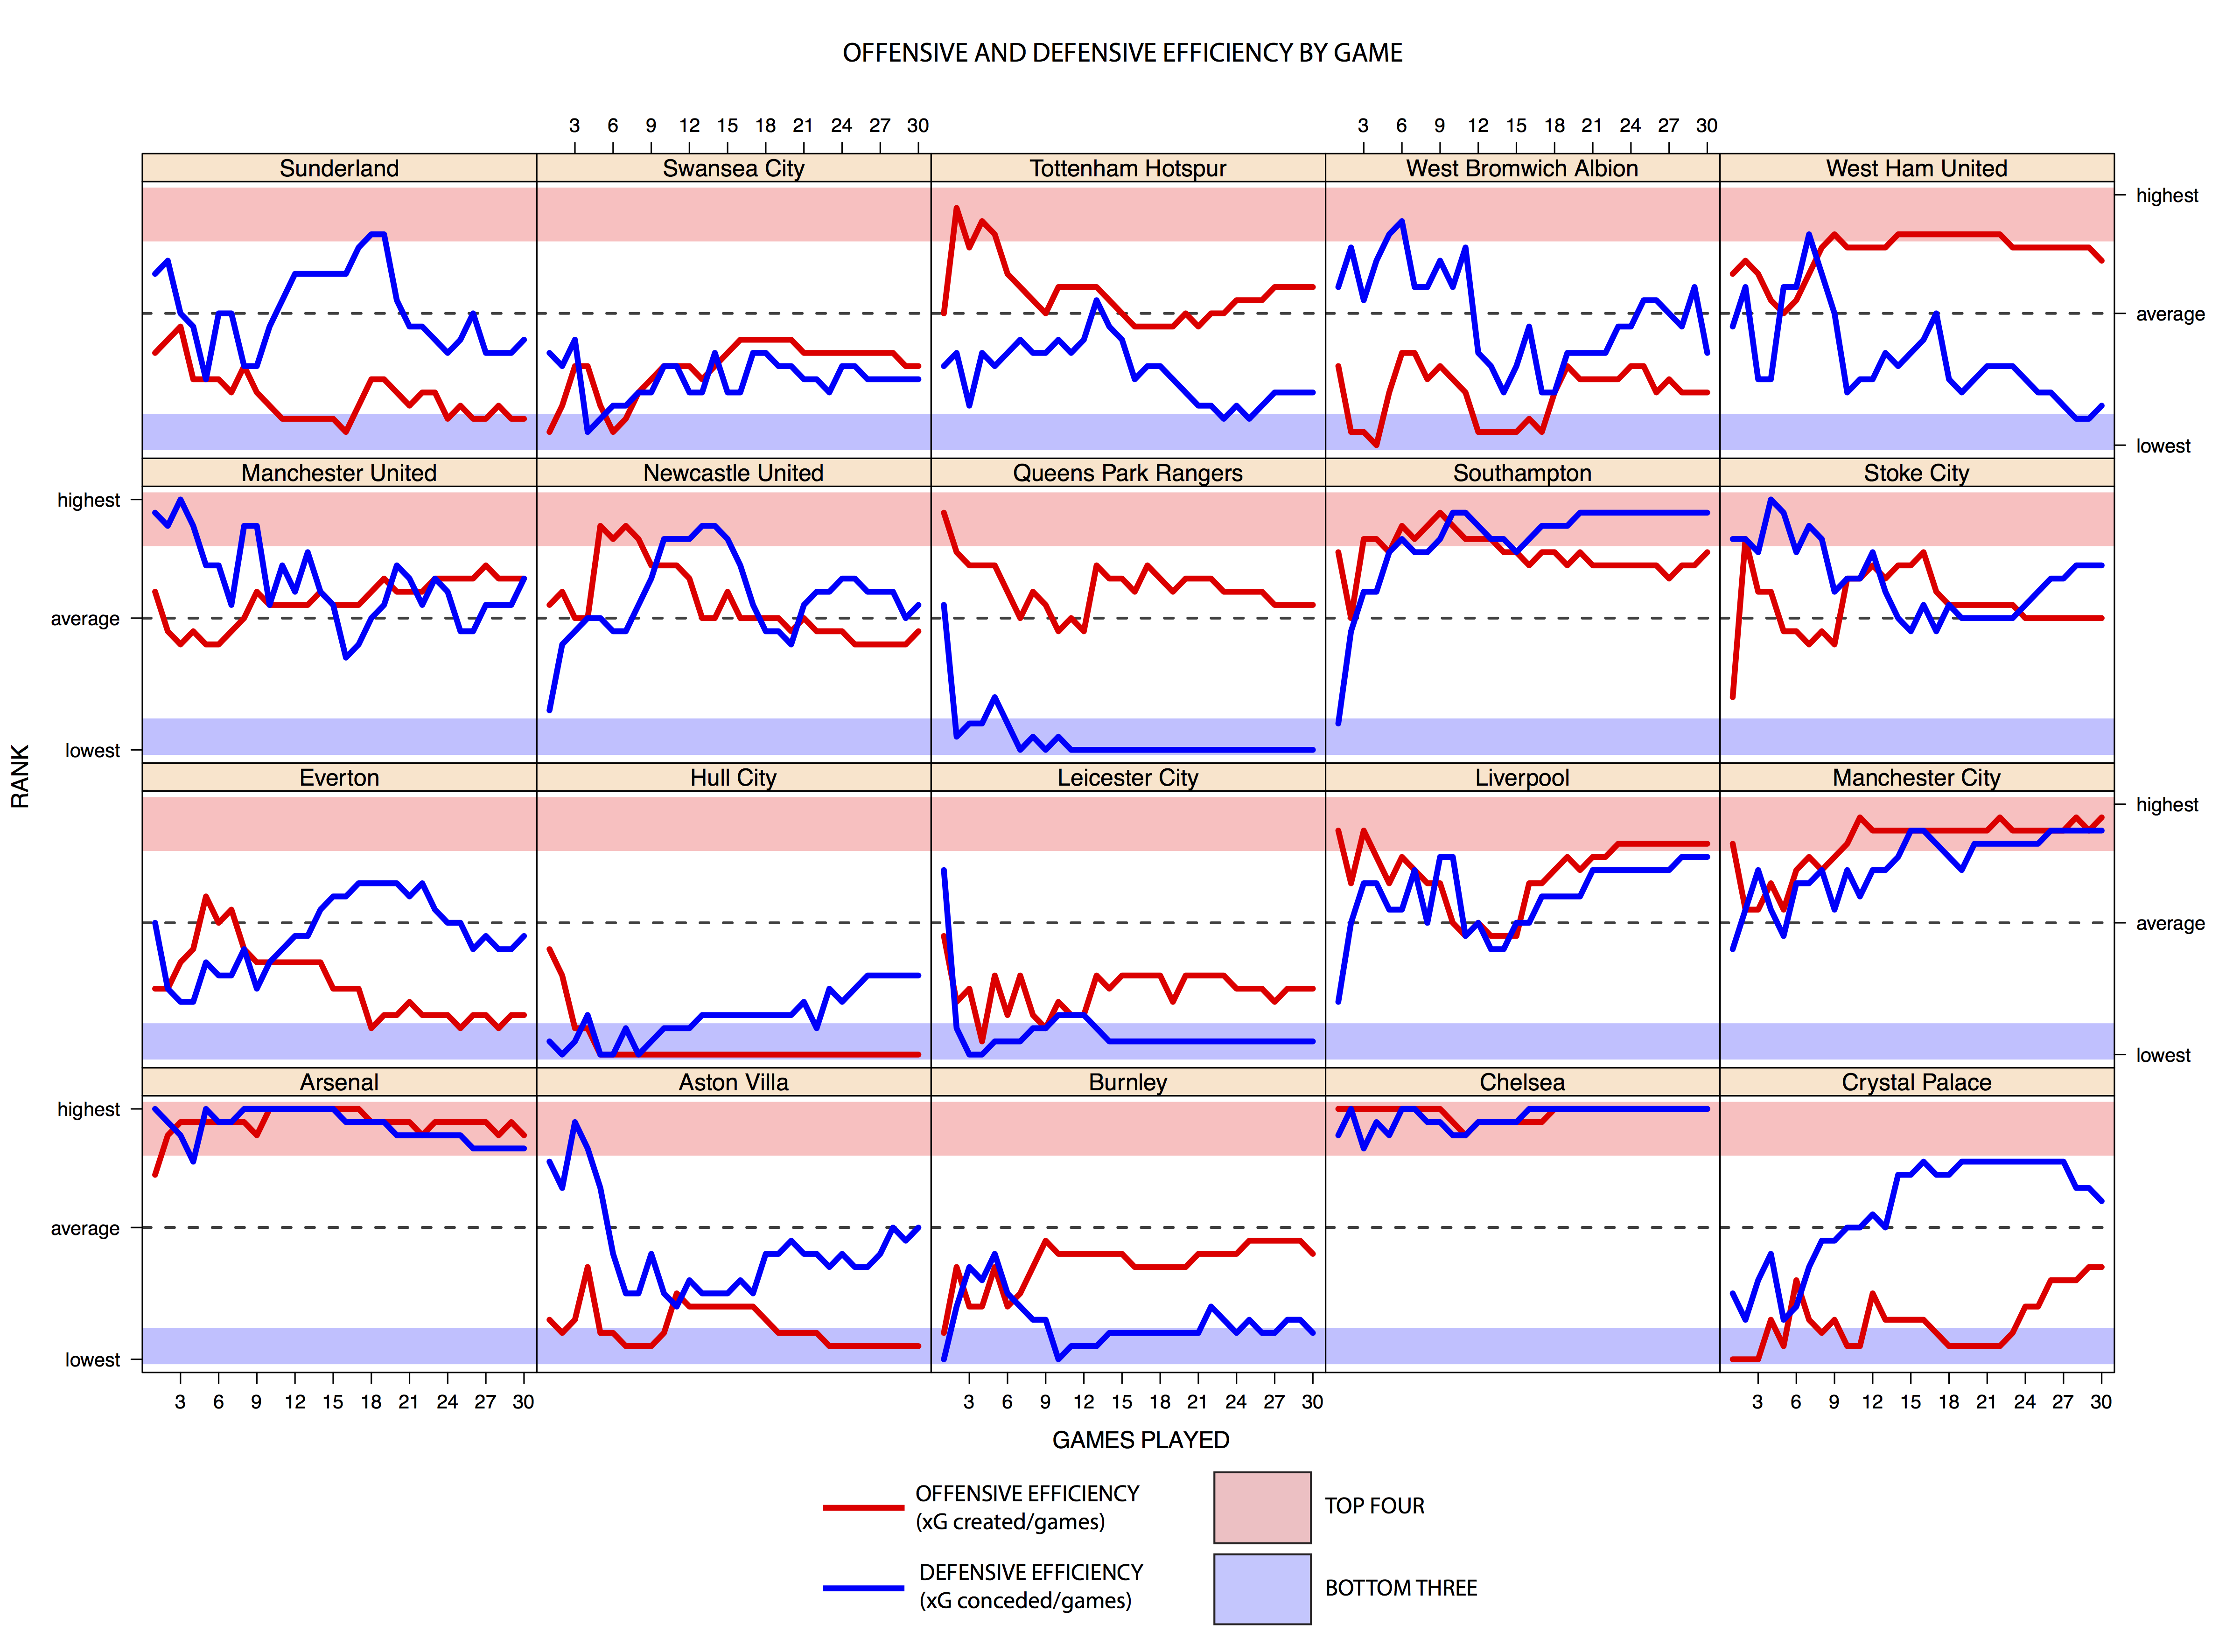
Alex Ferguson Doesn't Care About Your Expected Goals Models
The Past is a Foreign Country; That’s Why It’s So Easy to Critique
When the facts have seeped out, when you’ve had time to think things through, it's all so obvious: Germany had the best, deepest squad in the tournament; Luis Suarez can make any manager look like a genius; and "c'mon, you never realised he was on 'roids?".
Haha! Totally joking about that last one... Totally. #GTL.
But some things defy explanation, they just sit there as you examine them, laughing back. Some things are like Manchester United’s final season under Alex Ferguson.
Okay, maybe I’m overstating it a little, but that 2012/13 season is a puzzle.
United cruised to the title, closing things out at Villa Park with a couple games to spare. RVP, Shrek and the Buoys clubbed together to score 82 goals in 38 games, gifting Alex Ferguson his 13th and final Premier League title.
So far, so good.
What's odd is that United posted the stats profile of a good, but certainly not great, team. Total Shot Ratio (TSR), usually a pretty good indicator of quality, ranked United in 8th place for the 12/13 season, sandwiched between Southampton and Newcastle. On its own that's not a game-changer, after all, TSR would have put Spurs atop the league that same season. But even Expected Goals (ExpG) models, which take into account more complex shot data like distance from goal and where the pass prior to the shot was played from were are flummoxed by how this version of United so drastically outperformed expectations.
Whatever Remains, However Improbable, Must Be the Truth?
That, apparently, is the opinion of Dan Altman.
"I computed the probabilities for the 2012-13 season... For Manchester United, the difference between expected goals and actual goals was sixteen. Without those sixteen goals, Manchester United probably would have finished fifth instead of first."
That's a quote from Altman's latest piece in the New Yorker on the same topic, in which he uses his bespoke shots model to break down exactly how United overachieved offensively.
His conclusion? Multi-dimensional luck (more or less)[1].
Luck on penalties and own goals. Luck on free-kicks and corners. And then some more luck converting chances in open play. He says that if you ran the season back in his shots model, United would be extraordinarily unlikely to score such a high number of goals again. In which case, the team probably wouldn’t have won the title, in which case, Alex Ferguson might not have been quite so quick to retire, in which case the world would be short a great wordsmith, (and Davey Moyes wouldn’t be aging in dog years).
Altman’s points are pretty convincing, especially in the light of how much United have struggled since then, but even he admits that the odds of this level of over-performance are pretty fracking long.
Which is why there might be a different answer. I’m not saying he’s wrong, but I think there’s an explanation that demands shorter odds.
Just In Case, Here’s What We’re Looking At
Usually, when I'm looking for an answer, it helps to take things down from the abstract clouds of ExpG models and put them into a form that’s more easy to understand.
Here’s Man United’s shot chart from the 2012/13 season.
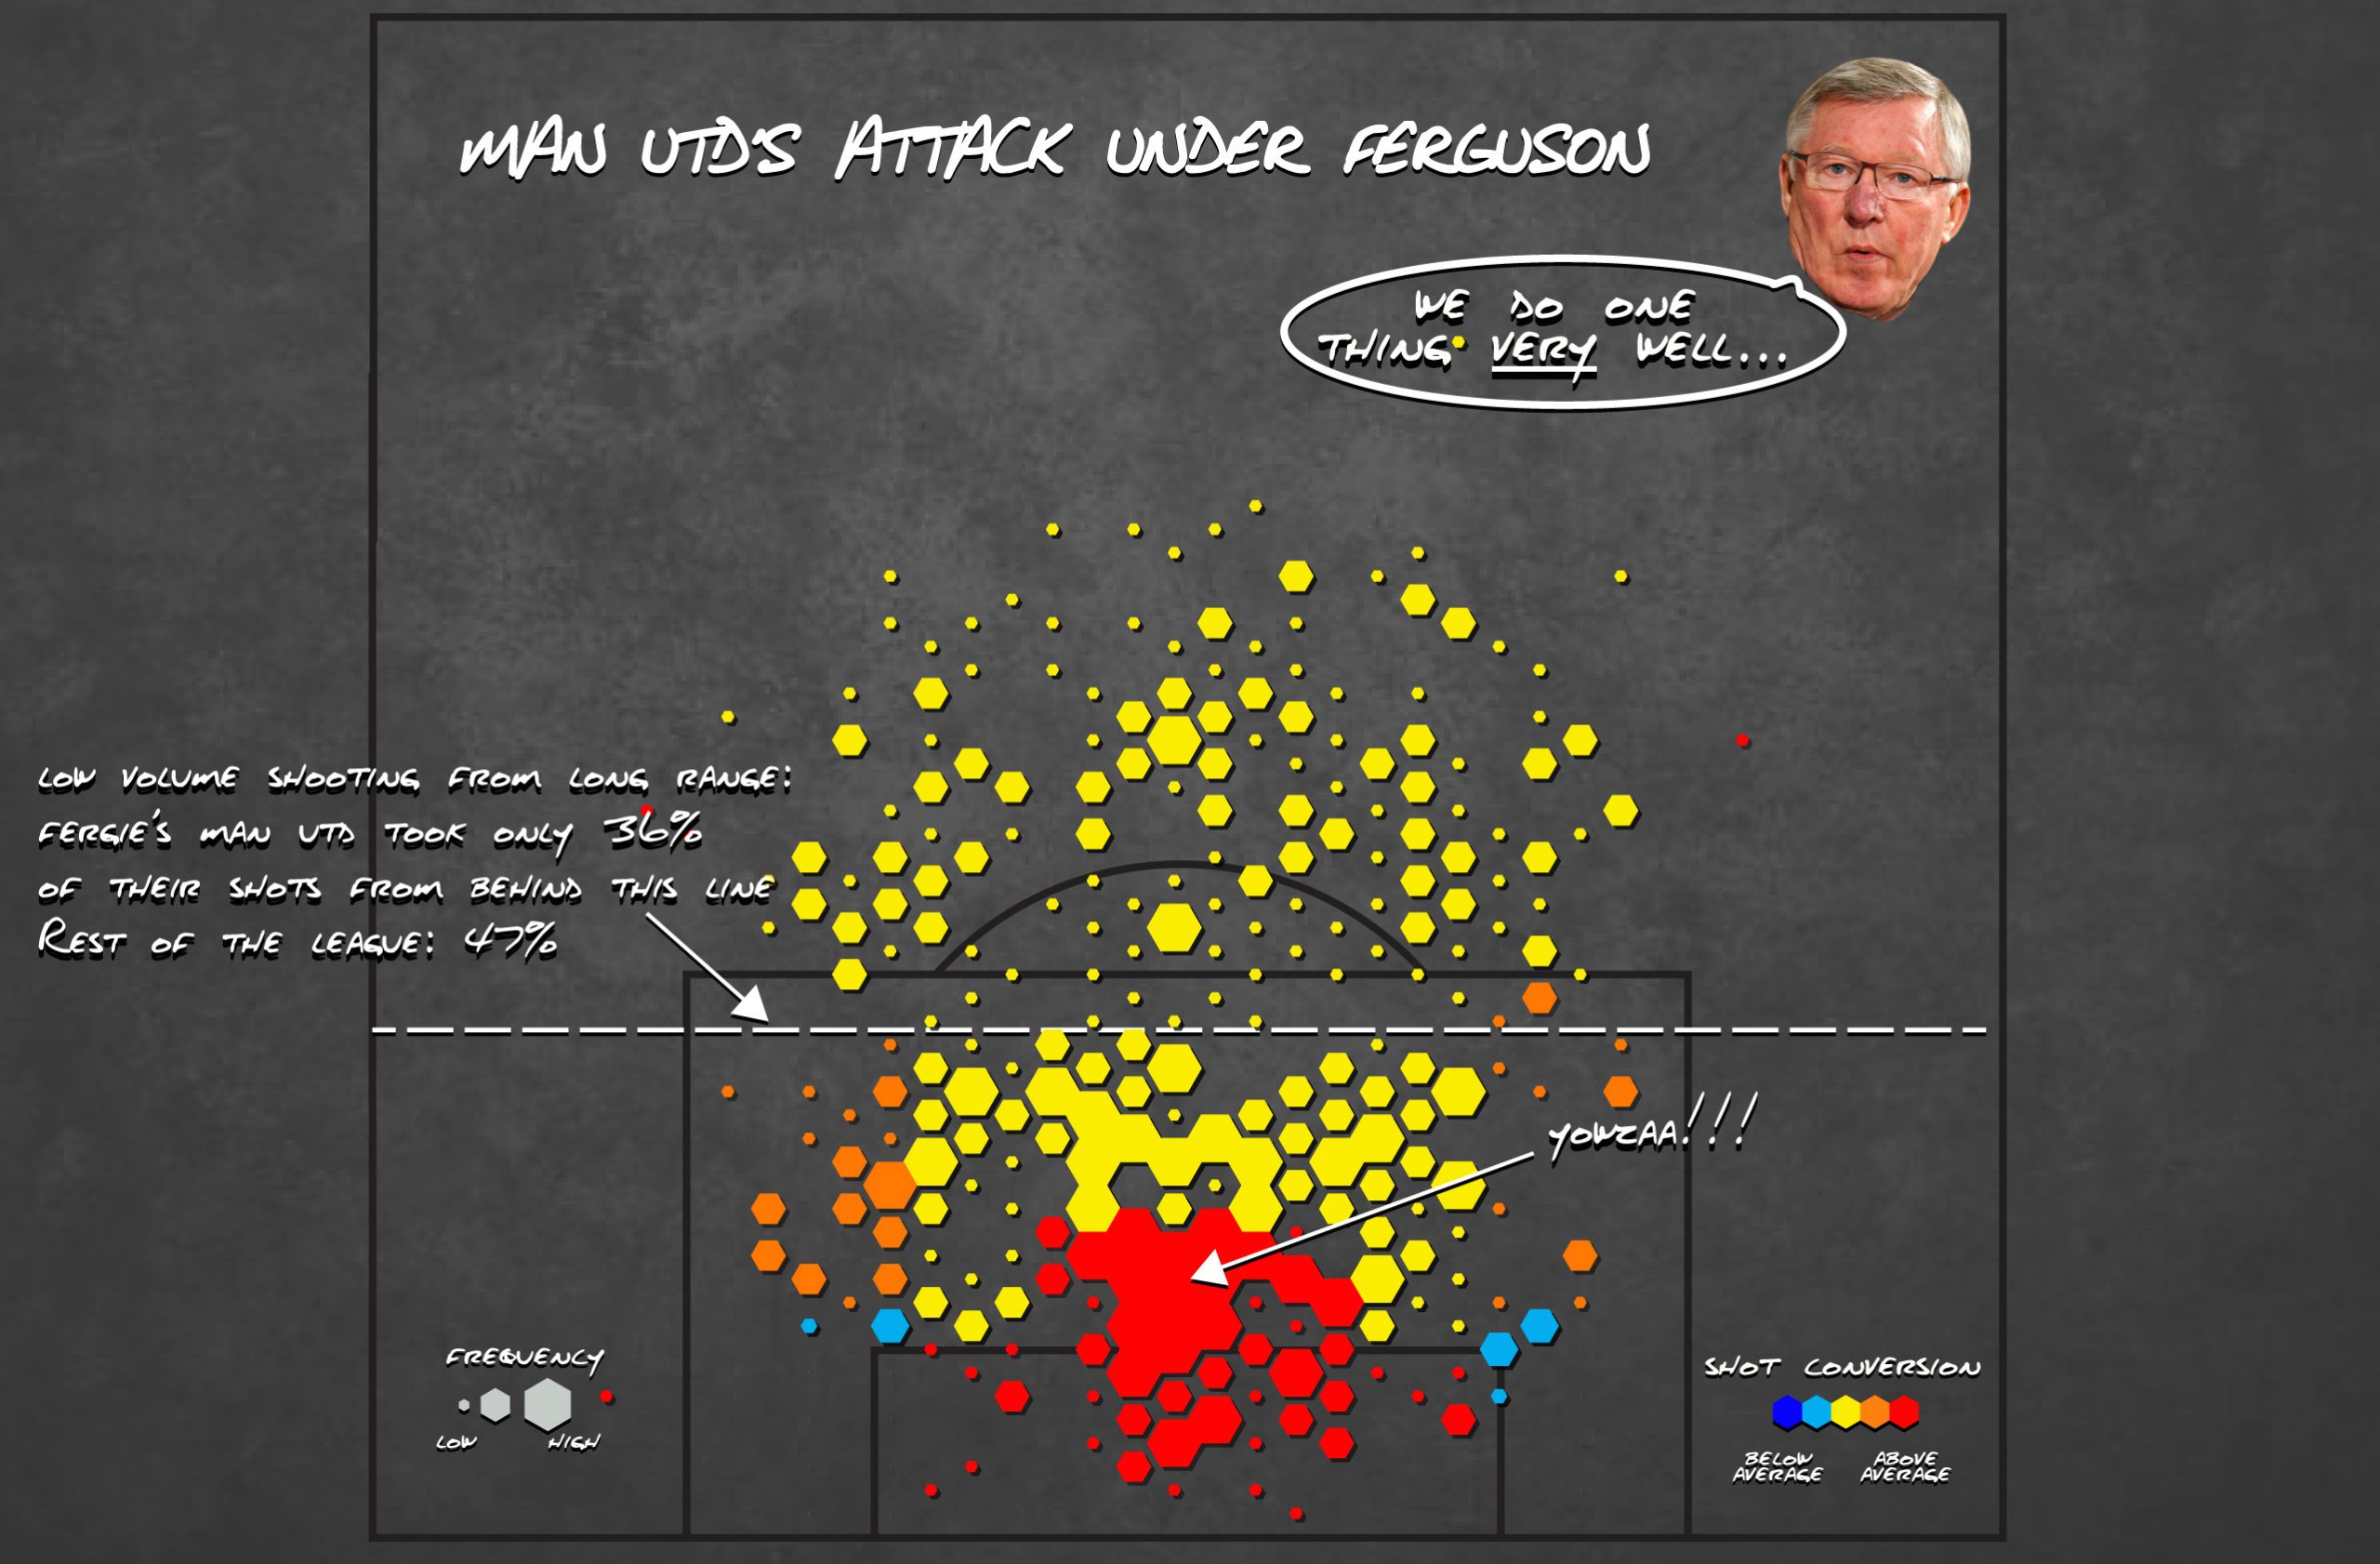
One thing is probably going to stick out to you - that big red clump with the YOWZA!!! annotation (or maybe you're a data hipster, in which case you're probably into the five light-blue hexs). When Altman says Man United overachieved their expected goal output, this is why. In Fergie’s last season, Man United took the juiciest shots in the game (close to and directly in front of goal) and squeezed, and squeezed, and squeezed some more. The shots in that bright red area were converted at roughly 13% above what you would expect the average Joe (Allen) to do with the same opportunities. By my calculations, based on the number of shots, that's worth somewhere between 17-18 goals over the course of the season.
(I swear I'm not making this up...)
Now, Marco Van Basten’s one hell of goal-scorer, but a) He retired in 1995, and b) He never played for United. Robin Van Persie did, but he's just one (non-superhuman) dude, and he didn’t take ALL of those shots…
At any rate, other than that one scorching zone, United are surprisingly average finishers – a couple points stronger on the wings, but nothing to write home about[2].
Hmmm…
You have to say, it doesn’t look completely random. It’s not like United are lights out from a bunch of unconnected areas. This is a team that is PHENOMENAL at scoring in one area.
Why? Well if you want answers this morning, you’re shit out of luck. I’m tired and I’m looking forward to the latest episode of Serial.
Tune in for part two tomorrow.
[1] I’m shortchanging Altman a little bit here. He also talks about things like RVP's finishing quality, but you can read it yourself, ‘cause, you know, the Internet.
[2] Interestingly, this version of United doesn’t shoot a lot from distance, which probably goes some way to explaining the low TSR numbers, if not the ExpG anomolies.
Comparing actual and expected goals
Based on this year’s figures, Luis Suarez is an exceptional goal scorer. Daniel Sturridge less so…!
[Dramatic pause for effect.]
Now that the bomb is away, let’s focus on the stats.
This article is written to explain how one could compare what was expected to happen (based on some statistical model) and what actually happened, and how to quantify how likely that result was, in the end. It may appear to somewhat overlap with my previous article on the statistical significance of comparing metrics, but it should be stressed that both pieces have been written to illustrate methods, using data for demonstration rather than to focus on the particular data analysed.
Goal expectation (ExpG) models have been growing like mushrooms in the football analytics community. Some analysts have published the details of their models; others have kept the calculations to themselves. In general, these models take into account a number of factors affecting the probability of a shot being scored and assign a numerical “goal expectation” value to each shot. This way, one can assess the performances of players in terms of scoring by comparing the actual number of goals scored compared to what would be expected given the nature of the chances they took.
This article is partly motivated by this post by Mark Taylor in which he indirectly highlight the fact that knowing the total ExpG figure of each player/team is not sufficient, but one needs to know how that ExpG breaks down i.e. the ExpG value of each shot. The reason behind this is that the distribution of the ExpG figures will affect the probability of scoring 0, 1, 2, … goals etc.
Armed with this, I’ve set about to check how the number of goals actually scored by a player compares to what was expected from him, given the chances he took. I’ve used the goal expectation model that was developed by Colin Trainor and myself, introduced in this piece and whose results have been used on this site.
Let’s start with the Premier League top scorer. The following chart depicts a histogram of the ExpG of his shots:
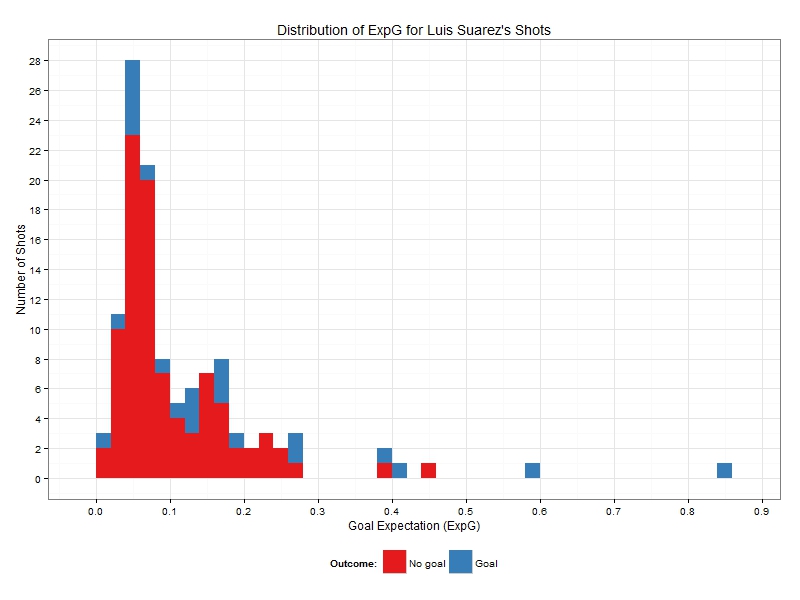
More than 50% of his shots have an ExpG figure between 0.02 and 0.08. A few of his shots arise from even more difficult chances but there are some shots from relatively good positions including a couple which he was odds-on to score (and he did). I should note here that other analysts may have different numbers depending on how their models calculate ExpG, but that is not that important right now as the same theory applies but the results may differ slightly (I presume).
Based on our results, the total ExpG figure for Suarez’s 116 shots was 13.8 goals. Instead, he found the net a total of 23 times. If we assume that the ExpG figure assigned for each shot closely resembles the goal expectation of that particular shot from an average player, we can calculate the probability of a player actually scoring 0 goals out of 116 similar shots to the ones taken so far by Suarez. That would be given by:
Prob( 0 goals ) = ( 1 - ExpG_1 ) * ( 1 - ExpG_2 ) * …. * ( 1 - ExpG_116 ) = 0.0000000653 = 0.00000653%
where ExpG_i is the goal expectation of the ith shot. Similarly, we could calculate the probability of our average player scoring 116 goals which would be:
Prob (116 goals) = ExpG_1 * ExpG_2 * … * ExpG_116 = 0.000 … (total of 124 zeros!) … 000217
Obviously, both probabilities are very small. We could sit down and write down algebraic expressions for the probability of the average player scoring 1, 2, 3, …, 114, 115 goals too. [For the statistically-oriented readers, that is the probability distribution of the sum of 116 Bernoulli variables which don’t necessarily have the same success probabilities (given by ExpG_i in each case here)]. Instead of doing that, we can simulate these shots/goals and look at the resulting distribution. Out of the 116 shots Luis Suarez took, the average player would score goals with the following distribution:
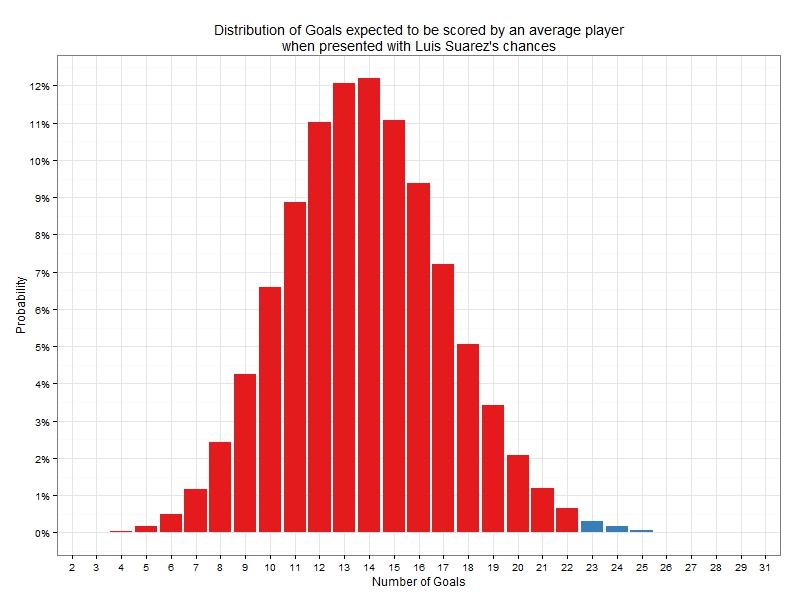
As designed, the average would be 13.8 goals, but inspecting the whole distribution is much more revealing. The probability of an average player scoring 23 goals or more (i.e. equaling or surpassing Suarez performance) is just 0.6% and is highlighted in blue in the chart above. This indicates how exceptional Suarez’s goal scoring performance has been this season.
If we repeat this process for Daniel Sturridge and his 63 shots the goal distribution is as follows:
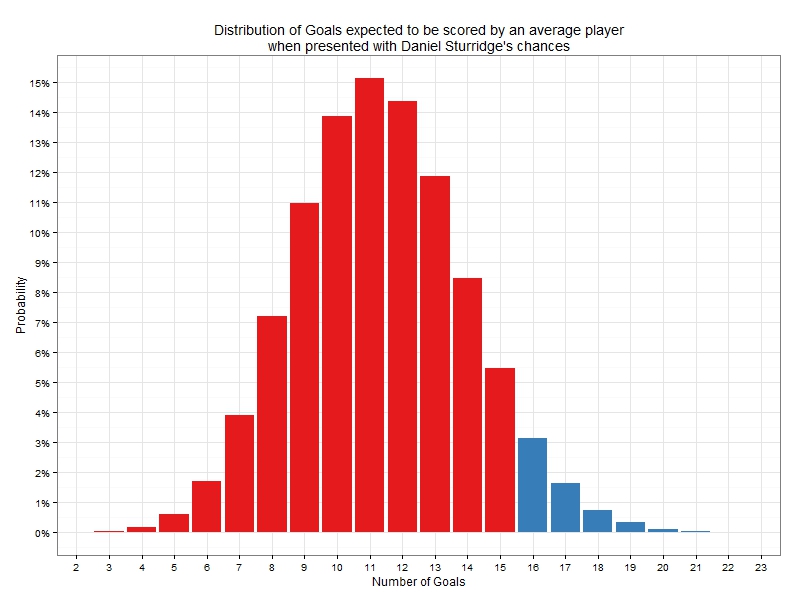
The probability of an average player equaling or surpassing Sturridge’s tally of 16 goals given the chances Daniel took is 6.1%. It’s still low, but not as impressive as Suarez’s.
I’ve carried out the same analysis for all players who scored an arbitrarily chosen number of 9 or more goals in the Premier League so far this season and calculated the probability that an average player would equal or exceed the observed performance (i.e. the number of goals scored) of each player. Note that the penalty goals (or misses) need not be removed from the simulation, as they have been assigned a higher ExpG value which reflects the goal expectation of those shots. The resulting probabilities are shown in increasing order in the following chart:
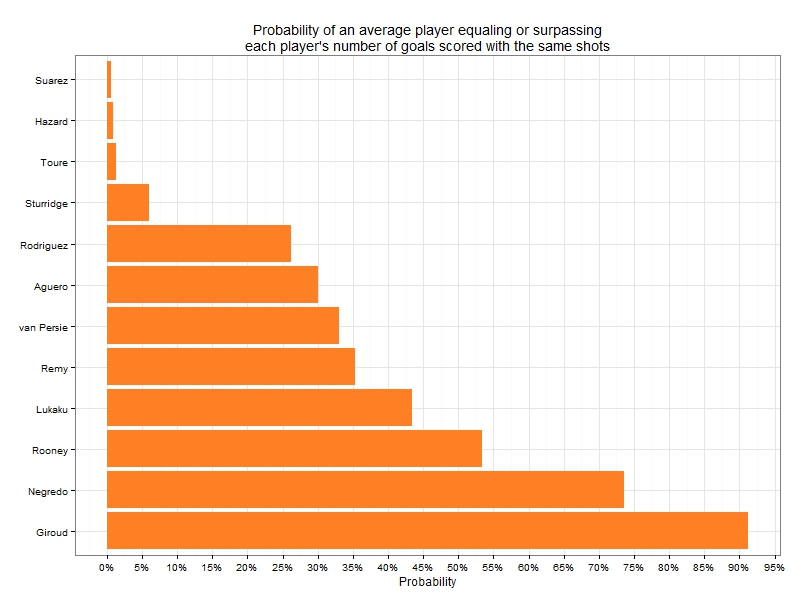
If we were to use the 5% significance level, only 3 players (Suarez, Hazard and Yaya Toure) have demonstrated statistically significant, above-average, goal scoring performances once the nature of their chances has been taken into consideration. They are followed by Sturridge who narrowly misses the cut. However, the remaining leading goalscorers have not demonstrated any exceptional ability in converting their chances and in fact, players like Giroud and Negredo have been vastly underperforming in terms of the number of goals they actually scored compared to the number they were expected to contribute given the chances they took. Especially, in Giroud’s case, the 10 goals scored compared to the 13.6 he was expected to score given his chances, constitutes serious underperformance which suggests that perhaps Arsenal should be looking for reinforcements in that area in the summer.
As a concluding remark, I’d reiterate that this is a method to compare actual versus expected goals scored which does not make any unnecessary distributional assumptions on ExpG. It can therefore accommodate comparisons either in terms of specific players who could have a non-homogeneous shot profile (e.g. including shots from favourable positions, penalty shots or long range attempts) or even be used to evaluate a team’s scoring performance. Finally, it can be applied from a defensive standpoint to evaluate how teams or goalkeepers have prevented shots from being scored.
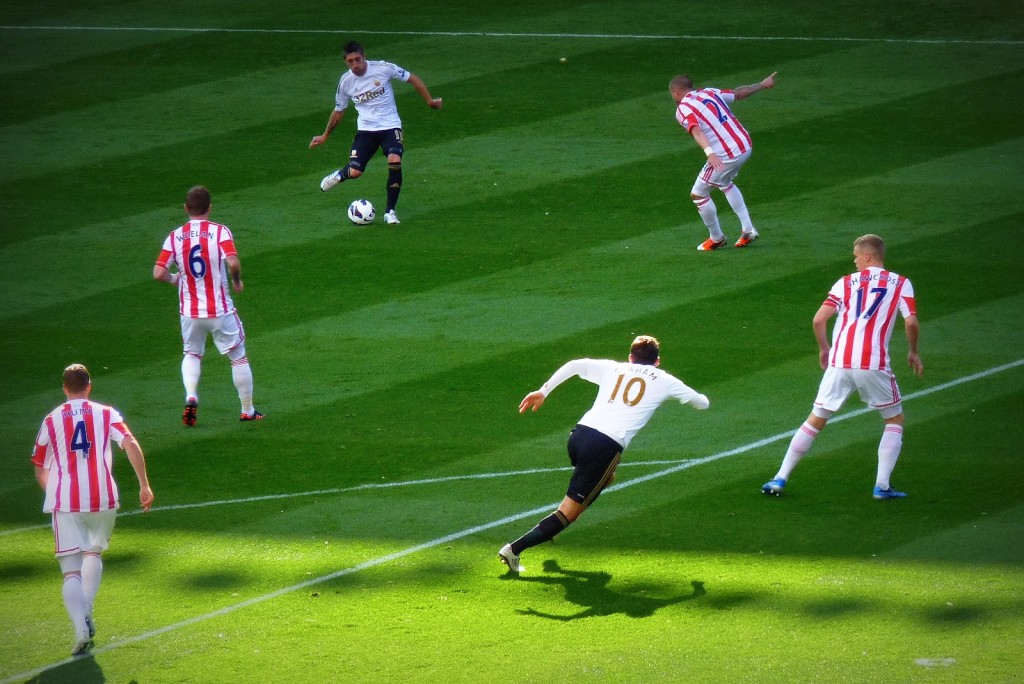
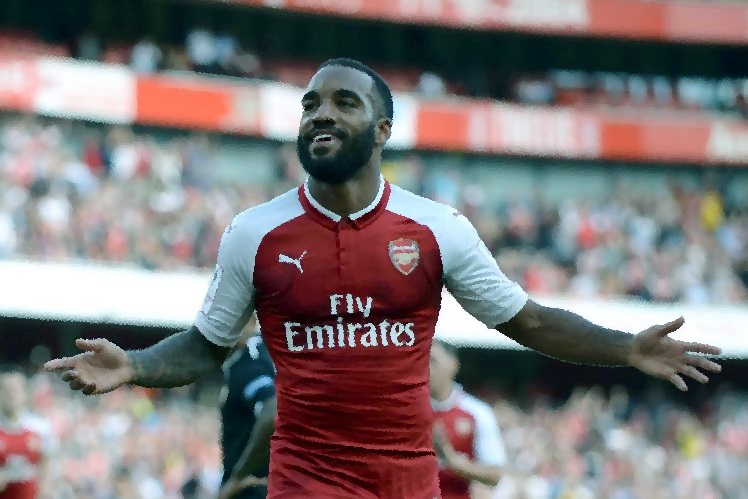
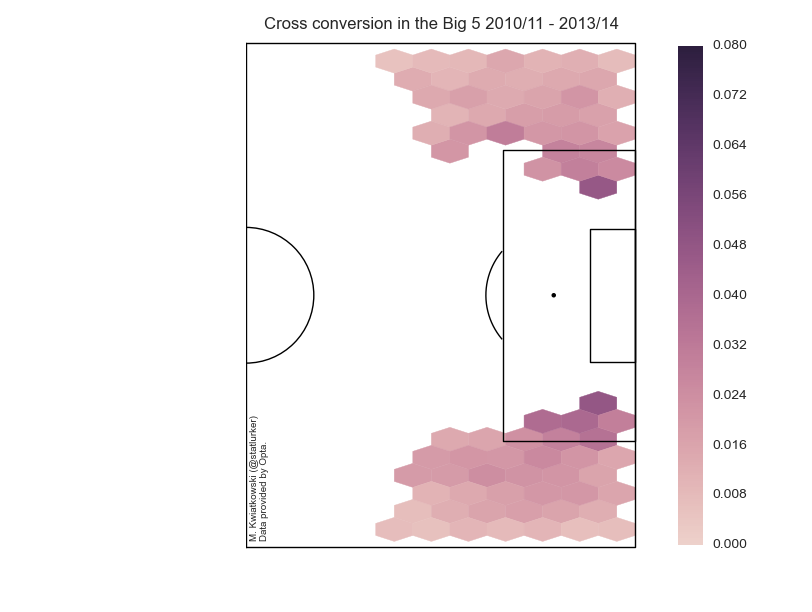