Goldman Sachs and the World Cup

Despite having over 700 billion dollars in assets under management, Goldman Sachs really isn't that much different than you or me. They like to watch a good game of futbol over a pint. In fact, every four years they come out with their World Cup preview:

https://web.archive.org/web/20140617062713/http://www.goldmansachs.com/our-thinking/outlook/world-cup-and-economics-2014-folder/world-cup-economics-report.pdf

Included in their WCP is a table that lists the odds of each team winning the cup.

Now, you might be aware that there are wagering markets on the World Cup.

Whoa, are you ok? You must be an American. Here, have a sip of water. Relax, I fainted too when I first heard people actually wager on international sporting competitions. Feeling better? Good. Back to the wagering.

Because Goldman Sachs gave percentages for each team's title chances, and because this guy was awesome, we can figure out how much they should wager on or against each team.

Except...

While that might work for most people (such as Nate Silver, whom I'll get to in a bit), that won't work for an animal as large as Goldman Sachs. As such, I gave Goldman Sachs a budget of $10,000,000 and estimated how much they could bet into the market without moving the lines so much that they are damaging their expected value. In some cases that was simply the maximum bet allowed on a line at a certain site, while in other cases I had to look at the market depth at multiple locations and use certain estimates as to how much more could be offered and filled at that price.

Without further ado, Goldman Sachs 2014 World Cup wagers:

Brazil to win: $3,130,000 to win $9,390,000

Iran to win: $5,000 to win $15,000,000

Netherlands to win: $145,000 to win $5,800,000


Japan not to win: $500,000 to win $2,400

Ivory Coast to not win: $540,000 to win $3,000

Mexico to not win: $504,000 to win $1,500

Columbia to not win: $540,000 to win $9,000

Chile to not win: $500,000 to win $8,000

Uruguay to not win: $720,000 to win $20,000

Argentina to not win: $470,000 to win $100,000

Spain to not win: $560,000 to win $80,000

England to not win: $732,000 to win $24,000

Italy to not win: $600,000 to win $20,000

France to not win: $550,000 to win $20,000

Portugal to not win: $504,000 to win $15,000

Between Brazil, Iran, and the Netherlands, Goldman Sachs gives themselves a 54.2% chance of winning outright. I find it highly amusing that their single best possible outcome is an Iran victory.

I promised I would come back to Nate Silver. I'll write a separate post, but the short story is I am giving Nate $100,000 to invest in the World Cup, with the formulas provided by John Kelly, and the individual game odds from 538.

Spoiler alert: Nate is going to be investing over 52% of his bankroll game one on Brazil ($52,600 to win $17,884 on Brazil -0.5).

Good luck Nate!

538 makes a phone call from New York to Los Angeles

Before I discuss 538's soccer acumen, I'd like to make a recommendation: It's one of the best books I've read in terms of probability and management of resources (hint, hint). Now, let's talk futbol: I will give Nate Silver and the team at 538 $100,000 to invest in the World Cup on a game-by-game basis. They will be "Kelly-wagering" it, which provides the best expected return on investment. In general, I'll be locking in the size and the price of each wager when the previous game is decided, but in the case of game one, I locked it in a bit early. That worked out well for Nate, as the price has moved a few basis points his way in the meantime. For game one of the World Cup 538 gives Brazil an 88% of winning. Ergo, in the 3-ball wagering, 538 will be risking $52,600 to win $17,884 on a Brazil victory. Good luck! Right now it looks like 538 will risk 1.83% of their bankroll on Cameroon in game two. Whether or not that is $2,157 or $867 is up to Brazil. 🙂 Game 1: Brazil, 52.6%. Net gain: 17.884% Game 2: Cameroon, 1.83%: Risking $2,157 to win $6,255.

The Best Young Prospect in Europe, 2014 – Alvaro Morata

Alvaro-Morata

If you listened to the podcast yesterday, you know that there’s one guy that I tabbed as the best attacking prospect in Europe. Ben expressed a fairly strong degree of scepticism on Twitter when I initially said this and then again on the pod, and rightly so.

Young player scouting and prediction is basically impossible. When you do it via the eye test and someone doesn’t work out, you shrug and point to transfer numbers that say 50% of ALL transfers fail. Guys get injured. Home sick. Played out of position. Fall out with their new managers. Humans are bloody complicated.

When you scout via stats and a guy doesn’t work out, you shrug and point to the same stats as the eye test guys, but hopefully your model has a success rate of better than 50% or what’s the point? As you know from the intro article, the new scouting model that I'm developing backtests quite a bit better than 50%, but guys can still fail to turn into world beaters.

These same problems are also what makes it tough to evaluate model picks. If a guy has one really good year after the model “finds” him, is the pick a success? Two good years? It’s tricky.

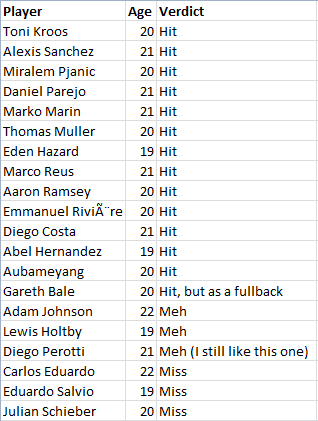
Here’s an example: In 09-10, YAPSS (Young Attacking Player Scouting System) said Marko Marin is a prospect teams should be very interested in. Was that pick a success or a failure?

Now Chelsea fans will tell you he failed with them. And yet… He played 1.59 90s in the league while at Chelsea and had a scoring contribution of 1.26 goals and assists per 90. Basically, he couldn’t get on the pitch, but when he did, they scored.

Outside of Chelsea, Marin’s contributed at about a .4 scoring rate wherever he’s gone, including 3G and 9A the year after the model triggered, and he’s a career-long good to great dribbler as well. That has to be a hit, at least statistically.

Football isn’t just stats, but models generally are and need to be evaluated on that basis. The guy I want to talk about today might just be the best statistical prospect in the last half decade (meaning, the entire data set I have access to).

What do you have to do to be labelled “The Best Prospect in Europe?”

You have to be statistically very special.

That’s what Alvaro Morata is.

Name: Alvaro Morata

Age:  21

Position: Center Forward

Team: Real Madrid

Fair Price: £25M

Who should buy him: Every team that needs a forward and can afford him. Actually, throw need out the window. Every team that can afford him. In fact, Real Madrid are dumb to sell him in the first place.

Morata_2014_Madrid

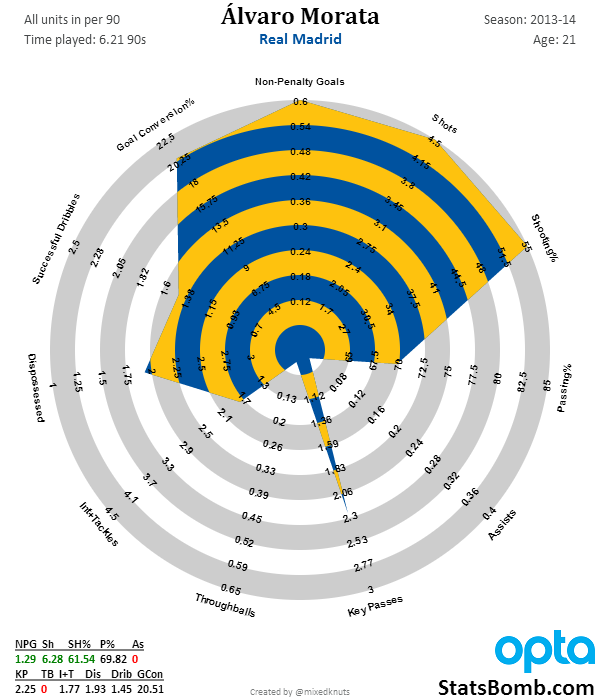
Morata is unreal. 6.2 shots per 90, a non-penalty goal rate of 1.29! 2.25 key passes per 90, 1.45 dribbles… for a guy who is only 21, those stats are absurd.

Check that, for any player in Europe, those stats would be absurd. The list of guys who have shot more than six times per 90 in the last five season is as follows.

Messi. Ronaldo. Wayne Rooney. Mario Balotelli.

So why does Ben (or anyone sensible, really) have reservations? There are a number of good reasons.

  • Morata played on Real Madrid, one of the most talented attacking teams in the world. If/when he moves away from there, those stats will fall off because his teammates are unlikely to be as good.
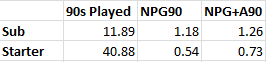
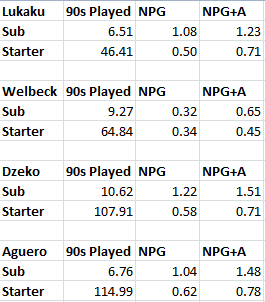
  • Morata only played a little over 6 full games in the league this year, and importantly, most of that time came as a substitute, which we know has a big boost on attacking performance.

Those are large asterisks to statistical performance. So why am I still so high on this kid?

The answer is: because of all the young players in the last five seasons of data from all five big leagues in Europe, Morata looks the best. All the other young players to come from top teams, title-winning clubs, minnows, whatever… no one looks as statistically good as Morata.

In five years of data, Mario Balotelli is the only guy to average more than 6 shots per 90 at 23 or younger. The top two young players in Shots per 90 the last four years looks like this:

2013: Balotelli, Nelson Oliveira

2012: Balotelli, Jovetic

2011: Sturridge, Lewandowski

2010: Darron Gibson (no, I have no idea either), Karim Benzema

It’s a pretty strong indicator that a kid is hugely talented.

And here’s the other important thing – he also passes the eye test. He’s 6’3, has a big frame, dribbles extremely well for a big kid, is surprisingly good at picking out teammates with key passes and he’s fast.

Watch his highlights and you’ll see balance, strength, and shockingly soft feet. He scores with both feet (though primarily his right), and heads the ball into the net regularly. He still hasn’t fully filled out his frame, but he’s far from a waif. He also gave Dani Alves a torrid time out on the wing this year in a Classico.

Statistically, we can try to overcome the small sample size a bit by adding in Morata’s earlier time with Real, which includes previous seasons and his Champions League play.  When you do that, you wind up with 12.7 90s played, NPG of .86, Scoring Contribution of 1.1, 4.71 shots per90, 1.96 Key Passes, and 1.73 dribbles. All playing for the A team. That’s still bonkers and would be great for his age at half that. His scoring rate at Real B and for the U18, U21, U23 Spanish National teams has been consistently outstanding.

Step back for a second and consider this question. Take what you know about Daniel Strurridge or Robert Lewandowski now and put them on the open market at age 23 so you have all of their prime years ahead of them. What price do you think teams would pay for their services? £50M? £60M?

Jovetic sold for £23M last summer. Lewandowski probably would have sold for £30M with only a year left on his deal, but Dortmund flatly refused to sell to Bayern and made him see out his contract. He’d be worth £60M otherwise. Real bought Benzema for £31M in 2009 and his young player profile wasn’t this good.

I know Morata only has one year left on his deal, and I know there’s some uncertainty from the sample sizes, but from a statistical perspective, it feels like teams should be thinking about how much they would pay for the next Zlatan or Ronaldo or Lewandowski or Sturridge at age 21.

He really does look that good.

If things go badly, you overpay slightly for an average forward. (There's almost no way he's worse than that.) You can probably sell him off somewhere else two years from now for £12-15M to cut your losses.

If things go as the stats suggest they might, you buy the good version of Fernando Torres, right as he is turning into el Nino.

Stop dithering over a couple million pounds. Buy him outright, plug him into your team for the next decade, and enjoy the ride.

Gifolution: Is Sergio Busquets in Decline?

Sergio Busquets has been one of the most unbelievable players on the planet. Widely considered to be the best pure defensive midfielder in the world, he is the rock upon which tiki-taka stands. His style has been virtually mistake-free for half a decade, and his defensive stats are ridiculous when you consider Barcelona average 65-70% possession every year.

(Defensive rate stats are limited by opportunity. If your team has the ball, you can't make a tackle or an interception.)

All of this has been true for half a decade. Until... this year? No one is saying Busi has gone bad, but something at Barcelona this season definitely caused his stats and radar profile to dip. This will be something to keep an eye on for next season and maybe... for the World Cup?


Busquets_2009-2014

Measuring Tactical Variance by League

tactics  

Manchester City won the 2013-2014 Premier League with a diverse and international (and very expensive) squad.  Of the players who made 20 or more league appearances, a full eight different nationalities were represented (nine if you count their Chilean manager, Manuel Pellegrini).  Only one first choice squad player, goalkeeper Joe Hart, was English.

In many ways Manchester City is representative of what many see as the future of European football, one in which hyper cross-pollination of playing styles and tactics renders our old heuristics (Spain = tiki-taka, Italy = catenaccio , etc.) useless.  In this future world of European football, then, we might expect the distribution of formations/tactics to be fairly consistent across different leagues. Of course that is not the case now, and quite possibly will never be.

 In the complex world of game theory and football formations, sometimes it behooves a manager to stick with an unsuccessful setup for no better reason than it is what everyone else in the league is doing; many people do not like to take risks, especially if their job is on the line.  Conversely, in a league like Serie A where using different formations/tactics from game to game is almost an obsession, an adherence to one formation might be frowned upon.

 It should be stated that while this piece is about "tactical" variance our only measurement tool is "formation" variance.  Formations and tactics are not necessarily the same thing.  For example, a 3-5-2 might in practice more resemble a 5-3-2 and any formation can exist in an attack-minded or defensive form.  However, to the extent we are measuring tactical heterogeneity/homogeneity it seems self-evident that measuring formation variance is probably as good of a proxy as any.  Formation information comes from Opta, whose analysts watch every game for each team they are assigned.  Also noteworthy is this data does not include any in-game changes and is merely how each team lined up at the start of the game.  Information is from the last completed season ('13-'14) and includes only formations used more than 3%.  Formations are listed from left (most used) to right (least used).

formations by league

A couple things stand out here:

1. The Eredivisie loves the 433 and Russia loves the 4231, almost to the exclusion of any other formation.

2. Serie A demonstrates a tactical diversity not seen in other leagues (see below).

team avg formations

The "favored" and "unfavored" formations are partially a symptom of the fairly eclectic mix of leagues included in the analysis.  If we just aggregated all the teams from the "Big 4" leagues (Bundesliga, EPL, La Liga, Serie A) this is what the results look like:

Big 4

The 4231 is certainly the fancied approach at the moment, but things can change.  For example, MLS has seen a rise in the use of the "diamond" 41212 in 2014. Unfortunately, this analysis does not include any data from previous seasons.  Will the homogeneity in the Dutch approach and heterogeneity in the Italian approach hold in the face football globalization?  It will certainly be worth watching.

Statistical Scouting Young Super Stars

calhanoglu Long-time followers know that I spent much of last summer sifting through young player stats in an attempt to spot potential gems before they became stars. I’m happy with my analysis from that period, but this summer I wanted to upgrade the process. Instead of scouting via stats, guidelines, and common sense, this time I wanted to construct some basic models. I’ve got access to many more seasons worth of data now, so I can back test model output from up to five years ago and see how it fared. Why would you want to do this? Scouting time is expensive. Even if you aren’t paying scouts more than minimum wage (or hell, as Michael Calvin details in The Nowhere Men, some scouts barely get expenses), time costs money and so does travel. That’s where statistical scouting comes in. Scouting via stats is not an effort to reduce scout jobs or eliminate scouting itself – I would never sign a player without having watched plenty of game film on how he plays. However, statistical scouting is an effort to identify targets quickly and efficiently, as well as to try and find ways to suss out future stars before most people even know about them. So that’s what I’ve been working on. By taking a big database full of Opta stats from the major leagues over the last five seasons, I wanted to see if I could find some sort of predictive cocktails that would shake all the numbers together and spit out future stars. I’m only going to write about attackers for now because those are the most interesting players to read about and they are also the ones that are easiest to analyse with numbers. I am also developing models that scout other positions, and I’ll be writing about those at some point, but attackers should keep me busy for quite a while. These models have been designed at the theoretical level first, based on outputs the community has discovered are actually important for winning matches. Hit Rate One of the big things teams will care about is the hit rate any scouting model has. Daniel Altman wrote about this in detail over at BSports, but in order to properly test any predictive models against the real world, you not only need to figure out your hit rate, but you also need to determine how often the model returns false positives (transfer duds). Another thing to keep in mind is the frequency of targets your model returns. Ideally, you’d like to have a large group of potential stars to choose from instead of simply returning five guys who are guaranteed to be gold every season. The current hit rate on the tight version of the model output for superstars is around 70%. 15% of the guys it recommends have been duds over the first three years of testing, and then the other 15% have been useful players, but not great. There are other versions of the model that return more potential targets, but it comes at the cost of delivering more young duds as well. If you were a Director of Football, would a model that gave you 30 names each season between 18 and 23 years old that were 70% likely to develop into stars interest you? It should! “Blah Blah WHATever…” That’s a perfectly fair reaction. You just have a guy who says he has a model that uncovers future superstars at a very strong rate, but it’s a black box with no additional detail. The reason for this is, once the methodology is out there, everyone will have it. This type of information loses its edge if it’s public info. The various scouting models are also still in development for all positions, which means I’m going to sit on this for a while and see what happens. I can talk about the outputs, but not about the process. However, what I can do today is produce a subset of hits and misses for the back testing of 2010 season, plus the ages those players were at the time so that you can get an idea of why I think this is fairly cool stuff. Ages listed are how old the player would have been in June of 2010. 2010_Scout_Model_Subset Obviously a number of those names were in decent teams at the time, but quite a few of them weren’t. Imagine if you could have bought Gareth Bale in the summer of 2010! Or Diego Costa and Marco Reus before they exploded? There are some misses in there as well – guys who disappeared into lesser leagues or never realized their potential - but the hit rate at a young age, when players tend to be much tougher to project overall, is surprisingly good. Starting tomorrow and throughout the rest of the summer, I will work to profile the names that the model delivered for 2014. In the meantime, however, here are some summer 2013 names that you might find interesting. Koke, Gotze, Shaqiri, De Bruyne, Grenier, Lamela, Canales, Draxler, Johannes Geis, El Shaarawy, Ljajic, Coutinho, Mattia Destro, Maximilian Beister, Nelson Oliveira, Lass, Romelu Lukaku. Thanks for listening. --TK   P.S. The guy at the top of this article is one of the top targets for 2014. Opta_200px

Gifolution: Andrea Pirlo, from AC Milan to Now

In the summer of 2011, Andrea Pirlo was a free agent. At age 32, AC Milan decided that they weren't interested in giving the bearded wonder a new contract, and so the club and Italian talisman parted ways. Juventus clearly thought this was stoopid, and scooped up Pirlo on a free, making him the centerpiece of Antonio Conte's resurgent squad. They went on to win three straight Serie A titles (so far). This is what Pirlo's radars have looked like over the past five seasons. He's had an incredible run in his 30s that so far shows little sign of slowing down. Pirlo_0914

StatsBomb Mythbusting: Is Javier Hernandez Any Good?

Somehow, when the world wasn’t really looking, Javier Hernandez turned 26. The Little Pea grew up into a full pea pod, but no one really noticed because he was stuck on the end of the Manchester United bench. With only two years left on his contract, Chicarito and Manchester United both have some decisions to make. First, for United, is it time to move Hernandez along and give their perennial super sub role to someone else? Next, for teams that are interested in buying him, how good is Hernandez compared to all the other players on the market? Is Chicarito’s primary value exclusively in the sub role, or does he deserve more time and attention wherever his new destination may be? First things first… Is Javier Hernandez Any Good? Here’s his 4-season scoring trend while at United. chich_scoring_trend [Note: NPG90 = Non-penalty Goals per 90 minutes. NPG+A90 adds assists to that stat and is commonly known as Scoring Contribution when we have more space to type.] Two of those seasons are outstanding (2011, 2013) while the other two are merely quite good. His goal scoring rate in the four seasons he has been at United has ranked 3rd, 10th, 1st (edging out… wait for it… Daniel Sturridge in 2012-13), and 24th. I don’t know if you can blame this past season on the short-lived David Moyes era at Manchester United, but given his previous ratings and the fact that he’s probably in the middle of his prime as a forward, I’d lean that way. So the short answer to that question is an unequivocal YES, Javier Hernandez is an exceptional goal scorer. But… One of the most important pieces of knowledge stats guys have learned in the last year is that sub effects exist, and they can have a dramatic effect on scoring rate for players.  (For more on this topic, please read Colin Trainor’s piece as well as this one from Daniel Altman.) Javier Hernandez is known primarily as a sub, so we’re going to have to dig a bit deeper. Sub vs Starter role We’ve got his 4-year trend above, but because the numbers get small quickly when looking at playing time as a sub, I’ve chosen to condense all four years of numbers into just Starter stats vs. Sub stats chich_sub_v_starter Whoa. That is a huge boost simply from being played as a sub. And yet… those starter numbers are still good. A forward who scores .54 goals per 90 is really quite valuable. In most EPL seasons that would put you right around 10th in the league in scoring rate. But that sub boost is absolutely insane. It takes Javier Hernandez and turns him into Lionel Messi. Here’s the thing though… this effect isn’t just true for Javier Hernandez, it’s true for every good forward I’ve had a chance to look at. Here are a few other guys I looked into that have had a number of sub appearances over the last 4-5 seasons. Other_Sub_Forward_Splits Welbeck’s scoring contribution gets the boost, while his goalscoring stays even. Lukaku, Aguero, and Dzeko all get monster boosts to their production when playing as subs. It's hard to understate how massive and important this effect is, but it’s barely been talked about outside of the two articles linked above. The implications here are big enough that it should change how managers make subs, and how they rotate players.  It suddenly makes a lot of sense to regularly have star forwards coming off the bench at the 45 or 50 minute mark as part of a rotation scheme to keep them fresh and boost their potential production. And even when you don’t have a star to rotate on, realizing that even an average guy can become quite good as a sub again makes for some interesting variations in strategy. Football isn’t a science, and you can’t reduce man management to mathematics, but there are physiological reasons why this is happening, and smart managers need to take advantage of them. At some point in the near future, we will see the development of “forward platoons” where good managers are subbing attackers earlier with regularity to boost overall team goalscoring returns. Back to Chicharito… So we’ve got the sub vs starter splits now, and we’ve looked at his overall scoring trend as well as where those numbers have ranked in the league since Hernandez has been in England. When you compare his baseline goal rate as a starter, it looks great. He’s right there with Lukaku and Dzeko, and a small bit behind Aguero. The same is true when you look at Hernandez’s numbers as a sub as well. You again see a huge boost in production, and that goalscoring rate compares favourably with even the best players in the Premier League. Javier Hernandez is really good, both as a starter and a sub. He deserves to play quite a bit more than the 9.5 and 10.3 90s he has in the last two seasons. Unless you think David Moyes broke him for good, he looks like an outstanding player, and has for quite some time. If you are looking for a guy who can score you goals, he’s actually one of the better ones you will find, but the fact that there’s this hidden bias against him because a lot of his goals seem to come as a sub means that he might be undervalued. It’s also pretty clear that he’s ready to play more and wants a bigger role either at United (unlikely) or somewhere that’s smart enough to buy him. £15M would actually be a worthwhile price for him, but even £20-25M wouldn’t be too high given his age (he just turned 26) and where he compares to other Premier League players over the last four years. Here’s his combined radar from the last Fergie year + this past season, so that we even out that one year under Moyes with something that looks to be closer to his true potential. Javier_Hernandez_2012_14

Transfer Dossier: Welcome to Anfield, Emre Can

emre-can-angebot-von-galatasaray-275547 The transfer of Emre Can from Bayer Leverkusen to Liverpool has been officially announced, so I figured that was a good excuse to post some stats and info on the young German player. First off, he’s only 20. The fact that he played a full season in Bundesliga in a Champions League side at that age is a very good indicator that Can is already something special. He’s also a full 6 feet tall and has a solid physical build. He’s not a left back/midfielder that is going to get pushed around much in the Premier League. His time at Leverkusen this year was split almost evenly between left back and midfield, where he spent time as a box-to-box midfielder and a DM. Given Liverpool’s interest in Alberto Moreno, I’m going to guess that they see Can primarily as a midfielder, but one who can fill in at the left back spot should a rash of injuries occur. Analyzing player stats across different positions is a pain, so I broke out the season splits for Can into midfield and left back. His CM/DMC radar looks like this: Emre_Can_2014 And this is what it looks like when you compare him to Joe Allen last season: Emre_Can_v_Joe_Allen_overlay2014 As you can see from the overlay, aside from the tackling, these guys had fairly different production from midfield. (Unexpectedly, it might be more correct to directly compare his midfield splits versus Jordan Henderson instead of Liverpool's defensive mids.) Can was regularly involved in the attack and has excellent dribbling and scoring contribution stats. His defensive context stats are also worse than Allen’s, but that’s partly caused by Bundesliga league skew with relation to dribbles, etc. Can is not as clean as Allen is, but again, he’s only 20. Additionally, Leverkusen weren’t exactly possession monsters last season – in fact, they were almost exactly at 50% - so Can was probably forced to make longer, less comfortable passes than you would typically make in a Liverpool side, thus pushing the passing percentage down a bit. He’s good, but he’s also not the finished product.  He’ll get playing time, but don’t expect him to shove any regulars out of the lineup immediately. Left Back Skills? Can’s stats when deployed as a left back look like this Can_LeftBack_Stats Interesting. The tackle and interception stats are good, though not great, but again the system Can played in was significantly different to what Liverpool employ. Bundesliga players seem to have a higher amount of successful dribbles than other leagues, but 4.63 per 90 is a lot, even in that league.  It’s also not a particularly small sample size, as it includes 8 full matches out wide. Stick him out wide, and Can can dribble extremely well (and his highlight vids from out there are a joy to watch). He didn’t cross the ball much on the whole, but when he did, he was pretty successful. With his dribbling skills, he will definitely be able to get himself involved in the attack, either as a box-to-box midfielder or as an overlapping fullback. With further development, it's also possible he could end up as a wingback in certain formations. Value As noted above, Can saw a large amount of playing time for a Champions League side at age 20. His stats were good there, and he’s still developing both physically and in how he reads the game. Liverpool allegedly only paid £9.7M for him when a similar player in England would probably go for double that. Can adds depth at two different spots of need for Liverpool, and could potentially be a world class talent in a couple of years. In short, I love this deal.

What Does It Take To Get Out of a World Cup Group?

There has been very little work done in international football analytics compared to the club game . The general consensus is that working with these statistics is much more difficult for a variety of reasons, the most often citied are a small sample size, high turnover of squad composition and varying strengths of schedule.

Looking at the World Cup in isolation the problem of squad turnover is handled as countries are not allowed to change their squad composition once the tournament has begun. Further restricting analysis to the group stage also deals with the strength of schedule problem. Looking solely at the World Cup group stage the only problem becomes the question of sample size.

Leading up to every World Cup journalists may not explicitly use the term sample size, but they all discuss this idea of “getting unlucky” or not “getting the bounces” in the short time frame. This line of inquiry brings up the question, do the best teams really get through the group stage? Or at the very least do the teams that play the best in the opening three matches make it through?

The first question is very difficult to answer for many of the reasons stated above. Going into the World Cup we really don't know who the best teams are. Club form doesn't always translate into national team form and it's difficult to compare underlying talent between teams that have faced very different competition leading up to the tournament. The second question is much easier to deal with, do the teams that play the best in the opening three matches make it through their group?

In order to take a more in-depth look at this question I've chosen simple proxies for playing well and for getting lucky. FIFA does not provide any shot location data, at least none that I've been able to find, so the best available alternative to use for dominance is total shot ratio or TSR. The idea is that over three matches the extent to which a team outshoots their opponents indicates how well they have played. On the flip side I've used PDO as a proxy for luck. These two proxies have often been used elsewhere on Statsbomb.

The data I'm using for this analysis are from the 2010 World Cup. If anyone needs a refresher as to where teams finished in the group stage the final results are all here.

Most teams go into the group stage with the goal of qualifying for the round of sixteen, and the question of getting unlucky only comes up if a team doesn't make it past the group stage, so instead of looking at final position I just look at whether or not the team qualified for the next round.

I use a probit model, which assigns a probability to each team getting out of the group stage given their TSR and PDO throughout the three group stage matches. Each team assigned a probability greater than 0.5 is expected to qualify and each team with a probability less than 0.5 is expected to be eliminated.

The first thing we want to understand is how many of these teams the model accurately assigned a probability of greater than 0.5. Or in other words how many of the teams fates can be described purely using these two statistics.

The complete model accurately anticipates fourteen of the sixteen teams that made the second round. The only two teams that the model did not accurately assign to the round of sixteen were South Korea and Slovakia.

Table1

Essentially this means that neither the proxy for skill nor the proxy for luck can explain why these two teams qualified for the round of sixteen. Examining these two teams in context gives a bit more insight. South Korea's below average TSR seems to be down to the curse of the small sample size in which they are disproportionately punished for a 4-1 pummelling by Argentina. As for Slovakia they seem to just have been even luckier to escape a group with Paraguay and Italy than their 1115 PDO indicates.

Now we use two restricted models one which only uses PDO and one which only uses TSR. The model only taking into account PDO correctly predicts eleven of the teams that qualified, whereas the model only taking TSR into account correctly predicts thirteen of the teams that qualified. This suggests that despite the small sample size the quality of performance has a bigger impact on whether or not a team qualifies than luck does.

This becomes more interesting when comparing the teams that the PDO and TSR models differ on. The PDO model correctly predicted two teams to qualify that the TSR model didn't: Slovakia and Mexico. As mentioned above Slovakia is a bit of an outlier since even the combined model didn't anticipate their PDO to be high enough to make up for their poor TSR.

The TSR model correctly predicted four teams to qualify that the PDO model didn't, including the tournament champions Spain.

Table2

It is interesting that all of these four teams which made up for their relative “unluckiness” did so with TSRs greater than 0.6. The most telling number here might be Chile's who appear to have been very unlucky with a PDO of 854, but were able to overcome it by significantly outshooting their opponents.

The evidence from the 2010 World Cup suggests that if a team outshoots their opponents throughout the group stage by at least 6 to 4 they should be able to get past so called “unlucky bounces”. The data also show that getting lucky in the group stage and making it to the round of sixteen is not impossible, but it doesn't appear to be quite as prominent as many TV commentators will inevitably claim during this summer's World Cup.