Author: Euan Dewar

Doing More With StatsBomb Data in R
Alongside the release of our Messi dataset we also put a PDF guide to using our data in R. It was intended as a basic introduction to not only our dataset but also the R programming language itself, for those who have yet to use it at any level. Hopefully that gave anyone interested in digging into football data a nice, smooth onboarding to the whole process.
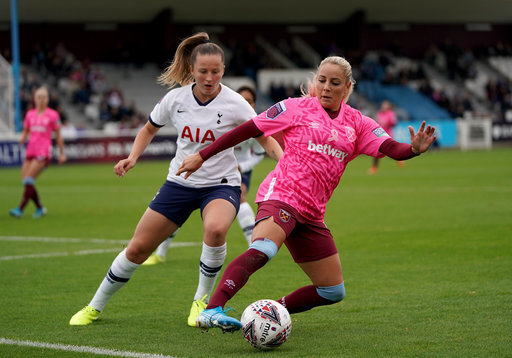
For those who have taken the plunge, this article is going to go through a few more involved things that one could do with the data. This is for those that have already gone through the guide and have been playing about with SBD for a while now. It's important that you have done this first as we will not be walking through absolutely everything and assumes a certain level of familiarity with R. Now that the base terminology of it all has been established it should be easier to explore uncharted territory with a bit less trepidation. So far we have released open data on the women’s and men’s World Cups, the FAWSL, the NWSL, Lionel Messi’s entire La Liga career, the 2003/04 Arsenal Invincibles and 15 years of Champions League finals. You can follow along with this article using any dataset you like but for consistency's sake we will be using the 2019/20 FAWSL season in all examples.
One last disclaimer: this is, of course, all about R. We also have a package for Python that isn’t quite as developed but still handles plenty of the basics for you if that’s your programming language of choice.
A big hurdle to doing anything nuanced with any dataset is one’s underlying understanding of it. There are so many distinct variables and considerations in the SB dataset that even I - having worked with it as my job for two years now - forget about some parts of it every now and then.
To this end it helps to not only have our specs to hand for checking, but also to be aware of the names() and unique() functions. These allow you to get a top-down look at the columns/rows a dataframe contains. So let’s assume you have your data in an R df called ‘events’. We will be using this name for the data in all examples throughout this article. If you were to do names(StatsBombData) that would give you a list of all the columns in your dataset.
Similarly, if you were to do unique(StatsBombData$type.name) you would get a list of every unique row that the ‘type.name’ column contains, i.e all the event types in our data. You can of course do that with any column. It’s good to have these two in your back pocket should you get lost in the forest of data at any point.
xGA, Joining and xG+xGA
xG assisted does not exist in our data initially. However, given that xGA is the xG value of a shot that a key pass/assist created, and that xG values do exist in our data, we can create xGA quite easily via joining. Here’s the code for that, we’ll go through it bit-by-bit afterwards:
library(tidyverse)
library(StatsBombR)
xGA = events %>%
filter(type.name=="Shot") %>% #1
select(shot.key_pass_id, xGA = shot.statsbomb_xg) #2
shot_assists = left_join(events, xGA, by = c("id" = "shot.key_pass_id")) %>% #3
select(team.name, player.name, player.id, type.name, pass.shot_assist, pass.goal_assist, xGA ) %>% #4
filter(pass.shot_assist==TRUE | pass.goal_assist==TRUE) #5
- Filtering the data to just shots, as they are the only events with xG values.
- Select() allows you to choose which columns you want to, well, select, from your data, as not all are always necessary - especially with big datasets. First we are selecting the shot.key_pass_id column, which is a variable attached to shots that is just the ID of the pass that created the shot. You can also rename columns within select() which is what we are doing with xGA = shot.statsbomb_xg. This is so that, when we join it with the passes, it already has the correct name.
- left_join() lets you combine the columns from two different DFs by using two columns within either side of the join as reference keys. So in this example we are taking our initial DF (‘events’) and joining it with the one we just made (‘xGA’). The key is the by = c("id" = "shot.key_pass_id") part, this is saying ‘join these two DFs on instances where the id column in events matches the ‘shot.key_pass_id’ column in xGA’. So now the passes have the xG of the shots they created attached to them under the new column ‘xGA’.
- Again selecting just the relevant columns.
- Filtering our data down to just key passes/assists.
The end result should look like this:
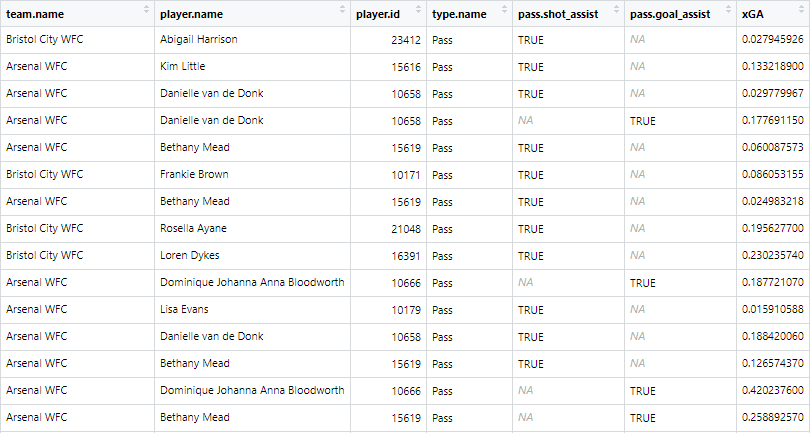
All lovely. But what if you want to make a chart out of it? Say you want to combine it with xG to make a handy xG+xGA per90 chart:
player_xGA = shot_assists %>%
group_by(player.name, player.id, team.name) %>%
summarise(xGA = sum(xGA, na.rm = TRUE)) #1
player_xG = events %>% filter(type.name=="Shot") %>%
filter(shot.type.name!="Penalty" | is.na(shot.type.name)) %>%
group_by(player.name, player.id, team.name) %>%
summarise(xG = sum(shot.statsbomb_xg, na.rm = TRUE)) %>%
left_join(player_xGA) %>% mutate(xG_xGA = sum(xG+xGA, na.rm =TRUE) ) #2
player_minutes = get.minutesplayed(events)
player_minutes = player_minutes %>%
group_by(player.id) %>%
summarise(minutes = sum(MinutesPlayed)) #3
player_xG_xGA = left_join(player_xG, player_minutes) %>%
mutate(nineties = minutes/90, xG_90 = round(xG/nineties, 2),
xGA_90 = round(xGA/nineties,2),
xG_xGA90 = round(xG_xGA/nineties,2) ) #4
chart = player_xG_xGA %>%
ungroup() %>% filter(minutes>=600) %>%
top_n(n = 15, w = xG_xGA90) #5
chart<-chart %>%
select(1, 9:10)%>%
pivot_longer(-player.name, names_to = "variable", values_to = "value") %>%
filter(variable=="xG_90" | variable=="xGA_90") #6
- Grouping by player and summing their total xGA for the season.
- Filtering out penalties and summing each player's xG, then joining with the xGA and adding the two together to get a third combined column.
- Getting minutes played for each player. If you went through the initial R guide you will have done this already.
- Joining the xG/xGA to the minutes, creating the 90s and dividing each stat by the 90s to get xG per 90 etc.
- Here we ungroup as we need the data in ungrouped form for what we're about to do. First we filter to players with a minimum of 600 minutes, just to get rid of notably small samples. Then we use top_n(). This filters your DF to the top *insert number of your choice here* based on a column you specify. So here we're filtering to the top 15 players in terms of xG90+xGA90.
- The pivot_longer() function flattens out the data. It's easier to explain what that means if you see it first:
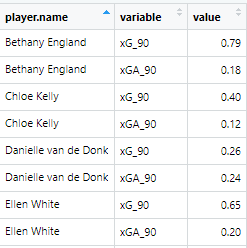
It has used the player.name as a reference point at creates separate rows for every variable that's left over. We then filter down to just the xG90 and xGA90 variables so now each player has a separate variable and value row for those two metrics. Now let's plot it:
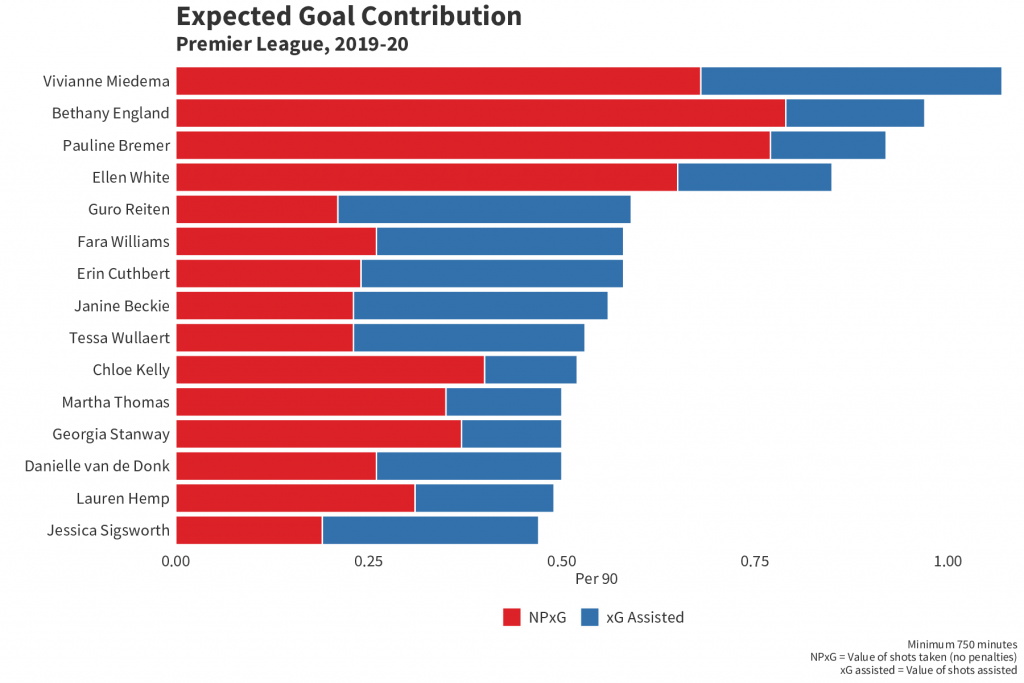
ggplot(chart, aes(x =reorder(player.name, value), y = value, fill=fct_rev(variable))) + #1
geom_bar(stat="identity", colour="white")+
labs(title = "Expected Goal Contribution", subtitle = "Premier League, 2019-20",
x="", y="Per 90", caption ="Minimum 750 minutes\nNPxG = Value of shots taken (no penalties)\nxG assisted = Value of shots assisted")+
theme(axis.text.y = element_text(size=14, color="#333333", family="Source Sans Pro"),
axis.title = element_text(size=14, color="#333333", family="Source Sans Pro"),
axis.text.x = element_text(size=14, color="#333333", family="Source Sans Pro"),
axis.ticks = element_blank(),
panel.background = element_rect(fill = "white", colour = "white"),
plot.background = element_rect(fill = "white", colour ="white"),
panel.grid.major = element_blank(),
panel.grid.minor = element_blank(),
plot.title=element_text(size=24, color="#333333", family="Source Sans Pro" , face="bold"),
plot.subtitle=element_text(size=18, color="#333333", family="Source Sans Pro", face="bold"),
plot.caption=element_text(color="#333333", family="Source Sans Pro", size =10), text=element_text(family="Source Sans Pro"),
legend.title=element_blank(),
legend.text = element_text(size=14, color="#333333", family="Source Sans Pro"),
legend.position = "bottom") + #2
scale_fill_manual(values=c("#3371AC", "#DC2228"), labels = c( "xG Assisted","NPxG")) + #3
scale_y_continuous(expand = c(0, 0), limits= c(0,max(chart$value) + 0.3)) + #4
coord_flip()+ #5
guides(fill = guide_legend(reverse = TRUE)) #6
- Two things are going on here that are different from your average bar chart. First is reorder(), which allows you reorder a variable along either axis based on a second variable. In this instance we are putting the player names on the x axis and reordering them by value - i.e the xG and xGA combined - meaning they are now in descending order from most to least combined xG+xGA. Second is that we've put the 'variable' on the bar fill. This allows us to put two separate metrics onto one bar chart and have them stack, as you will see below, by having them be separate fill colours.
- Everything within labs() and theme() is fairly self explanatory and is just what we have used internally. You can get rid of all this if you like and change it to suit your own design tastes.
- Here we are providing specific colour hex codes to the values (so xG = red and xGA = blue) and then labelling them so they are named correctly on the chart's legend.
- Expand() allows you to expand the boundaries of the x or y axis, but if you set the values to (0,0) it also removes all space between the axis and the inner chart itself (if you're having a hard time envisioning that, try removing expand() and see what it looks like). Then we are setting the limits of the y axis so the longest bar on the chart isn't too close to the edge of the chart. 'max(chart$value) + 0.3' is saying 'take the max value and add 0.3 to make that the upper limit of the y axis'.
- Flipping the x axis and y axis so we have a nice horizontal bar chart rather than a vertical one.
- Reversing the legend so that the order of it matches up with the order of xG and xGA on the chart itself.
All in that should look like this:
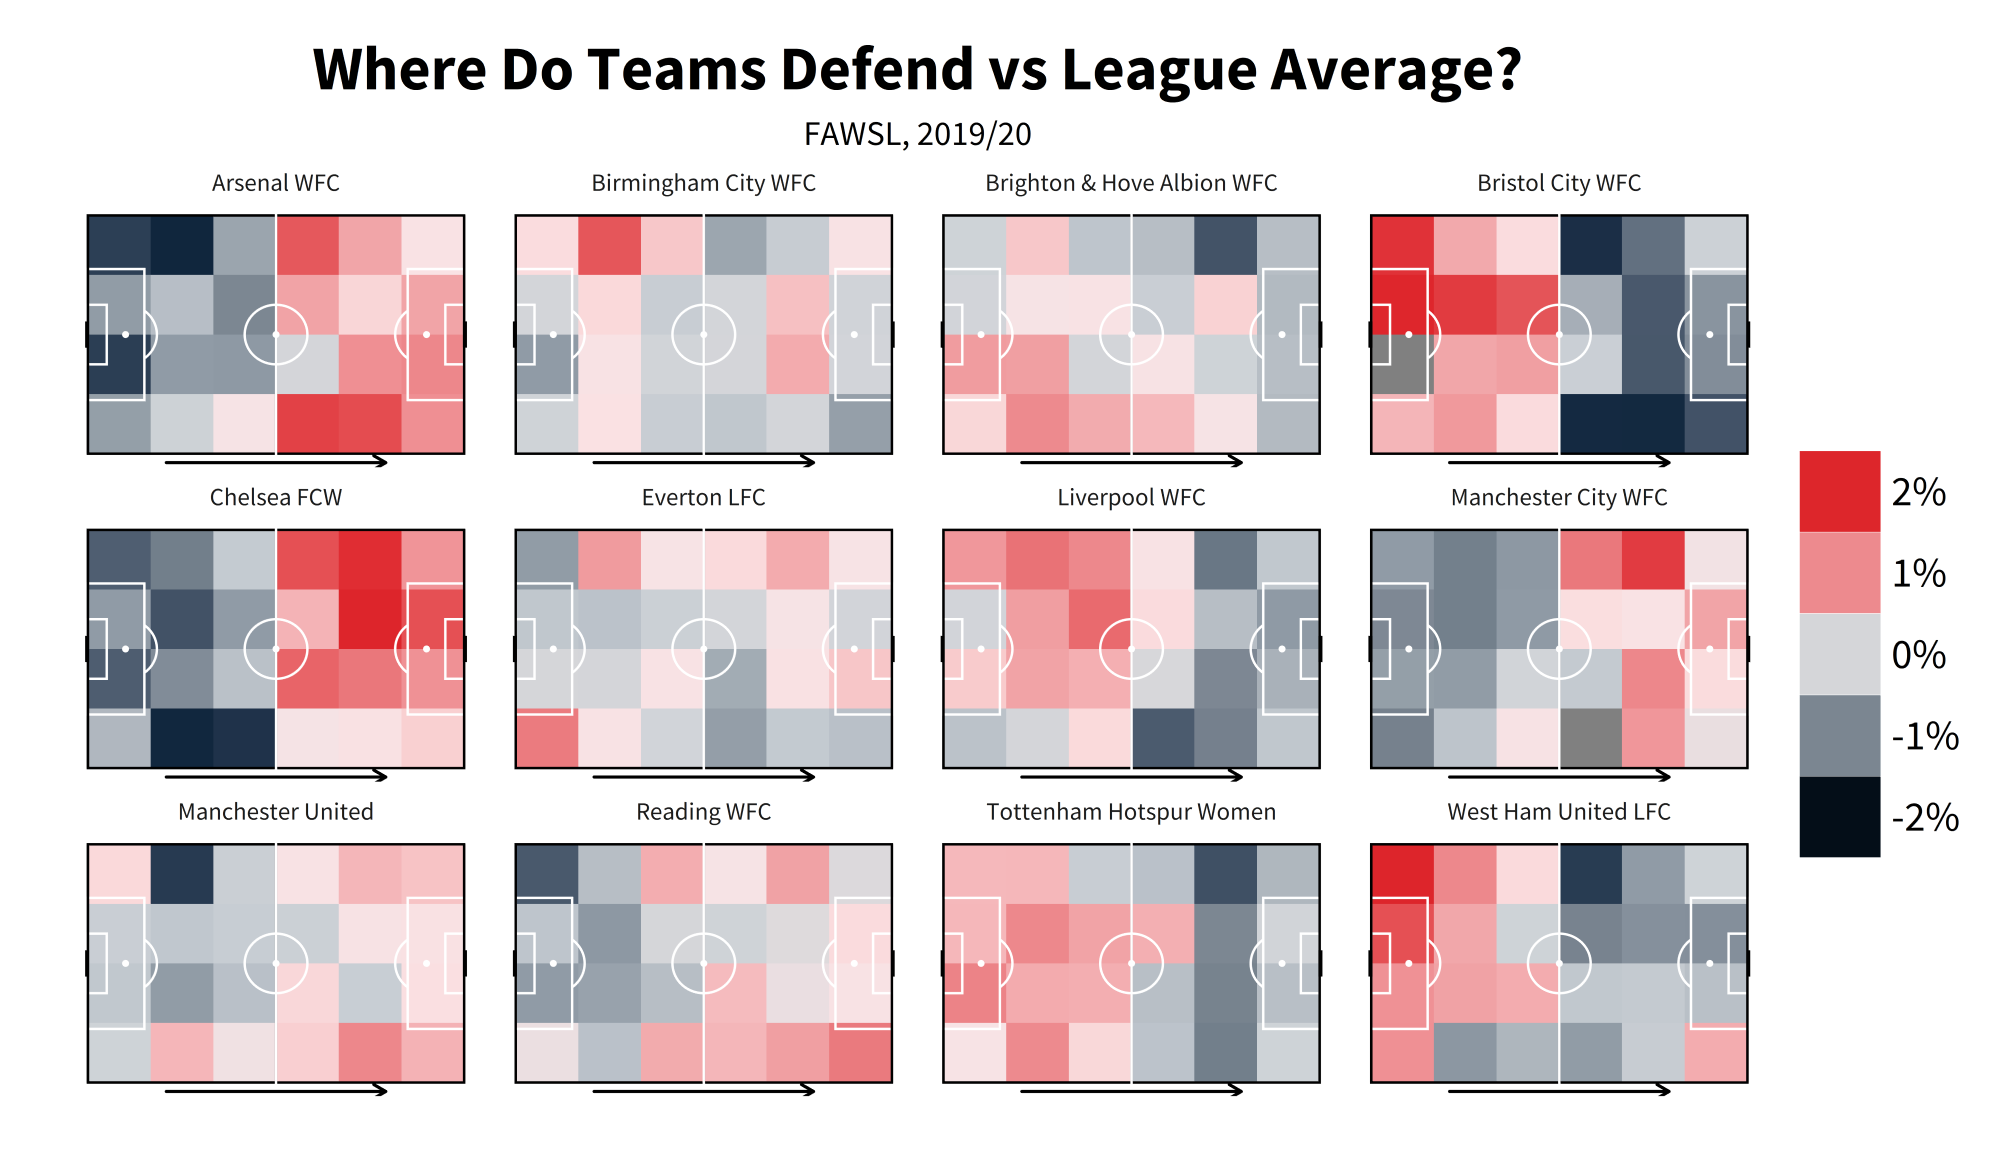
Heatmaps
Heatmaps are one of the everpresents in football data. They are fairly easy to make in R once you get your head round how to do so, but can be unintuitive without having it explained to you first. For this example we're going to do a defensive heatmap, looking at how often teams make a % of their overall defensive actions in certain zones, then comparing that % vs league average:
library(tidyverse)
heatmap = events %>%
mutate(location.x = ifelse(location.x>120, 120, location.x),
location.y = ifelse(location.y>80, 80, location.y),
location.x = ifelse(location.x<0, 0, location.x),
location.y = ifelse(location.y<0, 0, location.y)) #1
heatmap$xbin <- cut(heatmap$location.x, breaks = seq(from=0, to=120, by = 20),include.lowest=TRUE )
heatmap$ybin <- cut(heatmap$location.y, breaks = seq(from=0, to=80, by = 20),include.lowest=TRUE) #2
heatmap = heatmap%>%
filter(type.name=="Pressure" | duel.type.name=="Tackle" | type.name=="Foul Committed" | type.name=="Interception" |
type.name=="Block" ) %>%
group_by(team.name) %>%
mutate(total_DA = n()) %>%
group_by(team.name, xbin, ybin) %>%
summarise(total_DA = max(total_DA),
bin_DA = n(),
bin_pct = bin_DA/total_DA,
location.x = median(location.x),
location.y = median(location.y)) %>%
group_by(xbin, ybin) %>%
mutate(league_ave = mean(bin_pct)) %>%
group_by(team.name, xbin, ybin) %>%
mutate(diff_vs_ave = bin_pct - league_ave) #3
- Some of the coordinates in our data sit outside the bounds of the pitch (you can see the layout of our pitch coordinates in our event spec, but it's 0-120 along the x axis and 0-80 along the y axis). This will cause issue with a heatmap and give you dodgy looking zones outside the pitch. So what we're doing here is using ifelse() to say 'if a location.x/y coordinate is outside the bounds that we want, then replace it with one that's within the boundaries. If it is not outside the bounds just leave it as is'.
- cut() literally cuts up the data how you ask it to. Here, we're cutting along the x axis (from 0-120, again the length of our pitch according to our coordinates in the spec) and the y axis (0-80), and we're cutting them 'by' the value we feed it, in this case 20. So we're splitting it up into buckets of 20. This creates 6 buckets/zones along the x axis (120/20 = 6) and 4 along the y axis (80/20 = 4). This creates the buckets we need to plot our zones.
- This is using those buckets to create the zones. Let's break it down bit-by-bit: - Filtering to only defensive events - Grouping by team and getting how many defensive events they made in total ( n() just counts every row that you ask it to, so here we're counting every row for every team - i.e counting every defensive event for each team) - Then we group again by team and the xbin/ybin to count how many defensive events a team has in a given bin/zone - that's what 'bin_DA = n()' is doing. 'total_DA = max(total_DA),' is just grabbing the team totals we made earlier. 'bin_pct = bin_DA/total_DA,' is dividing the two to see what percentage of a team's overall defensive events were made in a given zone. The 'location.x = median(location.x/y)' is doing what it says on the tin and getting the median coordinate for each zone. This is used later in the plotting. - Then we ungroup and mutate to find the league average for each bin, followed by grouping by team/bin again subtracting the league average in each bin from each team's % in those bins to get the difference.
Now onto the plotting. For this please install the package 'grid' if you do not have it, and load it in. You could use a package like 'ggsoccer' or 'SBPitch' for drawing the pitch, but for these purposes it's helpful to try and show you how to create your own pitch, should you want to:
library(grid)
defensiveactivitycolors <- c("#dc2429", "#dc2329", "#df272d", "#df3238", "#e14348", "#e44d51", "#e35256", "#e76266", "#e9777b", "#ec8589", "#ec898d", "#ef9195", "#ef9ea1", "#f0a6a9", "#f2abae", "#f4b9bc", "#f8d1d2", "#f9e0e2", "#f7e1e3", "#f5e2e4", "#d4d5d8", "#d1d3d8", "#cdd2d6", "#c8cdd3", "#c0c7cd", "#b9c0c8", "#b5bcc3", "#909ba5", "#8f9aa5", "#818c98", "#798590", "#697785", "#526173", "#435367", "#3a4b60", "#2e4257", "#1d3048", "#11263e", "#11273e", "#0d233a", "#020c16") #1
ggplot(data= heatmap, aes(x = location.x, y = location.y, fill = diff_vs_ave, group =diff_vs_ave)) +
geom_bin2d(binwidth = c(20, 20), position = "identity", alpha = 0.9) + #2
annotate("rect",xmin = 0, xmax = 120, ymin = 0, ymax = 80, fill = NA, colour = "black", size = 0.6) +
annotate("rect",xmin = 0, xmax = 60, ymin = 0, ymax = 80, fill = NA, colour = "black", size = 0.6) +
annotate("rect",xmin = 18, xmax = 0, ymin = 18, ymax = 62, fill = NA, colour = "white", size = 0.6) +
annotate("rect",xmin = 102, xmax = 120, ymin = 18, ymax = 62, fill = NA, colour = "white", size = 0.6) +
annotate("rect",xmin = 0, xmax = 6, ymin = 30, ymax = 50, fill = NA, colour = "white", size = 0.6) +
annotate("rect",xmin = 120, xmax = 114, ymin = 30, ymax = 50, fill = NA, colour = "white", size = 0.6) +
annotate("rect",xmin = 120, xmax = 120.5, ymin =36, ymax = 44, fill = NA, colour = "black", size = 0.6) +
annotate("rect",xmin = 0, xmax = -0.5, ymin =36, ymax = 44, fill = NA, colour = "black", size = 0.6) +
annotate("segment", x = 60, xend = 60, y = -0.5, yend = 80.5, colour = "white", size = 0.6)+
annotate("segment", x = 0, xend = 0, y = 0, yend = 80, colour = "black", size = 0.6)+
annotate("segment", x = 120, xend = 120, y = 0, yend = 80, colour = "black", size = 0.6)+
theme(rect = element_blank(), line = element_blank()) +
annotate("point", x = 12 , y = 40, colour = "white", size = 1.05) + # add penalty spot right
annotate("point", x = 108 , y = 40, colour = "white", size = 1.05) +
annotate("path", colour = "white", size = 0.6, x=60+10*cos(seq(0,2*pi,length.out=2000)),
y=40+10*sin(seq(0,2*pi,length.out=2000)))+ # add centre spot
annotate("point", x = 60 , y = 40, colour = "white", size = 1.05) +
annotate("path", x=12+10*cos(seq(-0.3*pi,0.3*pi,length.out=30)), size = 0.6,
y=40+10*sin(seq(-0.3*pi,0.3*pi,length.out=30)), col="white") +
annotate("path", x=108-10*cos(seq(-0.3*pi,0.3*pi,length.out=30)), size = 0.6,
y=40-10*sin(seq(-0.3*pi,0.3*pi,length.out=30)), col="white") + #3
theme(axis.text.x=element_blank(),
axis.title.x = element_blank(),
axis.title.y = element_blank(),
plot.caption=element_text(size=13,family="Source Sans Pro", hjust=0.5, vjust=0.5),
plot.subtitle = element_text(size = 18, family="Source Sans Pro", hjust = 0.5),
axis.text.y=element_blank(),
legend.title = element_blank(),
legend.text=element_text(size=22,family="Source Sans Pro"),
legend.key.size = unit(1.5, "cm"),
plot.title = element_text(margin = margin(r = 10, b = 10), face="bold",size = 32.5, family="Source Sans Pro", colour = "black", hjust = 0.5),
legend.direction = "vertical",
axis.ticks=element_blank(),
plot.background = element_rect(fill = "white"),strip.text.x = element_text(size=13,family="Source Sans Pro")) + #4
scale_y_reverse() + #5
scale_fill_gradientn(colours = defensiveactivitycolors, trans = "reverse", labels = scales::percent_format(accuracy = 1), limits = c(0.02, -0.02)) + #6
labs(title = "Where Do Teams Defend vs League Average?", subtitle = "FAWSL, 2019/20") + #7
coord_fixed(ratio = 95/100) + #8
annotation_custom(grob = linesGrob(arrow=arrow(type="open", ends="last", length=unit(2.55,"mm")), gp=gpar(col="black", fill=NA, lwd=2.2)), xmin=25, xmax = 95, ymin = -83, ymax = -83) + #9
facet_wrap(~team.name)+ #10
guides(fill = guide_legend(reverse = TRUE)) #11
- These are the colours we'll be using for our heatmap later on.
- 'geom_bin2d' is what will create the heatmap itself. We've set the binwidths to 20 as that's what we cut the pitch up into earlier along the x and y axis. Feeding 'div_vs_ave' to 'fill' and 'group' in the ggplot() will allow us to colour the heatmaps by that variable.
- Everything up to here is what is drawing the pitch. There's a lot going on here and, rather than have it explained to you, just delete a line from it and see what disappears from the plot. Then you'll see which line is drawing the six-yard-box, which is drawing the goal etc.
- Again more themeing. You can change this to be whatever you like to fit your aesthetic preferences.
- Reversing the y axis so the pitch is the correct way round along that axis (0 is left in SBD coordinates, but starts out as right in ggplot).
- Here we're setting the parameters for the fill colouring of heatmaps. First we're feeding the 'defensiveactivitycolors' we set earlier into the 'colours' parameter, 'trans = "reverse"' is there to reverse the output so red = high. 'labels = scales::percent_format(accuracy = 1)' formats the text on the legend as a percentage rather than a raw number and 'limits = c(0.03, -0.03)' sets the limits of the chart to 3%/-3% (reversed because of the previous trans = reverse).
- Setting the title and subtitle of the chart.
- 'coord_fixed()' allows us to set the aspect ratio of the chart to our liking. Means the chart doesn't come out looking all stretched along one of the axes.
- This is what the grid package is used for. It's drawing the arrow across the pitches to indicate direction of play. There's multiple ways you could accomplish though, up to you how you do it.
- 'facet_wrap()' creates separate 'facets' for your chart according to the variable you give it. Without it, we'd just be plotting every team's numbers all at once on chart. With it, we get every team on their own individual pitch.
- Our previous trans = reverse also reverses the legend, so to get it back with the positive numbers pointing upwards we can re-reverse it.
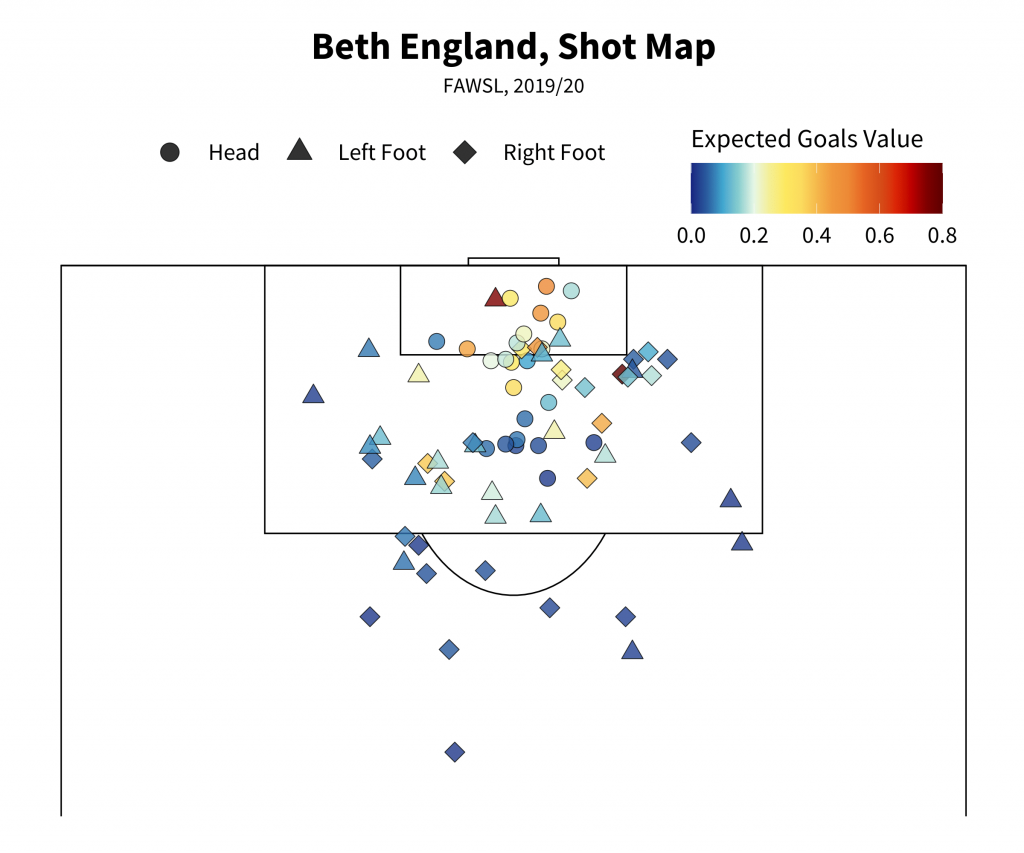
Shot Maps
Another of the quintessential football visualisations, shot maps come in many shapes and sizes with an inconsistent overlap in design language between them. This version will attempt to give you the basics, let you get to grip with how to put one of these together so that if you want to elaborate or make any of your own changes you can explore outwards from it. Be forewarned though - the options for what makes a good, readable shot map are surprisingly small when you get into visualising it!
shots = events %>%
filter(type.name=="Shot" & (shot.type.name!="Penalty" | is.na(shot.type.name)) & player.name=="Bethany England") #1
shotmapxgcolors <- c("#192780", "#2a5d9f", "#40a7d0", "#87cdcf", "#e7f8e6", "#f4ef95", "#FDE960", "#FCDC5F", "#F5B94D", "#F0983E", "#ED8A37", "#E66424", "#D54F1B", "#DC2608", "#BF0000", "#7F0000", "#5F0000") #2
ggplot() +
annotate("rect",xmin = 0, xmax = 120, ymin = 0, ymax = 80, fill = NA, colour = "black", size = 0.6) +
annotate("rect",xmin = 0, xmax = 60, ymin = 0, ymax = 80, fill = NA, colour = "black", size = 0.6) +
annotate("rect",xmin = 18, xmax = 0, ymin = 18, ymax = 62, fill = NA, colour = "black", size = 0.6) +
annotate("rect",xmin = 102, xmax = 120, ymin = 18, ymax = 62, fill = NA, colour = "black", size = 0.6) +
annotate("rect",xmin = 0, xmax = 6, ymin = 30, ymax = 50, fill = NA, colour = "black", size = 0.6) +
annotate("rect",xmin = 120, xmax = 114, ymin = 30, ymax = 50, fill = NA, colour = "black", size = 0.6) +
annotate("rect",xmin = 120, xmax = 120.5, ymin =36, ymax = 44, fill = NA, colour = "black", size = 0.6) +
annotate("rect",xmin = 0, xmax = -0.5, ymin =36, ymax = 44, fill = NA, colour = "black", size = 0.6) +
annotate("segment", x = 60, xend = 60, y = -0.5, yend = 80.5, colour = "black", size = 0.6)+
annotate("segment", x = 0, xend = 0, y = 0, yend = 80, colour = "black", size = 0.6)+
annotate("segment", x = 120, xend = 120, y = 0, yend = 80, colour = "black", size = 0.6)+
theme(rect = element_blank(), line = element_blank()) + # add penalty spot right
annotate("point", x = 108 , y = 40, colour = "black", size = 1.05) +
annotate("path", colour = "black", size = 0.6, x=60+10*cos(seq(0,2*pi,length.out=2000)),
y=40+10*sin(seq(0,2*pi,length.out=2000)))+ # add centre spot
annotate("point", x = 60 , y = 40, colour = "black", size = 1.05) +
annotate("path", x=12+10*cos(seq(-0.3*pi,0.3*pi,length.out=30)), size = 0.6,
y=40+10*sin(seq(-0.3*pi,0.3*pi,length.out=30)), col="black") +
annotate("path", x=107.84-10*cos(seq(-0.3*pi,0.3*pi,length.out=30)), size = 0.6,
y=40-10*sin(seq(-0.3*pi,0.3*pi,length.out=30)), col="black") +
geom_point(data = shots, aes(x = location.x, y = location.y, fill = shot.statsbomb_xg, shape = shot.body_part.name), size = 6, alpha = 0.8) + #3
theme(axis.text.x=element_blank(),
axis.title.x = element_blank(),
axis.title.y = element_blank(),
plot.caption=element_text(size=13,family="Source Sans Pro", hjust=0.5, vjust=0.5),
plot.subtitle = element_text(size = 18, family="Source Sans Pro", hjust = 0.5),
axis.text.y=element_blank(), legend.position = "top",
legend.title=element_text(size=22,family="Source Sans Pro"),
legend.text=element_text(size=20,family="Source Sans Pro"),
legend.margin = margin(c(20, 10, -85, 50)),
legend.key.size = unit(1.5, "cm"),
plot.title = element_text(margin = margin(r = 10, b = 10), face="bold",size = 32.5, family="Source Sans Pro", colour = "black", hjust = 0.5),
legend.direction = "horizontal",
axis.ticks=element_blank(), aspect.ratio = c(65/100),
plot.background = element_rect(fill = "white"), strip.text.x = element_text(size=13,family="Source Sans Pro")) +
labs(title = "Beth England, Shot Map", subtitle = "FAWSL, 2019/20") + #4
scale_fill_gradientn(colours = shotmapxgcolors, limit = c(0,0.8), oob=scales::squish, name = "Expected Goals Value") + #5
scale_shape_manual(values = c("Head" = 21, "Right Foot" = 23, "Left Foot" = 24), name ="") + #6
guides(fill = guide_colourbar(title.position = "top"), shape = guide_legend(override.aes = list(size = 7, fill = "black"))) + #7 coord_flip(xlim = c(85, 125)) #8
- Simple filtering, leaving out penalties. Choose any player you like of course.
- Much like the defensive activity colours earlier, these will set the colours for our xG values.
- Here's where the actual plotting of shots comes in, via geom_point. We're using the the xG values as the fill and the body part for the shape of the points. This could reasonably be anything though. You could even add in colour parameters which would change the colour of the outline of the shape.
- Again titling. This can be done dynamically so that it changes according to the player/season etc but we will leave that for now. Feel free to explore for youself though.
- Same as last time but worth pointing out that 'name' allows you to change the title of a legend from within the gradient setting.
- Setting the shapes for each body part name. The shape numbers correspond to ggplot's pre-set shapes. The shapes numbered 21 and up are the ones which have inner colouring (controlled by fill) and outline colouring (controlled by colour) so that's why those have been chosen here. oob=scales::squish takes any values that are outside the bounds of our limits and squishes them within them.
- guides() allows you to alter the legends for shape, fill and so on. Here we are changing the the title position for the fill so that it is positioned above the legend, as well as changing the size and colour of the shape symbols on that legend.
- coord_flip() does what it says on the tin - switches the x and y axes. xlim allows us to set boundaries for the x axis so that we can show only a certain part of the pitch, giving us:
That's all for now. Hopefully this wasn't all too confusing and you picked up some bits and bobs you can take away to play with yourselves. Don't worry if some of this is overwhelming or you have to do copious amounts of googling to overcome odd specific errors and whatnot. That's just part and parcel with coding (seriously, get used to googling for errors, everyone has to).
Much love. Be well and have great days.
Messi Data Release Part 2, 2008/09 - 2011/12
Last week we unleashed the first part of our Messi dataset, covering the big little man's early days from 2004/05 - 2007/08. That first release offered a unique look into the burgeoning years of our intrepid protagonist. His formative days have never really been given this sort of treatment before, so the value was obvious and people seemed to have fun with it.
We did our analysis on the site featuring all sorts of data nuggets and cameos from famous faces. Of course though the whole point here is to get it out into the wider world so you can have a go with it. It's early days for this project but already folks are starting to get their feet wet. This project isn't just intended for experienced analysts, we want it to be a gateway for everyone into the world of playing with data (hence why we produced R Primers in English and Spanish). Here's an assorted selection of what folks on Twitter have shared so far, with apologies to anyone who feels left out:
"Made some non-messi Shotmaps using the @StatsBomb data. pic.twitter.com/lqqYQaDF04"
— caleb_shreve (@caleb_shreve) July 20, 2019
"The 🐐's link up play with Samuel Eto'o from 04/05 to 08/09. Data from the @StatsBomb #Messi database pic.twitter.com/3opUNQLnX0"
— Joe Shaw (@JosephShaw_) July 19, 2019
"some reminiscing on some early years Messi wizardry, courtesy of @StatsBomb's latest open data drop. highlighted games are the most potent in sharp end attacking contributions (highest xG, xG assisted, xG + xGA, per 90). pic.twitter.com/N0Cm6kgHwA"
— ewen (@ewen_) July 18, 2019
"Using @StatsBomb data, a look at Messi's early years (aged 17-20, under Frank Rijkaard), where he played predominantly on the right wing. 🐐 pic.twitter.com/UBVGHK8pDb""
— George Ball (@GeorgeBall95) July 21, 2019
"Who received passes from Messi most often between 2004-2008?
Left: total, Right: per 90.Messi most commonly passed to Xavi, Ronaldinho and Deco, followed closely by Eto'o. Will be interesting to see this develop through the years once the data is out. pic.twitter.com/Gdw3ogA9oB"
— ollie. (@bfcoIIie) July 21, 2019
"Here are Pass Sonars for some of Barcelona's key players and the team as a whole from the last @StatsBomb data release. pic.twitter.com/fYpDfkTdZV"
— Eliot McKinley (@etmckinley) July 22, 2019
"Plot of Messi's shot assists coded by their recipients, in seasons 2004-2008. pic.twitter.com/Z1lb82ElPy"
— ollie. (@bfcoIIie) July 21, 2019
"I'm a novice with R, but I was able to replicate their tutorial for the completed box pass plot for Messi. Gonna try some new things shortly pic.twitter.com/EjuuAZSSpg"
— Billy M (@Wideoverload) July 17, 2019
"Was messing around with the first batch of Statsbomb's Messi data and it amused me to spot this.
This is 2004/05 to 2007/08.
Dani Alves joined Barcelona in July 2008. pic.twitter.com/zUoOMbf3s8"
— Mark @ Get Goalside! (@Get_Goalside) July 21, 2019
"The Early Evolution of Lionel Messi
Using @StatsBomb data to visualize where #Messi got involved in goal possessions across his first four seasons.#FCBarcelona #soccerviz pic.twitter.com/FUn6i26U4k"
— Rasmus Christensen (@wiscostretford) July 17, 2019
"Here are Messi's El Clásico dribblings during those years.
Standout being the one before his 90th minute 3-3 equalizer in 2007 at Camp Nou - his 3rd goal of the match.
Highlights gave me goosebumps:https://t.co/uX04DFqz10
His Third:https://t.co/ljMjaIJPeF@Statsbomb Data pic.twitter.com/WJHTh0uDrE"
— danzn1 (@danzn1) July 16, 2019
Now though, we bring in part two. Given Messi's inconsistent playing time during those initial years, the real meat of his career was yet to come. With this new dataset you'll really get the chance to sink your teeth into some beefy stuff.
Our second release covers 2008/09 - 2011/12. That'll be the entirety of Pep Guardiola's time as Barcelona manager and, my word, what heady days they were. Trophies galore, heaps of goals and essentially turning football on its head (for better or worse, depending on your perspective) via the medium of a million passes. This, of course, is also when Messi himself went truly supernova. At 21-years-old he had now moved from 'best young talent in the world' to 'this is absurd, how is he even doing this, Jesucristo'.
But don't take my word for it. All of that data is now yours to play with at your own leisure (it actually quietly went up last night! Hello to any eagle-eyed folks - Ethan - who spotted that). If you've yet to use our data then head over to our resource centre, sign the user agreement and jump in. If you're already set up then you don't need to do anything, the new seasons are all there. Enjoy finding your own ways to demonstrate Messi's ridiculousness.
Again, if you're a bit tentative with getting started then have a gander at our guides for using the data in R. Hopefully they'll offer a gentle nudge in the right direction.
GUIDE IN ENGLISH HERE -> Using StatsBomb Data In R English
GUIDE IN SPANISH HERE--> Using StatsBomb Data In R - Spanish
However you approach it you should have a blast digging into the Pep-era data. Next week this tour takes us to the 2012/13 - 2015/16 seasons, the era of 'Messidependencia', the dawn of a new preposterous attacking trio and all sorts of records being broken.
Until then, be well and have great days.
Messi Data Release Part 1 & Working with StatsBomb Data in R
Manchester City: 2018-19 Season Preview
Well. That went alright didn’t it?
Manchester City’s 2017/18 was nonsensically good. They broke so many records (most points, best goal difference, most wins, ad infinitum) that even fervent supporters will have lost track at some point. Pep Guardiola and co. did the same thing to the Premier League that they did to the Bundesliga with Bayern - perhaps to an even greater degree.
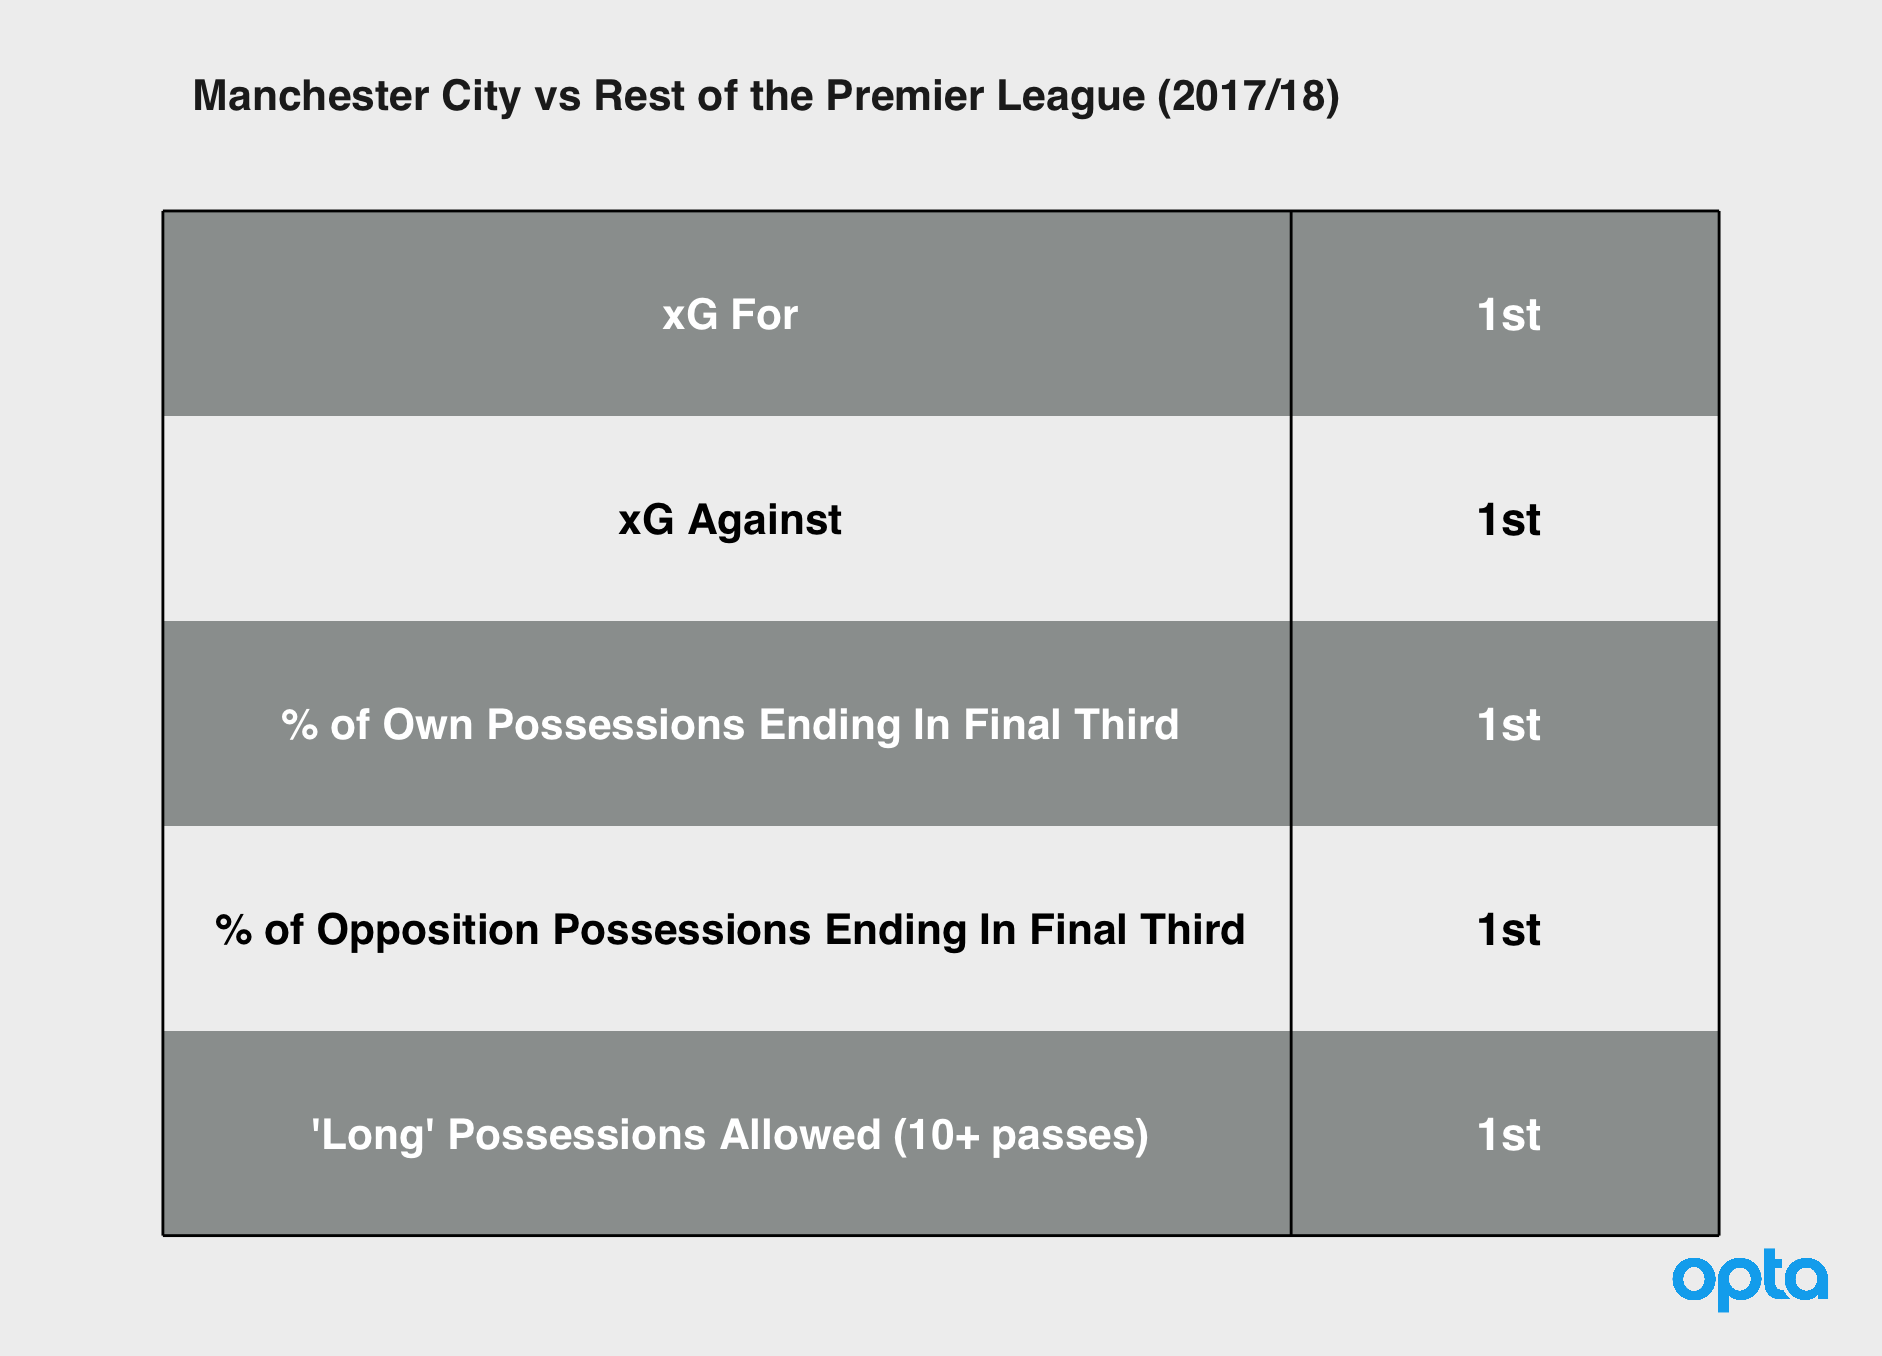
City's bread and butter is obviously their possession game. They had just shy of 1000 open play possessions that featured at least 10 passes last season. A bit over 200(!) more than the team with the second most. Their xG per possession on those 10+ pass possessions was - as you may have guessed - the best in the league.
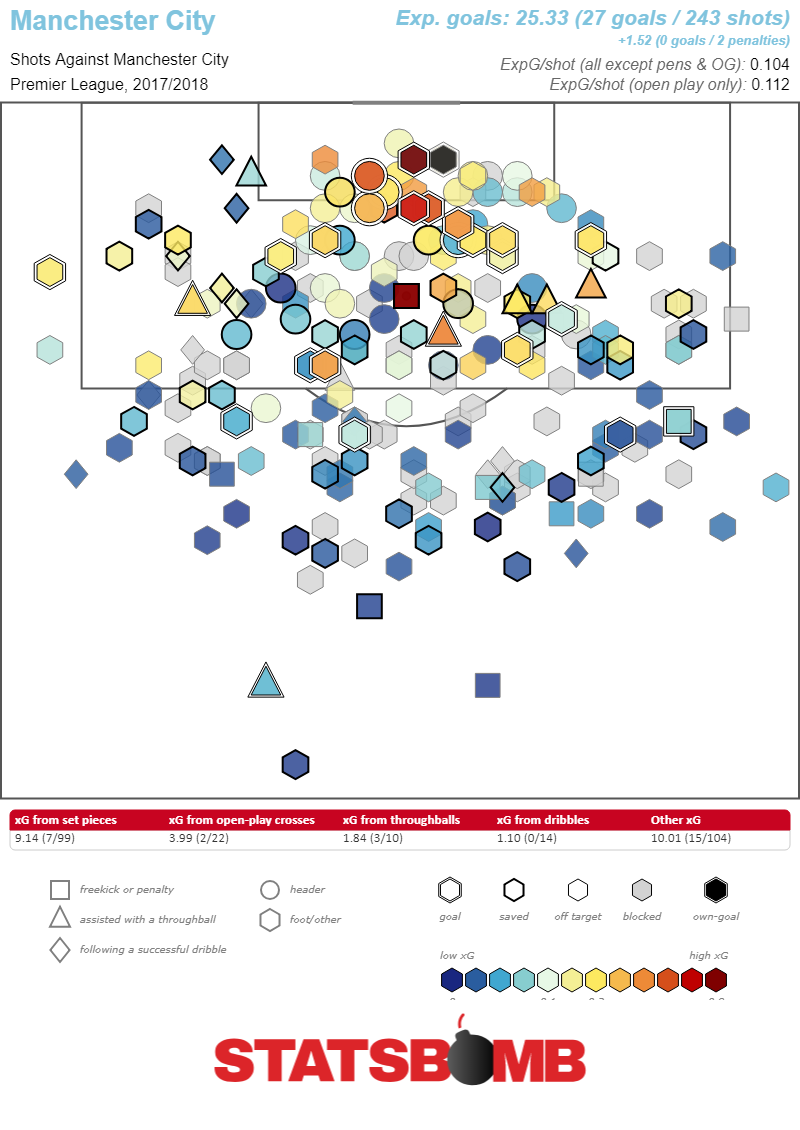
All that possession high up the pitch has a clear tradeoff: lots of space in behind. The possibility of that space being exploited is they key defensive worry for any adventurous team, but City did an excellent job of marshalling it. And, to stay on theme, their xG per shot allowed on these was also the lowest in the league.
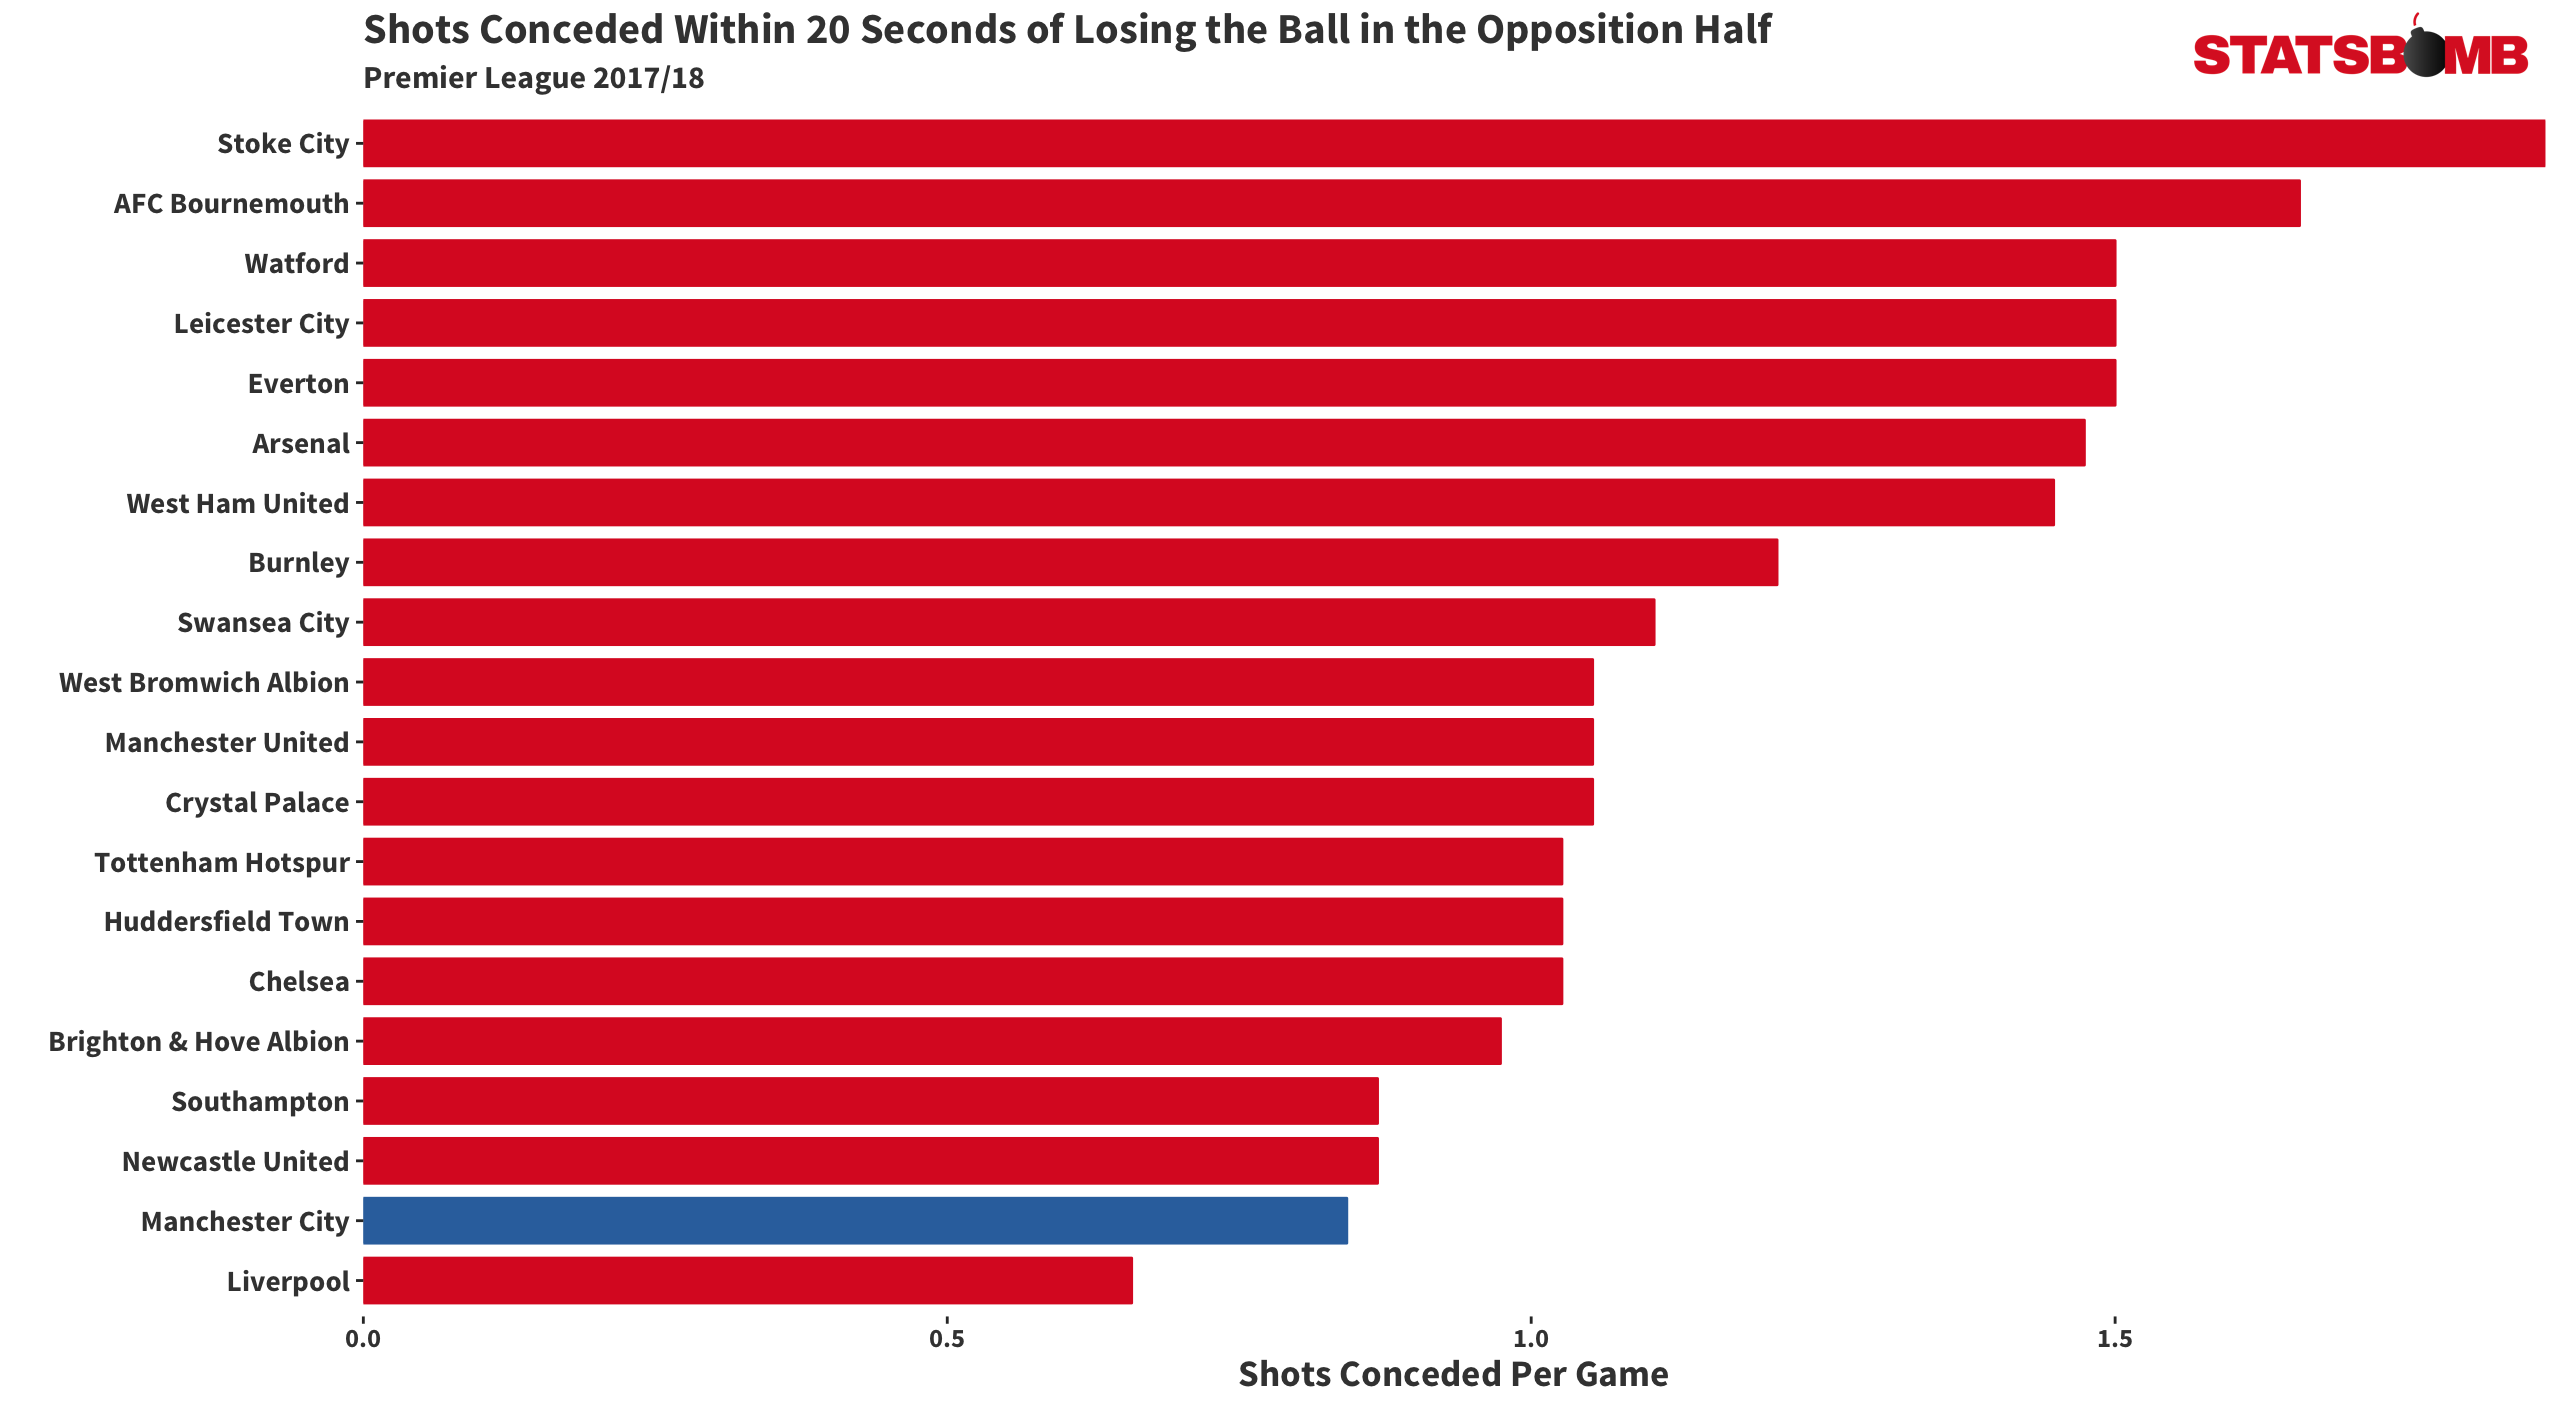
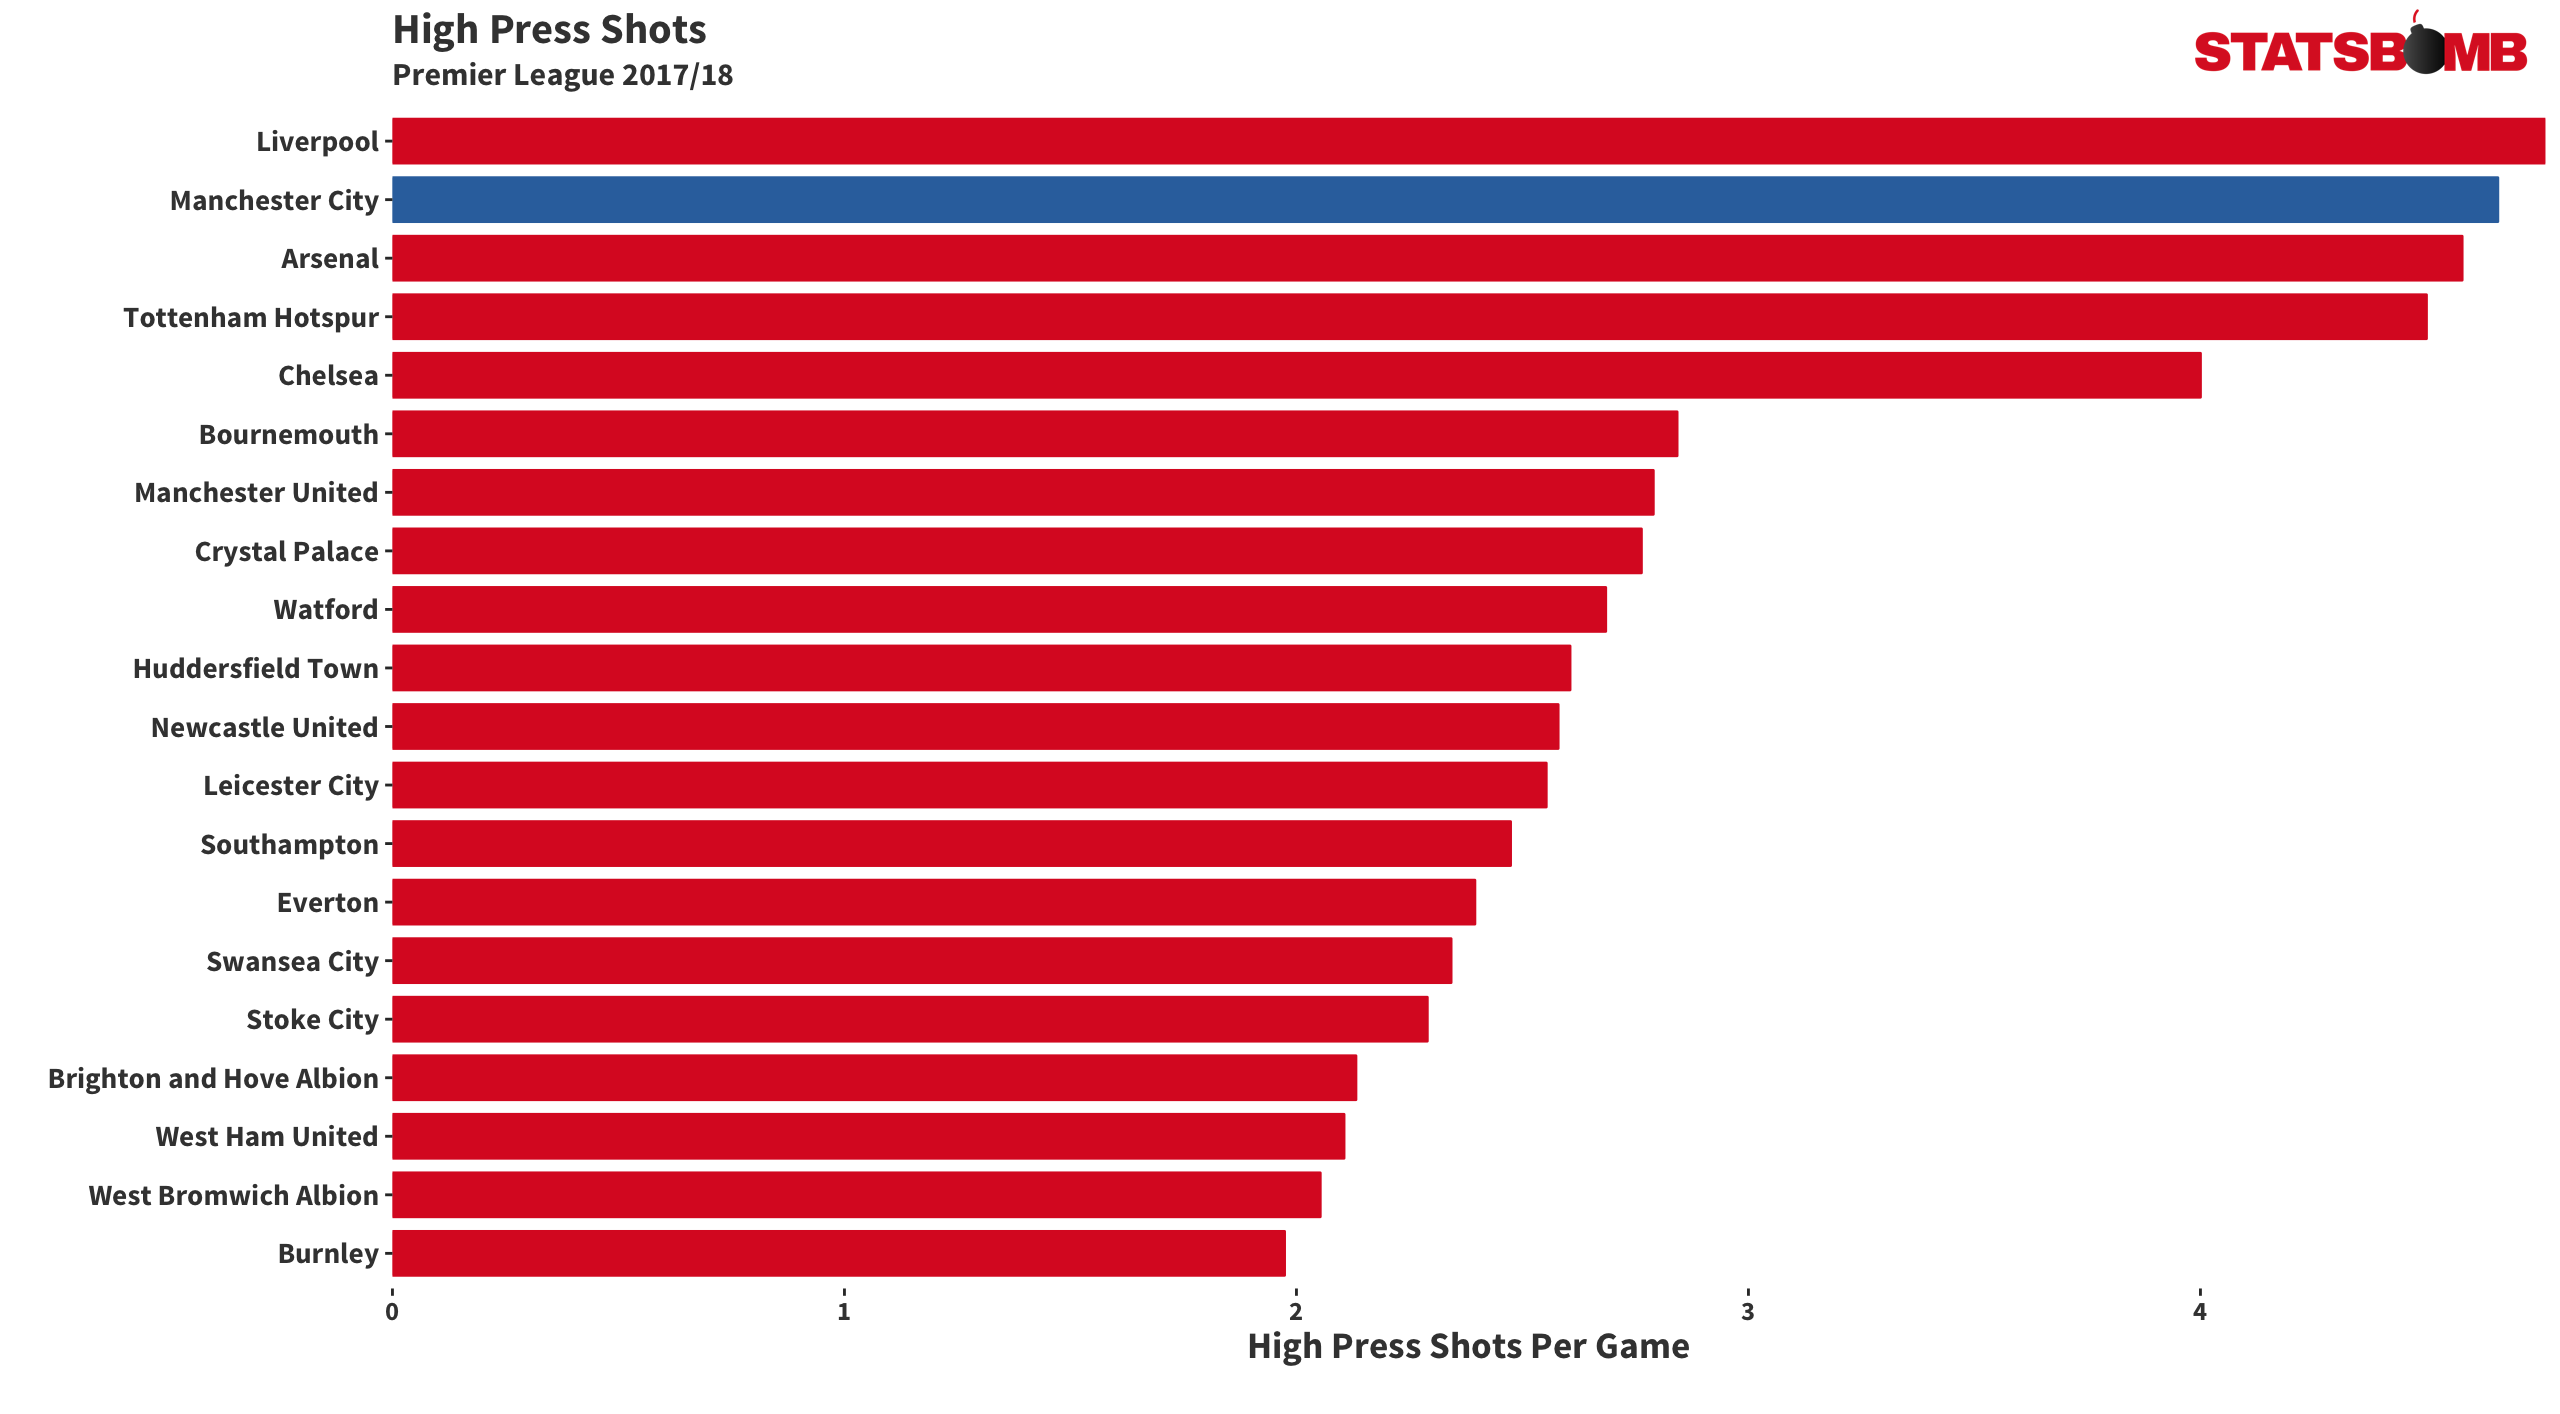
Yet their repertoire expanded beyond being slow, ball-hog masters. When you're facing bunkered defences so often it pays to squeeze extra bits of useful attack from your press (or closing down, if you prefer some good old fashioned terminology). The amount of shots City generated from off-ball defending - bearing in mind how much time they spend on the ball - was impressive. They allowed their share of chances on the other end (the percentage of their shots conceded where only the goalkeeper was in between shot-taker and goal was second highest in the PL) but gave up so few opportunities overall that it balanced out.
They weren't always brilliant, however, waning as the season rolled on. The instinct is to attribute this to facing defences that were ever-deepening out of fear of being steamrolled, but the data doesn't back this up. The average defensive distance of their opposition didn't really change over time - in fact they were pressed in their own half more often in the second half of the campaign. This became somewhat of a problem as, when City failed to complete a pass or dribble under pressure in their own half, they ended up conceding shots following that at a mid-table rate.
They didn't increase in conservatism either; the average position for their fullbacks, again, actually got higher up the pitch near the end of the campaign, and they were attempting just as many risky passes. Their creation from set pieces also slumped from January onwards, dropping from 0.38 xG per game to 0.28. There's all sorts of stuff you could run through but really it's just a combination of a few smaller problems, all likely brought on by the simple fact that it's hard to maintain a high level of performance over a lengthy season. Fatigue, familiarity, all sorts of factors start to kick in.
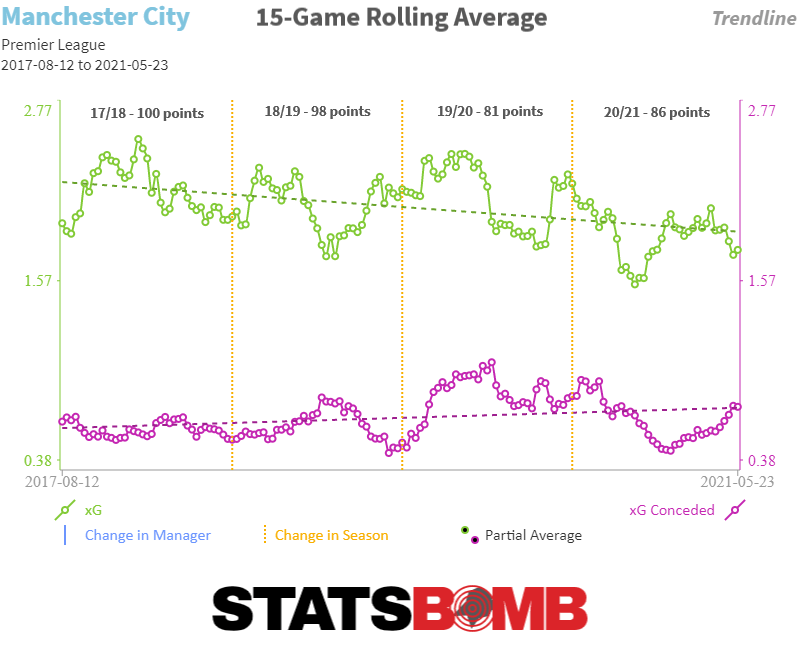
Then there's also that most dreaded of topics: reversion. Premier League winners generally follow a specific statistical trend. Most years, the clump of teams at the top of the table are quite close in actual quality. The teams who pull away from the pack benefit from hot streaks - mostly in terms of goal conversion both for and against - that exaggerate the differences between them and everyone else. They convert shots at a ridiculous rate, their goalkeepers save shots against them at a ridiculous rate, so on and so forth.
This isn’t to say these teams weren’t the best team in the land that season, or that they were overtly ‘lucky’. You can judge that for yourself. The point is that the margins are smaller than they appear when the league table is finalised. These aspects come down to earth as the league calendar turns over.
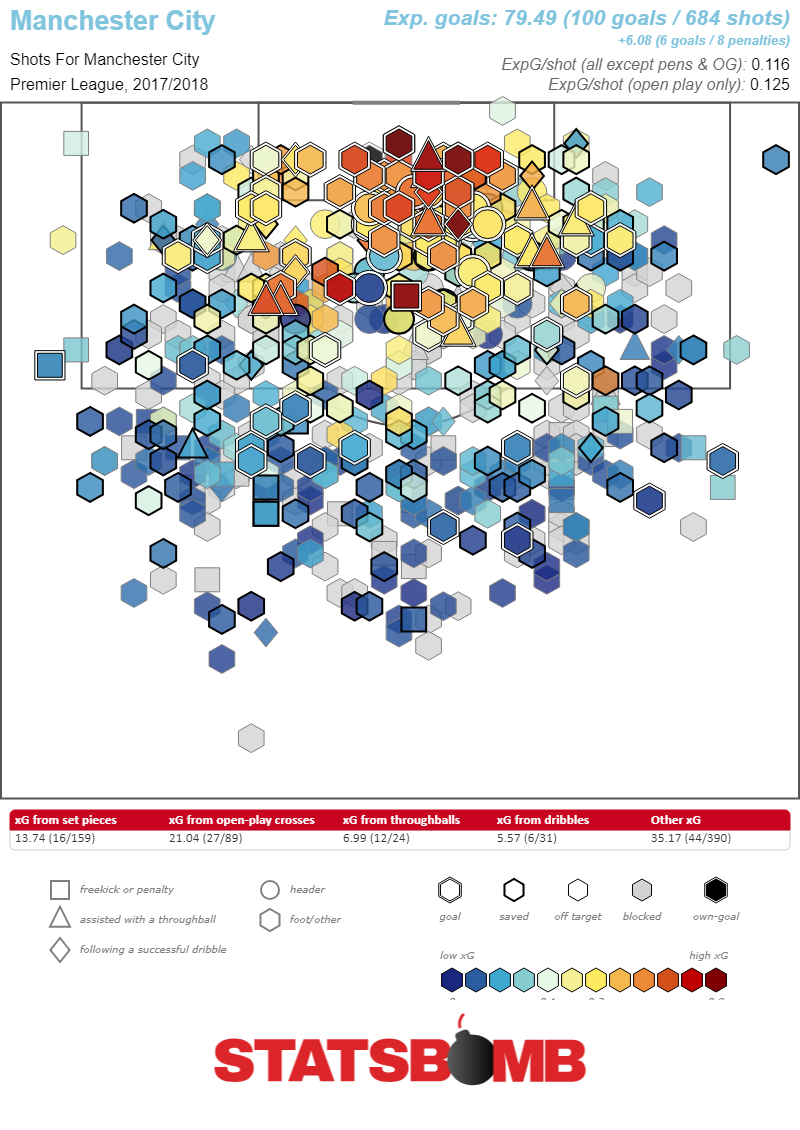
This was the case with Man City too. They converted shots at an obscene pace, and on our own xG model they overperformed by around 20 goals in attack. One shouldn’t expect this to repeat in 18/19, even with their stacked set of talent. The thing is though: they were so far above to begin with that it basically doesn't matter. In every regard you could consider - be it shot differential, expected goal difference, various passing metrics etc - they were clearly the leaders. Repeat that season without the variance bounce and they still walk it. Everything else was merely the hot sauce on top that helped them be next-level historic.
In reality, the team likely isn't as invincible as they first appeared. There are little holes in their game to be poked at, but the same is true of every team ever. There will be a couple of games next season - probably against Liverpool, natch - where the opposition will be able to blunt their attack and/or ferociously exploit the spaces they naturally leave open. That happens. No approach works all of the time, but Man City's works pretty damn often.
__________________
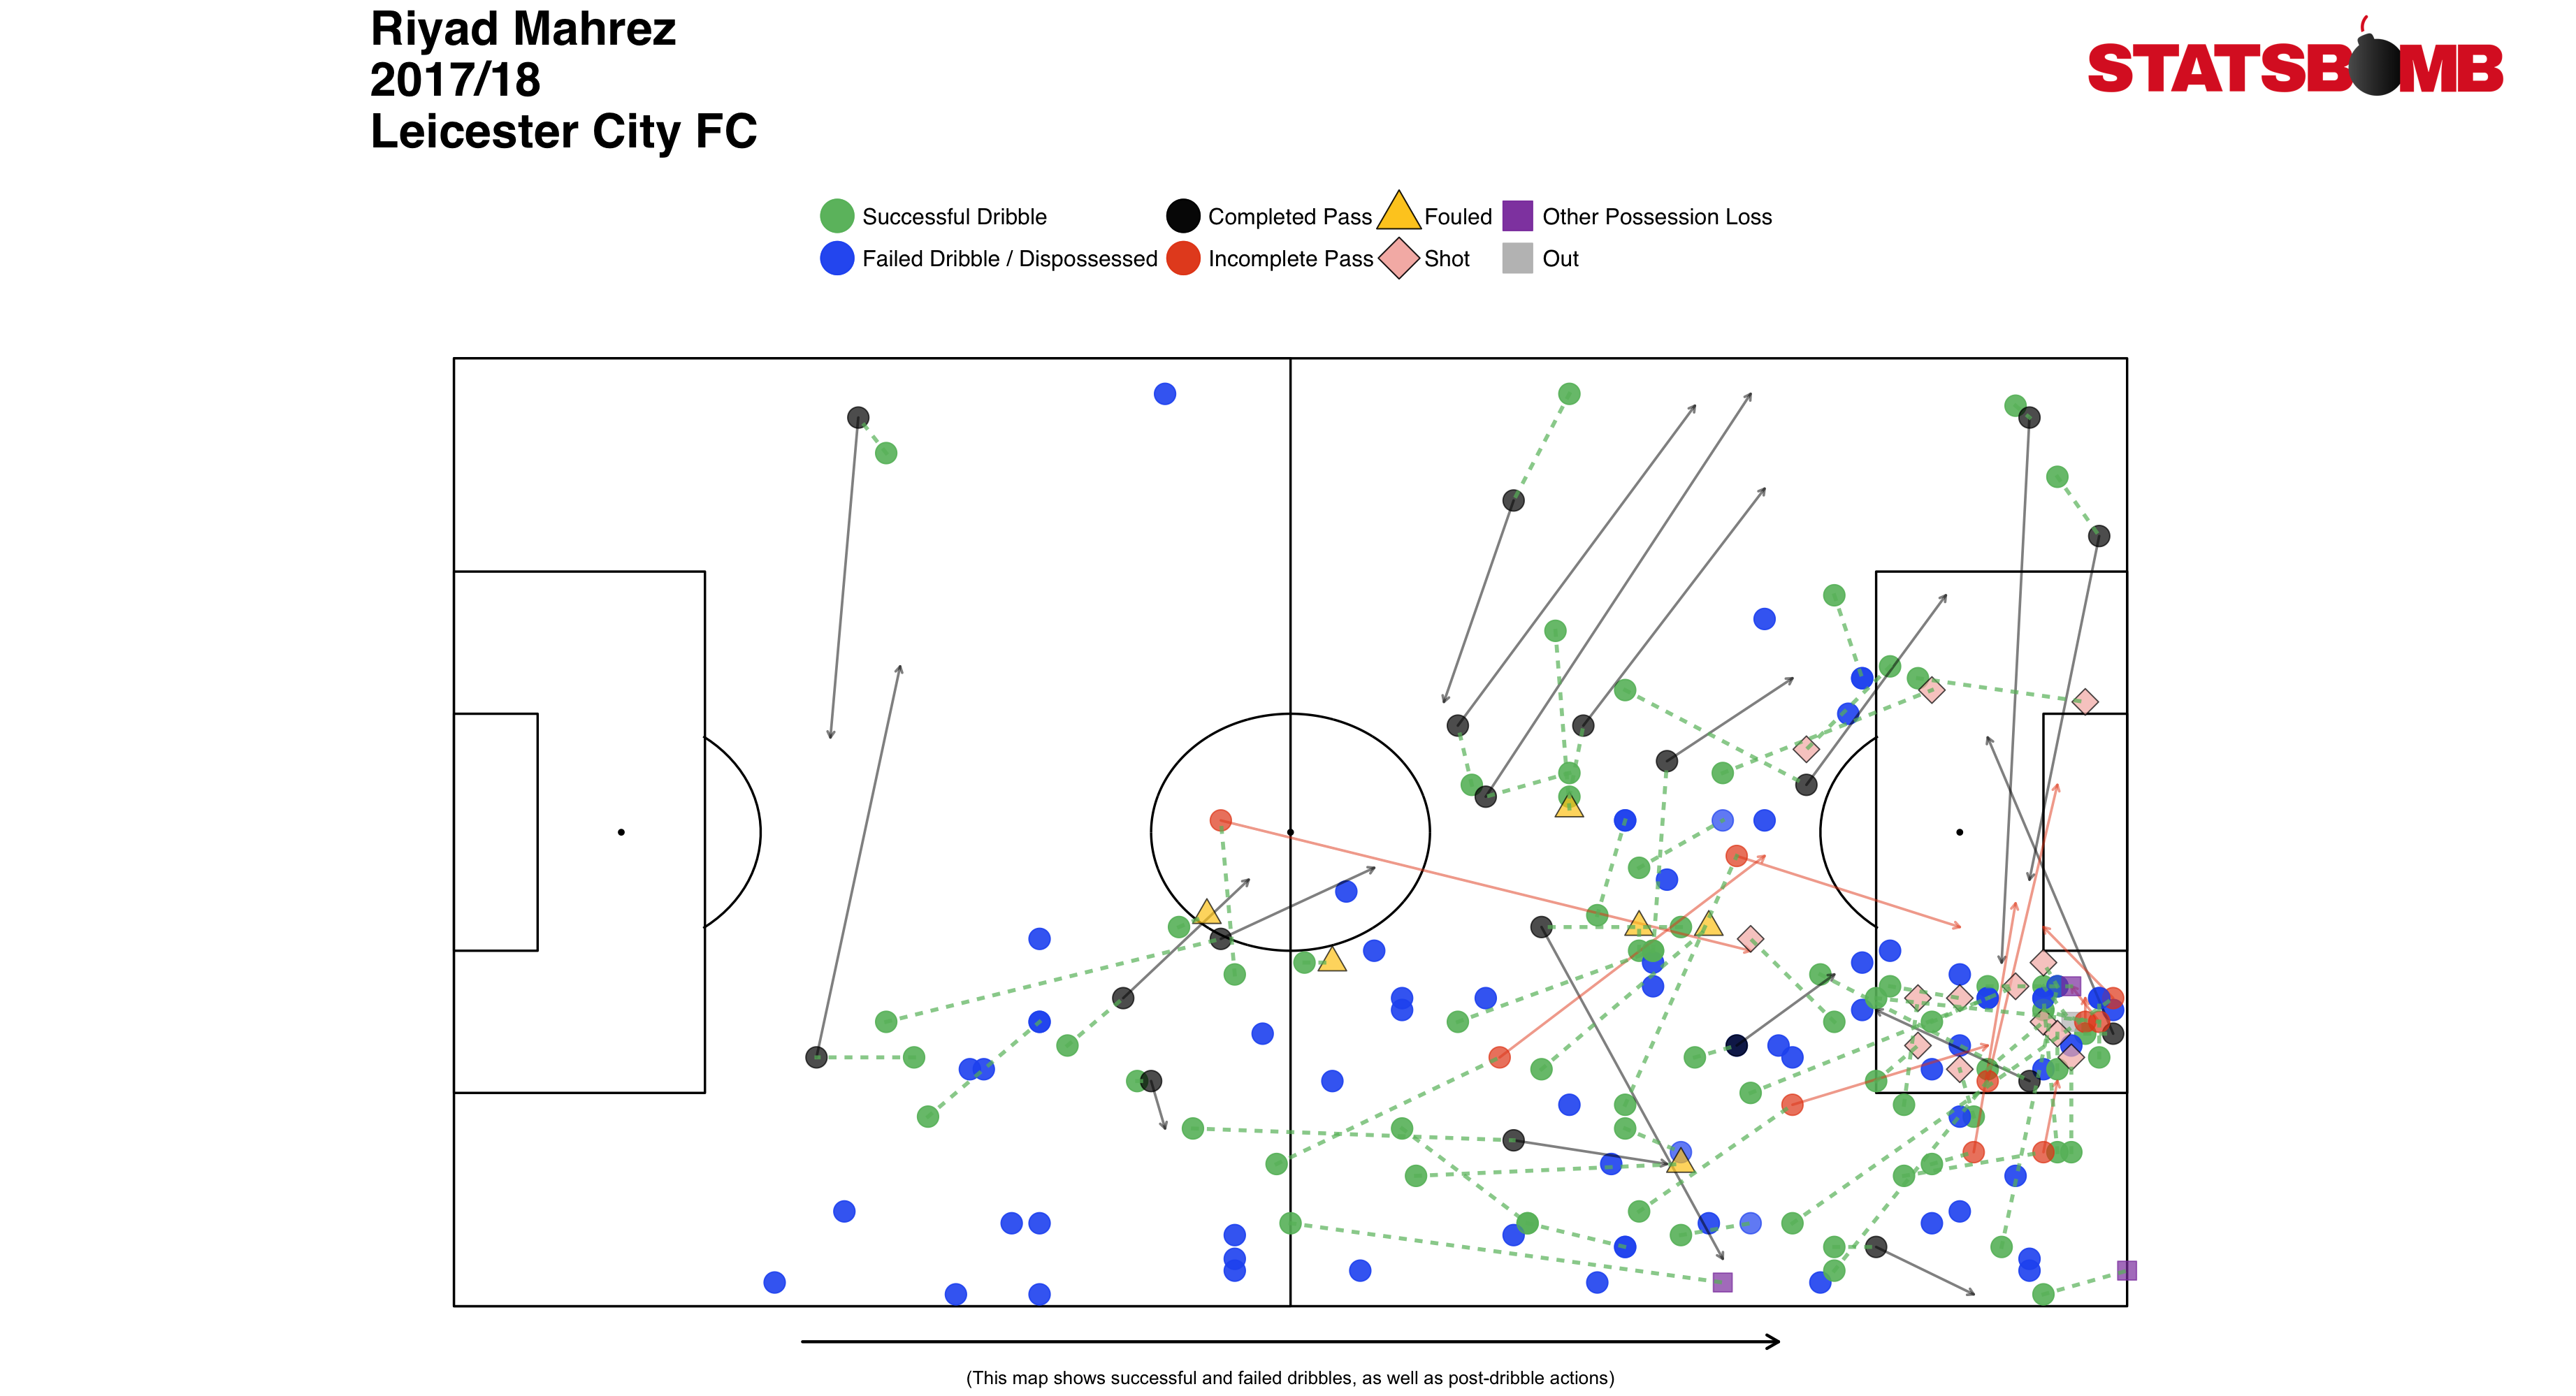
The player who completed the most throughballs in the PL last season was Kevin De Bruyne. In second place was Riyad Mahrez, who now plays for *checks notes* oh...
Obviously City didn’t make Mahrez their club record signing (£60m!) purely because of his throughball numbers, but this partially illustrates their reasoning. How do you improve a juggernaut attack? One way to go about it is to snap up possibly the only remaining player in your league that fits your stylistic template. Among players outside the top six Mahrez lead his peers by some margin in xG assisted. He’s a creative force to pile on top of other creative forces. At Leicester he mostly thrived in transition, but with his lovely weight of pass through small windows, as well as tight, slinky ball-control, he should slot into Guardiola's system nicely.
If there's one problem with Mahrez, it's his shot selection. The man is a serial bad-shot taker, with an unsightly xG per shot. Last season that didn’t matter as he banged in 12 goals anyway - nearly double his xG. Flash back to 2016/17 and he managed three non-penalty goals from a similar profile. Such is the variable life of the technically superb yet overly ambitious shooter. The one bright spot is that his off-ball movement is solid on the occasions he utilises it. He got on the end of 18 transition shots (shots taken within 20 seconds of the opposition losing the ball deep), the second most in the league.
What really sticks out - aside from the pops from distance - is his predilection for coming inside and firing from wide angles. The man’s a solid dribbler and gets into dangerous locations using that skill, but the decision making from there is not so hot. He enjoys probing forward from central areas too. One imagines that Guardiola will emphasize the inventive side of his game. Pass don't shoot. And then, every few games, Mahrez will curl one in the top corner from a ridiculous angle just to remind you how gifted City are.
Is this addition at all necessary? No, let's be honest. It's a wild fee for what is essentially pouring more melted chocolate onto a running fondue fountain. Consider this though: Guardiola can now conjure up whatever positional potpourri he desires from a stable that includes Kevin De Bruyne, David Silva, Riyad Mahrez, Raheem Sterling, Leroy Sané, Gabriel Jesus and Bernardo Silva, with Sergio Agüero to pop up front. That’s absurd.
Beyond Mahrez, City's transfer window is curious more for the players they aren't buying. Silly as it may seem to say considering their overall riches, the midfield situation is looking a tad precarious. The current rotation of Fernandinho/İlkay Gündoğan/Fabian Delph is plenty talented but Fernandinho is 33 years old, Gündoğan is a constant injury risk and Delph is pulling double duty as a backup left back. Should one go down - or should their main left-back Benjamin Mendy have time off, forcing Delph to take that spot - that's some iffy territory. The club was heavily linked to Jorginho prior to him joining Chelsea, a missed move that would have gone a long way to quashing this unease. As it is, they may have to fall back on some Pep tactical tinkering if legs grow weary (an increased role for youngster Oleksandr Zinchenko?), or a winter window splurge.
__________________
Most seasons are preceded by repetitions of “insert team who won last season’s title here look well placed to defend it this year”. Invariably, things tend to spiral from there. The vagaries of football wreck merry hell on everyone's assumptions. Once the sheen has worn off and we come to see that teams are only ever that good for a short while, the landscape looks very different. However, with Manchester City, this isn’t just conventional lip service. There are concerns there, primarily the slightly uneven second half of last season and the potential for depth issues. Yet the aggregate gap they opened up was so large it would be foolish to suggest anything other than this: these are your indisputable 2018/19 title favourites. Have at 'em.
__________________
Thank you for reading. More information about StatsBomb, and the rest of our season previews can be found here.
Header image courtesy of the Press Association
Taking 'Em On: Digging Deeper With Dribbles
To define our terms upfront: a successful dribble in this context is when a player with possession of the ball takes it past an opponent. This is the definition that Opta uses, as well as sites like Squawka and Whoscored that present Opta’s data.
'Dribbles’/’Take-Ons’/whatever your football website of choice calls them are an odd stat in isolation. We can probably assume that a player who completes a lot dribbles is of a certain stylistic mould. Other than that though, there isn’t a lot to be learnt from those raw numbers about where these dribbles take place, where they go and what the players do afterwards.
To illustrate the point let’s compare two players: Manchester City’s Leroy Sané and Huddersfield’s Rajiv van La Parra. Both are wingers who play predominantly on the left and complete a bit over 3 dribbles per 90 in similar minutes (Sané at a 63.5% completion rate overall and La Parra at 53.5%). Their base stats are very similar, however if we map out where those dribbles start/end and the actions they follow them up with we can see a difference.
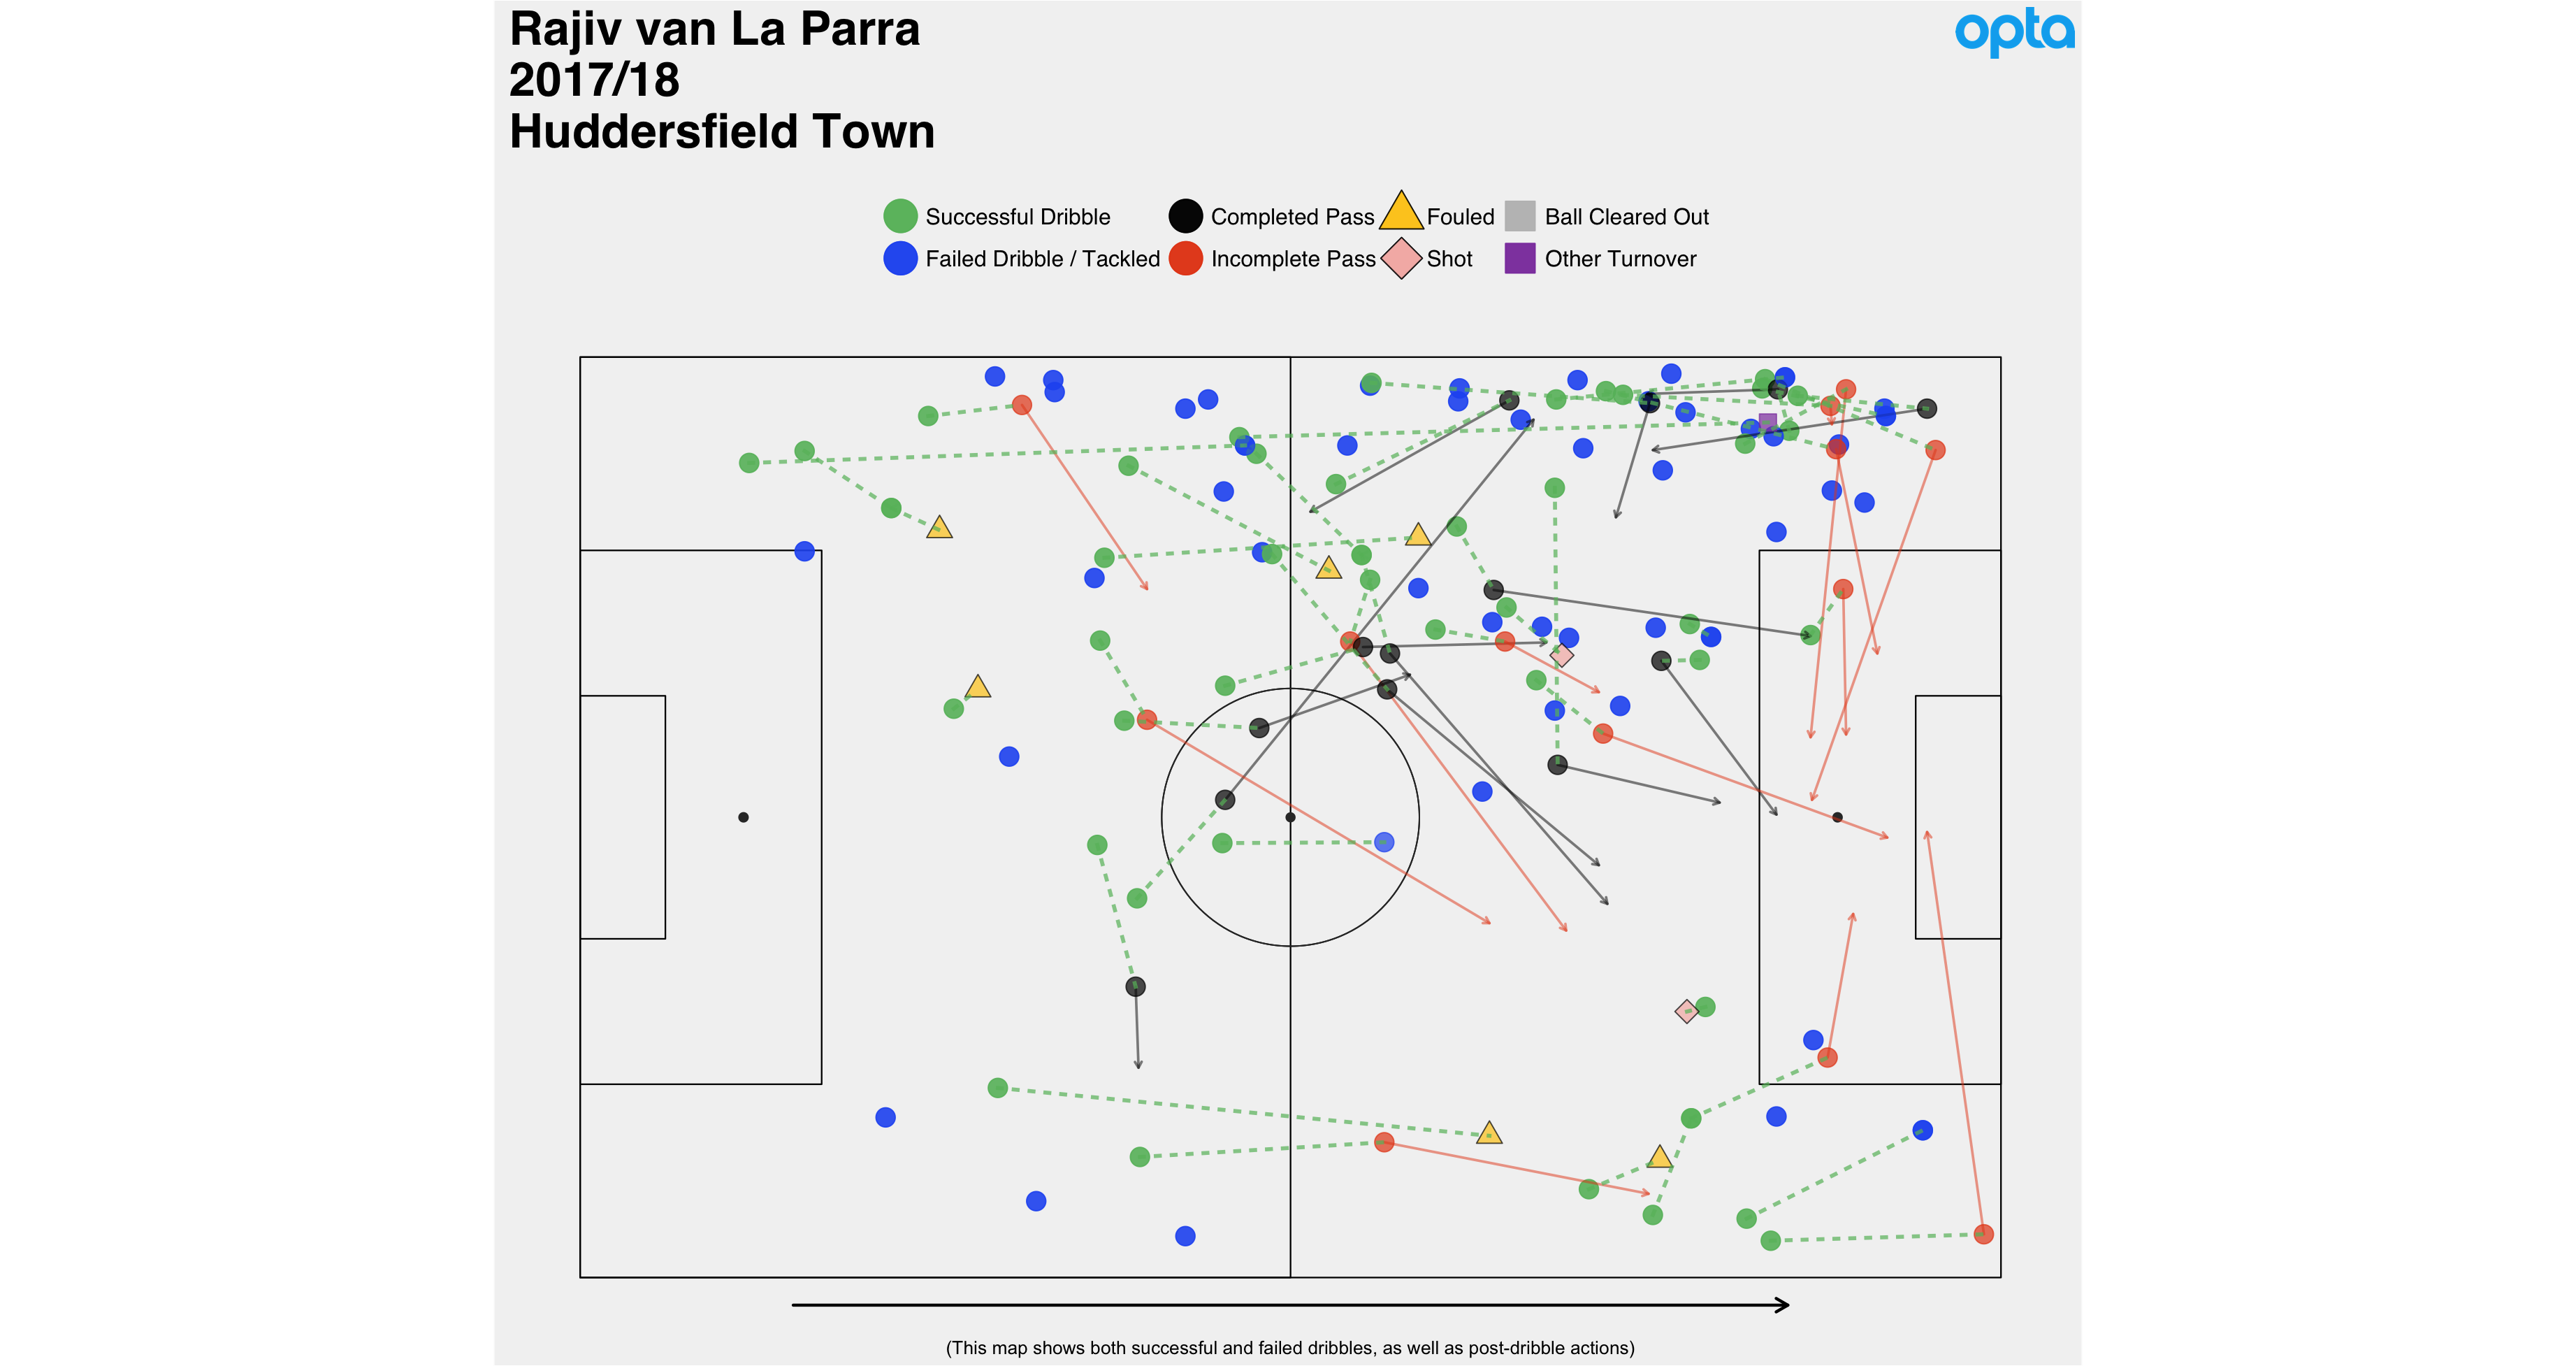
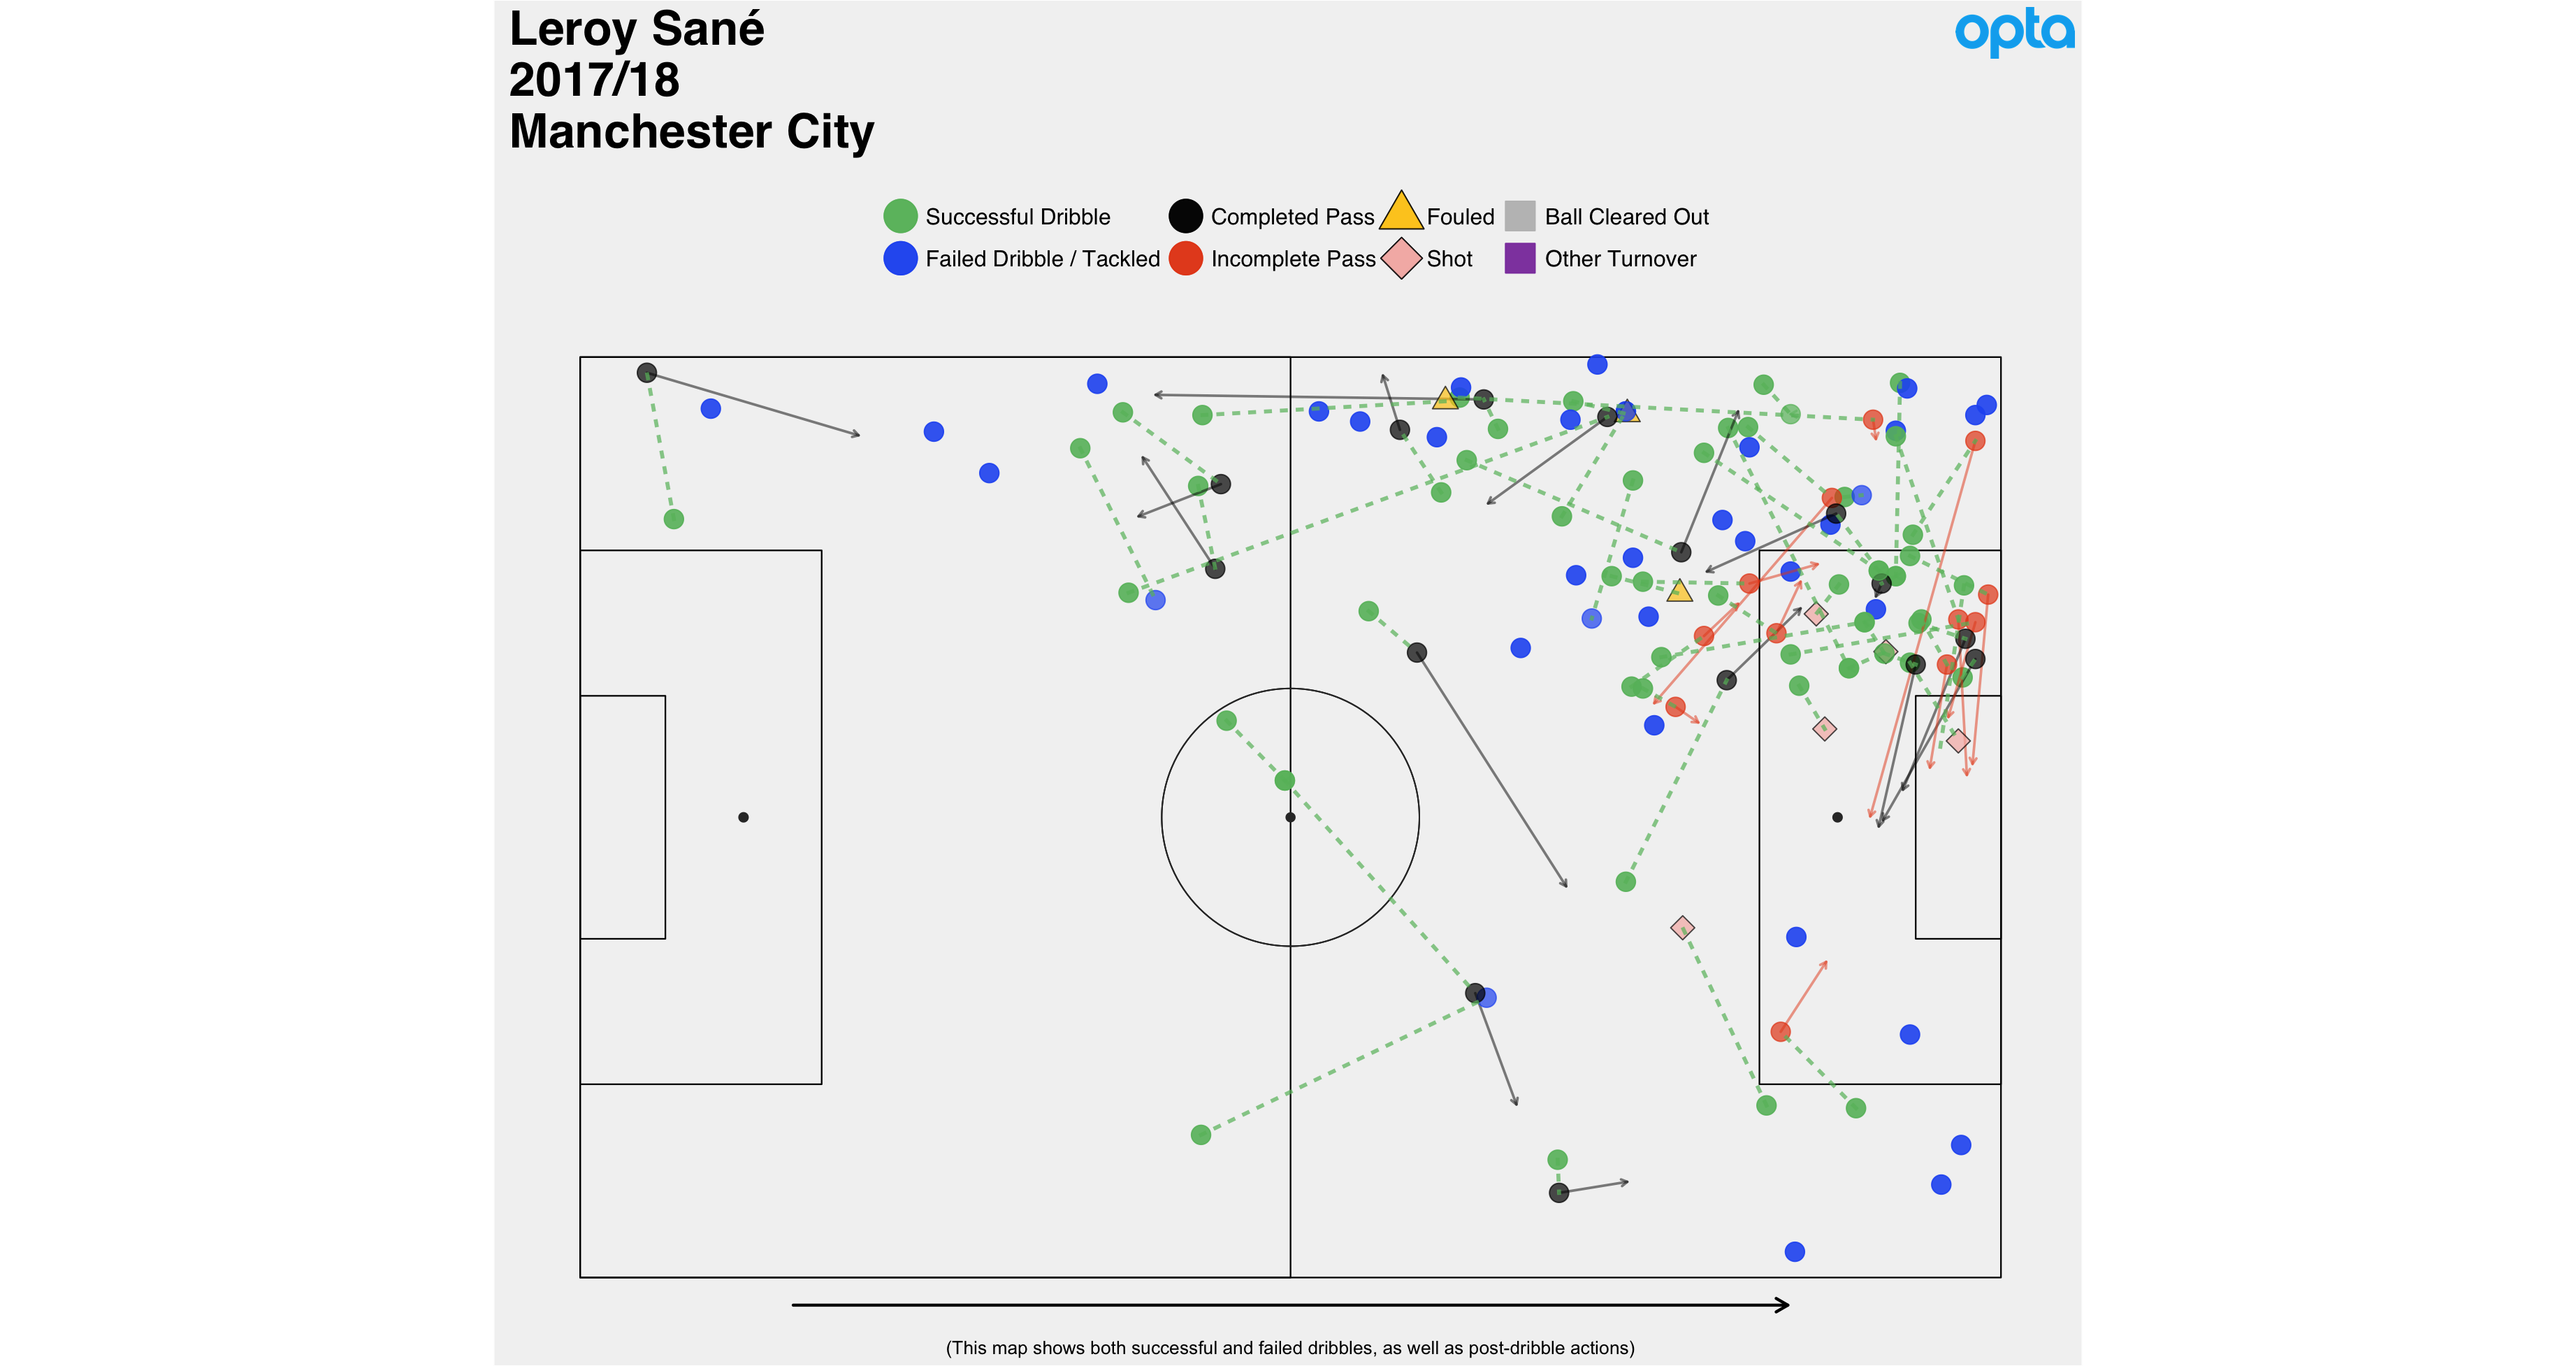
La Parra is often starting from deeper areas - he has attempted near the most dribbles starting in his own half of any player in the top 5 leagues - and ends up going inwards surprisingly frequently (most of his completed passes are received by their strikers or other attackers). His post-dribble work, especially in more traditional winger areas, isn’t great. However he does win his share of fouls and generally advances his team up the pitch. Sané, meanwhile, is operating in the opposition’s third and a whole hell of a lot in that cutback area his manager Guardiola loves. He’s already in such a dangerous area to begin with that the simple act of just beating his man is hugely concerning for the opposition to deal with. The rest is just the icing on the cake.
Obviously there is complexity wrapped around all this. Huddersfield are a world away from Man City, especially in terms of wider squad quality. Different players are needed to bring different qualities to different situations. La Parra needs to beat his man in order to help his team’s progression. Sané, who on average receives the ball already in the final third, needs to beat his man in order help his team break down deep blocks. Po-tay-to po-tah-to.
Below are the top players in terms of their dribble and post-dribble numbers entering and within the opposition box (all stats per 90 for the 2017/18 season. This dataset is missing a couple of Ligue 1 matches). There are clear standouts here: Messi is eye-watering (he already has more post-dribble box passes/shots in 17/18 than in the entirety of 16/17. At 30-years-old!), the Premier League names you'd expect are all there, Leon Bailey is having a lovely season for himself, so on and so forth.
| Dribbles Ending In Opposition Box | Post-Dribble Passes Ending In Opposition Box | Post-Dribble Shots In Opposition Box |
Post-Dribble Box Passes + Shots
|
|
| Lionel Messi | 1.88 | 0.76 | 0.58 | 1.34 |
| Eden Hazard | 1.00 | 0.39 | 0.50 | 0.89 |
| Leon Bailey | 0.61 | 0.54 | 0.34 | 0.87 |
| Kingsley Coman | 1.20 | 0.56 | 0.24 | 0.80 |
| Kylian Mbappe | 1.21 | 0.42 | 0.24 | 0.67 |
| Raheem Sterling | 0.75 | 0.37 | 0.28 | 0.66 |
| Christian Pulisic | 0.51 | 0.45 | 0.17 | 0.62 |
| Philippe Coutinho | 0.61 | 0.27 | 0.34 | 0.61 |
| Wilfried Zaha | 1.16 | 0.30 | 0.30 | 0.60 |
| Riyad Mahrez | 0.86 | 0.14 | 0.46 | 0.59 |
| Gonçalo Guedes | 1.15 | 0.22 | 0.36 | 0.58 |
| Ángel Correa | 0.86 | 0.19 | 0.37 | 0.56 |
| Iago Aspas | 0.68 | 0.32 | 0.23 | 0.55 |
| Johan Mojica | 0.34 | 0.54 | 0.00 | 0.54 |
| Leroy Sané | 1.16 | 0.29 | 0.23 | 0.52 |
| Florian Thauvin | 0.98 | 0.13 | 0.38 | 0.51 |
| Neymar | 0.83 | 0.33 | 0.17 | 0.50 |
| Mohamed Salah | 0.97 | 0.09 | 0.40 | 0.49 |
| Ruben Loftus-Cheek | 0.74 | 0.27 | 0.20 | 0.47 |
| Dennis Praet | 0.11 | 0.33 | 0.11 | 0.44 |
We can zoom out further, to take a look at involvement in possessions that go on to reach the opposition's final 18 yards (both via a dribble or a post-dribble pass), along with a player’s own individual entries to those areas. The added value from the dribbling of someone like a Hazard, a Boufal or whomever is obvious here. The final ball is the eye-catcher but offering a means of progression is important too.
| Unique Possessions Ending in Opposition Final 18 Yards Involved In (Via a Dribble That Starts Outside Final 18 Yards) | Individual Entires to Final 18 Yards (Via Dribble or Post-Dribble Pass) | Individual Entires to Final Third (Via Dribble or Post-Dribble Pass) |
Average Vertical Dribble Distance On Those Possessions (Metres)
|
|
| Eden Hazard | 2.39 | 1.11 | 0.78 | 7.71 |
| Neymar | 2.17 | 0.89 | 0.72 | 6.73 |
| Kingsley Coman | 2.16 | 1.12 | 0.48 | 10.48 |
| Lionel Messi | 1.97 | 0.98 | 0.67 | 6.82 |
| Diego Perotti | 1.90 | 0.59 | 1.03 | 5.86 |
| Sofiane Boufal | 1.78 | 0.77 | 0.39 | 8.40 |
| Isco | 1.59 | 0.30 | 0.53 | 8.50 |
| Douglas Costa | 1.45 | 1.16 | 0.29 | 11.06 |
| Luka Modric | 1.42 | 0.37 | 0.31 | 5.47 |
| Jonathan Viera | 1.39 | 0.22 | 0.61 | 5.86 |
| Fede Cartabia | 1.38 | 0.58 | 0.51 | 6.51 |
| Jack Wilshere | 1.38 | 0.20 | 0.69 | 7.73 |
| Rémy Cabella | 1.38 | 0.72 | 0.22 | 6.59 |
| Tanguy NDombele Alvaro | 1.31 | 0.36 | 0.36 | 6.10 |
| Ruben Loftus-Cheek | 1.28 | 0.95 | 0.20 | 8.11 |
| Malcom | 1.28 | 0.09 | 0.46 | 7.62 |
| Andros Townsend | 1.25 | 0.83 | 0.29 | 8.10 |
| Christian Pulisic | 1.25 | 0.91 | 0.45 | 14.47 |
| Alex Oxlade-Chamberlain | 1.23 | 1.23 | 0.48 | 15.96 |
| Florian Thauvin | 1.23 | 0.68 | 0.30 | 6.63 |
| Mario Lemina | 1.20 | 0.28 | 0.28 | 8.84 |
| Valentin Rosier | 1.18 | 0.45 | 0.11 | 9.73 |
| Gonçalo Guedes | 1.15 | 0.86 | 0.58 | 19.56 |
| Naby Keita | 1.14 | 0.43 | 0.43 | 7.34 |
| Manuel Lanzini | 1.11 | 0.37 | 0.50 | 10.25 |
| Paul Pogba | 1.11 | 0.13 | 0.39 | 5.34 |
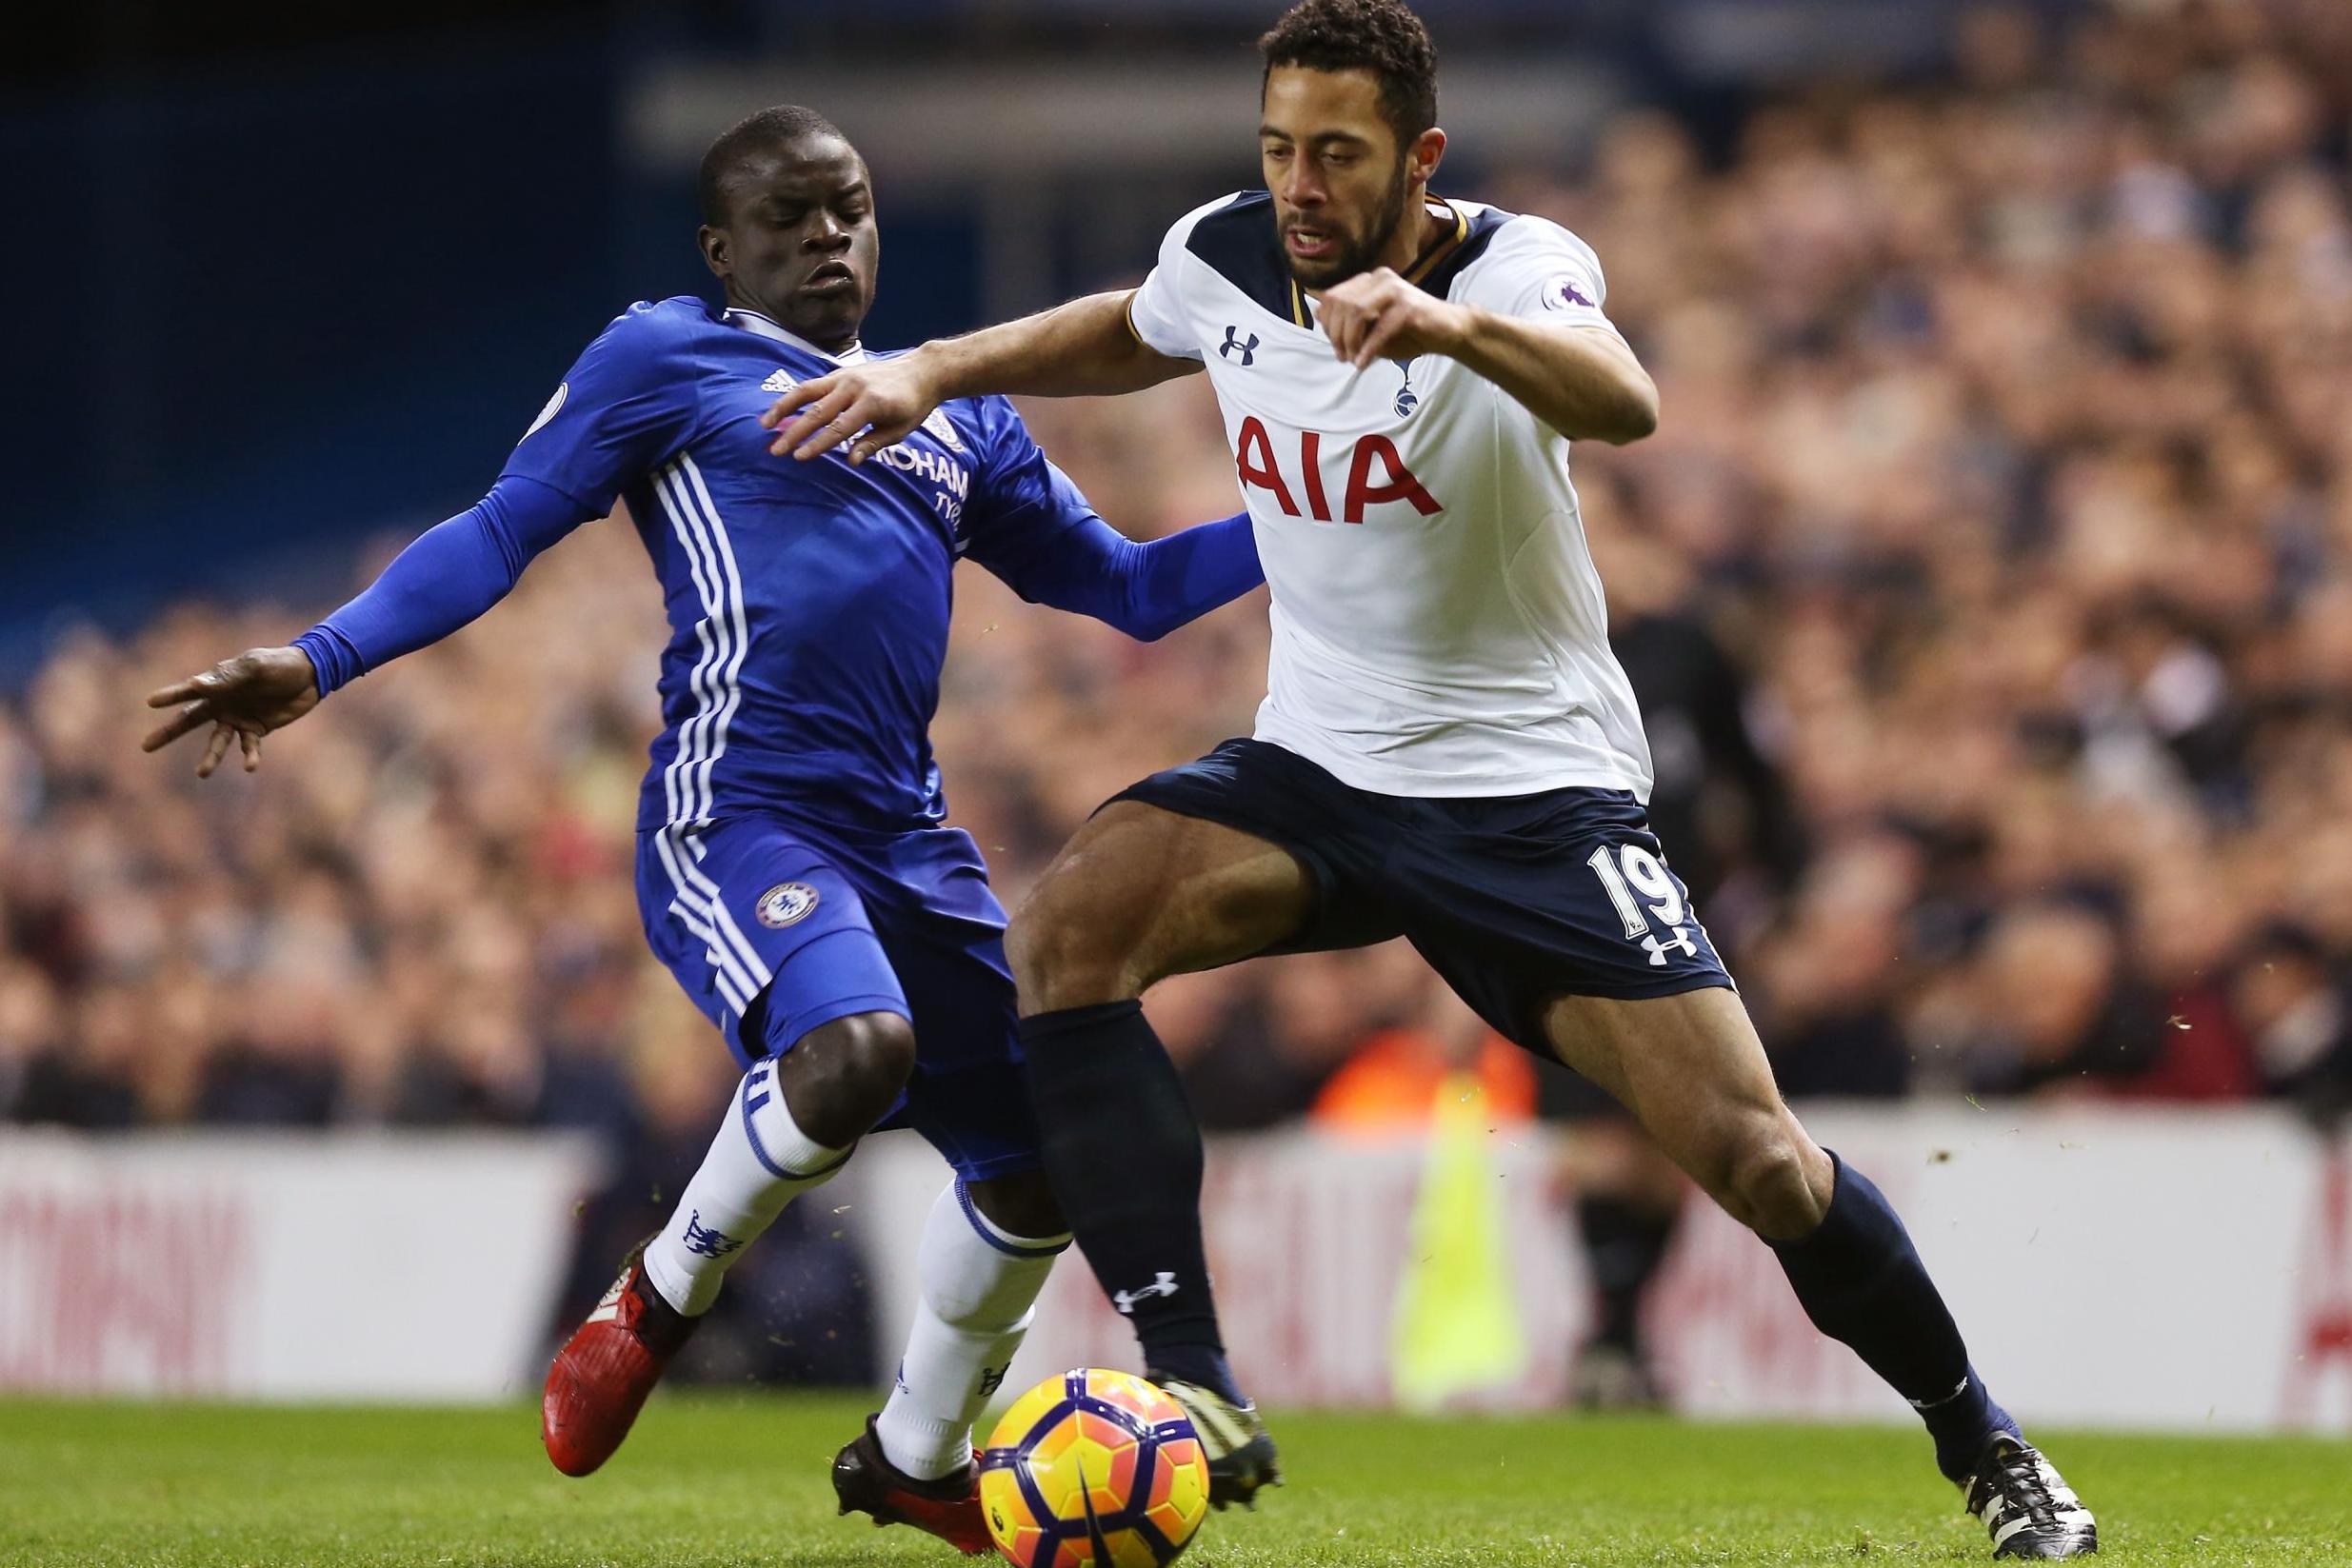
The focus shouldn’t be on just pure attackers though. The list below shows involvement in possessions that end in the opposition's final third, filtered to players whose median dribble location is outside the final third. Sort by percentage of these dribbles that come through the centre (within the width of the penalty boxes, minimum 30 possessions involved in) and this is where some real atypical profiles come up. E.g: Mousa Dembélé. A main point of consternation for Tottenham right now is what the team will look like without Dembélé. He's an attacking midfielder turned central midfielder with the ability to move with the ball like an AM in congested areas while also holding up as a defensive presence. His dribbles don’t always directly lead to the final third, but they help the team eventually get there (and this has even been a slight down season by his standards).
| Unique Possessions Ending in Final Third Involved In (via a Dribble) |
% of Dribbles That Occur Centrally
|
|
| Giannelli Imbula | 1.78 | 87.2% |
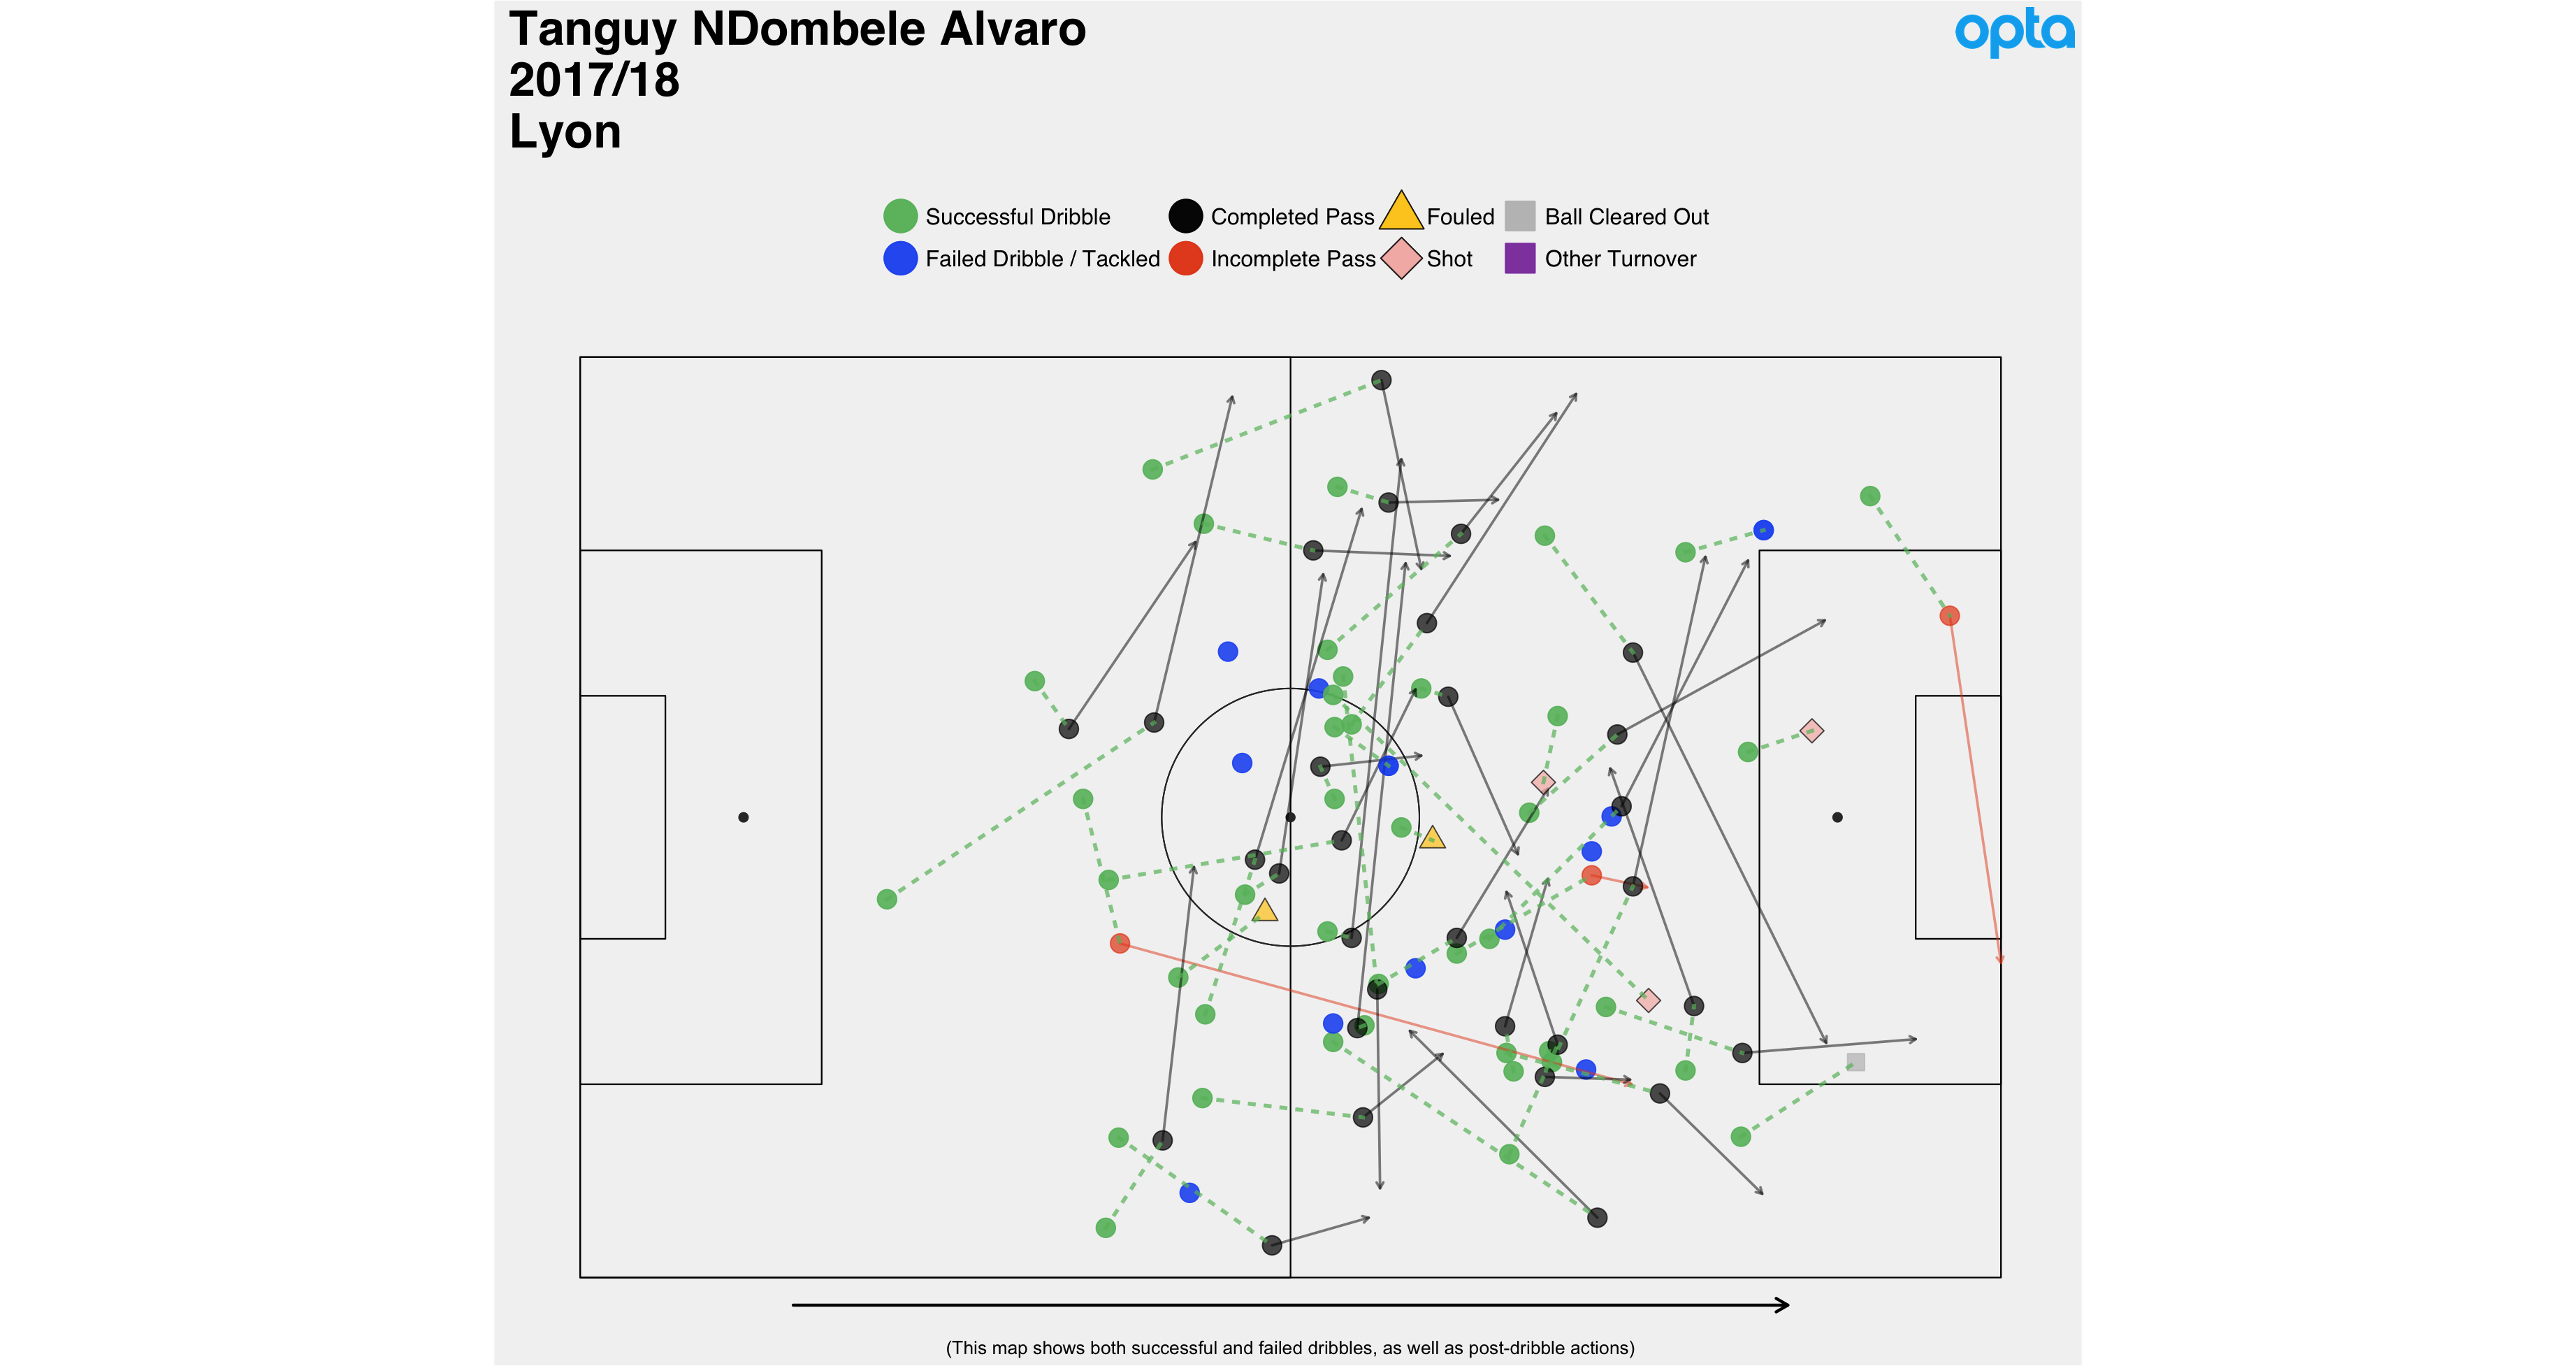
| Tanguy NDombele Alvaro | 2.32 | 77.6% |
| Mousa Dembélé | 2.34 | 76.1% |
| Naby Keita | 2.36 | 74.4% |
| Mario Lemina | 2.41 | 72.7% |
| Jonathan Viera | 2.41 | 66.3% |
| Nabil Fekir | 2.14 | 58.0% |
| Houssem Aouar | 1.82 | 56.3% |
| Manuel Lanzini | 2.35 | 55.6% |
| Éver Banega | 2.19 | 55.4% |
| Radja Nainggolan | 1.61 | 54.5% |
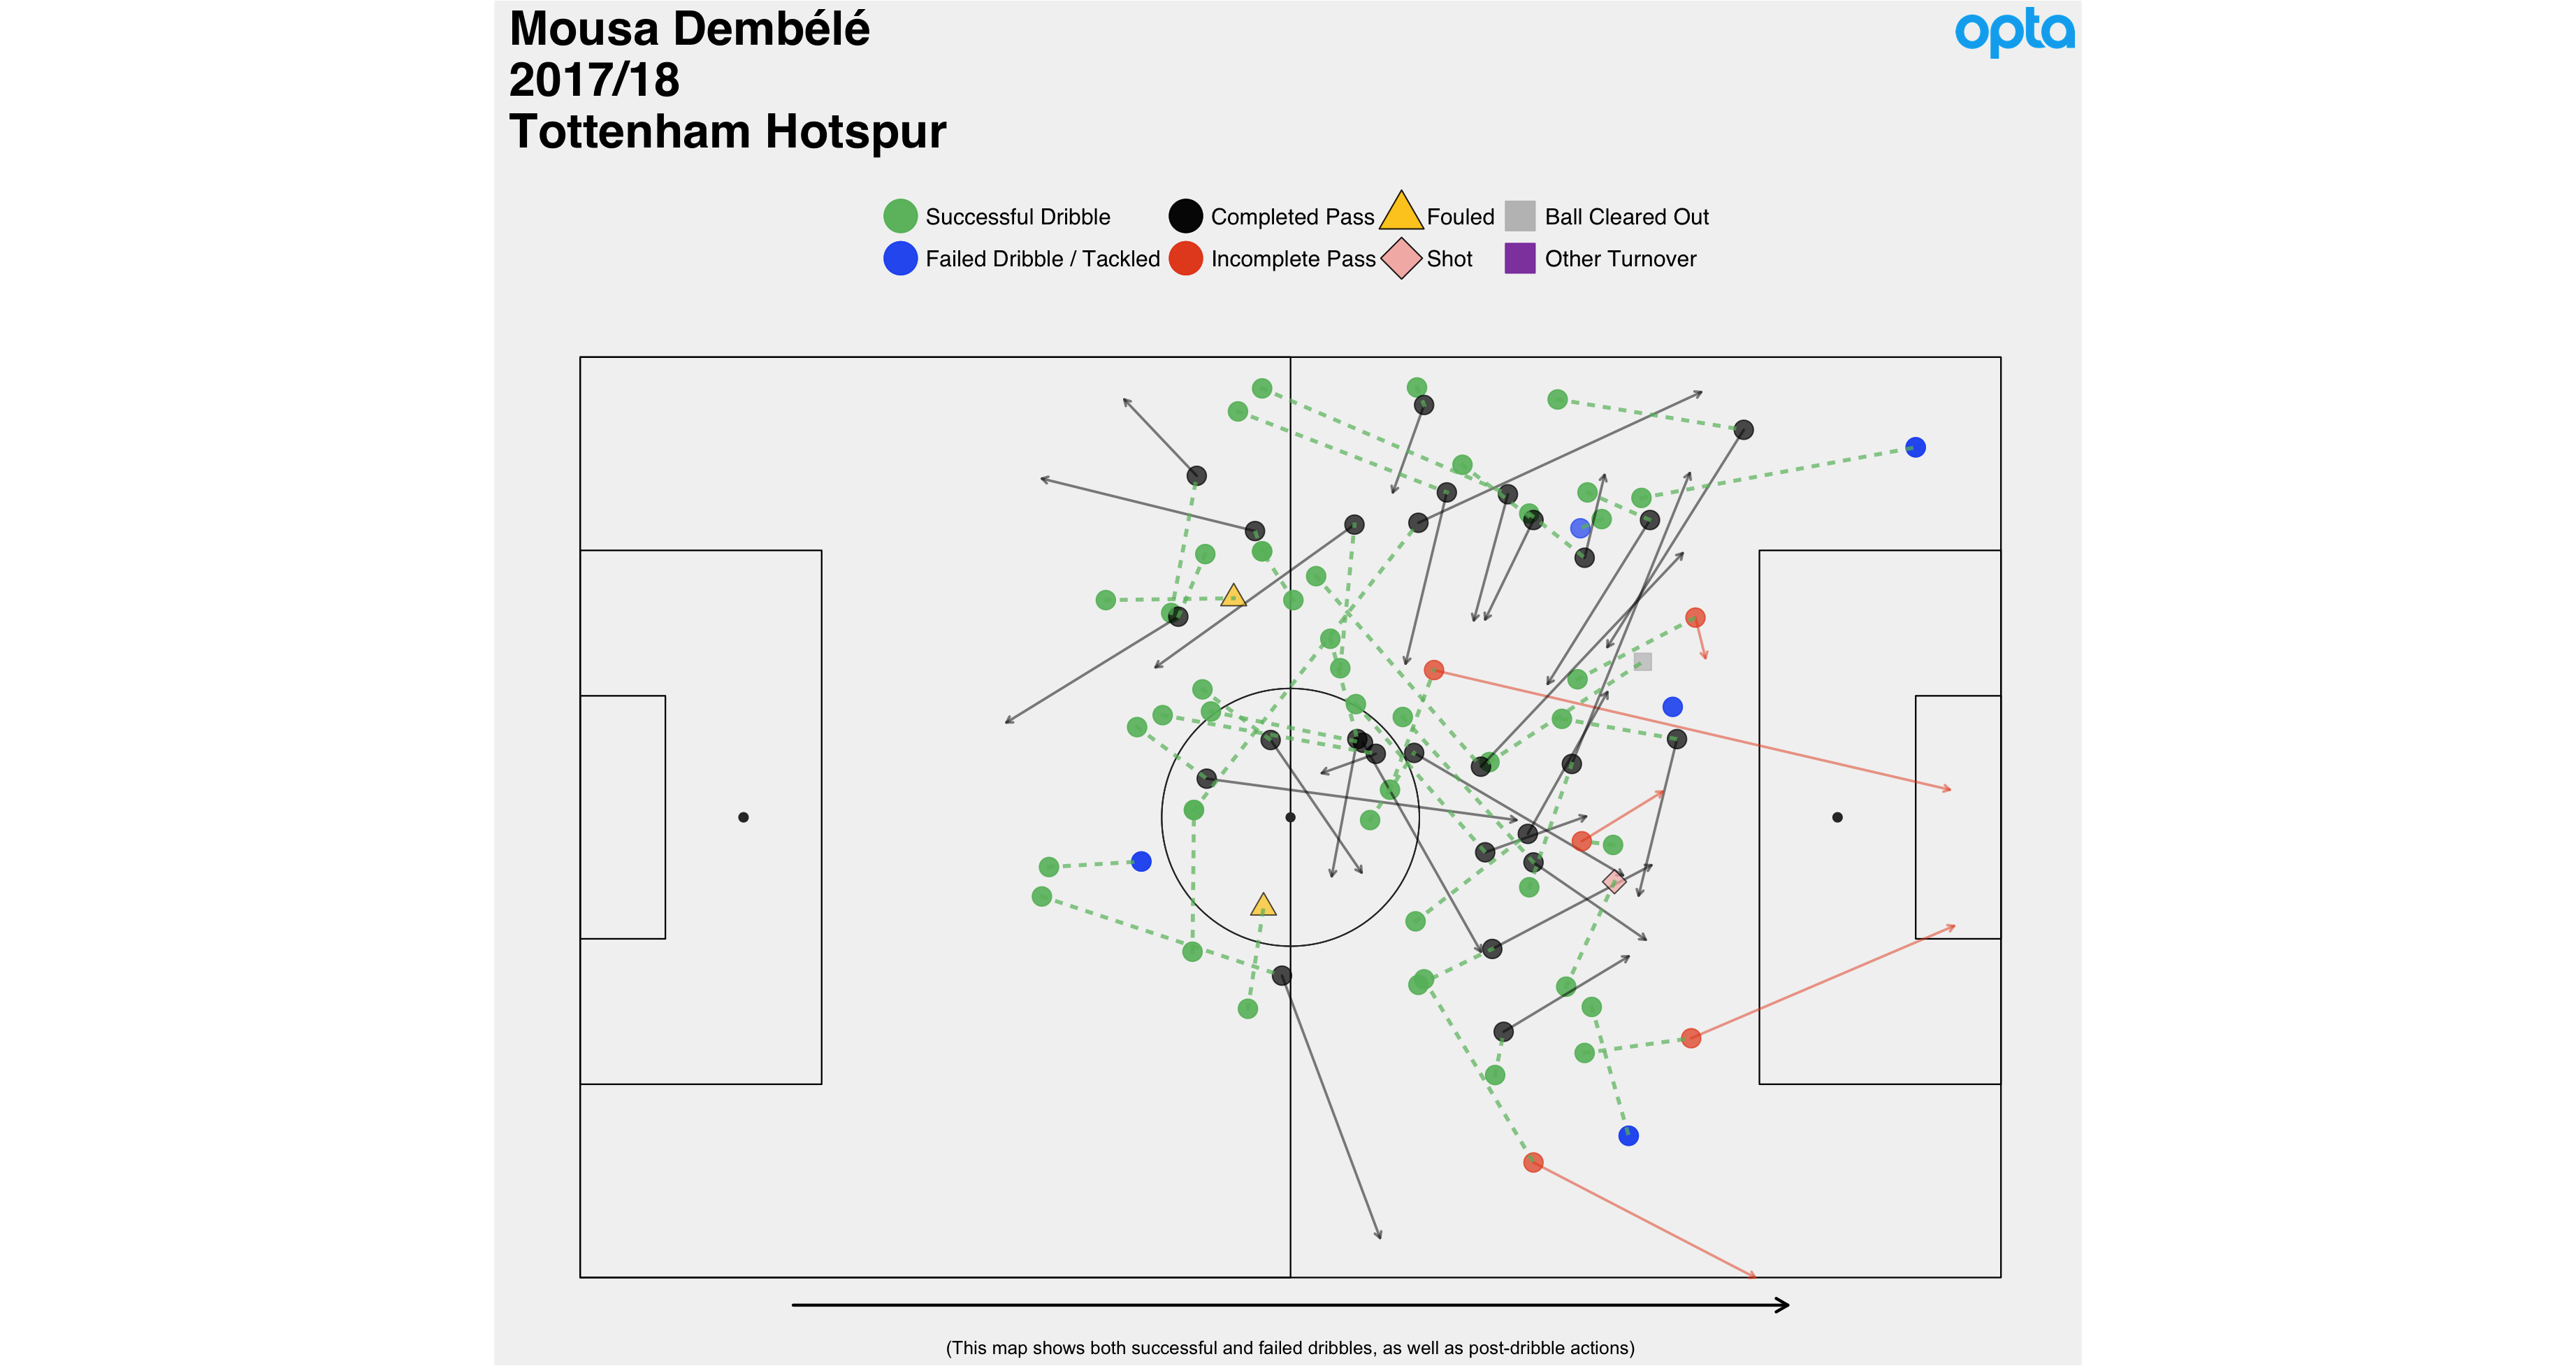
It's a difficult skill set to replace. Do you try to re-train a younger AM like Dembélé himself was? 20-year-old Amine Harit (who just misses out on this list) at Schalke could fit the bill, with similar dribbling tendencies. Or do you go for someone who is doing a similar job at CM elsewhere? Southampton's Mario Lemina is one of those, and a growing favourite candidate amongst supporters. Outside of the PL there's Tanguy Ndombele who is doing a stellar job in a messily structured Lyon team. He had 10(!) dribbles against Rennes at the weekend.
The list of prospective replacements could go on but the point is that, while there’s players who rack up more eye-popping dribbling numbers than Dembélé, the type of dribble he’s executing combined with his efficacy is maddeningly rare.
Of course none of this is to knock the dribbles stat entirely, or to say it’s without use. Statsbomb’s own radars use them in what seems like the ideal way: present it alongside the rest of a player’s numbers so as to give an at-a-glance impression of their general ability and style. If two players have high Key Pass numbers but one completes a lot of dribbles and the other doesn’t, that tells you a fair amount right there.
__________________
That's all for right now though. Maybe we'll expand on this and have more fun with it in the future. Thank you for reading. You can find me on Twitter @EuanDewar.
La Liga At the Break: Valencia, Girona and Atlético
In just a scant few days the La Liga teams will return from their truncated winter rest. Before we dive head first into the home straight of the season, let's take a look back at what the first chunk of games has taught us, shall we? This isn't technically the halfway-point as Spain's domestic break comes after 17 games rather than 19. Don't worry though, we're not about to let that get in the way of a good ol' rummage through the numbers!
Valencia
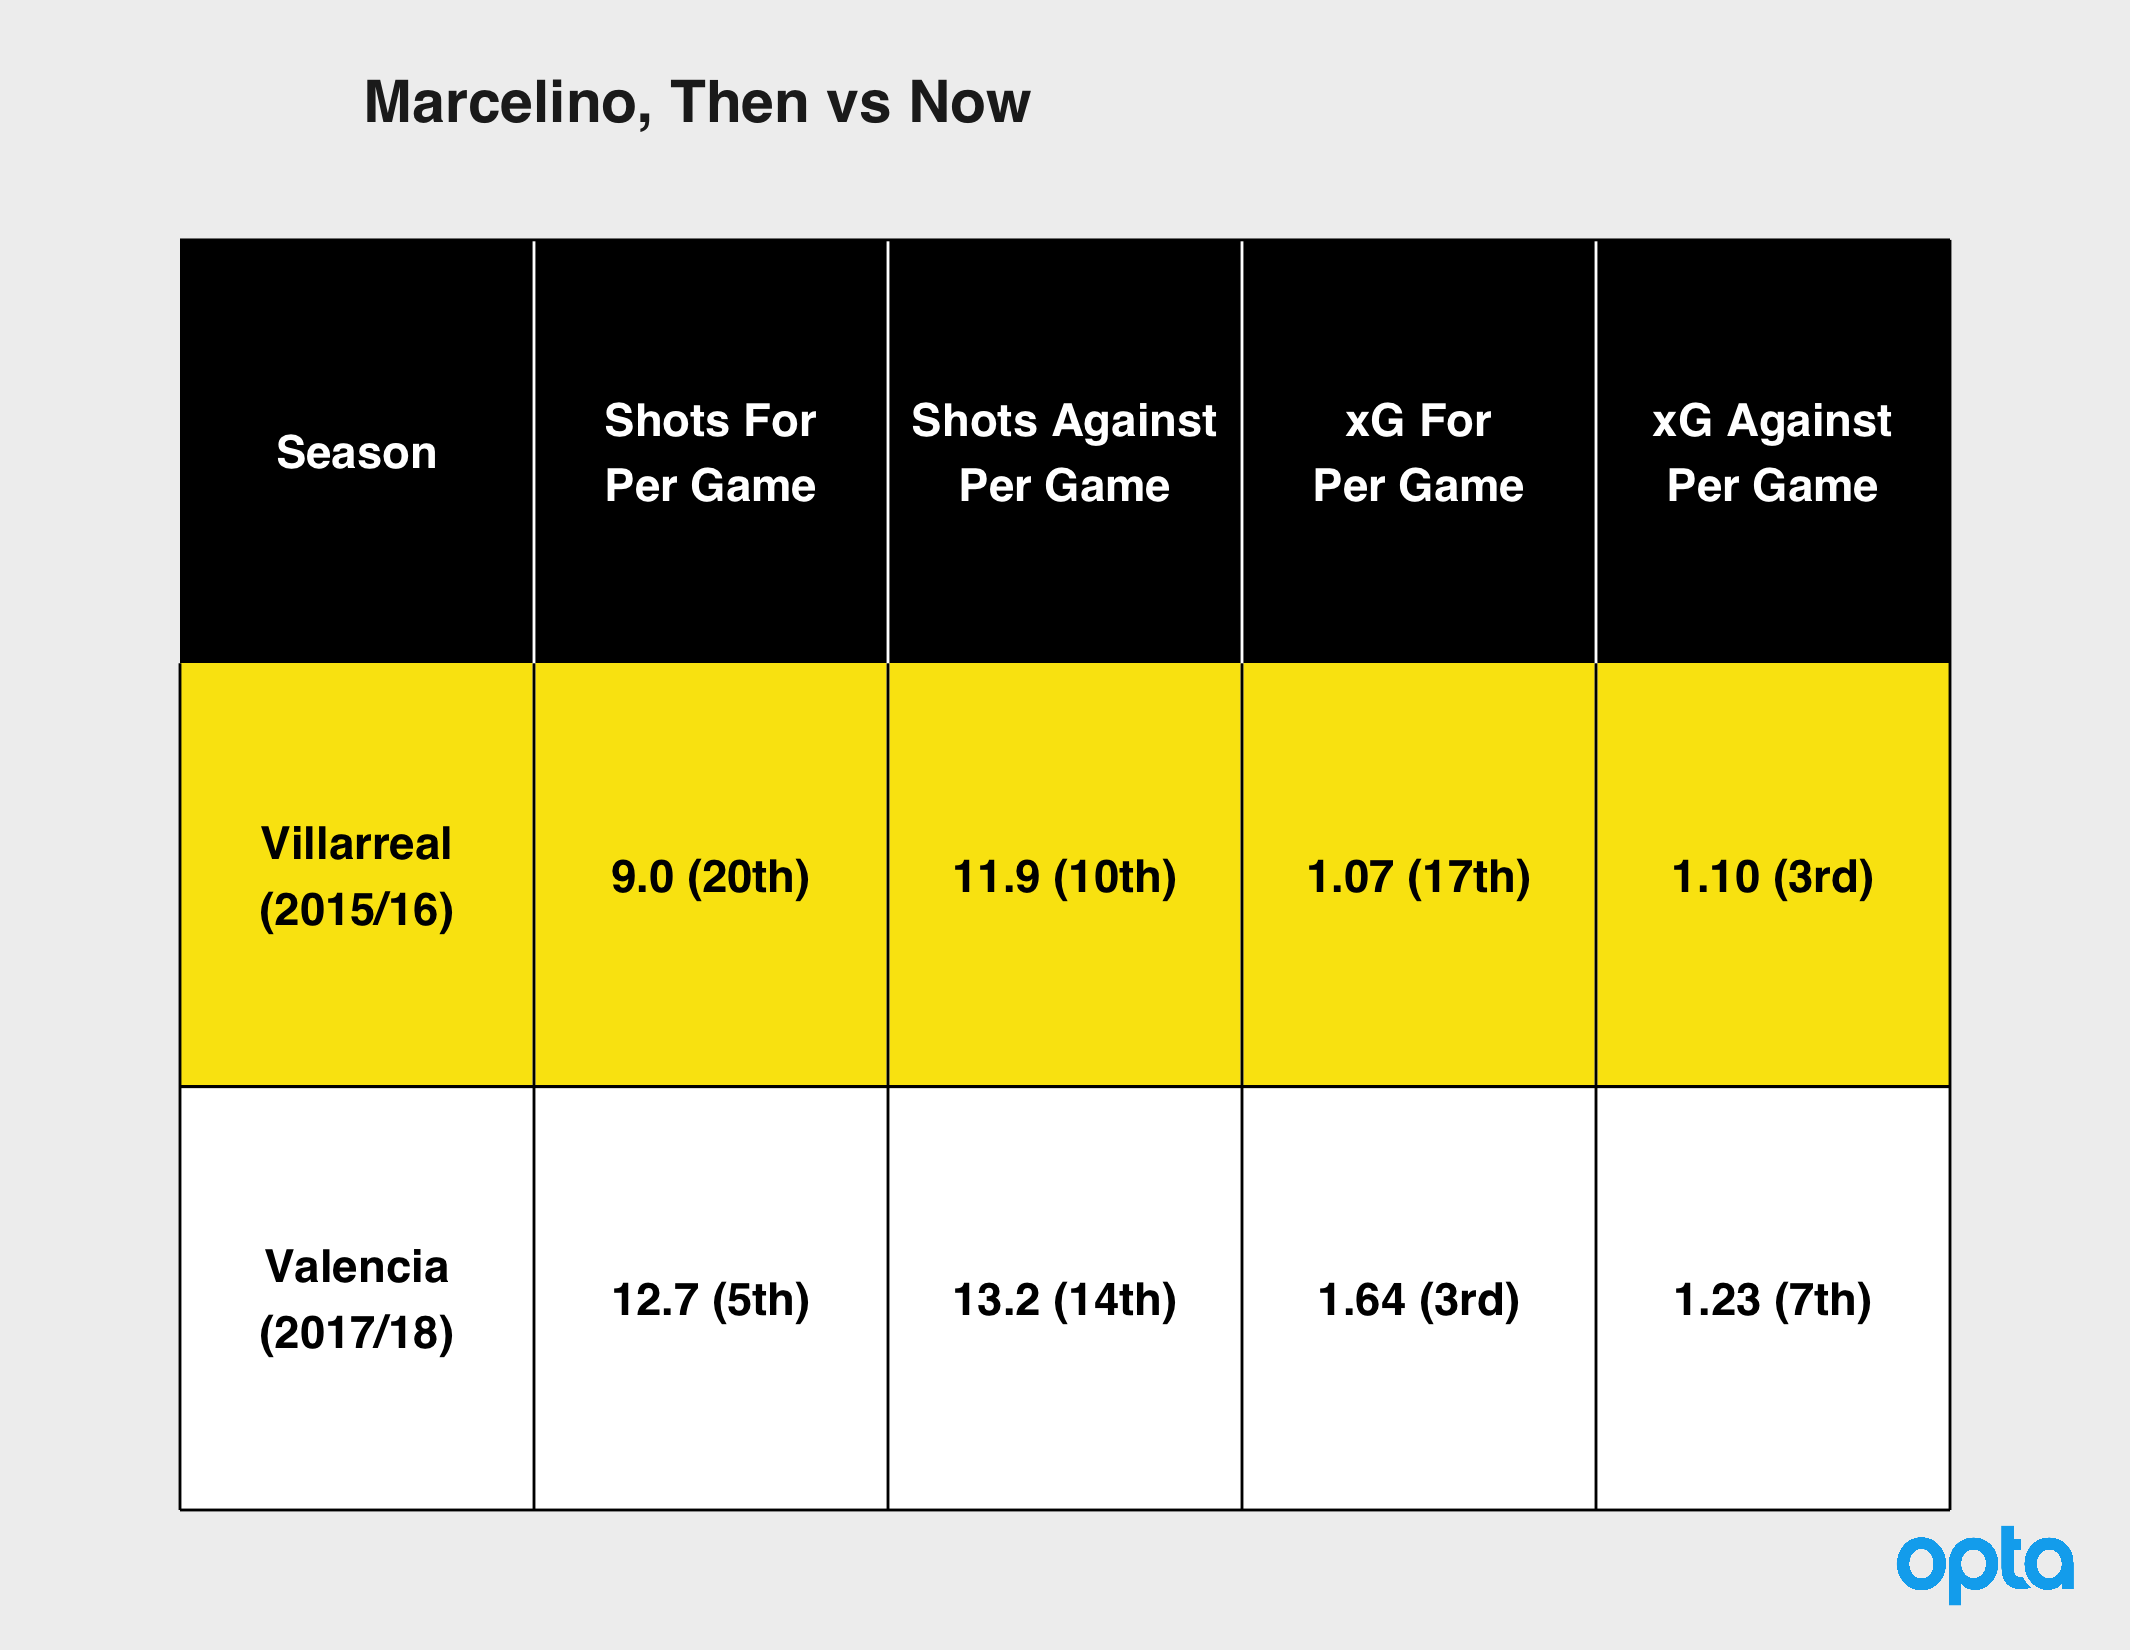
From 2013 to 2016 Villarreal had a pretty successful run of seasons under then manager Marcelino, culminating in achieving Champions League qualification and reaching the Europa League semifinals in 2015/16. That summer - before they had even played their CL qualification match - vague tensions between Marcelino and the club’s higher-ups lead to him getting the sack out of nowhere. He took a sabbatical for the 2016/17 season and now is back in La Liga, taking charge of Valencia. At this stage they sit 3rd in the table with the 2nd best goal difference. After chewing through five managers in two seasons, Los Che appear to have found their man.
Marcelino’s Villarreal built their success on a rock-solid defensive 4-4-2 shape, somewhat like a more reserved version of Diego Simeone’s Atlético Madrid. In his final season they ranked 3rd in terms of expected goals against and a pretty uninspiring 17th in terms of attacking xG. At Valencia things appear the same on the surface - the 4-4-2 is in use again - but the attack/defence split has been shaken up somewhat unexpectedly.
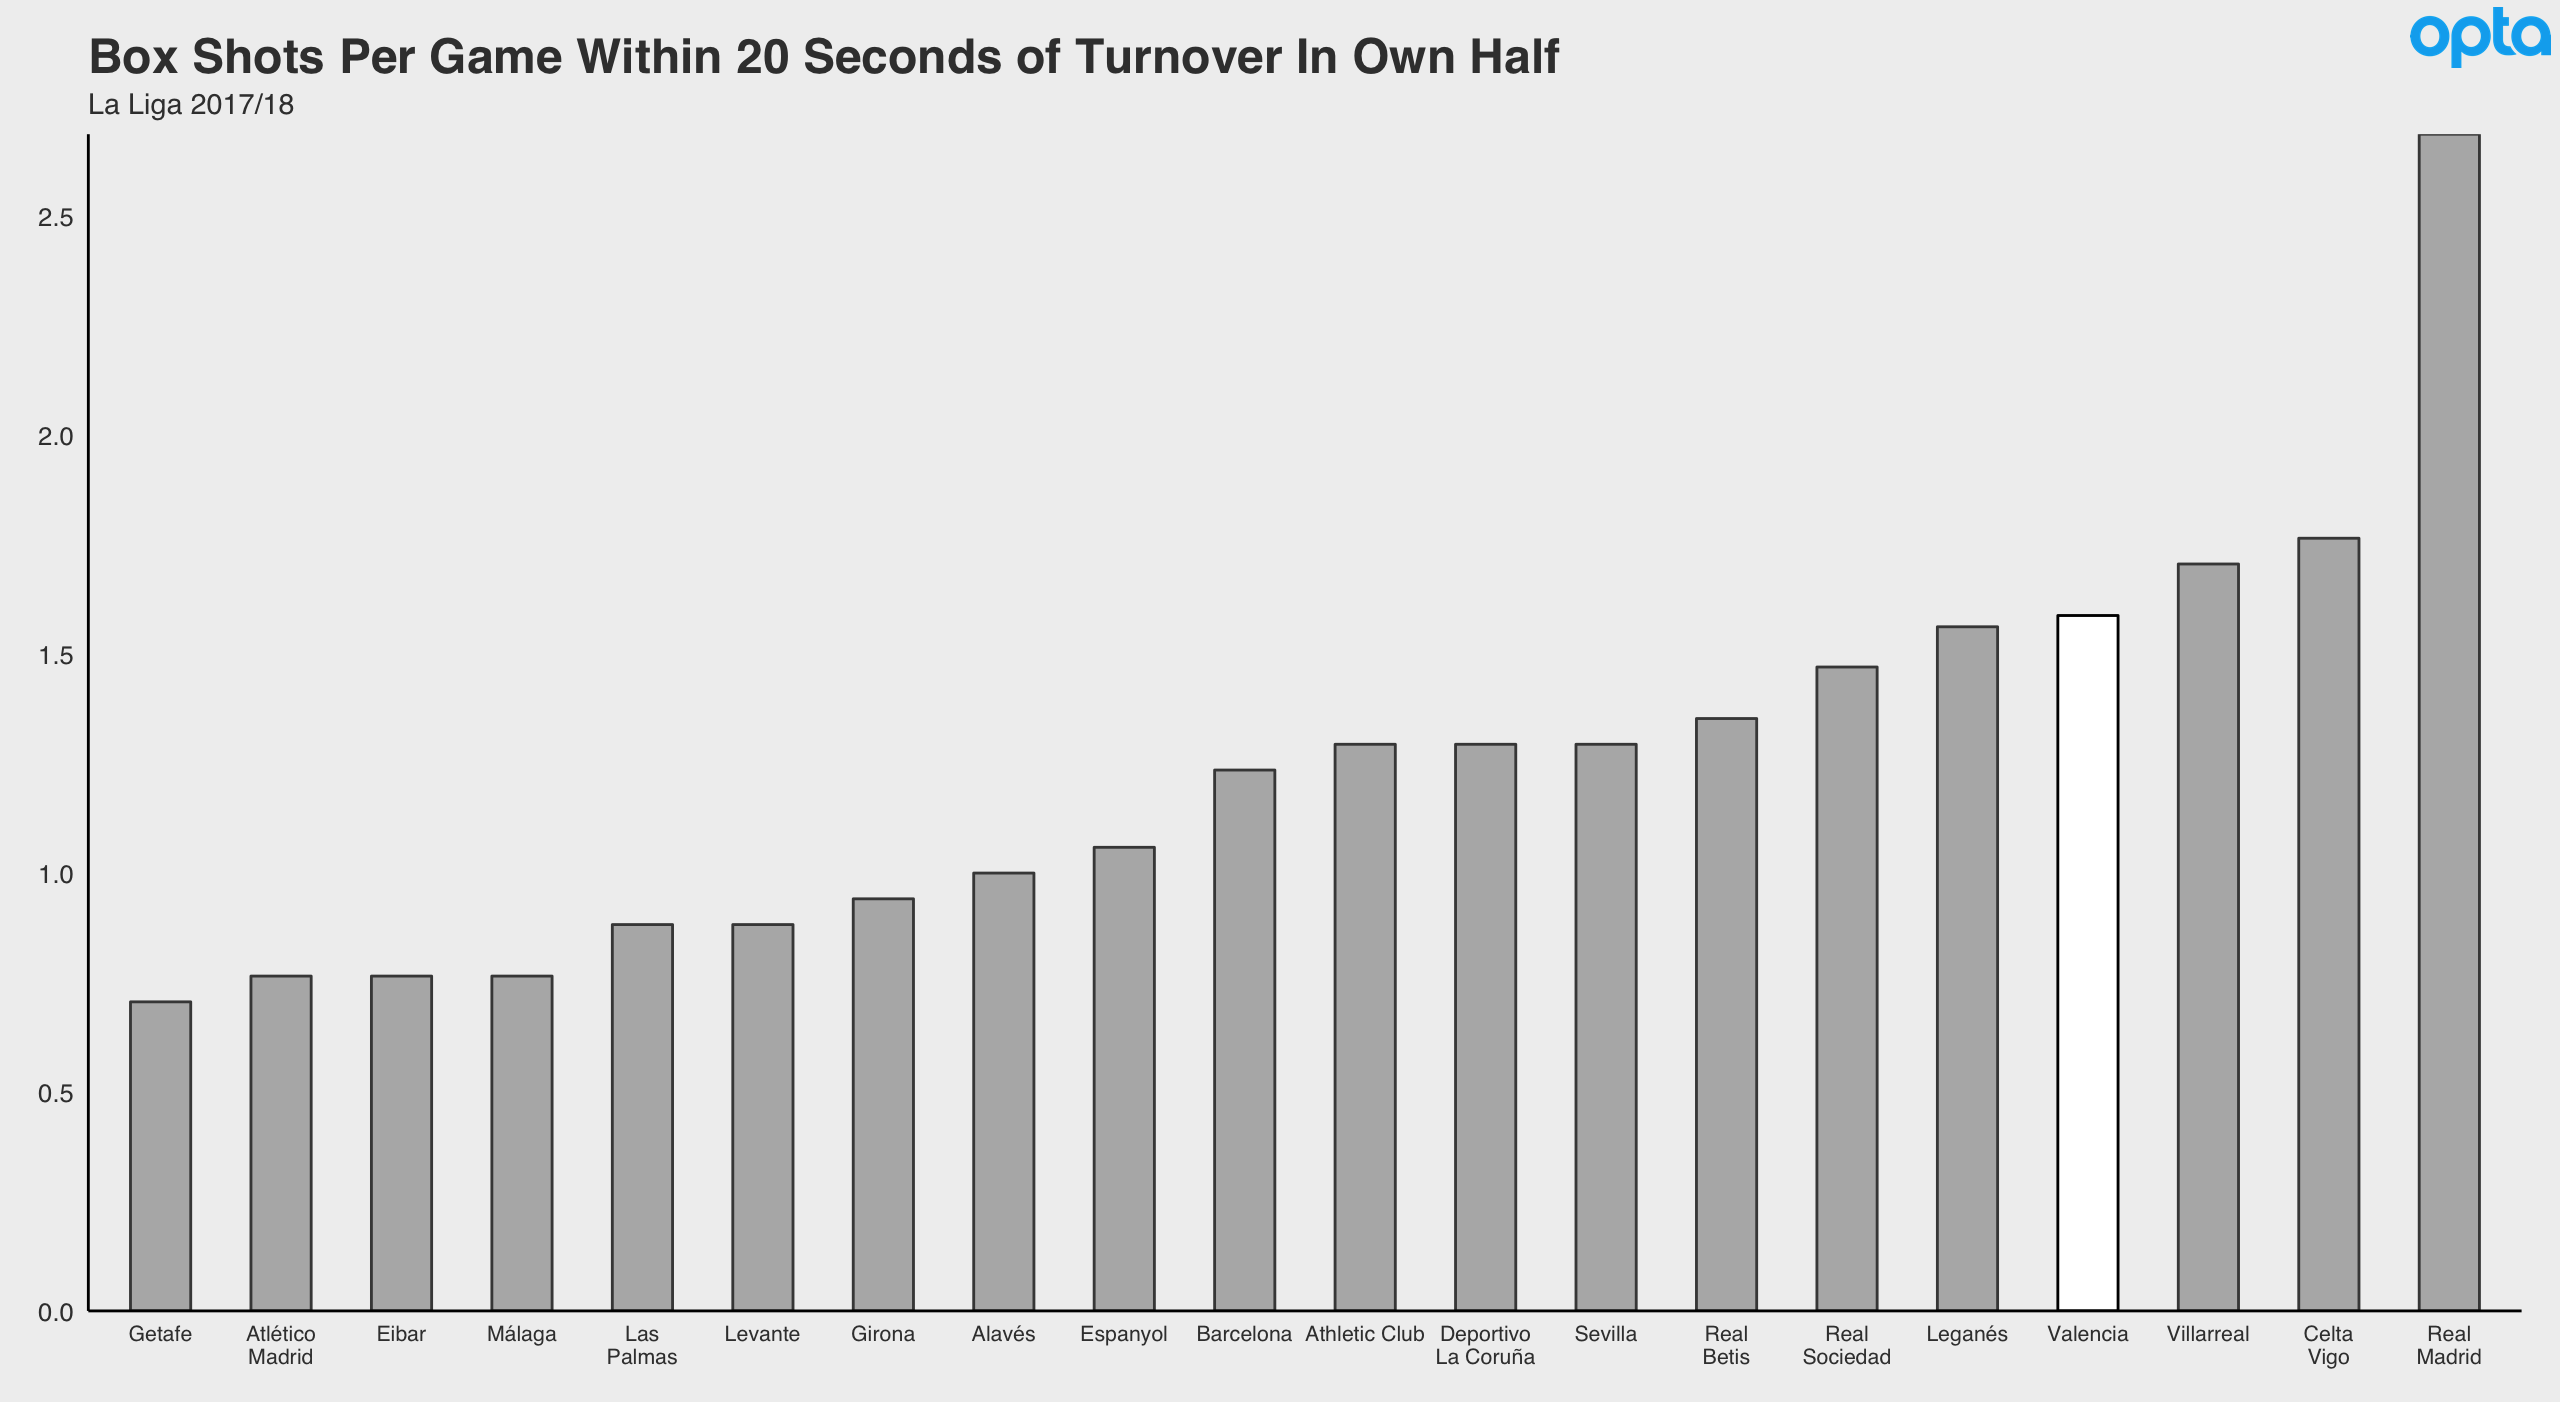
Functionally the attack is, again, closer to an Atléti than a Barca. Meaning that getting the ball forward with pace is the order of the day. They're just about middle of the pack in terms of possessions that are 10 or more passes in length. Conversely, they have the fourth highest percentage of their possessions leading to shots that are 15 seconds or shorter. This continues a trend from Mareclino's last season at Villarreal where they lead the league in this measure. However, in Valencia, the efficacy is greatly improved with them getting far more shots overall from these situations.
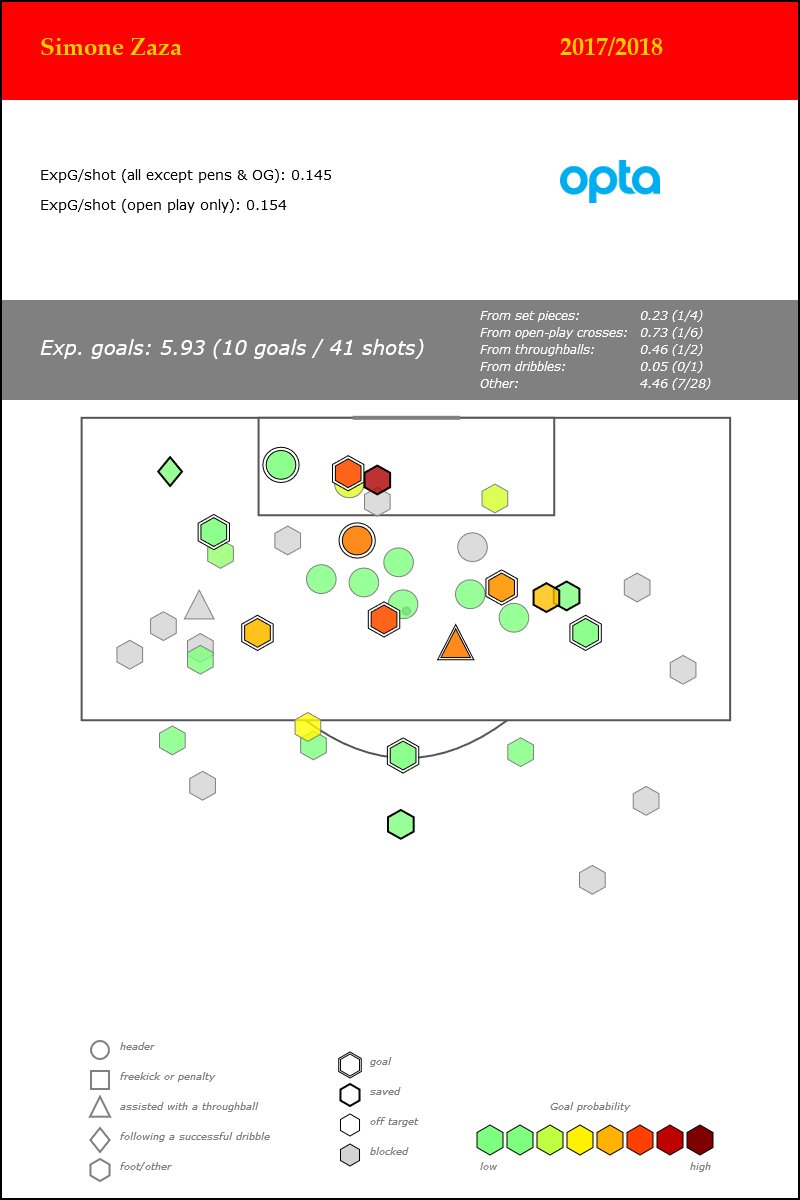
While the attack is clearly humming, a word of caution: it's perhaps running a tad too hot. They're over-shooting their expected goals numbers right now and come season's end may fall back behind Real Madrid to about 3rd or 4th in terms of goals scored (unless this bizarre Real Madrid finishing slump just continues in perpetuity). Simone Zaza - who has genuinely been quite good this season after a couple of odd detours in his career - is the one to point to here. Regardless, things are encouraging.
Defensively there a couple of slight causes for concern. The relatively high amount of shots they're giving up isn't necessarily a problem as long as the quality of said shots is as low as it has been (45% of their shots conceded are from outside the box, the 2nd highest percentage in the league). However, it is a bit easier to move the ball against them than Marcelino would probably ideally like. Opposition possessions are reaching Valencia's defensive third at the 5th highest rate in the league. On top of that they're not doing especially well at keeping opponents out of the most dangerous areas. The xG says don't stress it but it's worth keeping an eye on.
Marcelino's boys likely aren't, as the early results have suggested, on a level with Barca and Real Madrid. However, the signs do point towards them being the league's third best, even beyond an Atléti (more on them later). That is plenty impressive on its own.
Girona
Gironaaaaaaaaaaaaaa!...
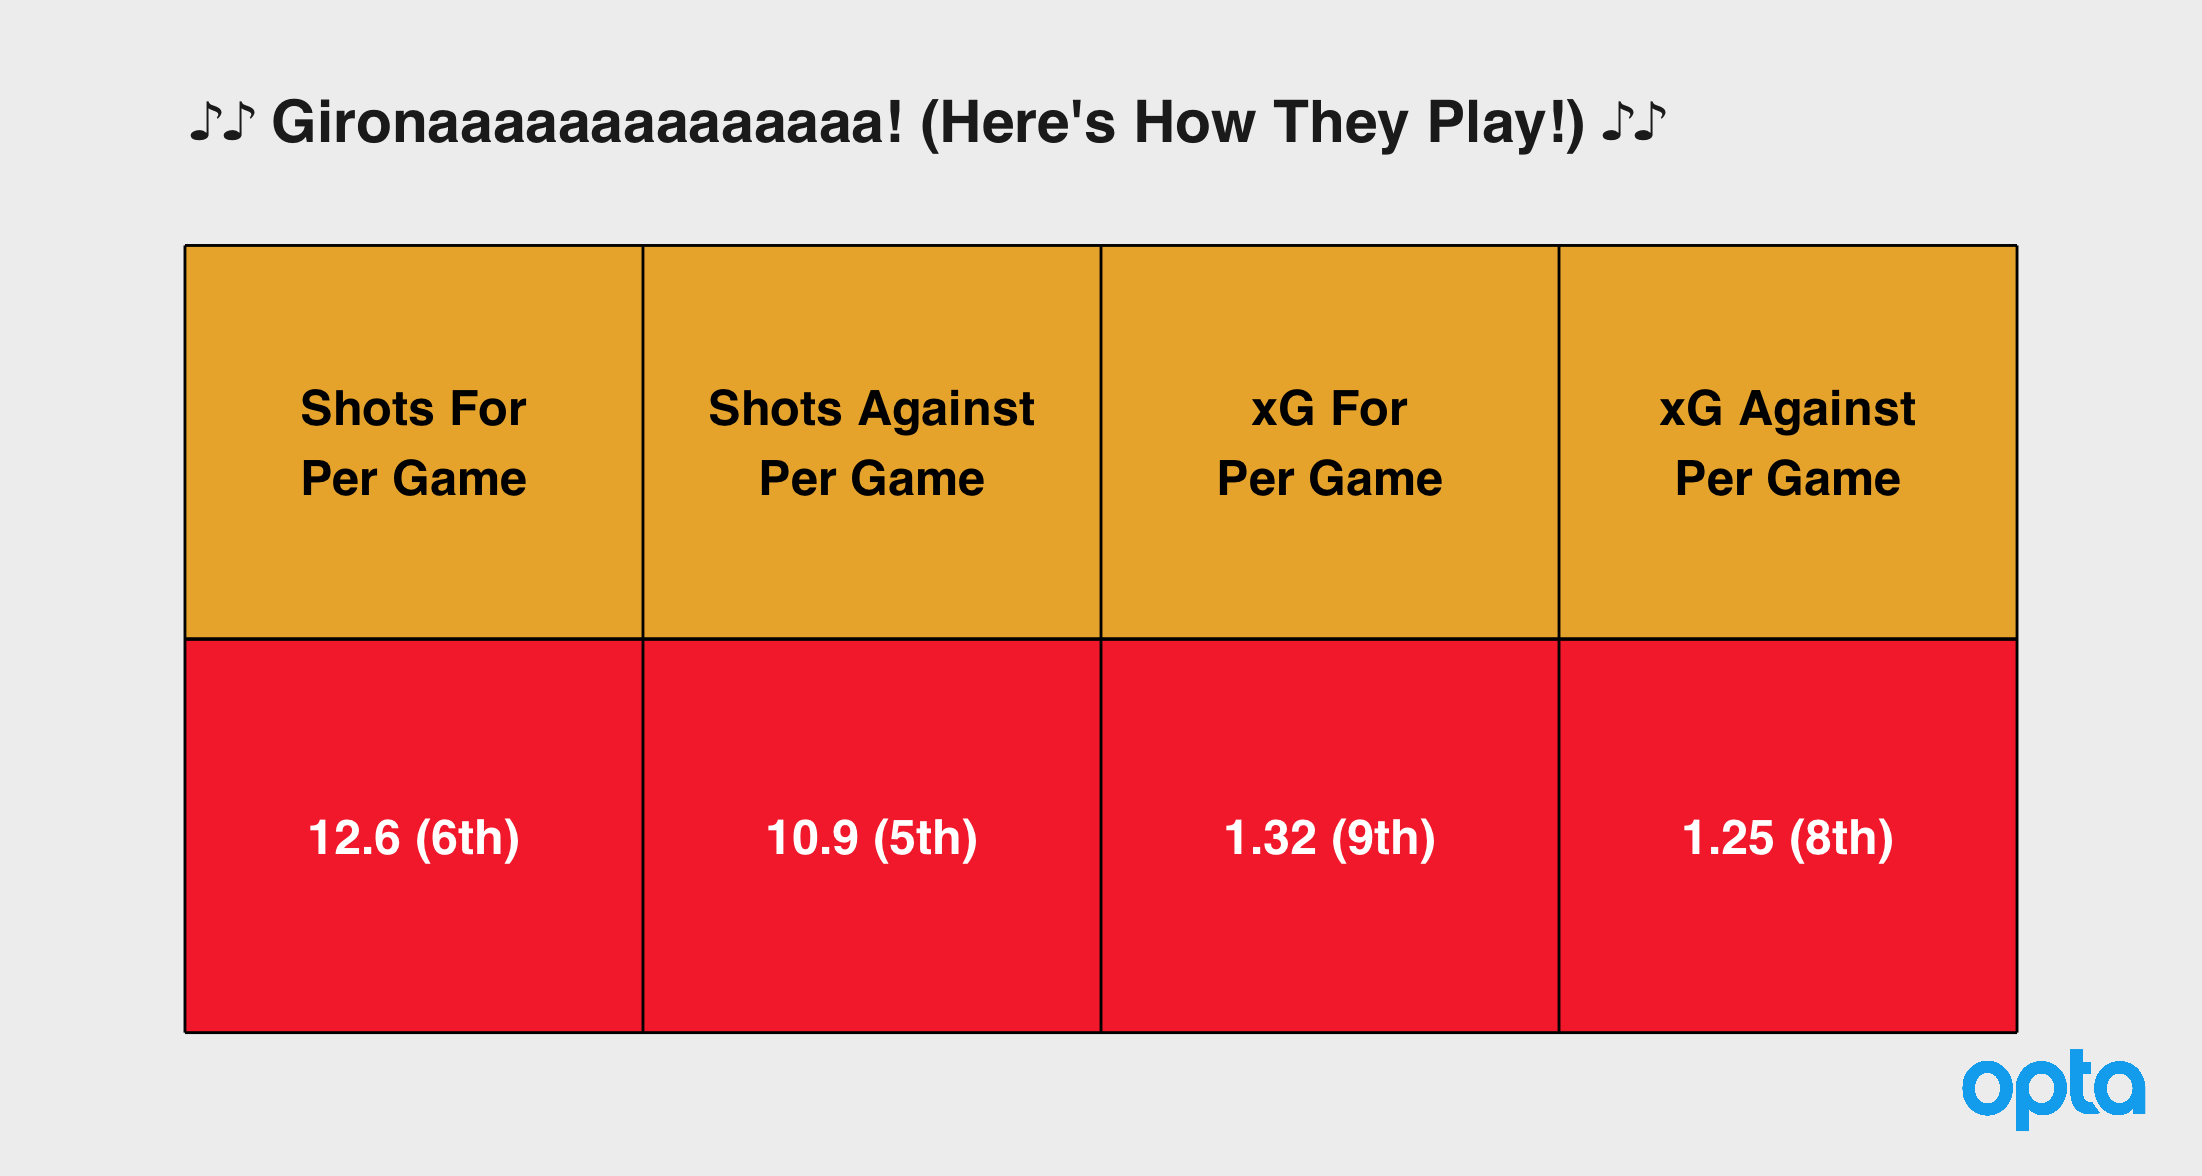
...are the surprise package in La Liga this season. Prior to this campaign most probably knew them as the destination for a lot of Manchester City's loan army (about a third of Girona's squad are loanees, five of which are from City). That doesn't define them though, they're a hoot in their own right. The newly promoted club sit 9th in the table at this point of the season, and look just as good - if not a bit better - in the underlying indicators.
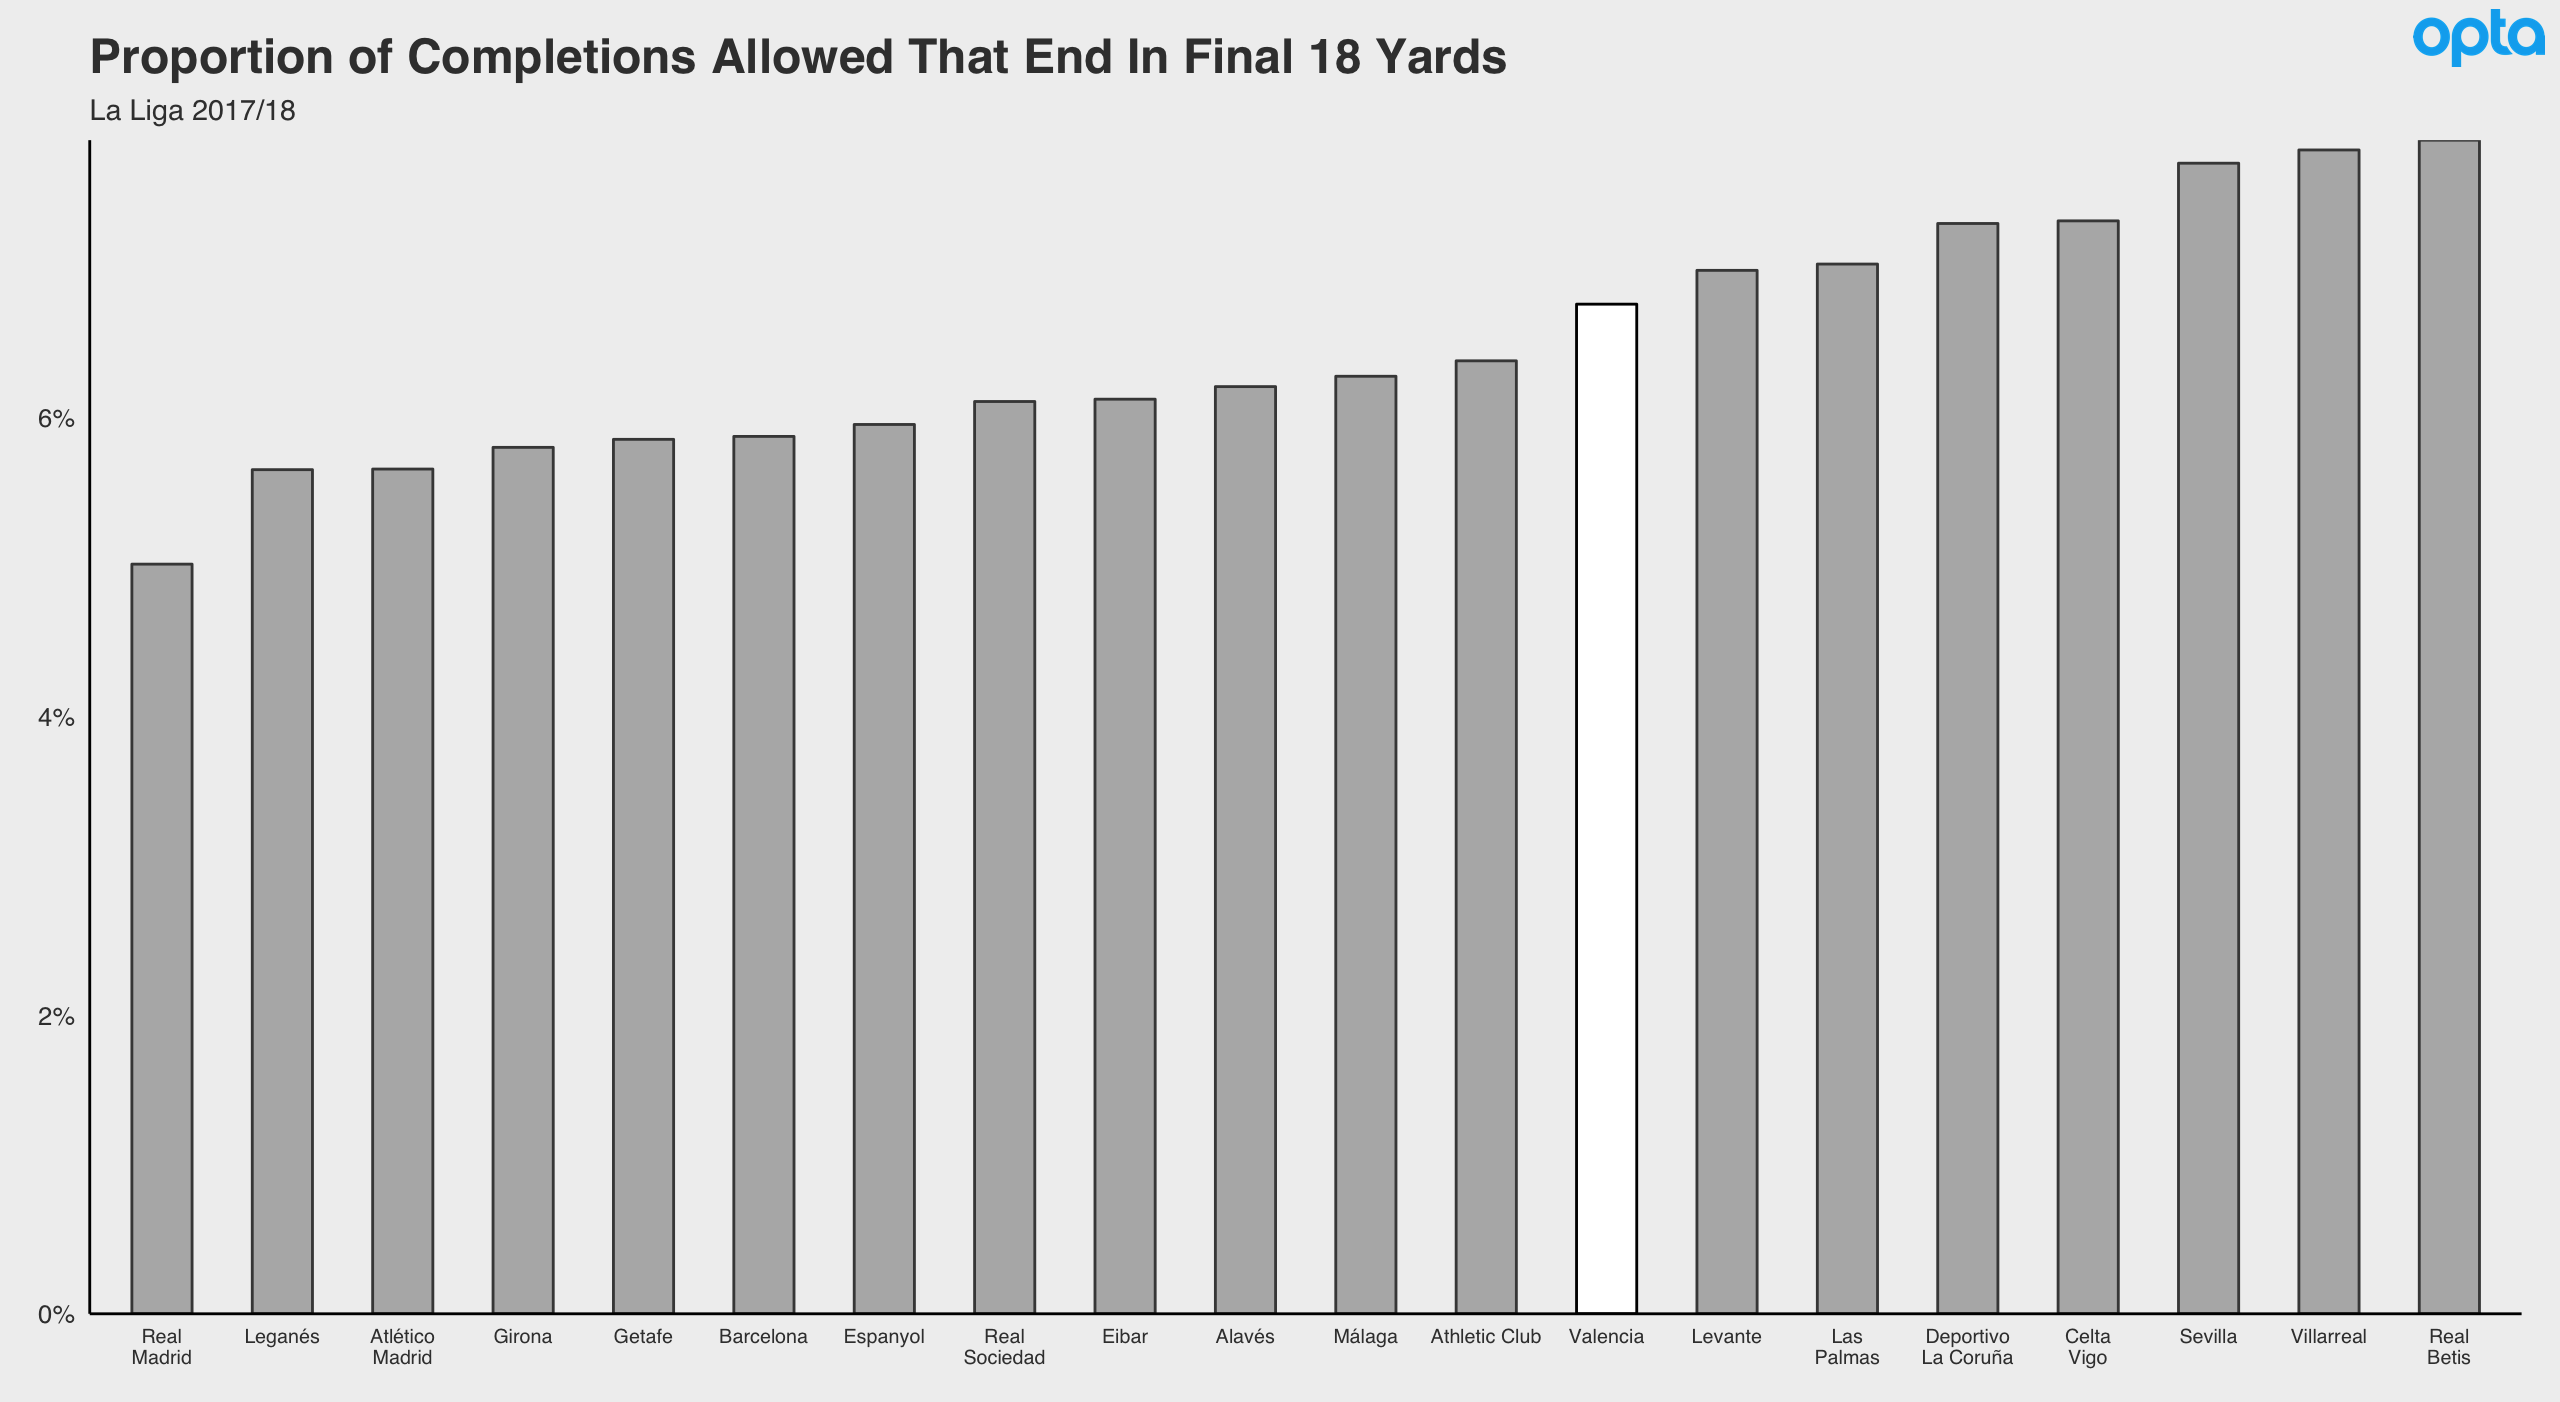
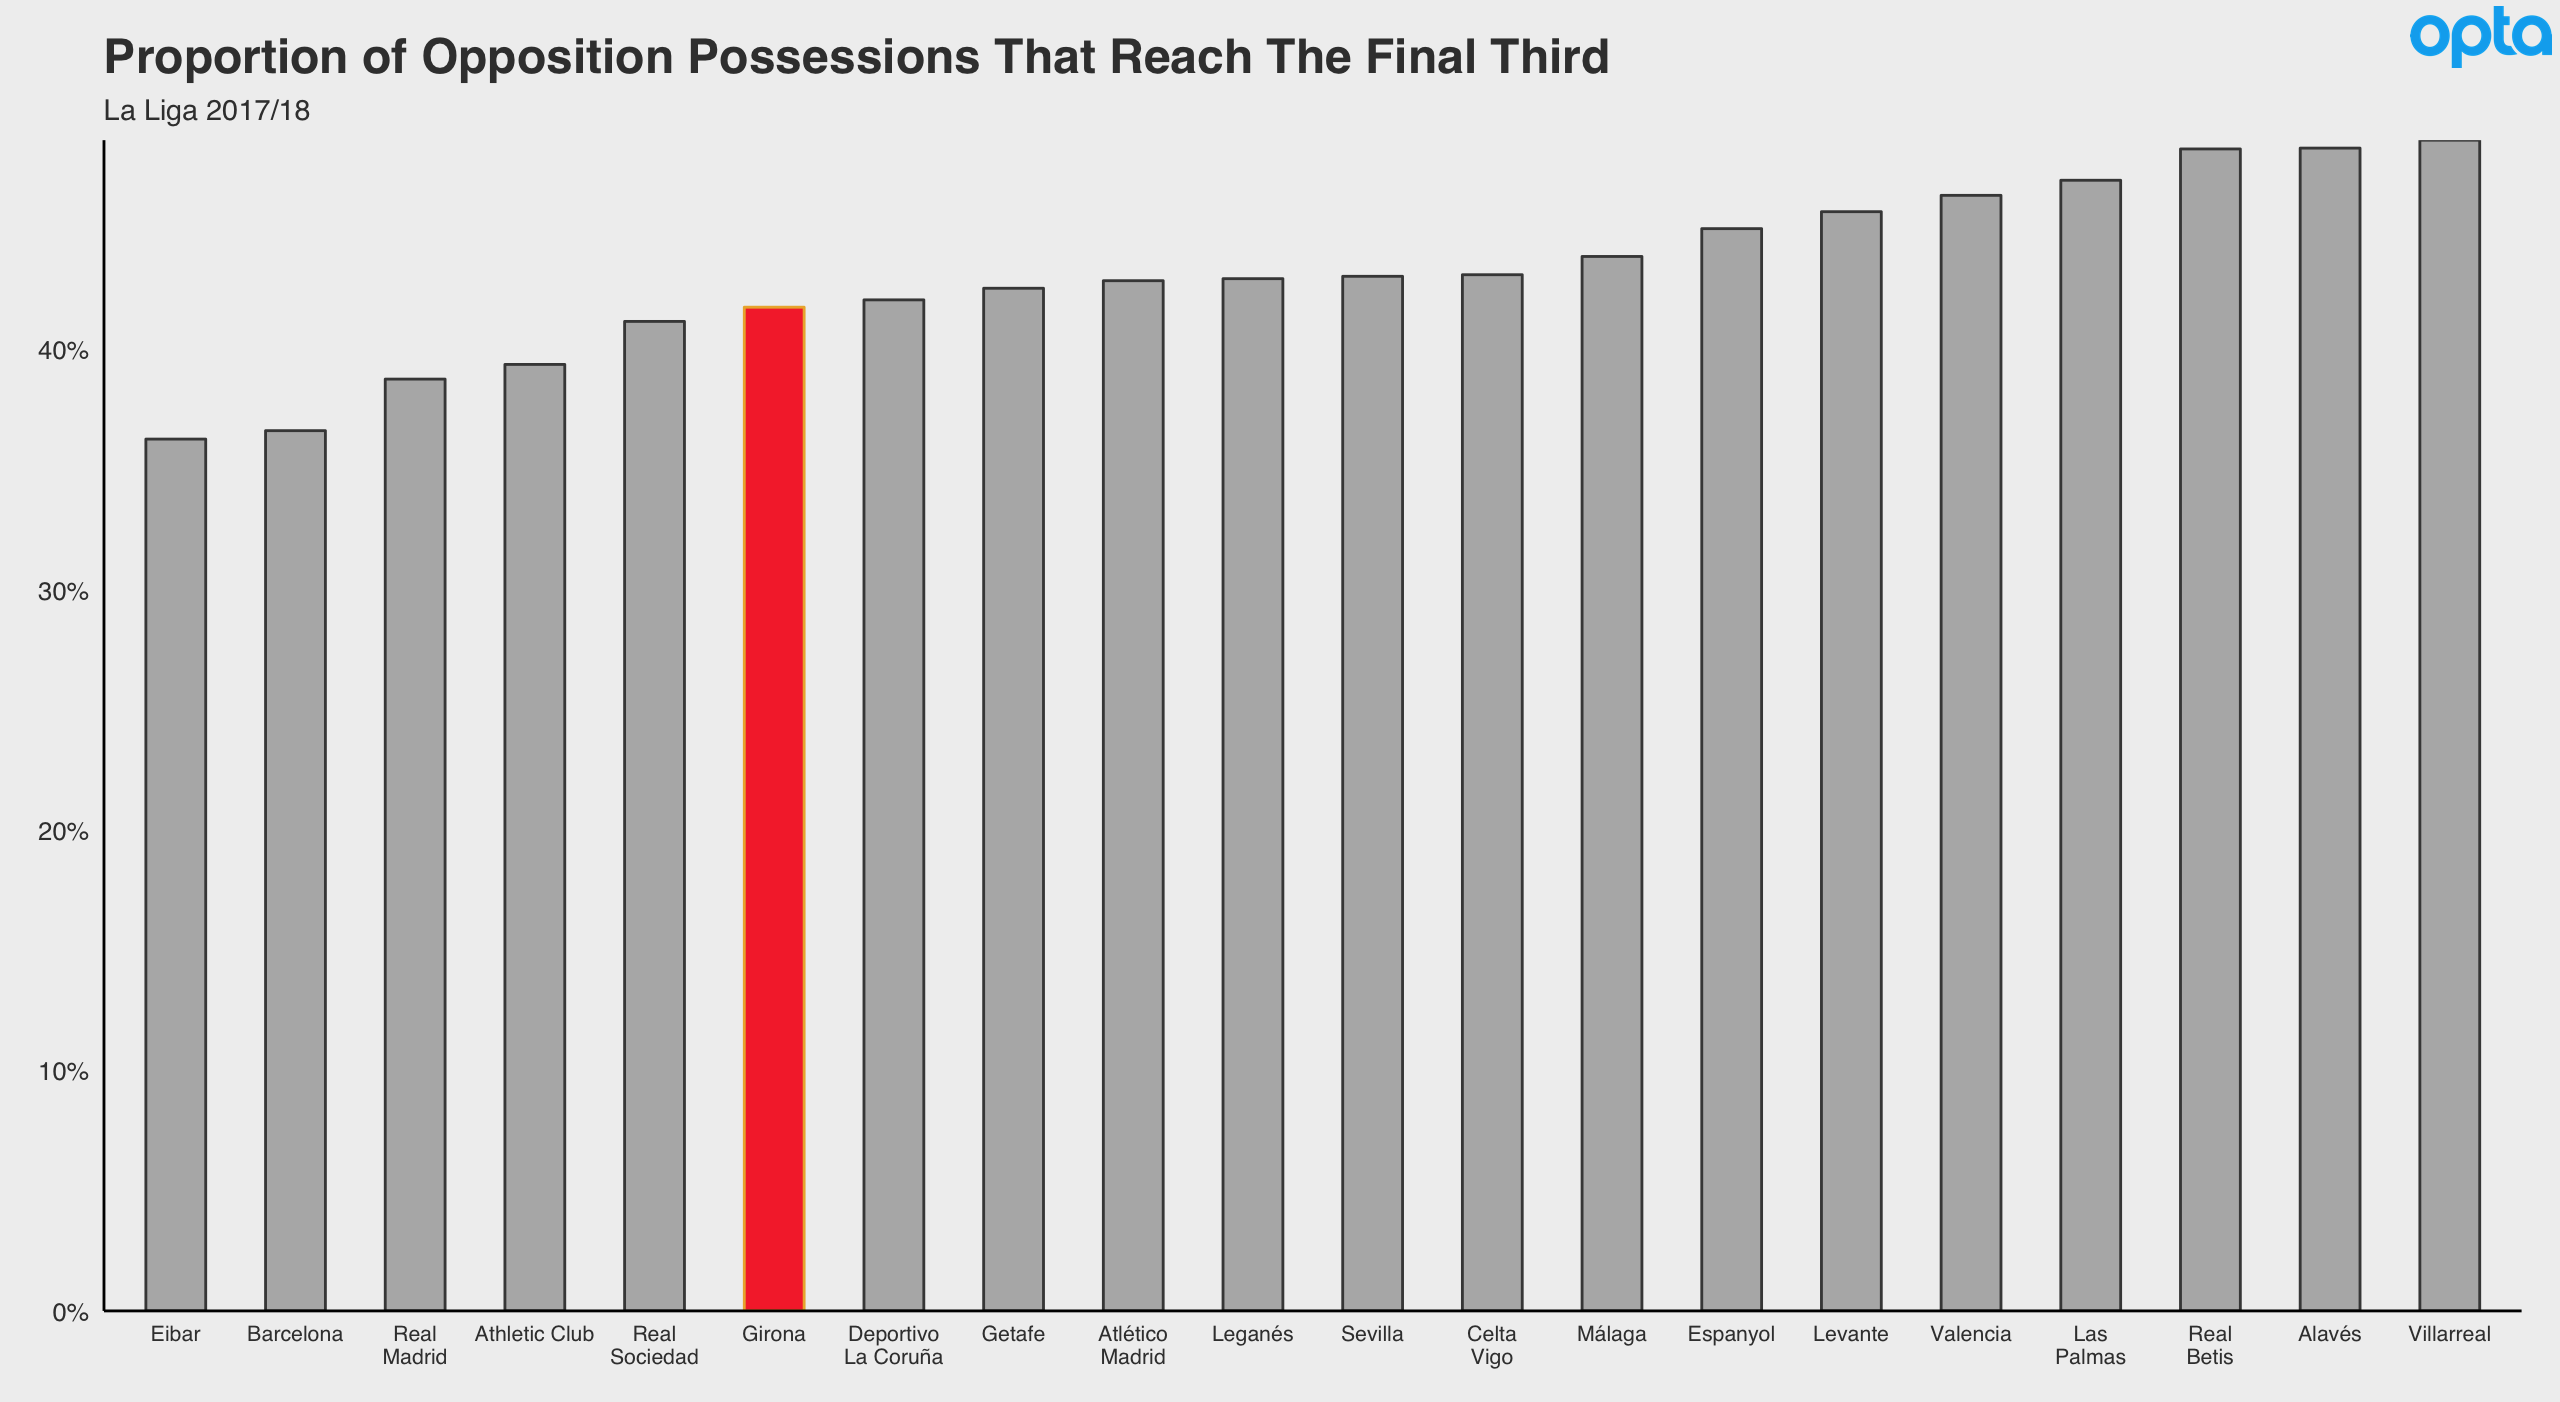
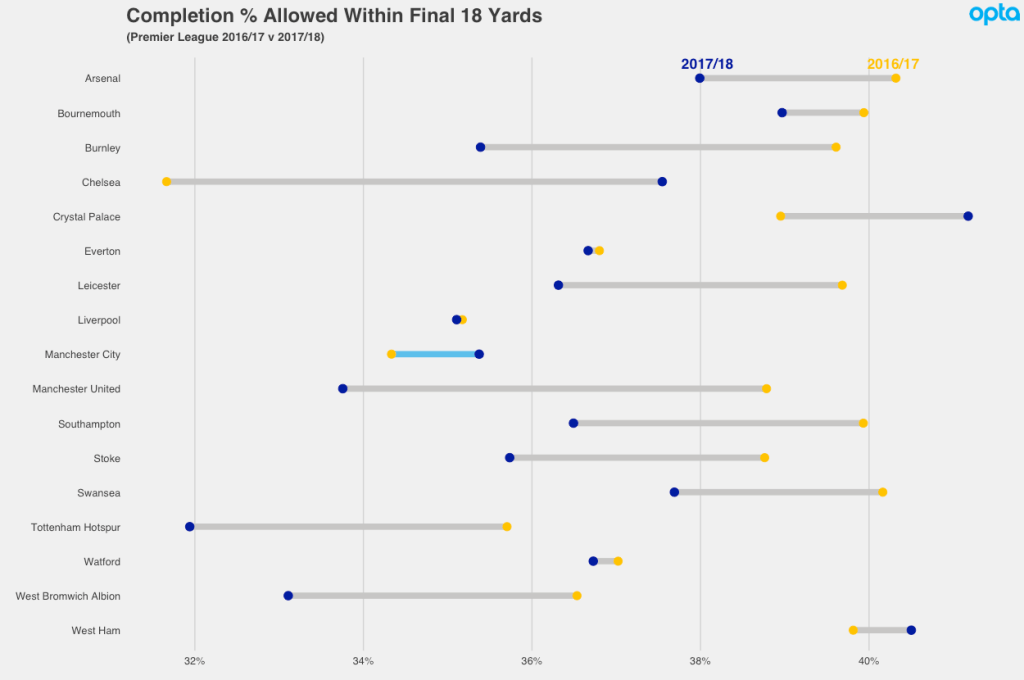
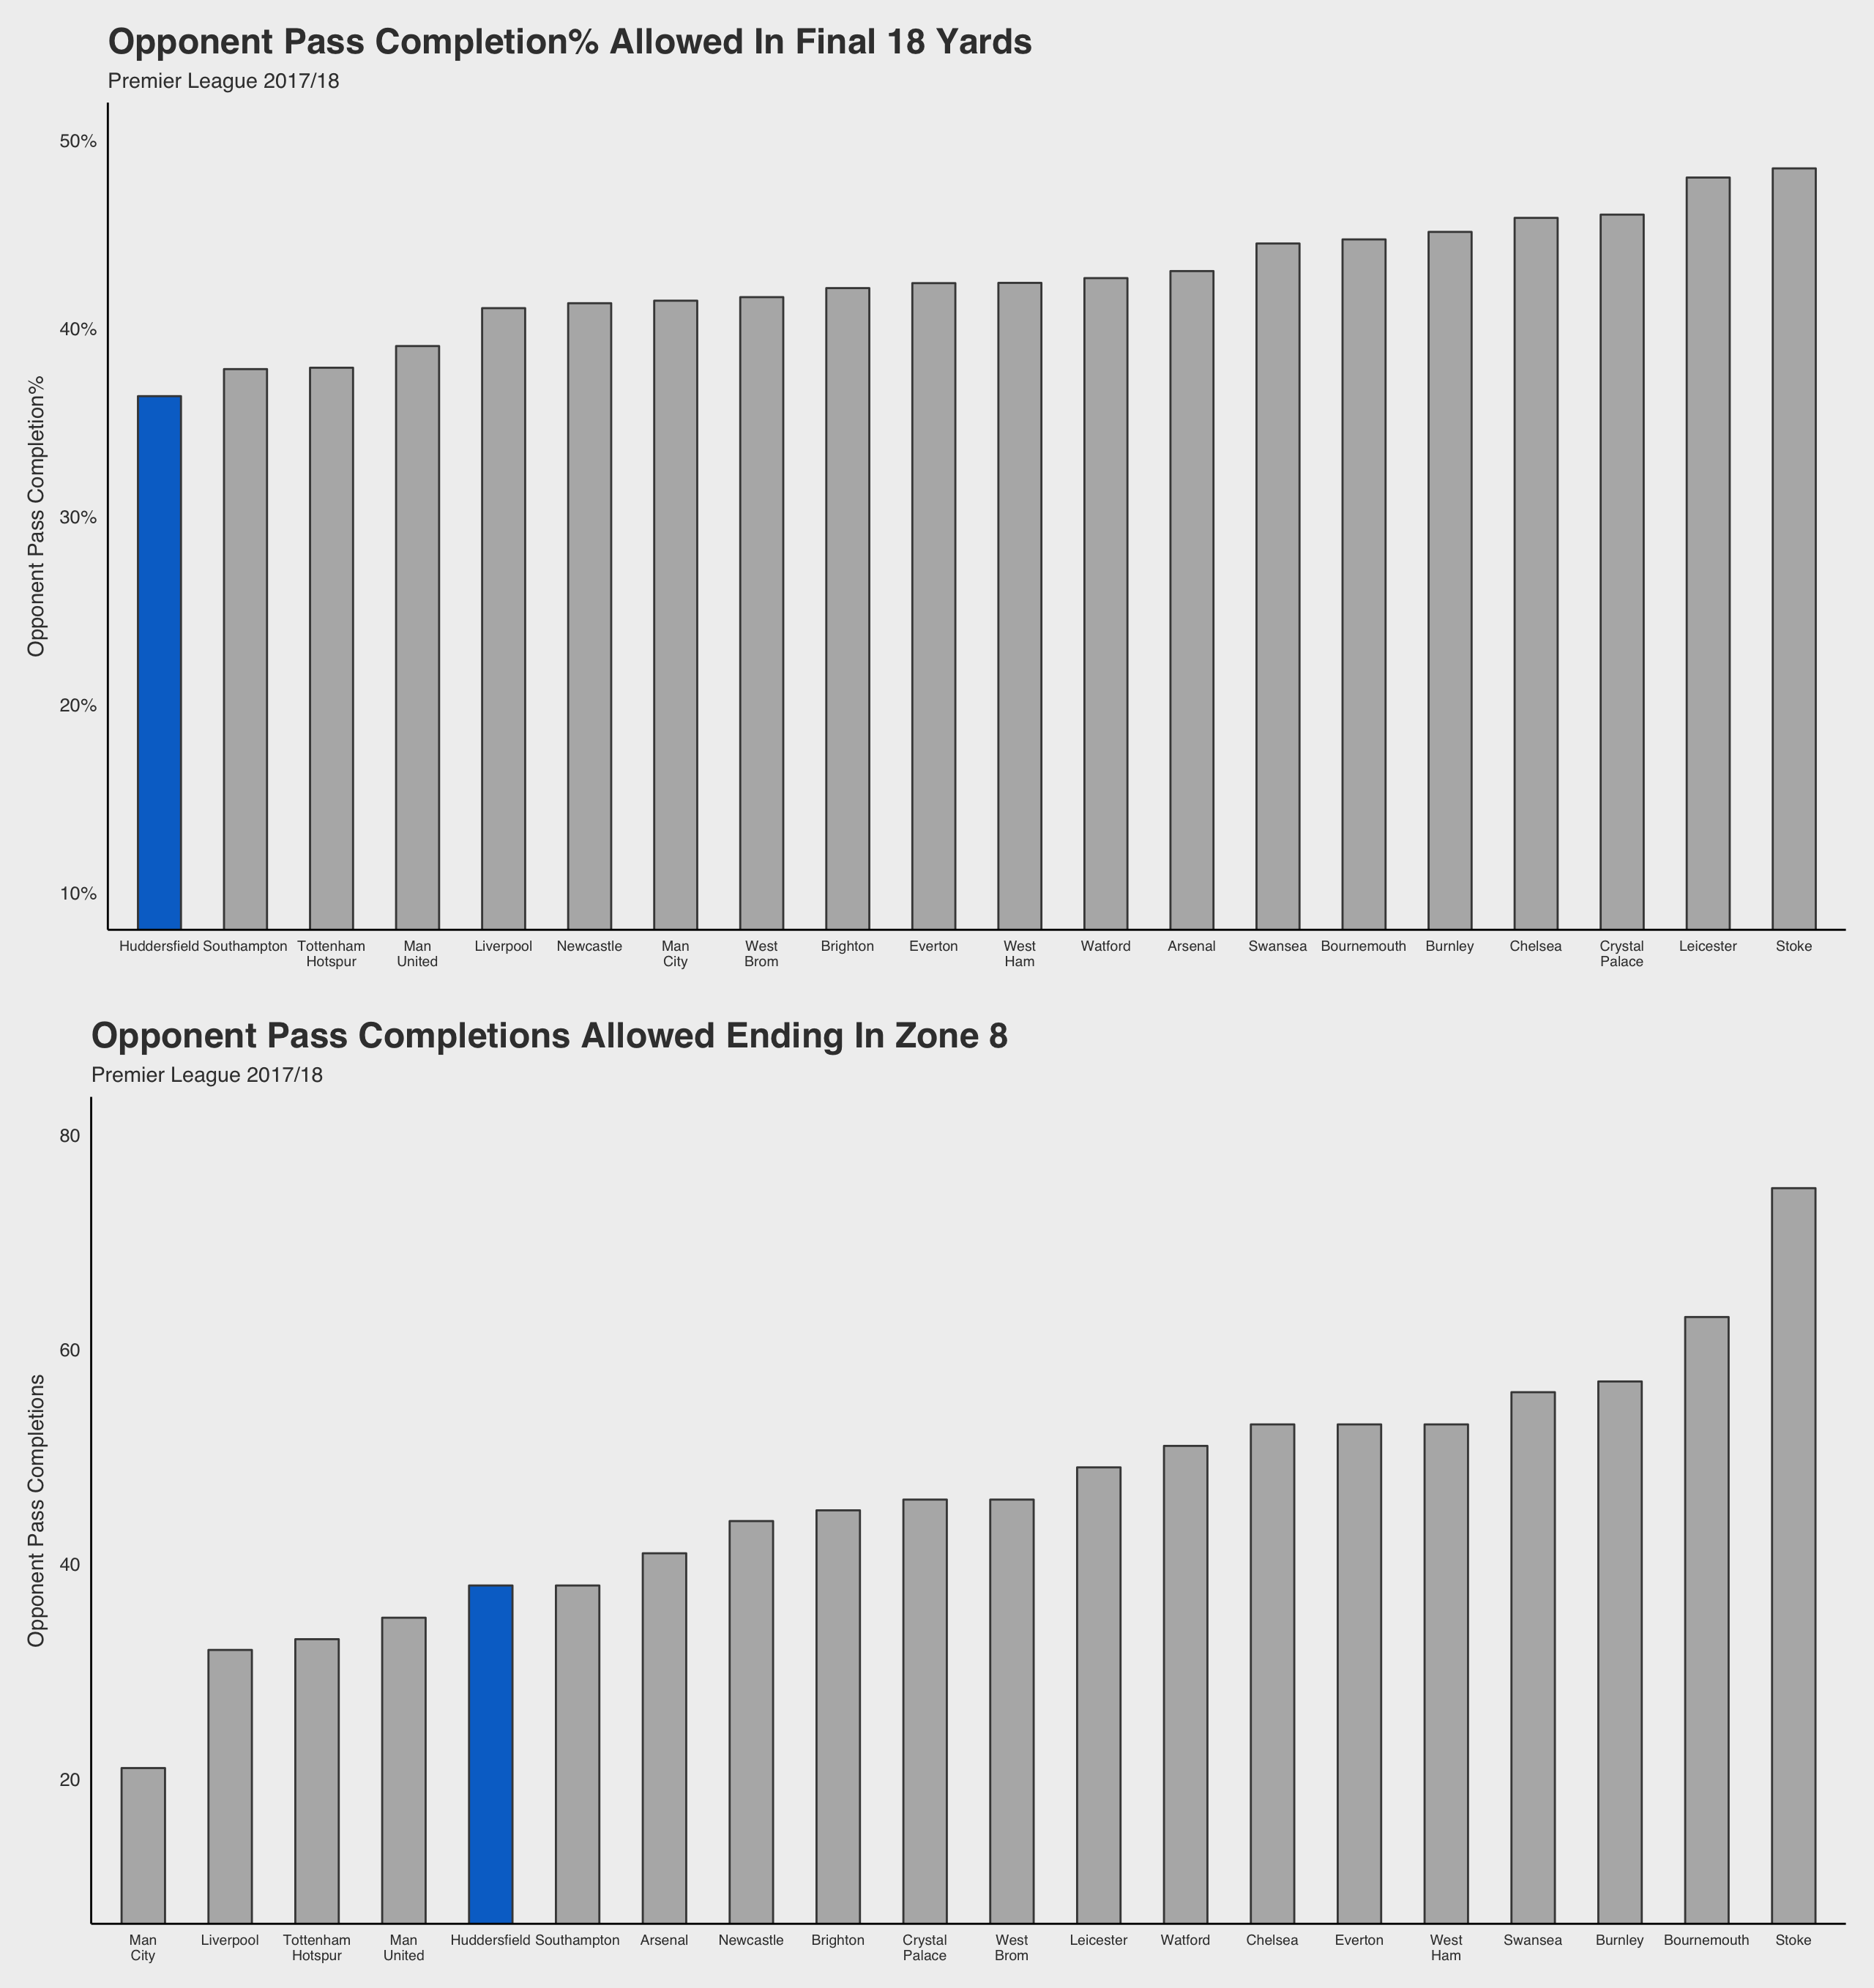
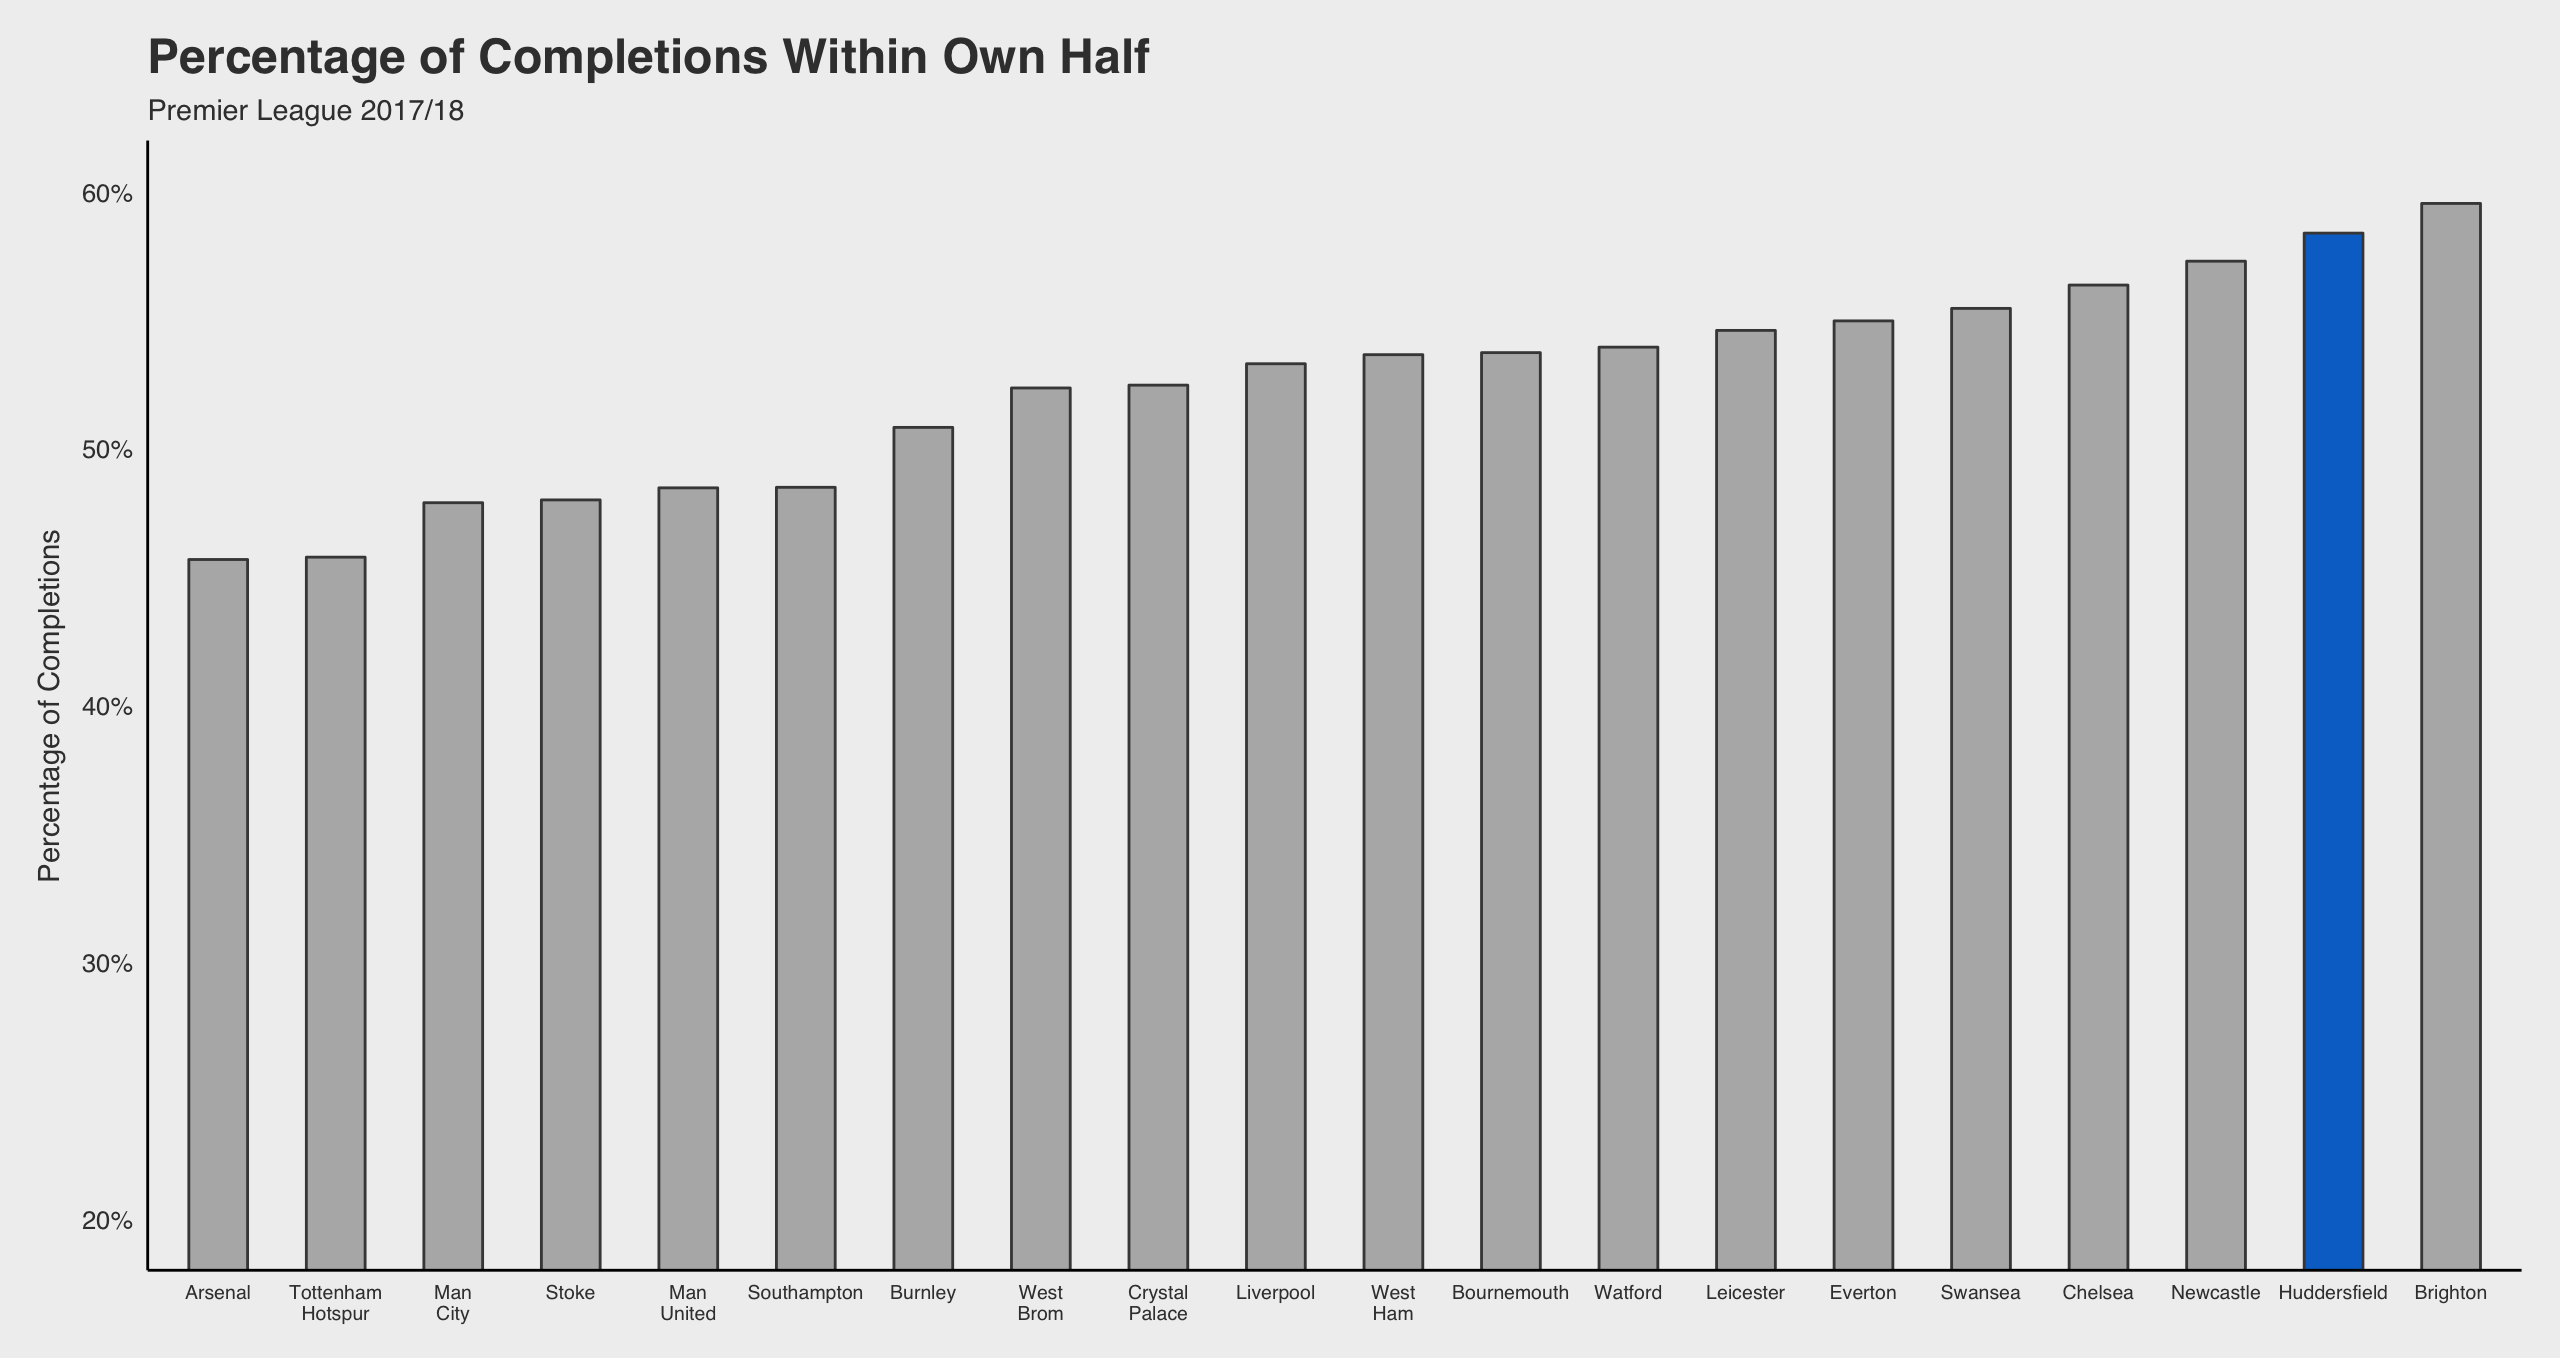
Manager Pablo Machín has them at a high level of defensive organisation all over the pitch. As you may have seen above, they allow one of the lower proportions of opposition completions in the final 18 yards, pointing towards a sturdy shape near to their own goal. They engage pretty high up the pitch too, forcing the 6th lowest completion percentage on passes originating in the opponent's defensive third along with the 4th lowest proportion of opposition possessions that are 'long' (10 or more passes). Put this all together and you see them keeping opponents out of their third at a super impressive rate.
On the other side of the ball there's two big defining stylistic points: 1) they've gotten the joint most goals from set pieces in the league (9) - a route of value you'll hear reiterated time and time again on this here website, especially for promoted teams - and 2) they love a headed shot, racking up the 2nd most of those, with the 2nd highest proportion of their completed passes into the opposition box coming via crosses. Other than that, there's no one regard in which their attack sticks out. They just do a little bit of everything. Long possessions per game? Middle of the pack. Counter-attacking situations? Solid there too. Shots from turnovers in opposition's third? They do them quite well. You get the gist.
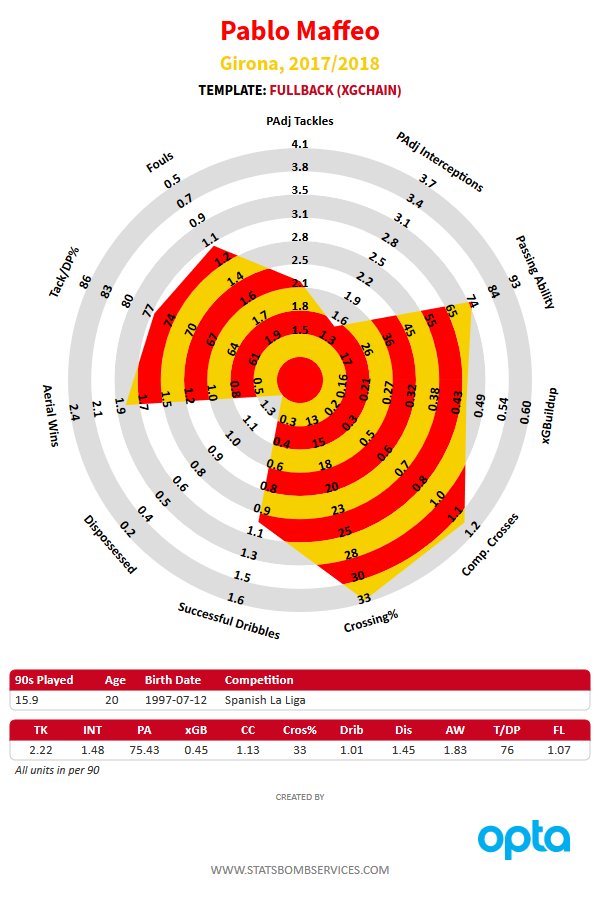
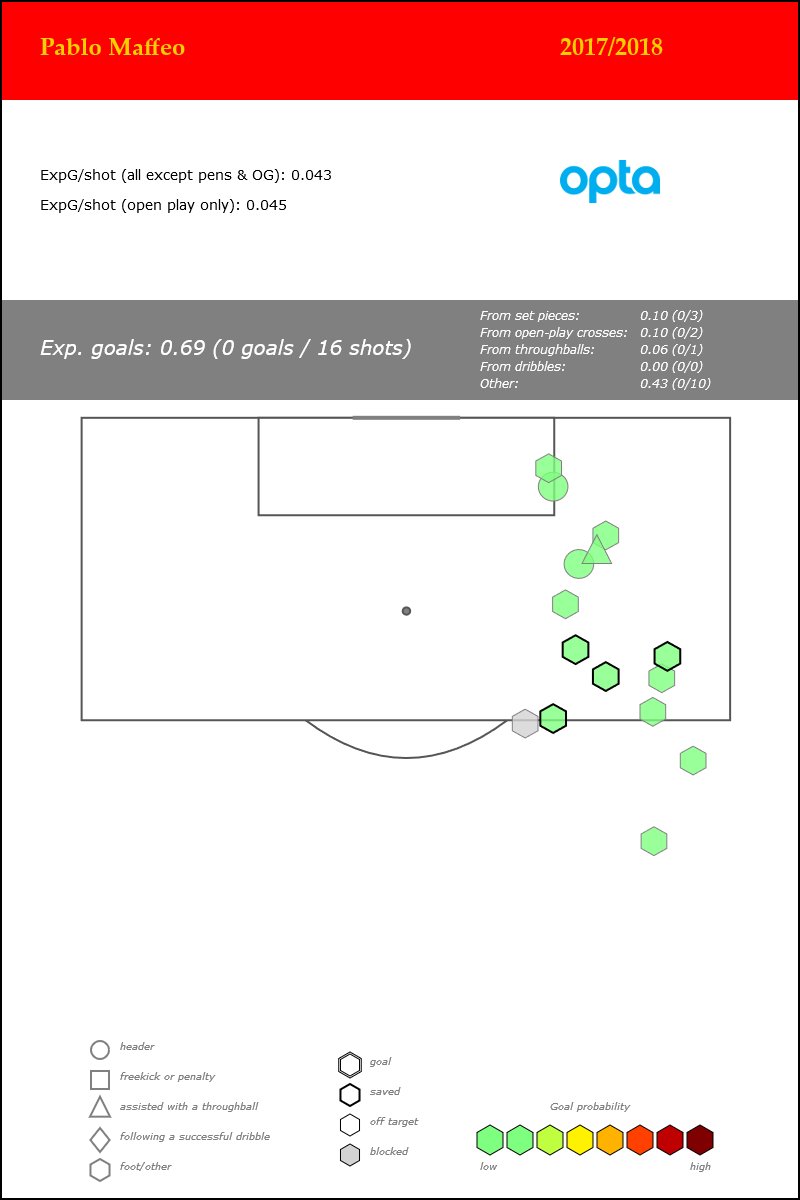
Lots of players deserve praise here but the most eye-catching has been 20-year-old right-back Pablo Maffeo. The City loanee has shown real creativity going forward as a wing-back and generally just a nice all-round game, handling himself very well in marking assignments on bloody Lionel Messi and Cristiano Ronaldo. Opponents complete their passes in his zone (the right side of Girona's defensive third) at the 3rd lowest rate in the league. He looks ready to slot in back at City, should Guardiola see fit to do so.
Someone might want to talk to him about the shots though. Oy vey.
Atlético Madrid
On the face of it there's little wrong with Atlético Madrid this season. They currently sit 2nd in the table, only having just suffered their first league loss of the campaign in the final match before the break. Everything hunky dory then? Well, peer below the surface and things start to look a tad iffy.
The defence is still looking about par but the attack has dropped off to a quite alarming extent. It's like Marcelino has sapped all the offensive capability out of Madrid and directly into his Valencia team.
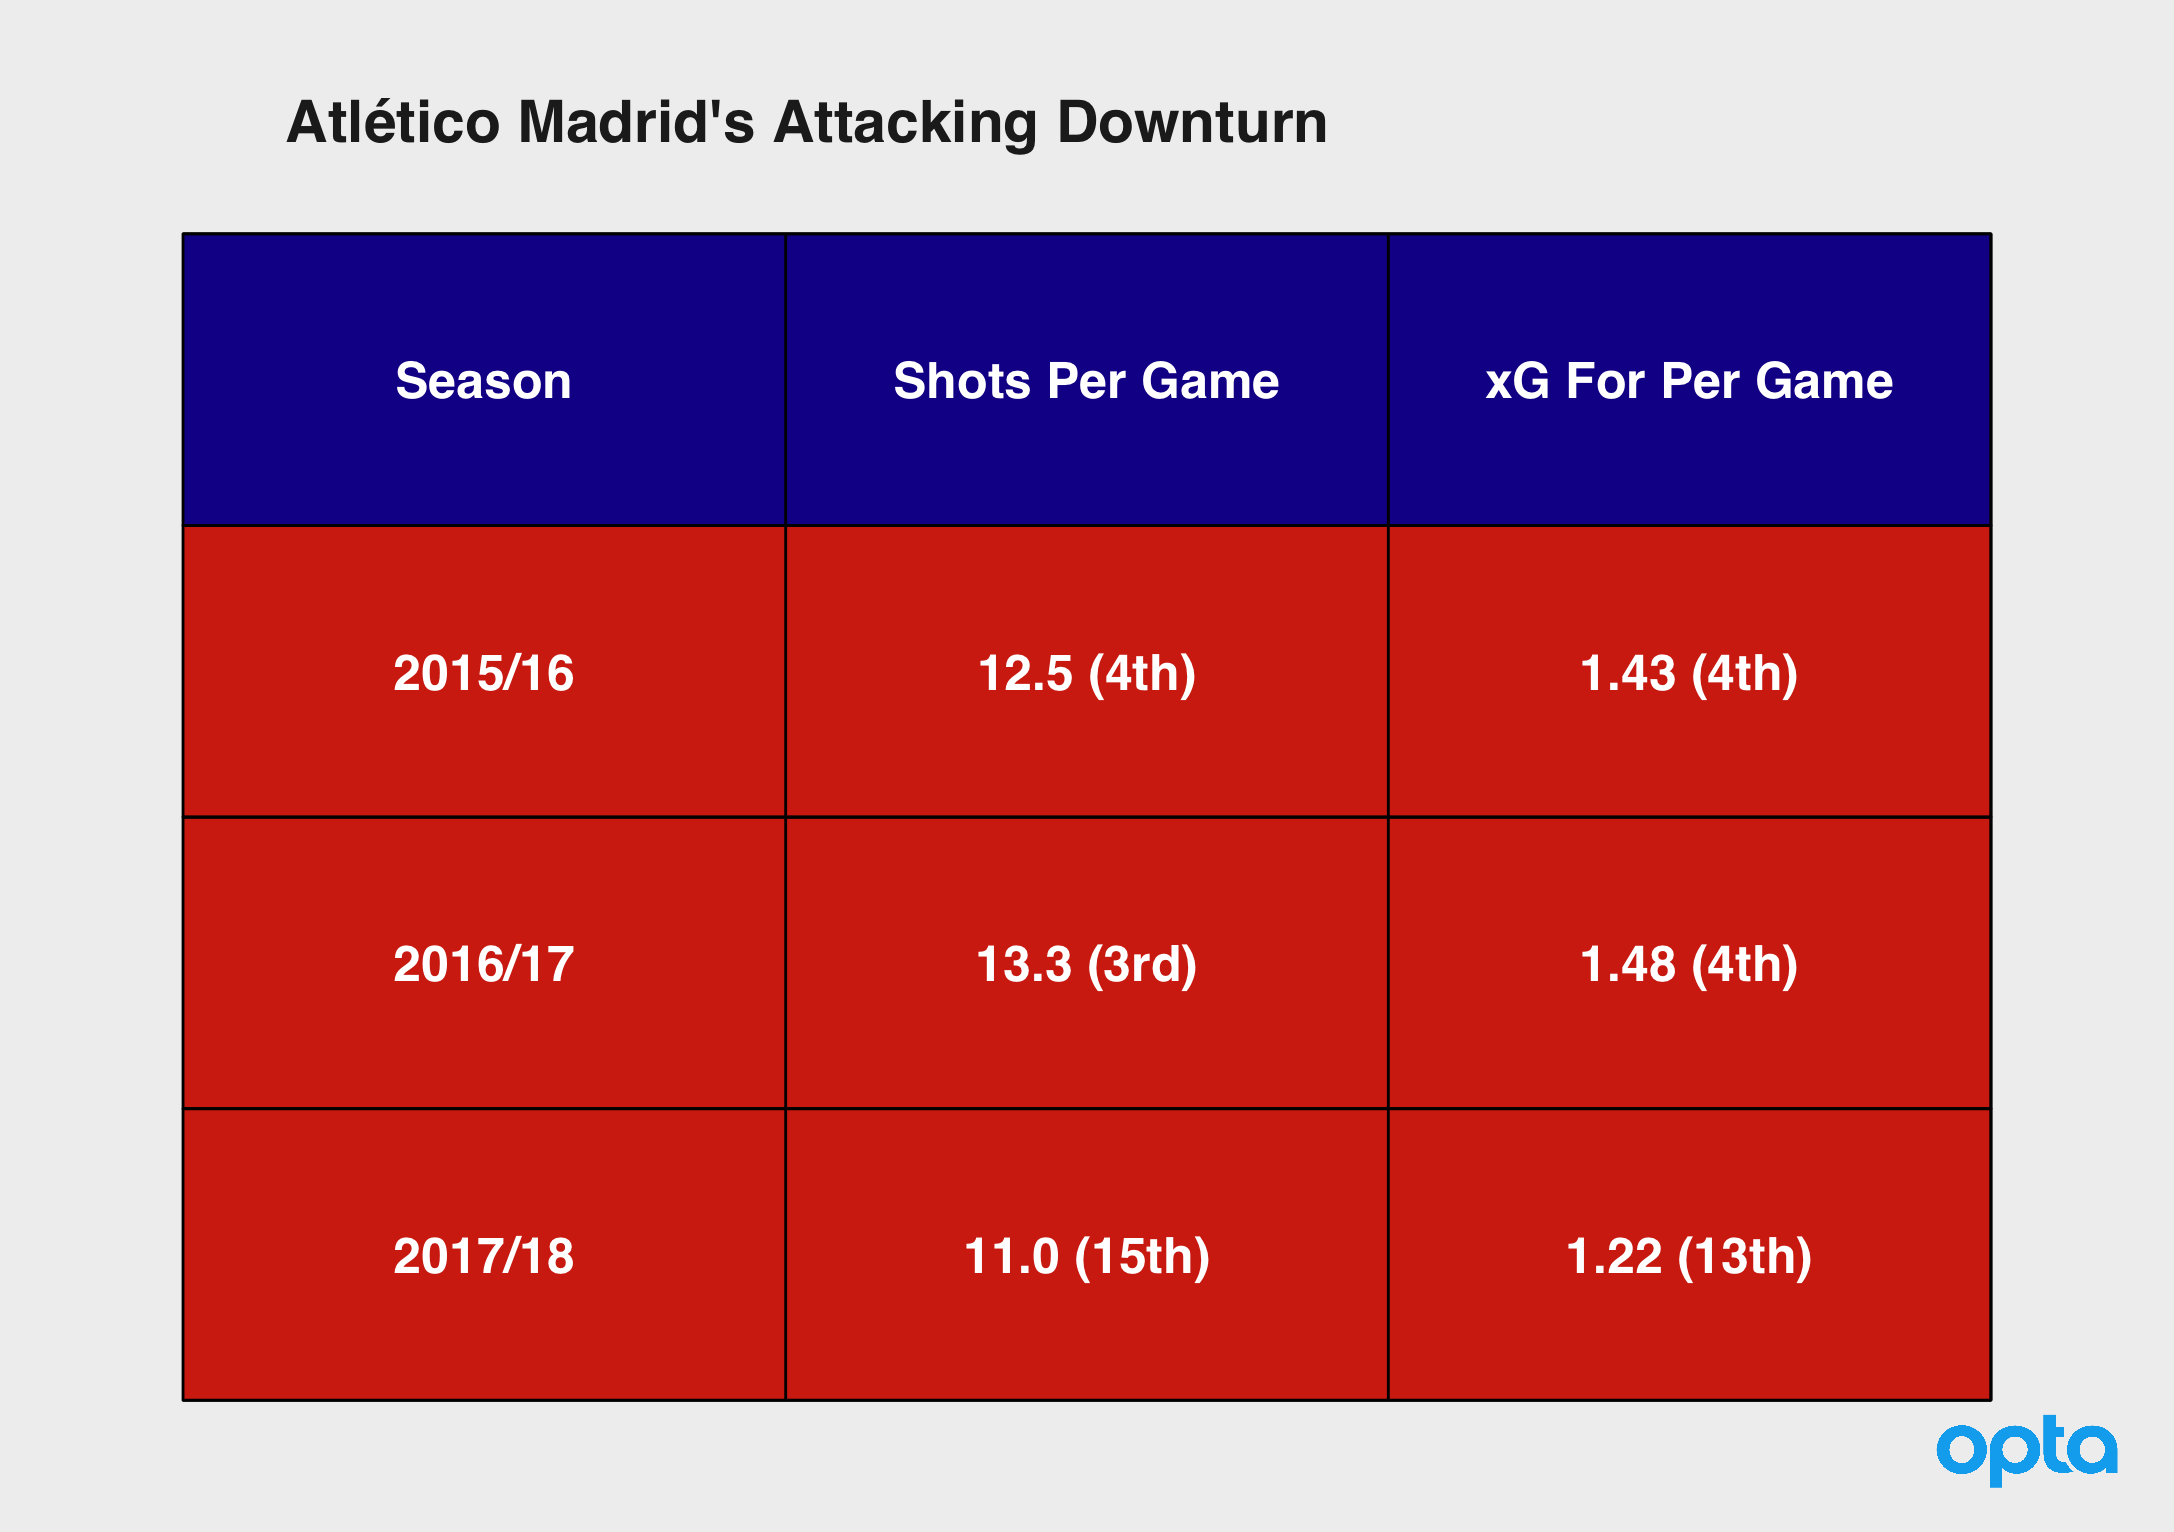
41% of their shots came from outside the box last season, that’s up to a league-leading 47% this time around. The root of this appears to be in their transition game. Atléti's deep and compact defensive shape is the yin that require's a counter-attacking yang. Otherwise you're just defending all the time. Right now, they're struggling to get out.
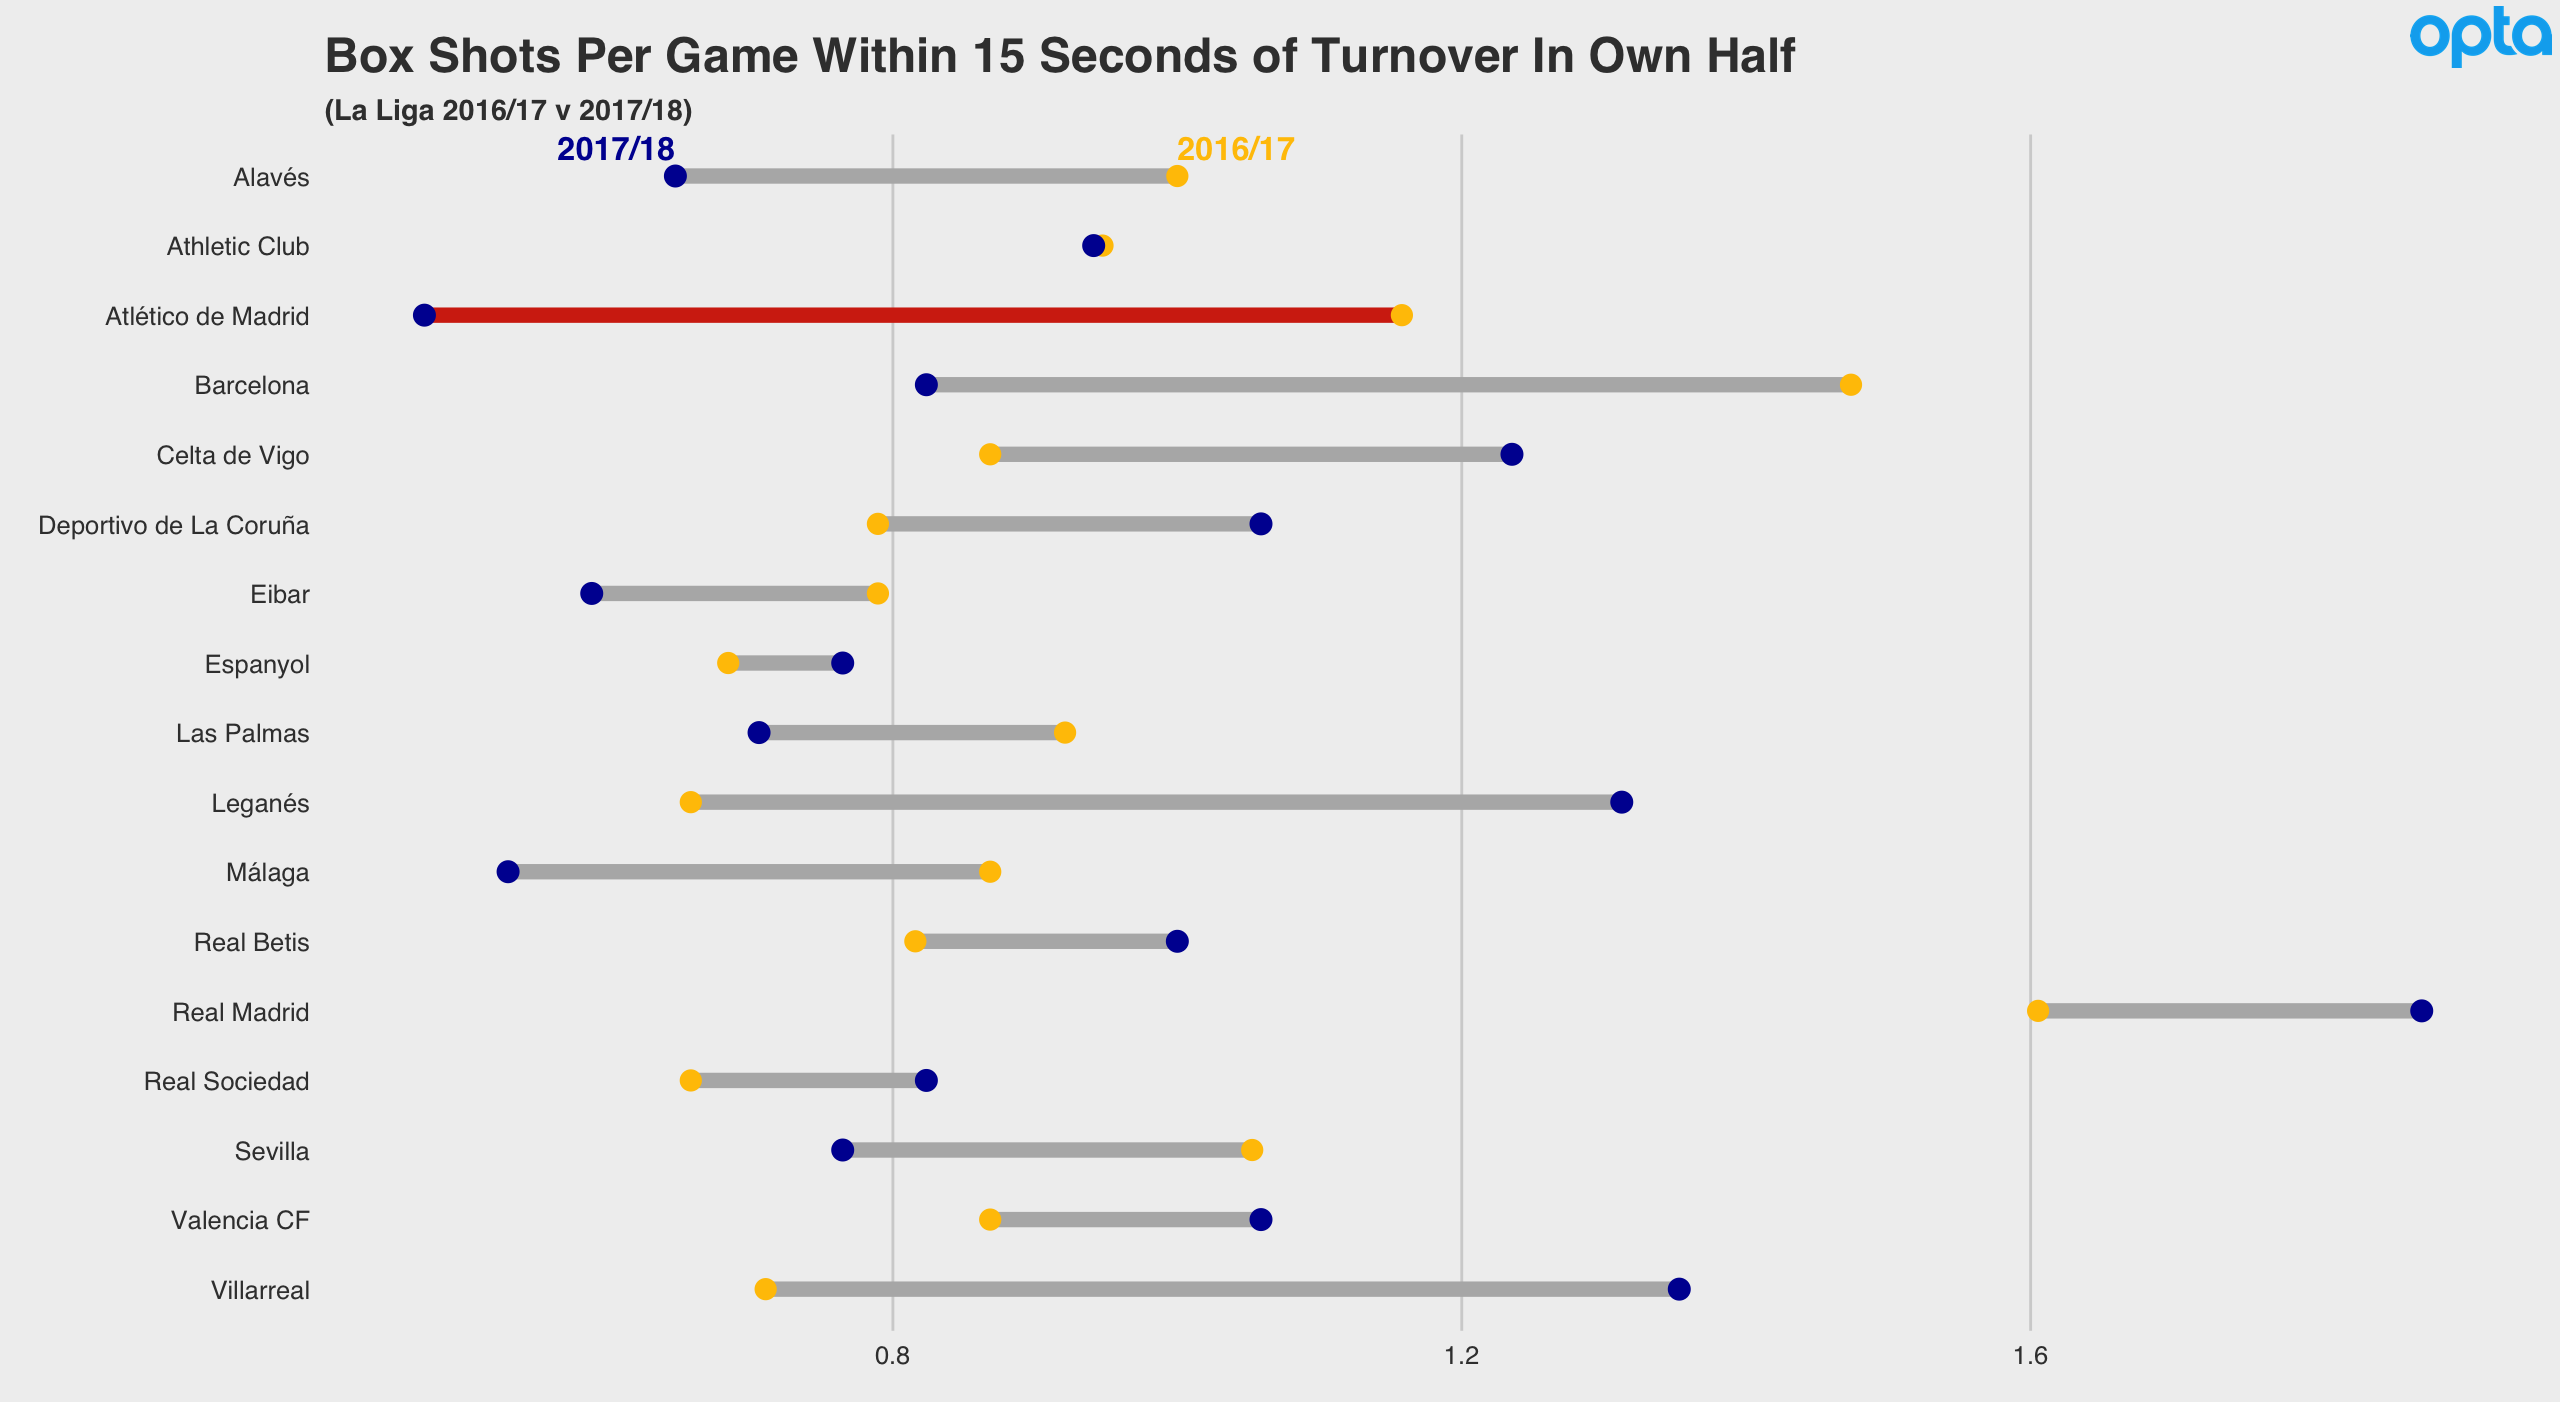
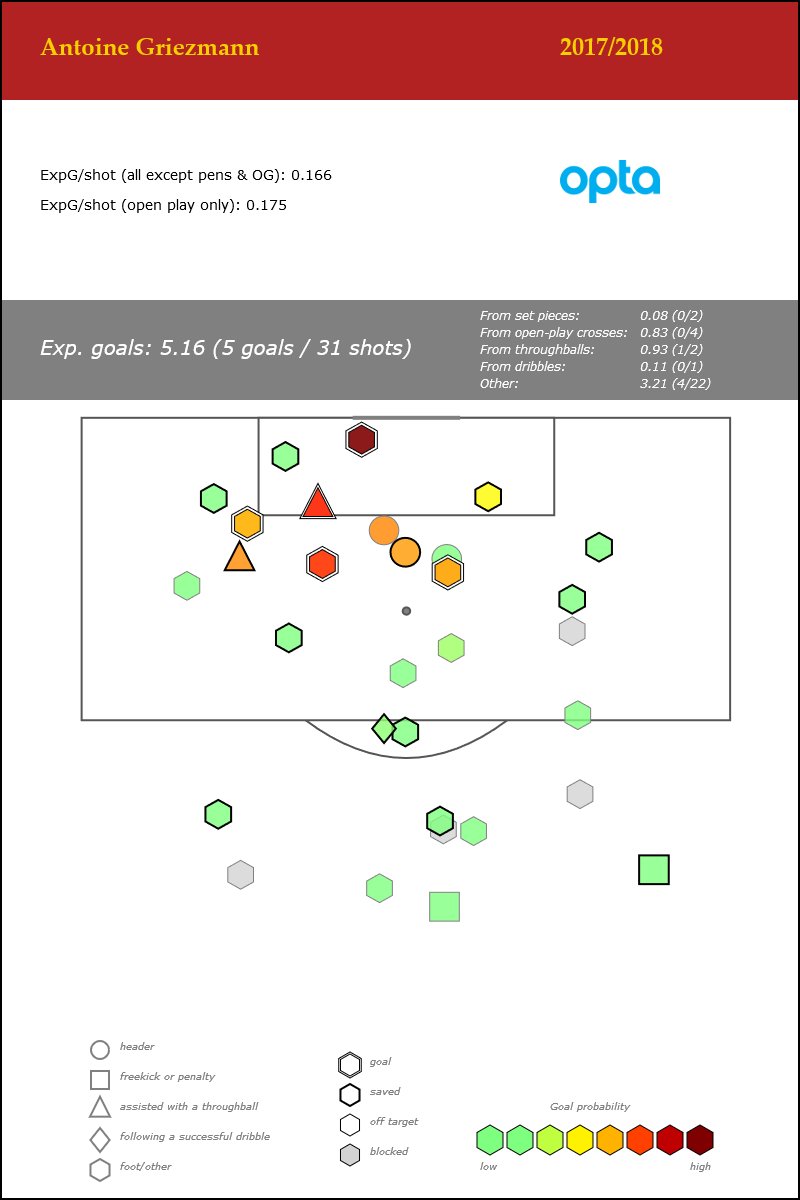
On top of that, the shots they're getting from turnovers in the opposition's third is down by about half a shot per game. Possibly most troubling of all is that they've only managed 3 goals all season from set pieces, one of the worst tallies in the league. Something that was previously their bread and butter. All in it's a dual issue of both shot volume and quality. Even Antoine Griezmann, whose individual volume is about the same as last season on a per 90 basis, isn't producing a great deal.
They've certainly improved their passing game over the years, to the point where now they're about average in how many shots they squeeze out of possessions that last 10 passes or longer. That'd be A-OK if everything else were working normally but it just isn't. With the points banked already maybe it won't be such a big deal. Simeone's obviously a fantastic manager and he might potentially cure what ails them. And of course the impending return of Dastardly Diego Costa will be a boon. If it doesn't turn around though, and the results don't keep going their way, it could be an underwhelming first season in the new stadium. __________________
Thanks for reading. You can find me @EuanDewar for any questions or the like. Enjoy the rest of the season!
Manchester City: Powered Up Under Pep

This article was co-authored by Euan Dewar (@EuanDewar) and Mark Thompson (@EveryTeam_Mark ).
Manchester City. Doing alright for themselves aren’t they?
It’s been a while since an English football team has loomed over the rest of Europe, hanging ominously in the air. Extraterrestrial. Imperial.
“That’s no moon. It’s a Pep Guardiola team.”
Through 12 matches the boys in blue sit atop the league with 40 goals scored (13 more than the team in second - their neighbours United). Four teams in last season’s Premier League didn’t even reach 40 goals after 38 matches. Their expected goals tally isn’t that far off either: +31.9 in terms of non-penalty xG and +34 overall. They’re blowing away all who stand in their path.
Perhaps, because a certain strain of English fan has always been sceptical of Guardiola’s success, the dominance of this current City team isn’t yet fully appreciated. Not only do they reign supreme in the surface numbers, but how they go about the game doesn’t let their opponents have a say either.
City average over five sequences of 20 or more consecutive passes per game, which is freakin’ phenomenal. The next nearest side in (Opta’s) living memory is the Barcelona side of 2012/13 with 3.9, and then Bayern of 2015/16 with just over three. Guardiola's influence here is clear. There are only two other sides who average more than 2.5 such sequences per game. City are doubling that.
They also get to the final third in over 55% of their possession sequences, at the top of the historical list along with Pep's Bayern Munich sides of 2013-2016. For any who were sceptical about whether Guardiola could ‘do it in the Prem’, the answer is now clear.
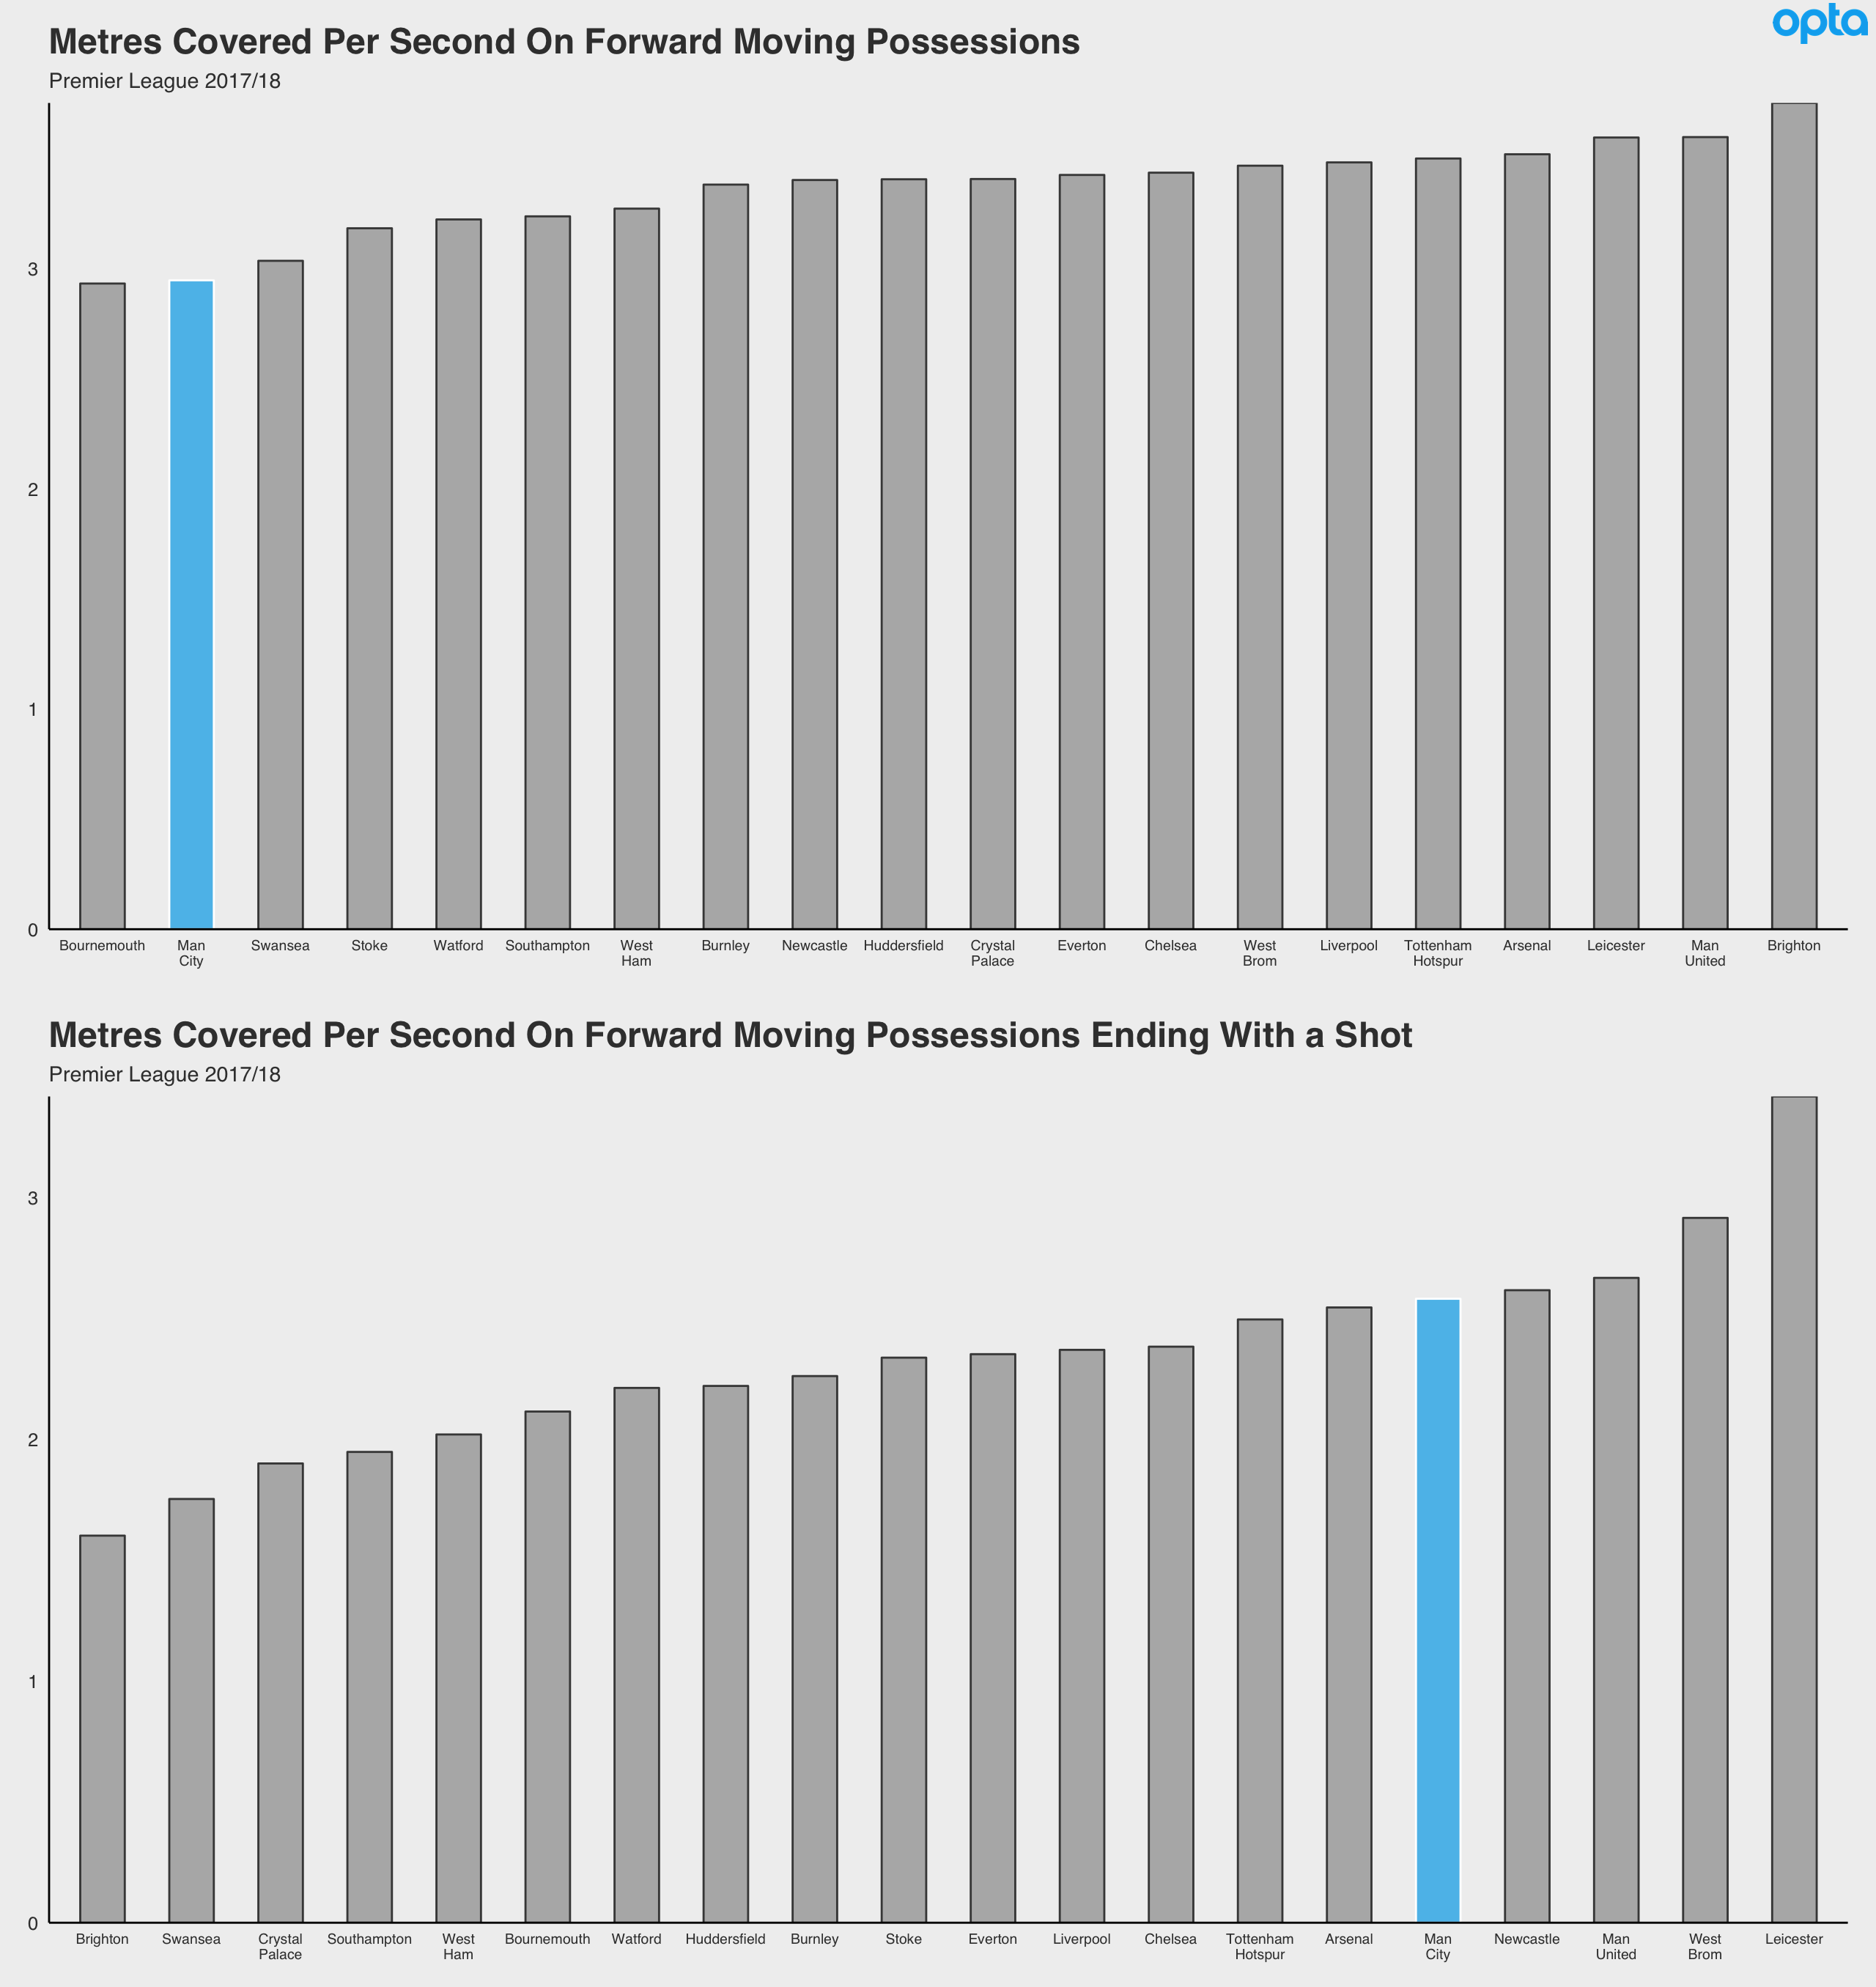
Patient build-up is only half the story with City. A defining characteristic of Pep’s sides is how they shift through the gears, moving the ball (and consequently the opposition) from side-to-side until they spot an opening, at which point they up the pace and cut through the defence. These facets to their game can be seen in the varied speed of their output. In the aggregate they’re as slow as you might expect, but look solely at possessions leading to shots and the threat is apparent. When the time is right, they go for it.
Shots from counter-attacking opportunities represent a lower proportion of City’s attacking diet compared to the rest of the league, as you might expect from a team who dominate possession like they do. However, they still get plenty of them - the 3rd most in the league from transitions that last 25 seconds or fewer (with a transition defined as a possession that starts in a team's own defensive third and ends in the opposition third). This is also an even higher proportion than in Pep’s last seasons at Bayern.
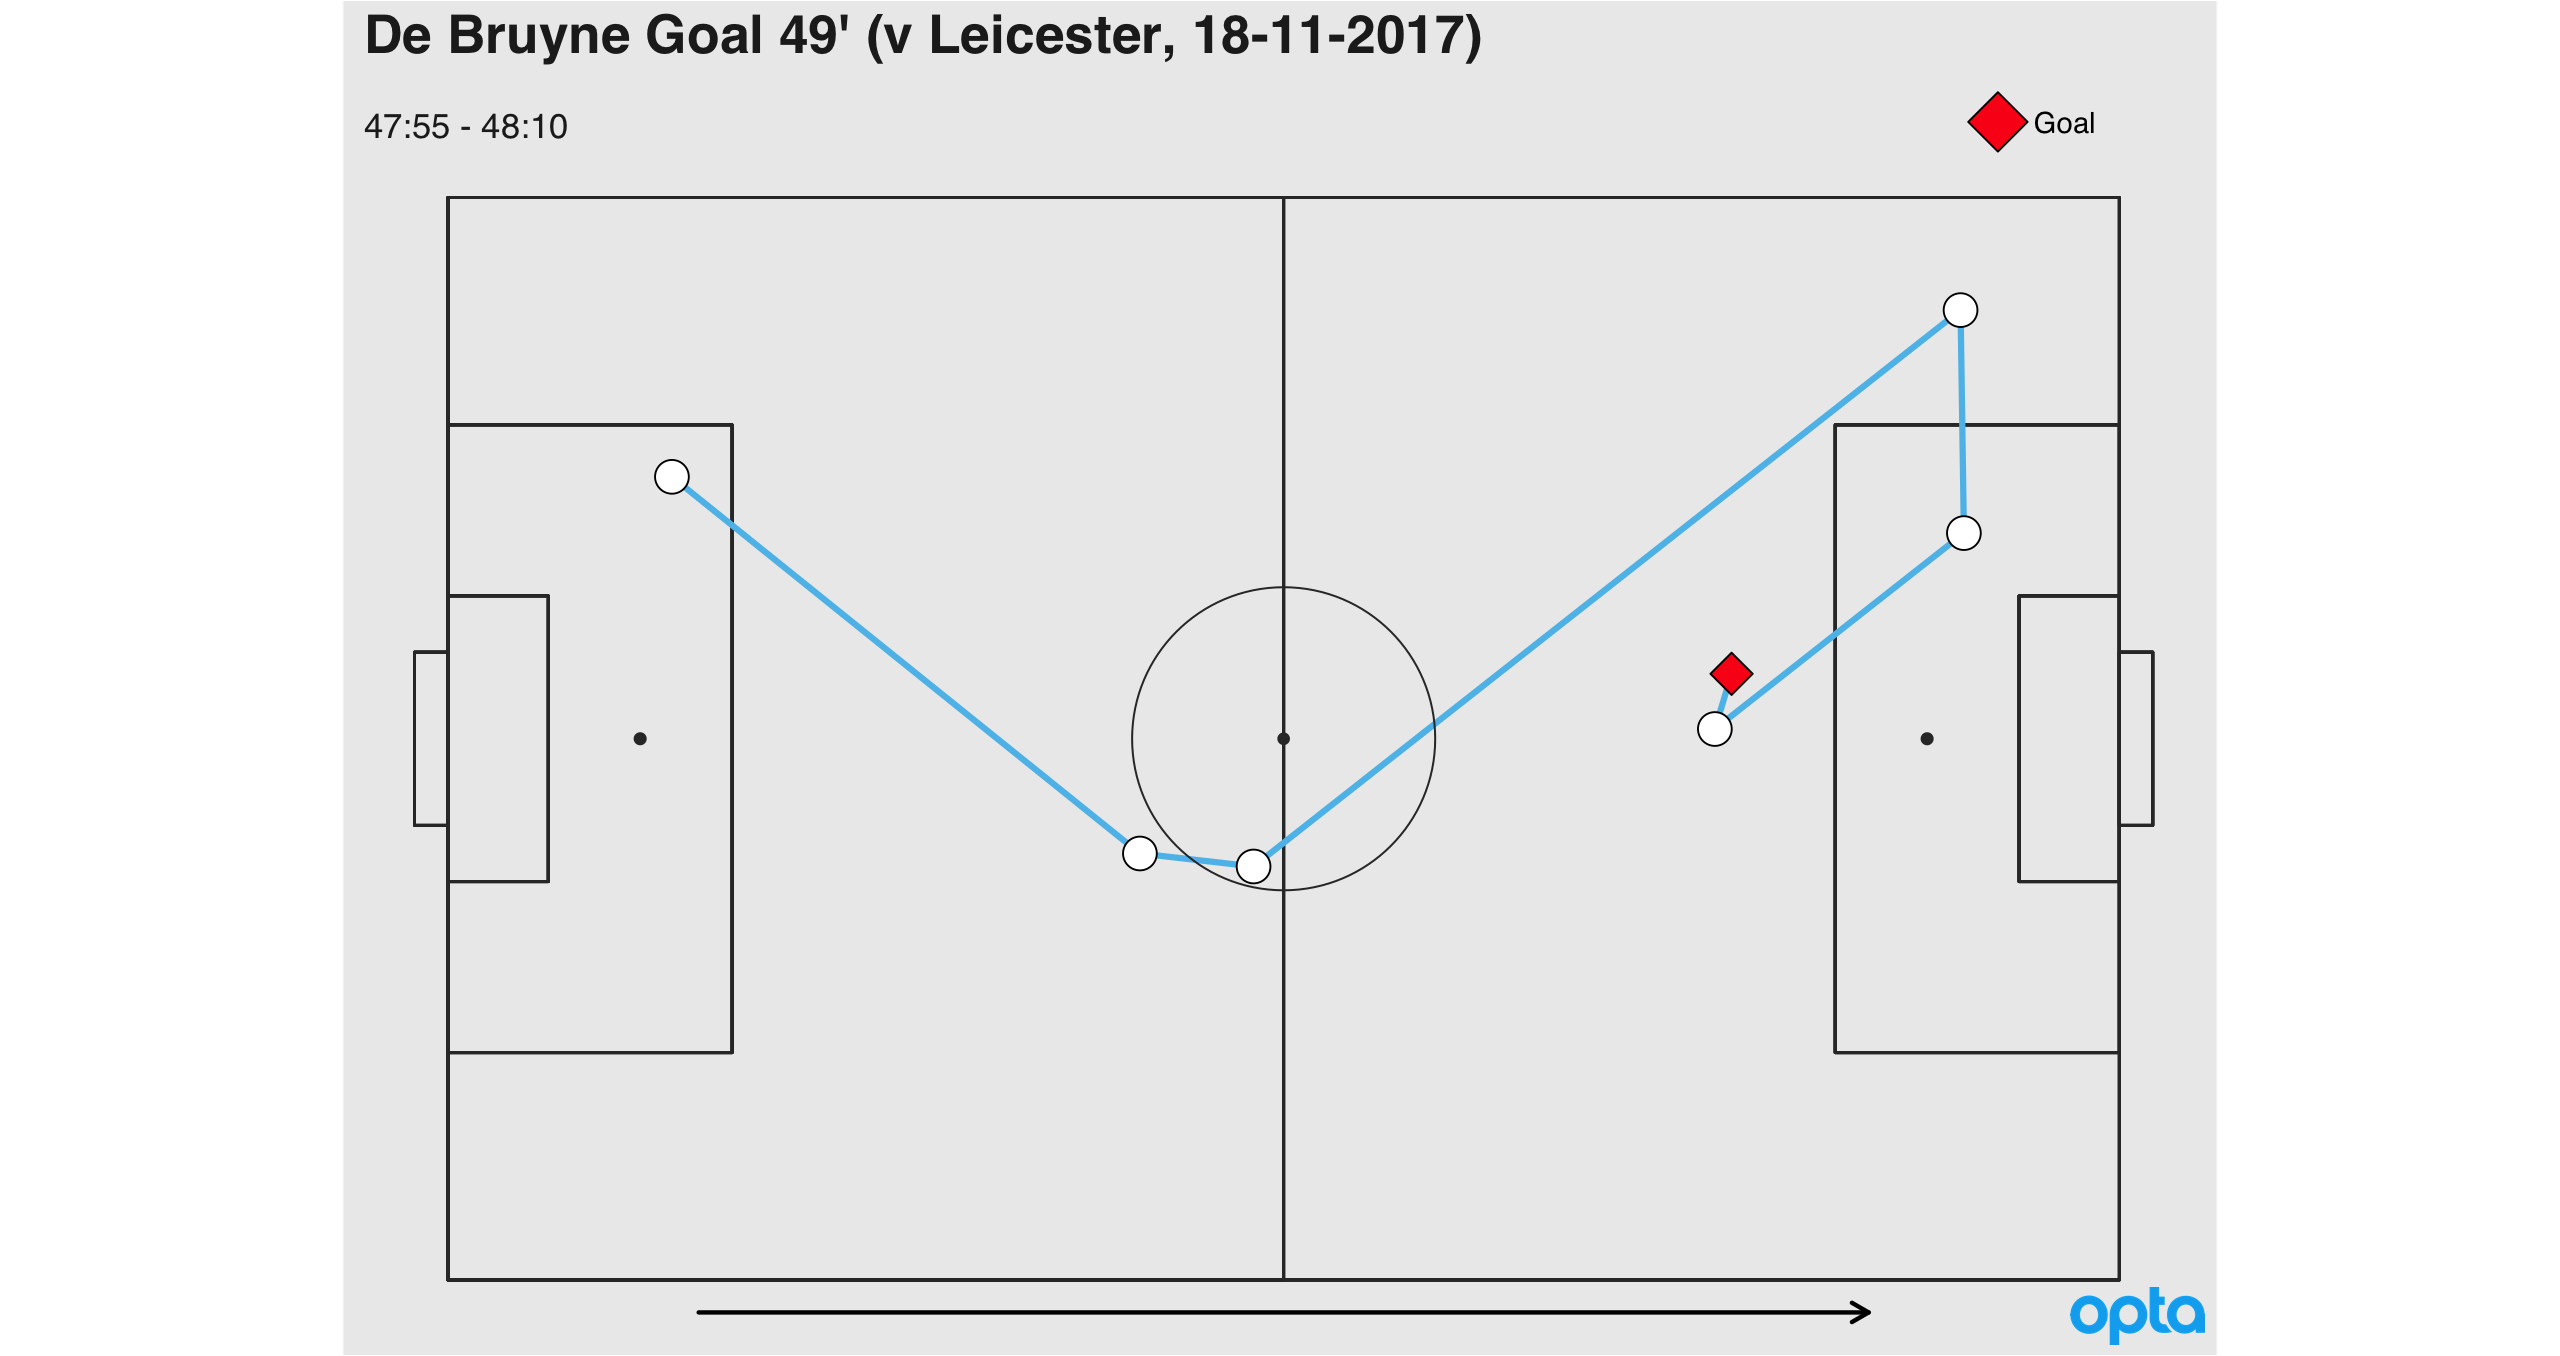
City’s transition possessions go through the right half-space at the highest rate in the league and left half-space at the second highest. This makes sense considering how much David Silva and Kevin De Bruyne love pulling the strings from these zones. When you combine that duo with the attacking menace of the likes of Leroy Sané and Raheem Sterling you get downright lethal counters like their second goal against Leicester at the weekend. The foxes went from attacking to picking the ball out of their own net within 15 seconds.
The Other Side of the Ball
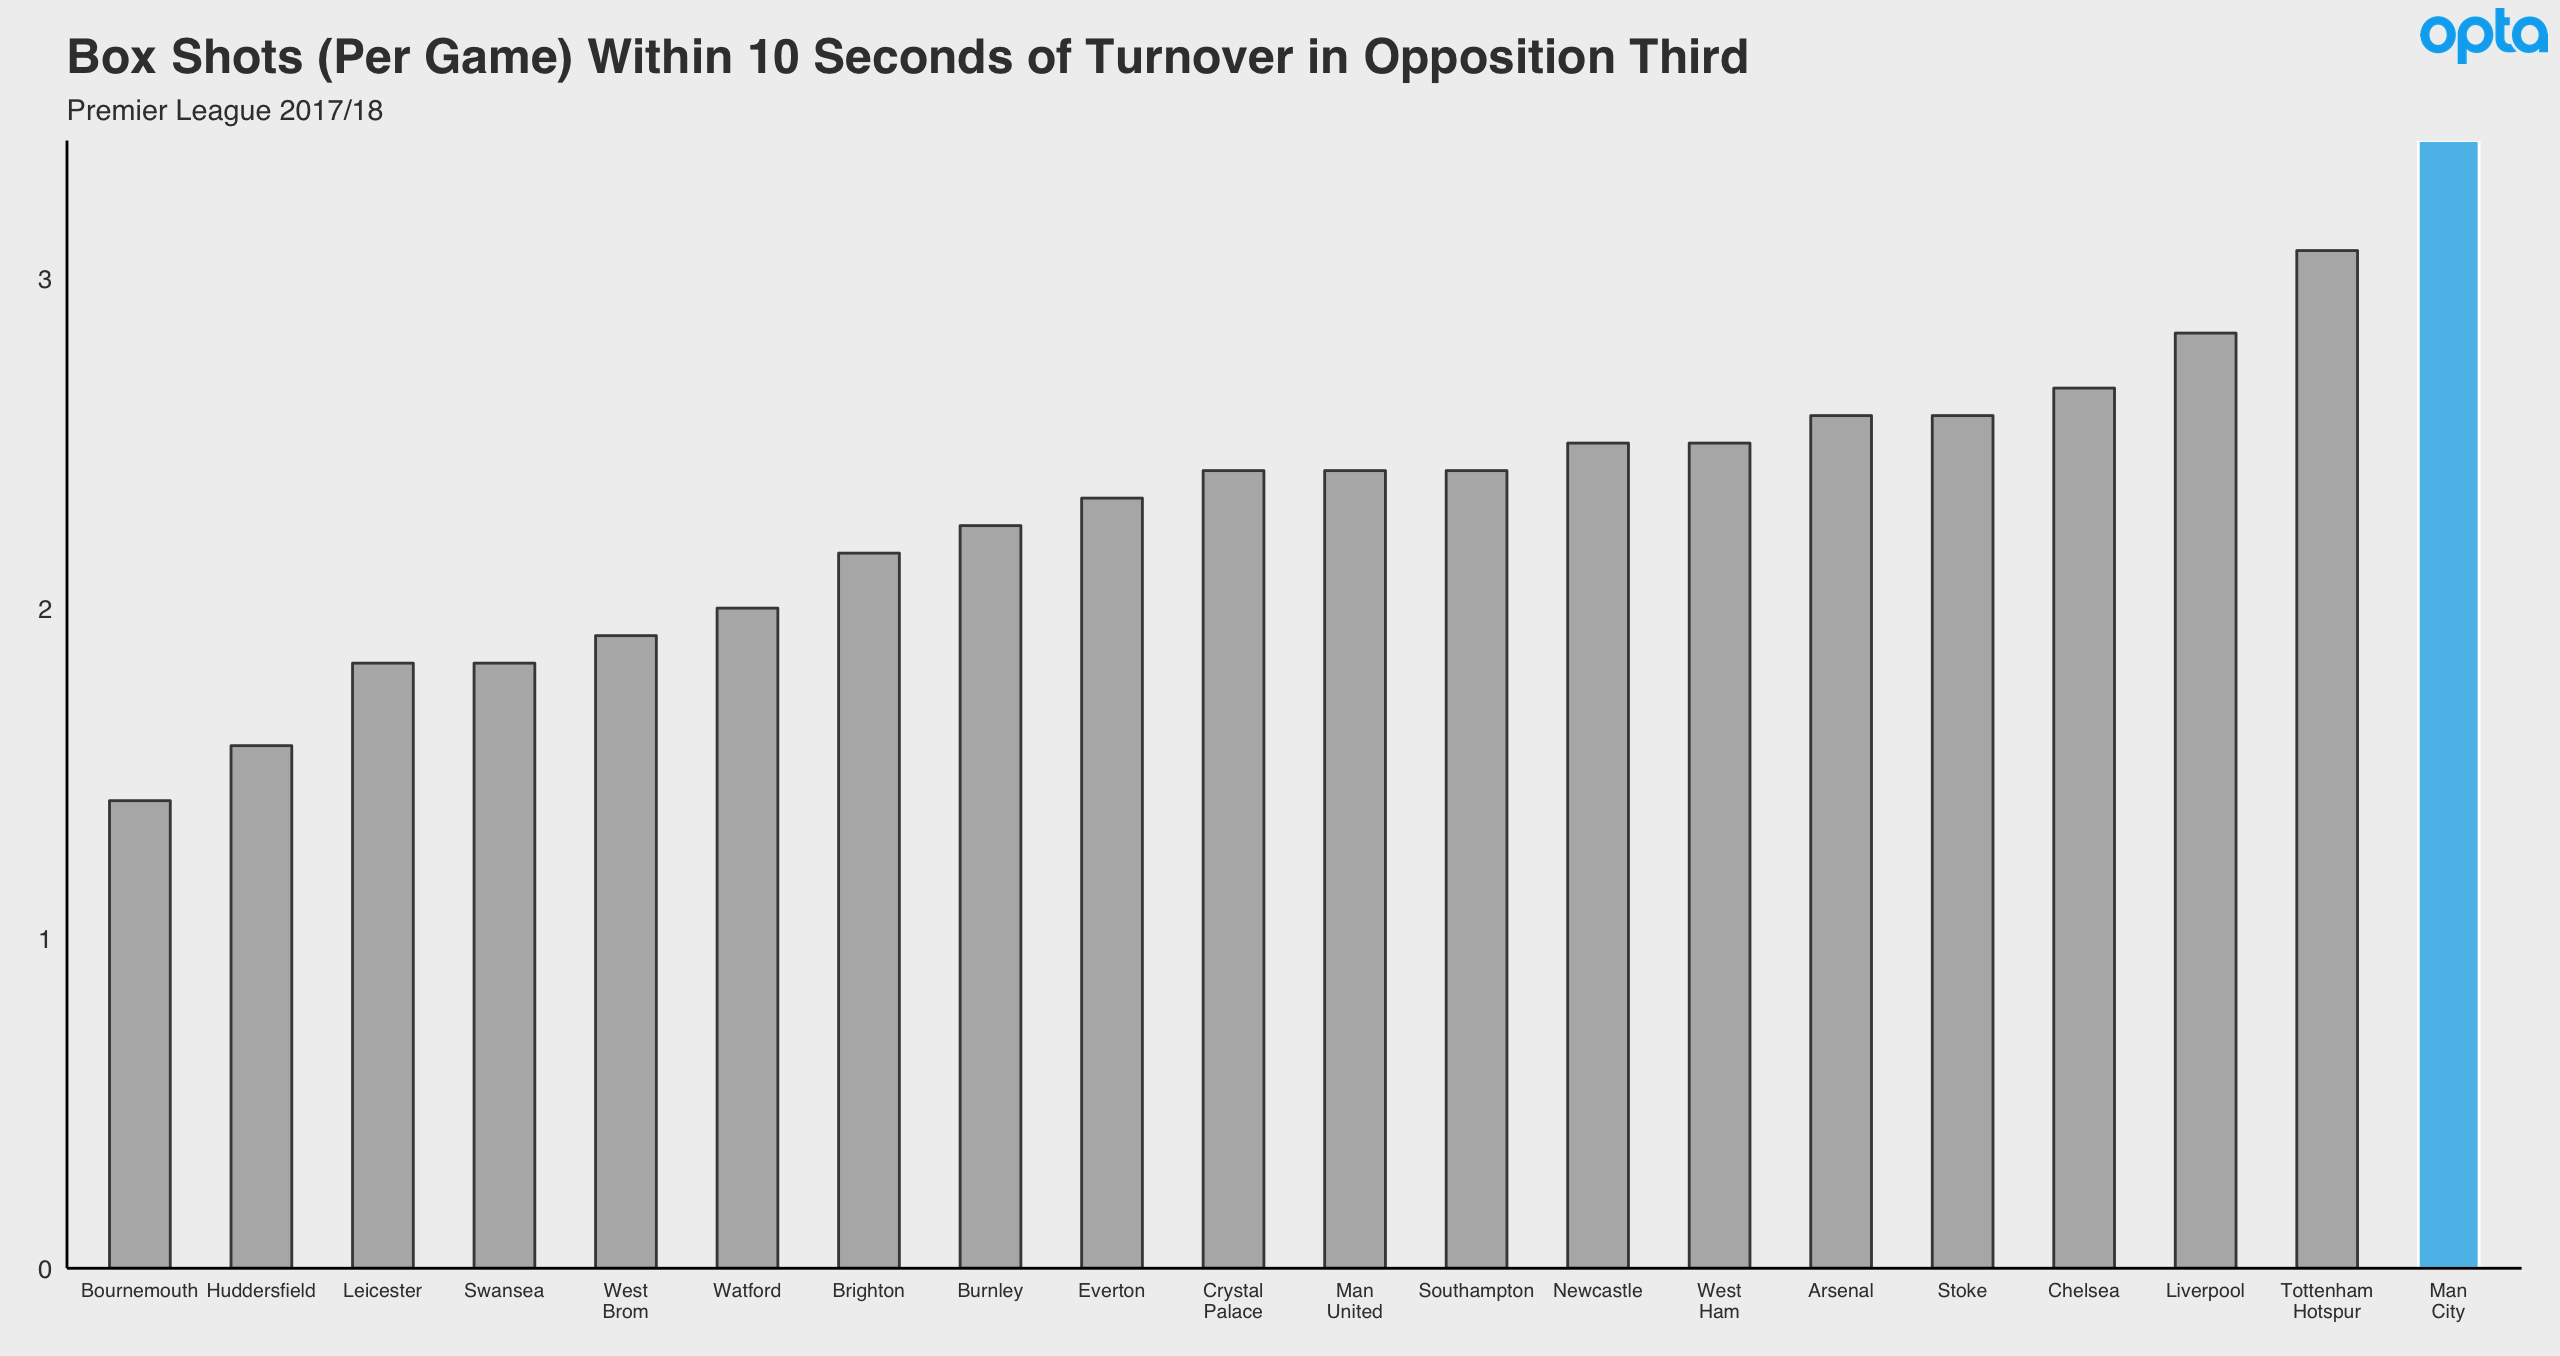
Possession is nine-tenths of the law in some places, a criminal offence in others, but for Guardiola it’s also a way of defending. Not only can the opposition (obviously) not score if you’re the ones with the ball, but Pep also uses it to help his teams get into position to counterpress. City rank a clear 1st in the PL in terms of shots in the opposition box that come within 10 seconds of a turnover in the final third.
As a result of this combination of defensive techniques, City’s opponents’ only get to the final third in 34% of their possession sequences. This isn’t quite at the historically good levels as City’s passing stats, but the closest rate in the Premier League this season is Liverpool on 39%. City allow their opponents just under 2.5 sequences of ten or more consecutive passes per game, far below the average of league average of eight. The next lowest figure is for Spurs, allowing just 3.7 per game, but there’s daylight in that distance between City and the London side.
However, every strategy in football has a weak spot and City’s is the same as it always has been for teams in their mould. Dominating the play, pinning the opponent back in their half, it leaves space open behind that can be exploited.
![]()
The thing is though, Pep has been coaching in a variation of this style for a decade now. He’s obviously aware of this issue and has spent plenty of time tinkering with the approach in order to minimize it. As a result, the opportunities the opposition gets are few and far between. While City give up a fair few transition opportunities, this season they have allowed the fewest that reach their defensive third as well as the fewest shots in transition.
However if you can get into their danger-zones then all is not lost. City's underbelly isn't exactly soft by any means, but it isn't quite as suffocating relative to everything else.
Really though, Manchester City aren’t the Death Star. The Death Star had a clear flaw that was easily exploited by a space farm-boy. City are scarier than that.
None of this is totally permanent of course. Football’s a funny, volatile sport and things could get tough when the fixtures start to pile up. As things stand though, they look well set to impact both the domestic and European scene in a way an English club hasn’t for some time.
Thanks for reading. Have yourselves a good week out there!
Huddersfield, Chelsea and Other Notes From the Premier League's Opening Salvo
We're a couple of months into the Premier League season now and, as ever, it's a real whirlwind of events. Managers are falling everywhere you look and it feels like a team is getting crushed 5-0 seemingly every other week. Now's a good time to slow down a little, take a few minutes to collect ourselves. Interesting details are cropping up throughout the league table and the statistical minute is starting to pile up, so lets have a dig through it all shall we? This wont be an all-encompassing roundup, just a few bits and bobs from the teams that stick out.
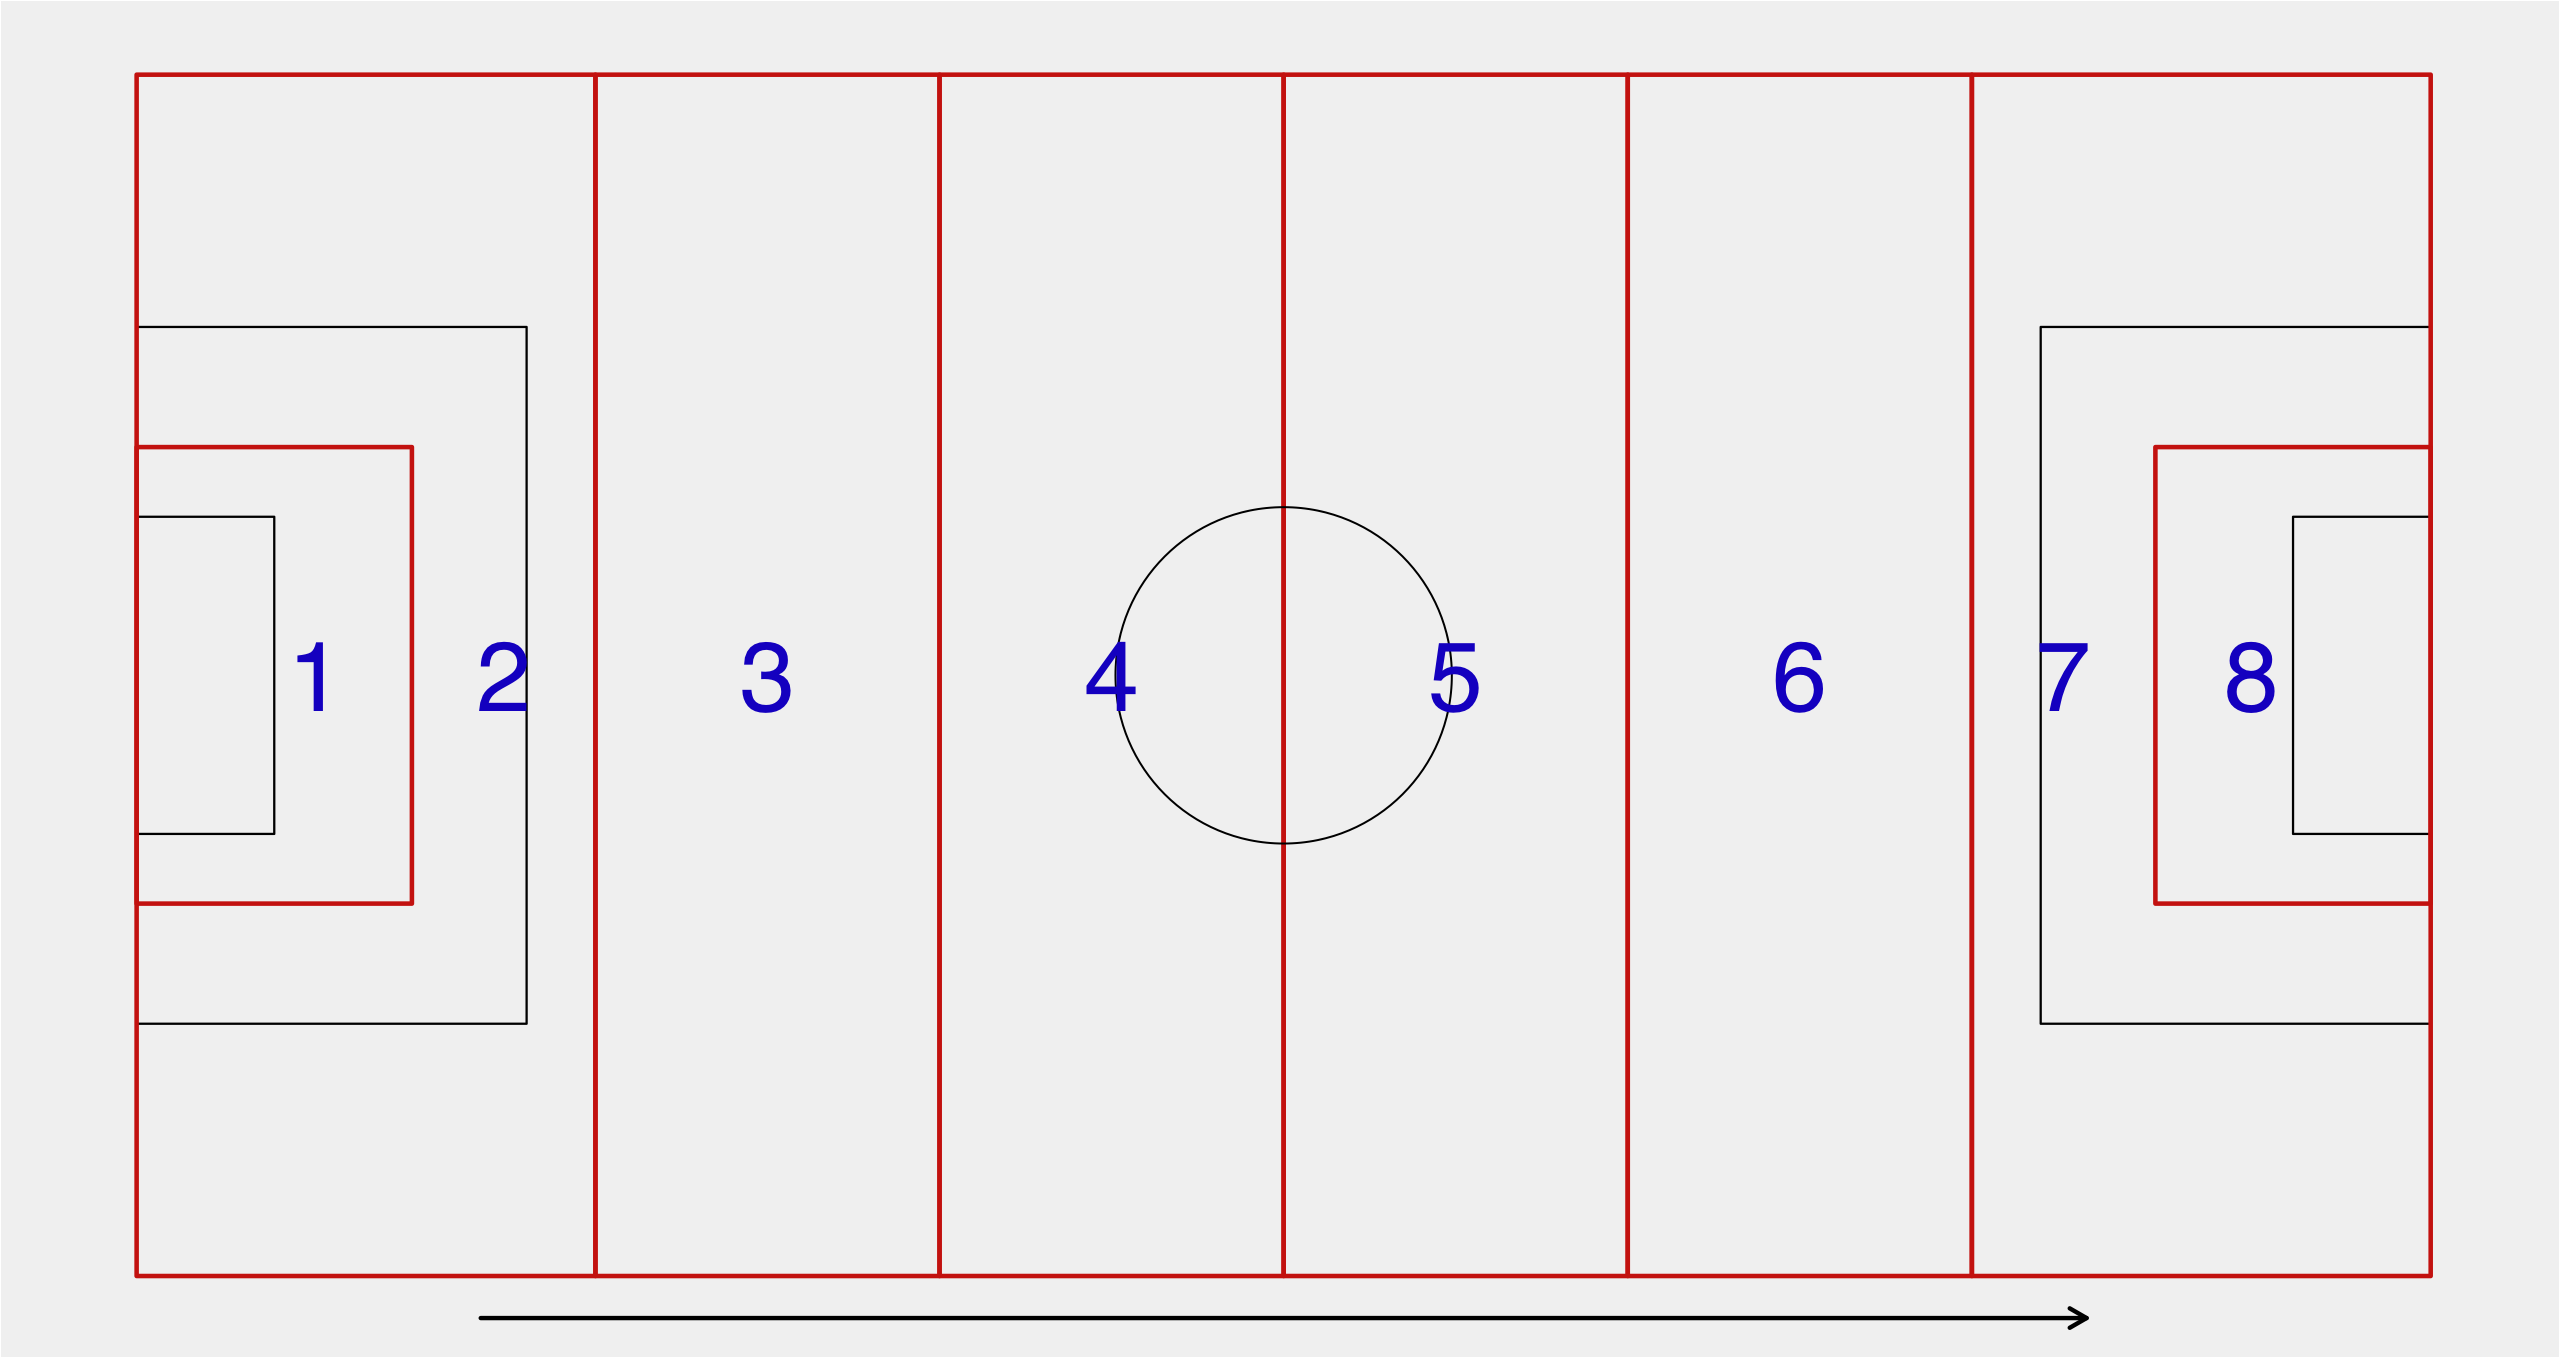
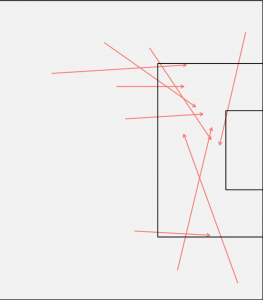
For the purposes of this article we'll be using these zones, similar to those that the venerable Dustin Ward has used in his work on this site. They represent the team in possession attacking from left to right. It may be helpful to open the image up in a separate tab or window as they'll be referred back to throughout.
Huddersfield
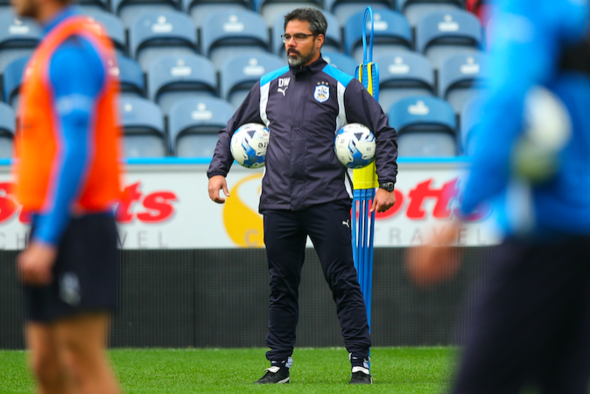
David Wagner's boys are one of the more intriguing sides to come up from the Championship. Obviously the German's history at Dortmund and friendship with Jürgen Klopp leads to 'heavy metal football' stylistic comparisons from all quarters. Put those to one side and there are some unexpected wrinkles to how his Huddersfield team functions.
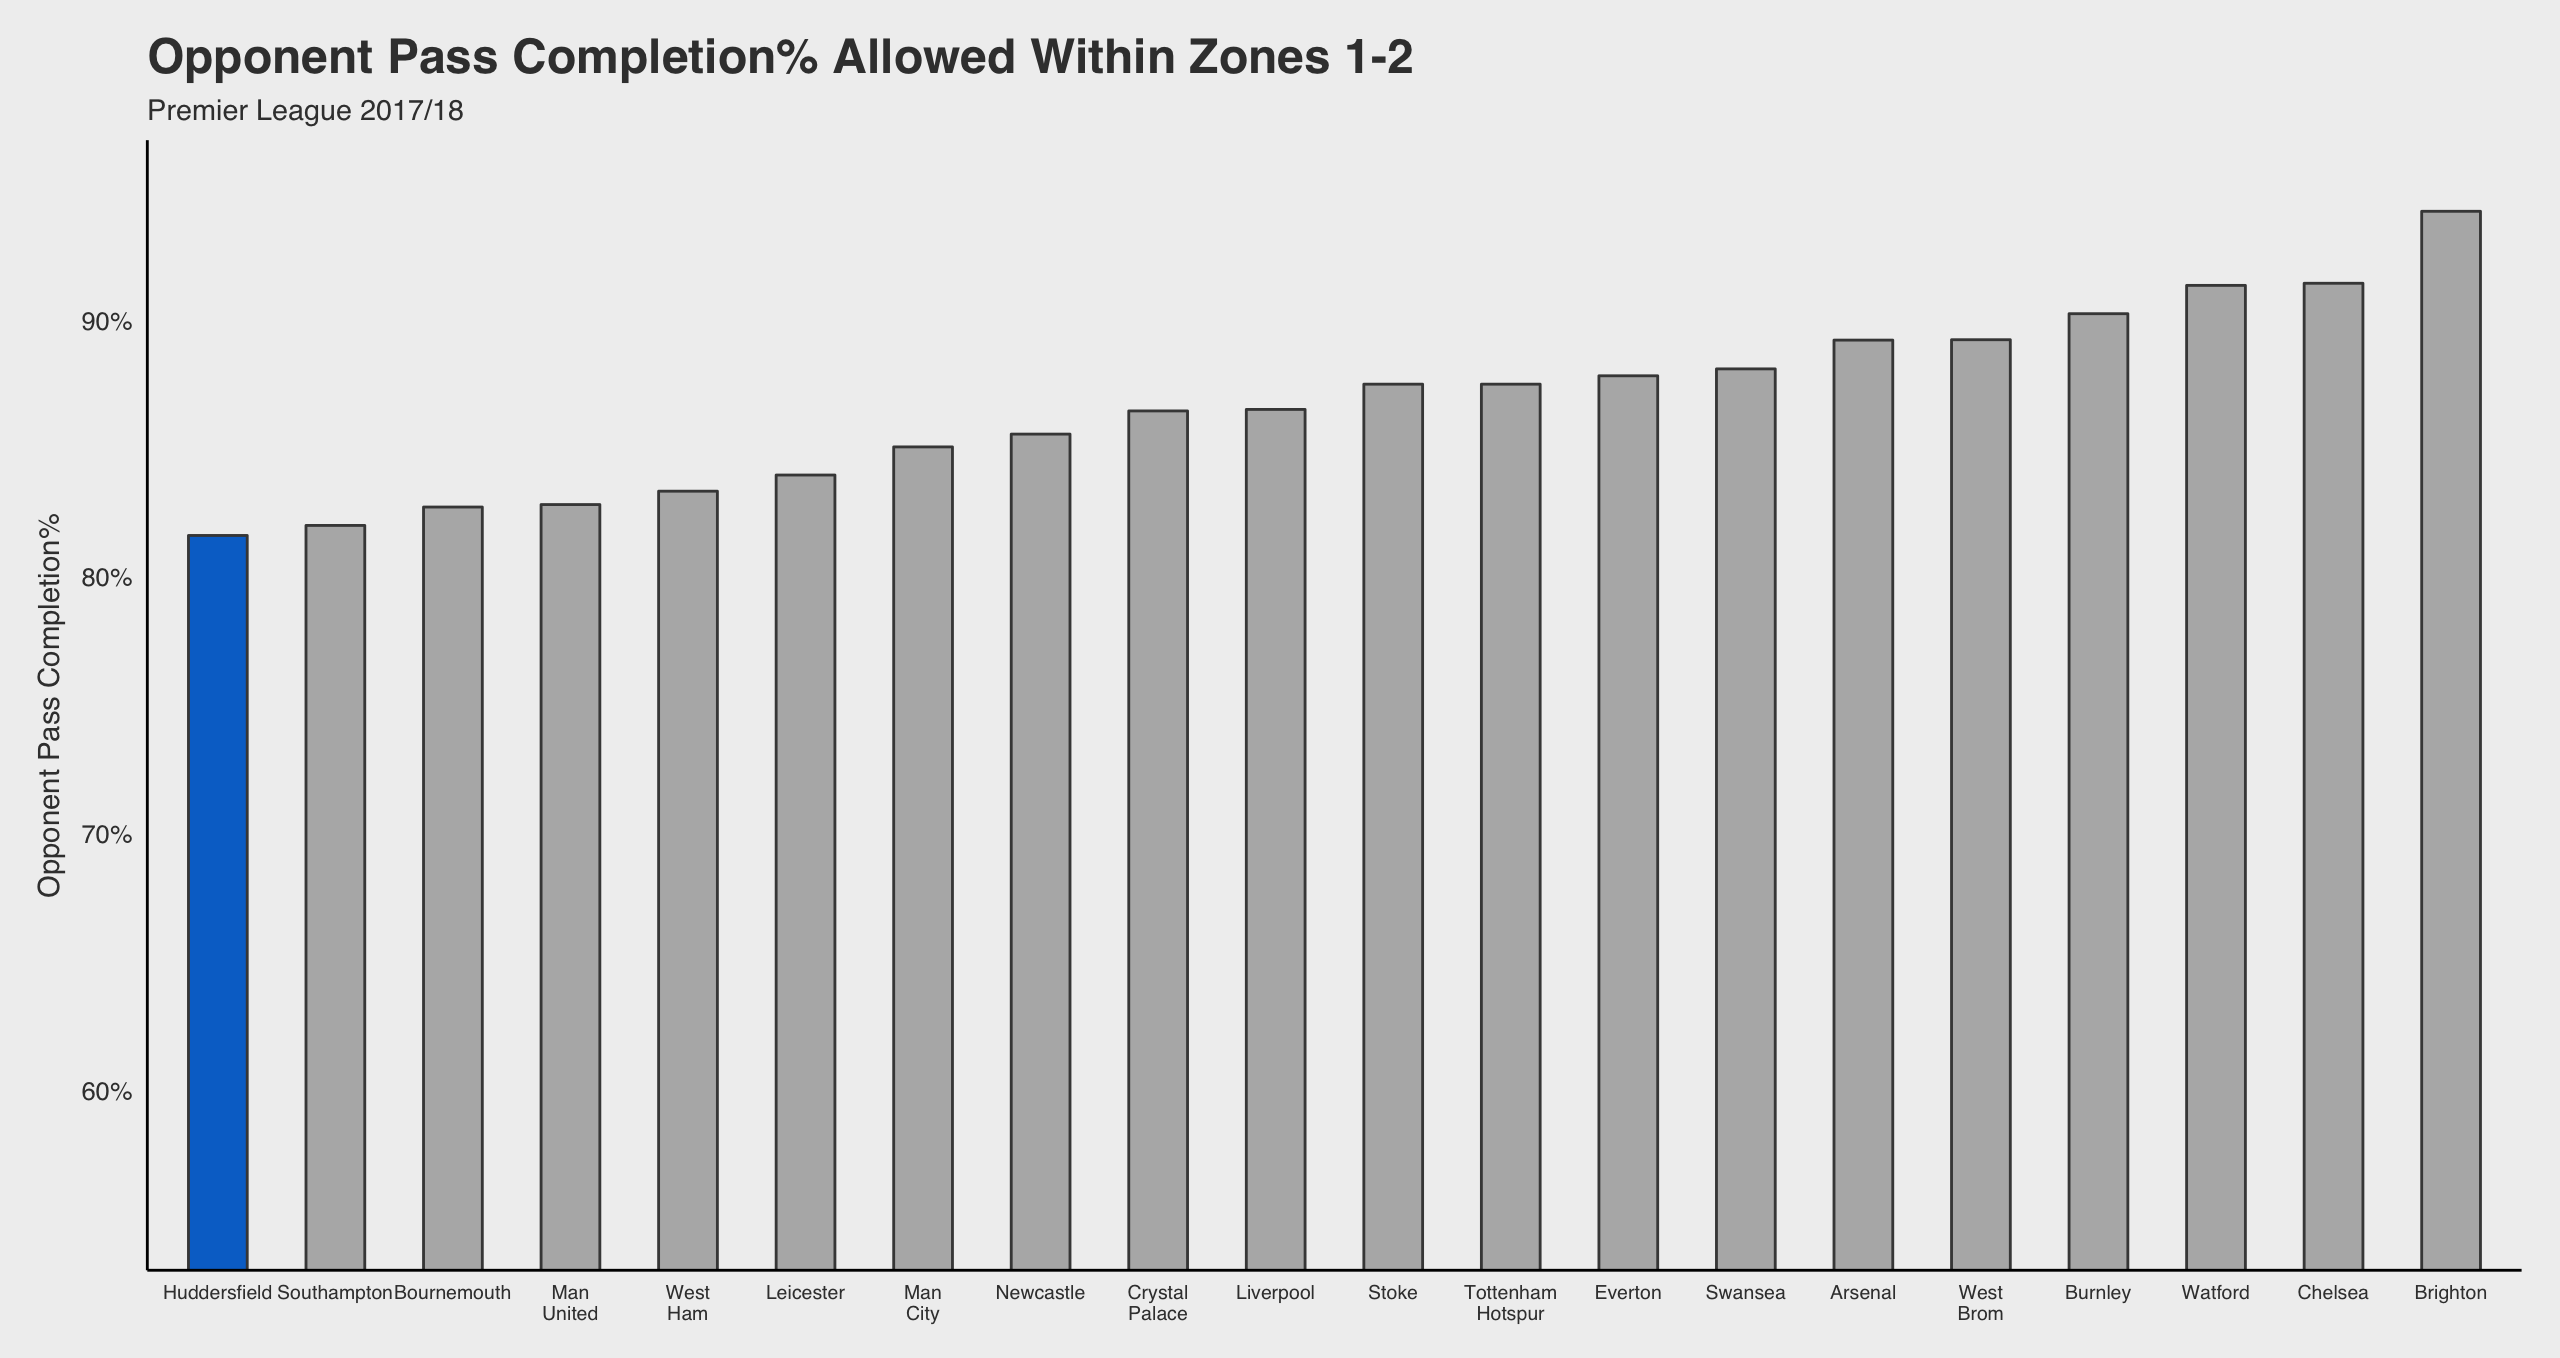
Through nine matches they're sitting much higher up the defensive numbers than many will have seen coming. Their tally of 10.7 shots conceded per game is 5th best in the league, with a similarly impressive ranking of 8th best on non-penalty expected goals conceded. What's really surprising though is the areas in which they're most disruptive. The press that many associate with Wagner is evident high up the pitch where they're preying on sideways and backwards passes around the opposition’s box.
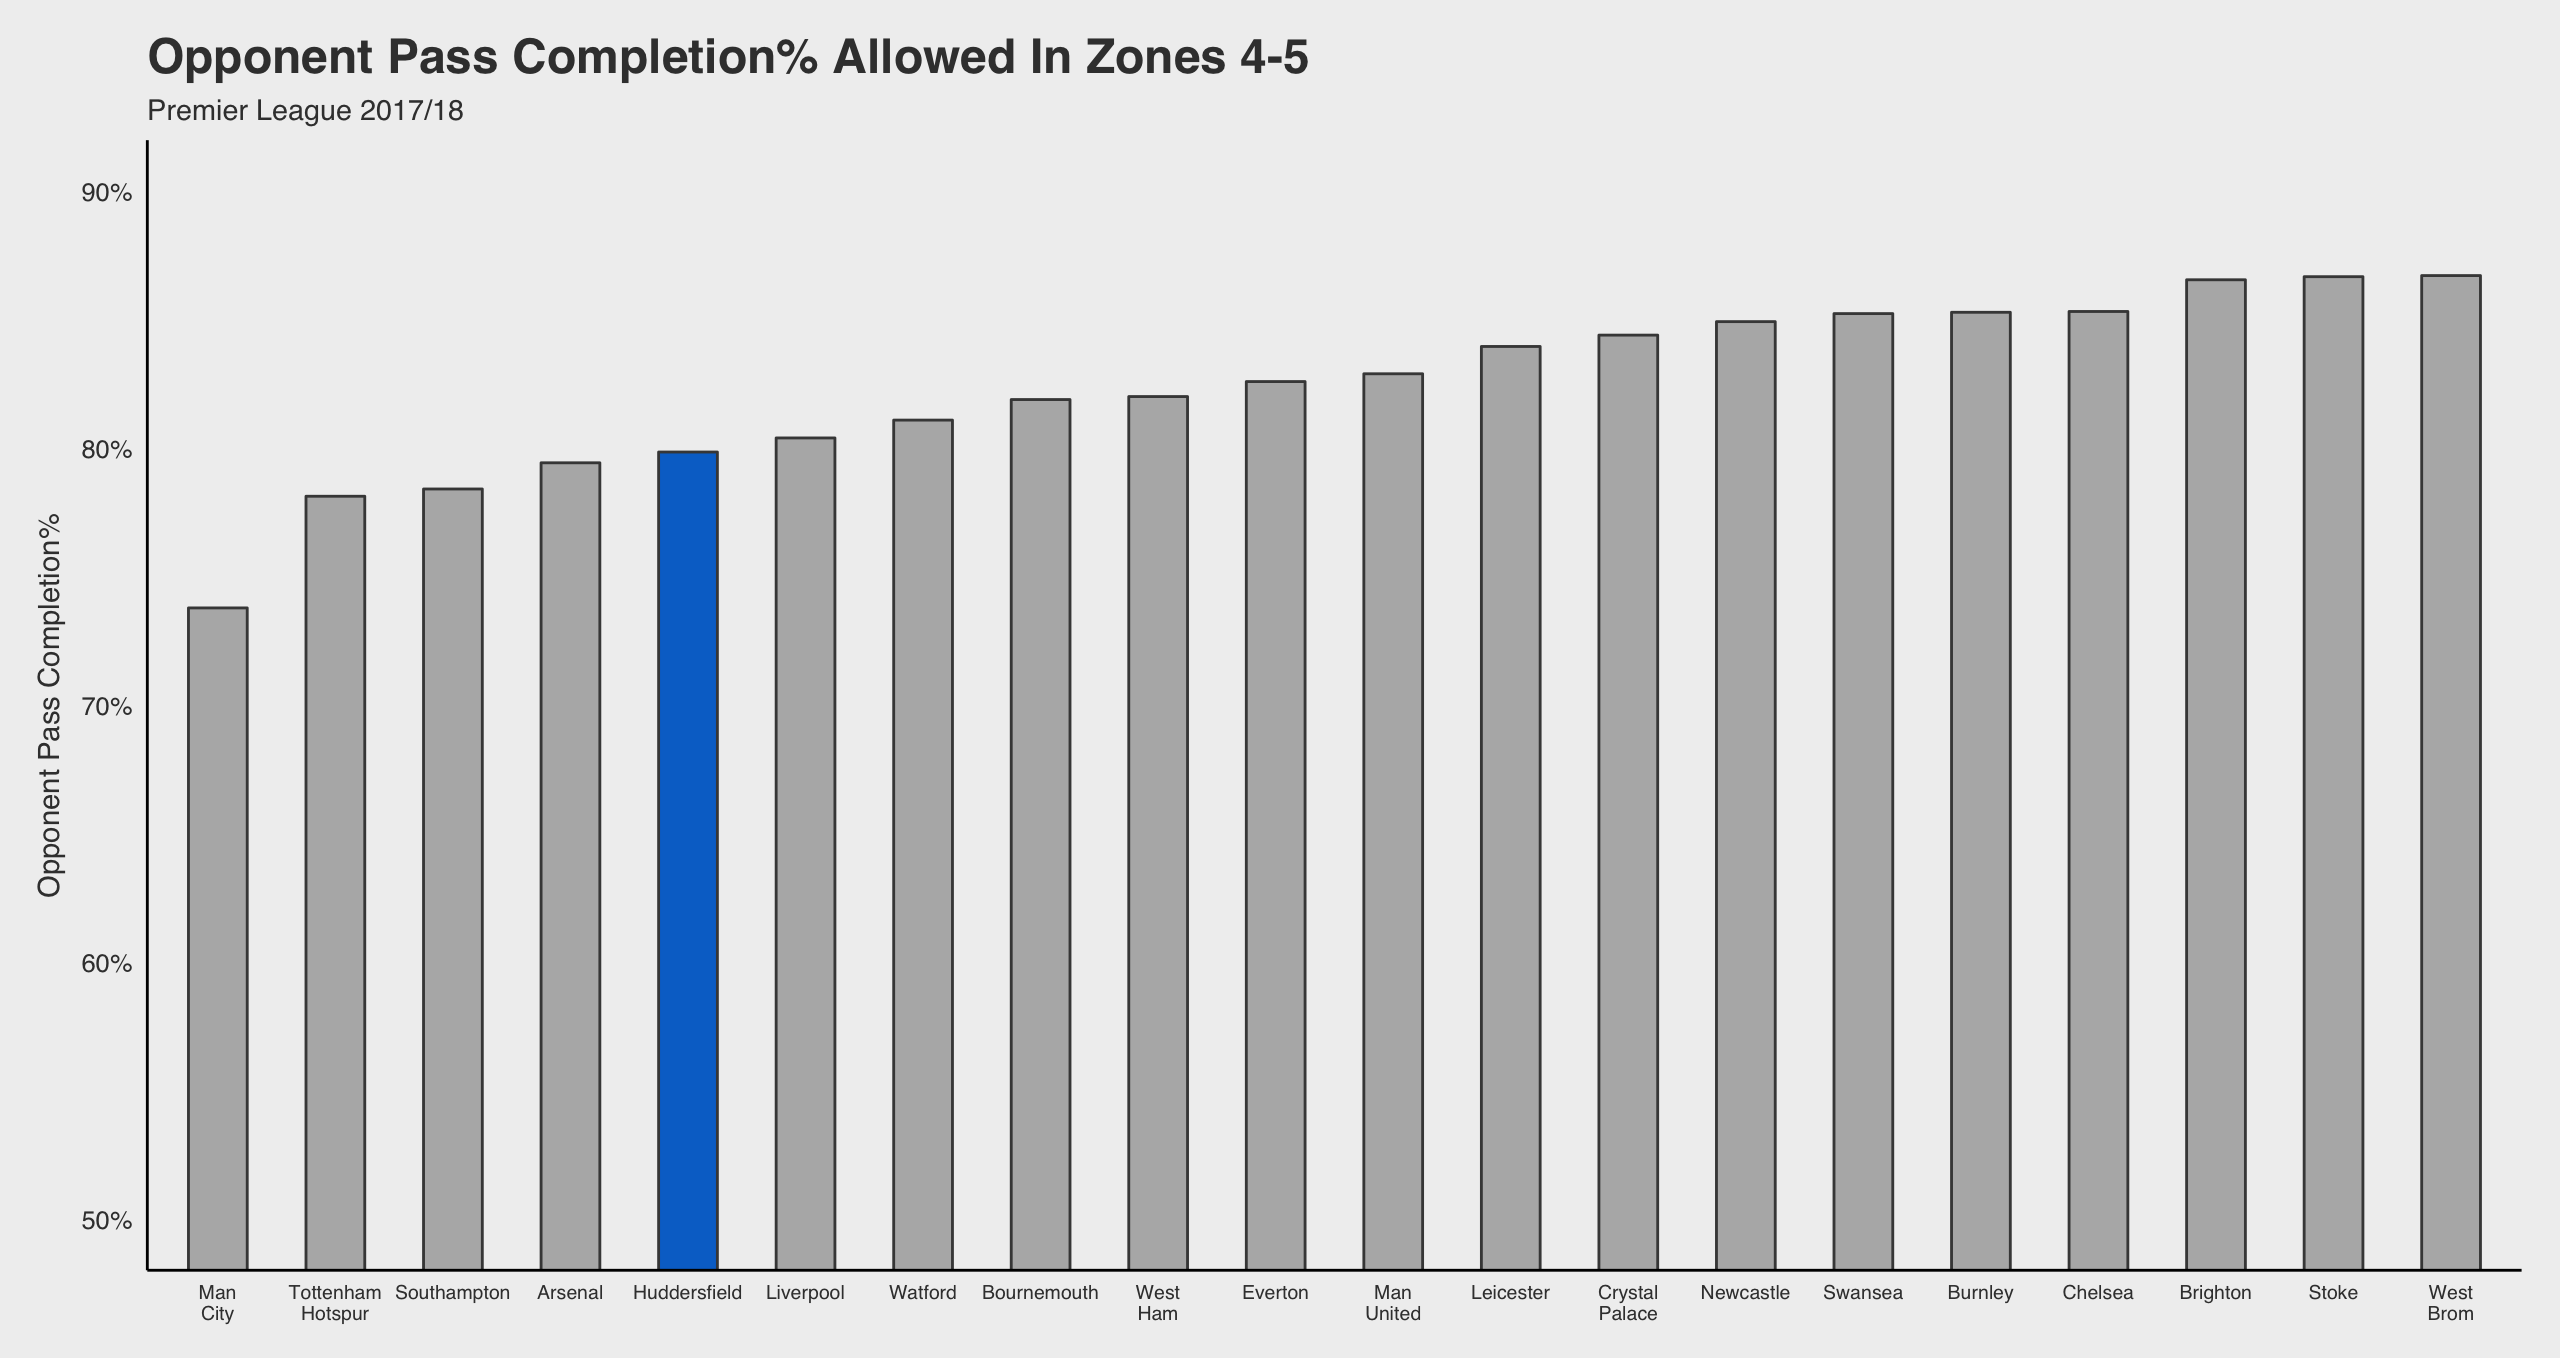
As the ball enters into midfield the press is apparent on passes starting in zones 4-5 but less so elsewhere. They don’t force the kinds of long balls from the opposition half that the traditional pressing teams do (allowing a little over 40% on those, one of the higher percentages in the league alongside deep block teams like Brighton and West Brom). Nor do they disrupt especially heavily in midfield zones. There are areas where they are on the lower end of percentage allowed (such as within zone 3 or 4) but not quite to the level their reputation suggests. Maybe Wagner has scaled it back a little bit with the step up in competition. Or this could just be early sample size fuzziness messing with things. Food for thought anyway.
One sure fire sign of the press is them being easy to play through in midfield areas. On passes starting in zones 3-4 and ending in central positions in Huddersfield’s half, they allow the most in the league. An indication that perhaps it can be relatively simple to transition against them or that the press can be broken.
The unexpected skill in Huddersfield’s repertoire is how stifling they are in a set defence closer towards their own goal. At this stage they're looking positively Mourinho-esque with how well they're keeping opponents out of the most important areas. Whether this can be sustained for an entire season remains to be seen but regardless it's clear they're one of the most well organised units around.
On the information we have so far it’s evident that Huddersfield have a relative versatility and solidity in the defensive phase of the game that would be good enough to stave off relegation in most instances. It’s on the other side of the ball where things get dicey.
They have thus far struggled massively with their attacking performances. They’re currently averaging 9.3 shots per game (the 4th lowest shots per game in the PL) with 48% of those coming outside the box (the 2nd highest such percentage). This is leading to them putting up the joint worst non-penalty expected goals per game numbers in the league. What’s the issue? Well, to quote the effervescent Paul Riley: They pass the ball around the back like an elite team. They pass the ball out from the back like a relegation team.
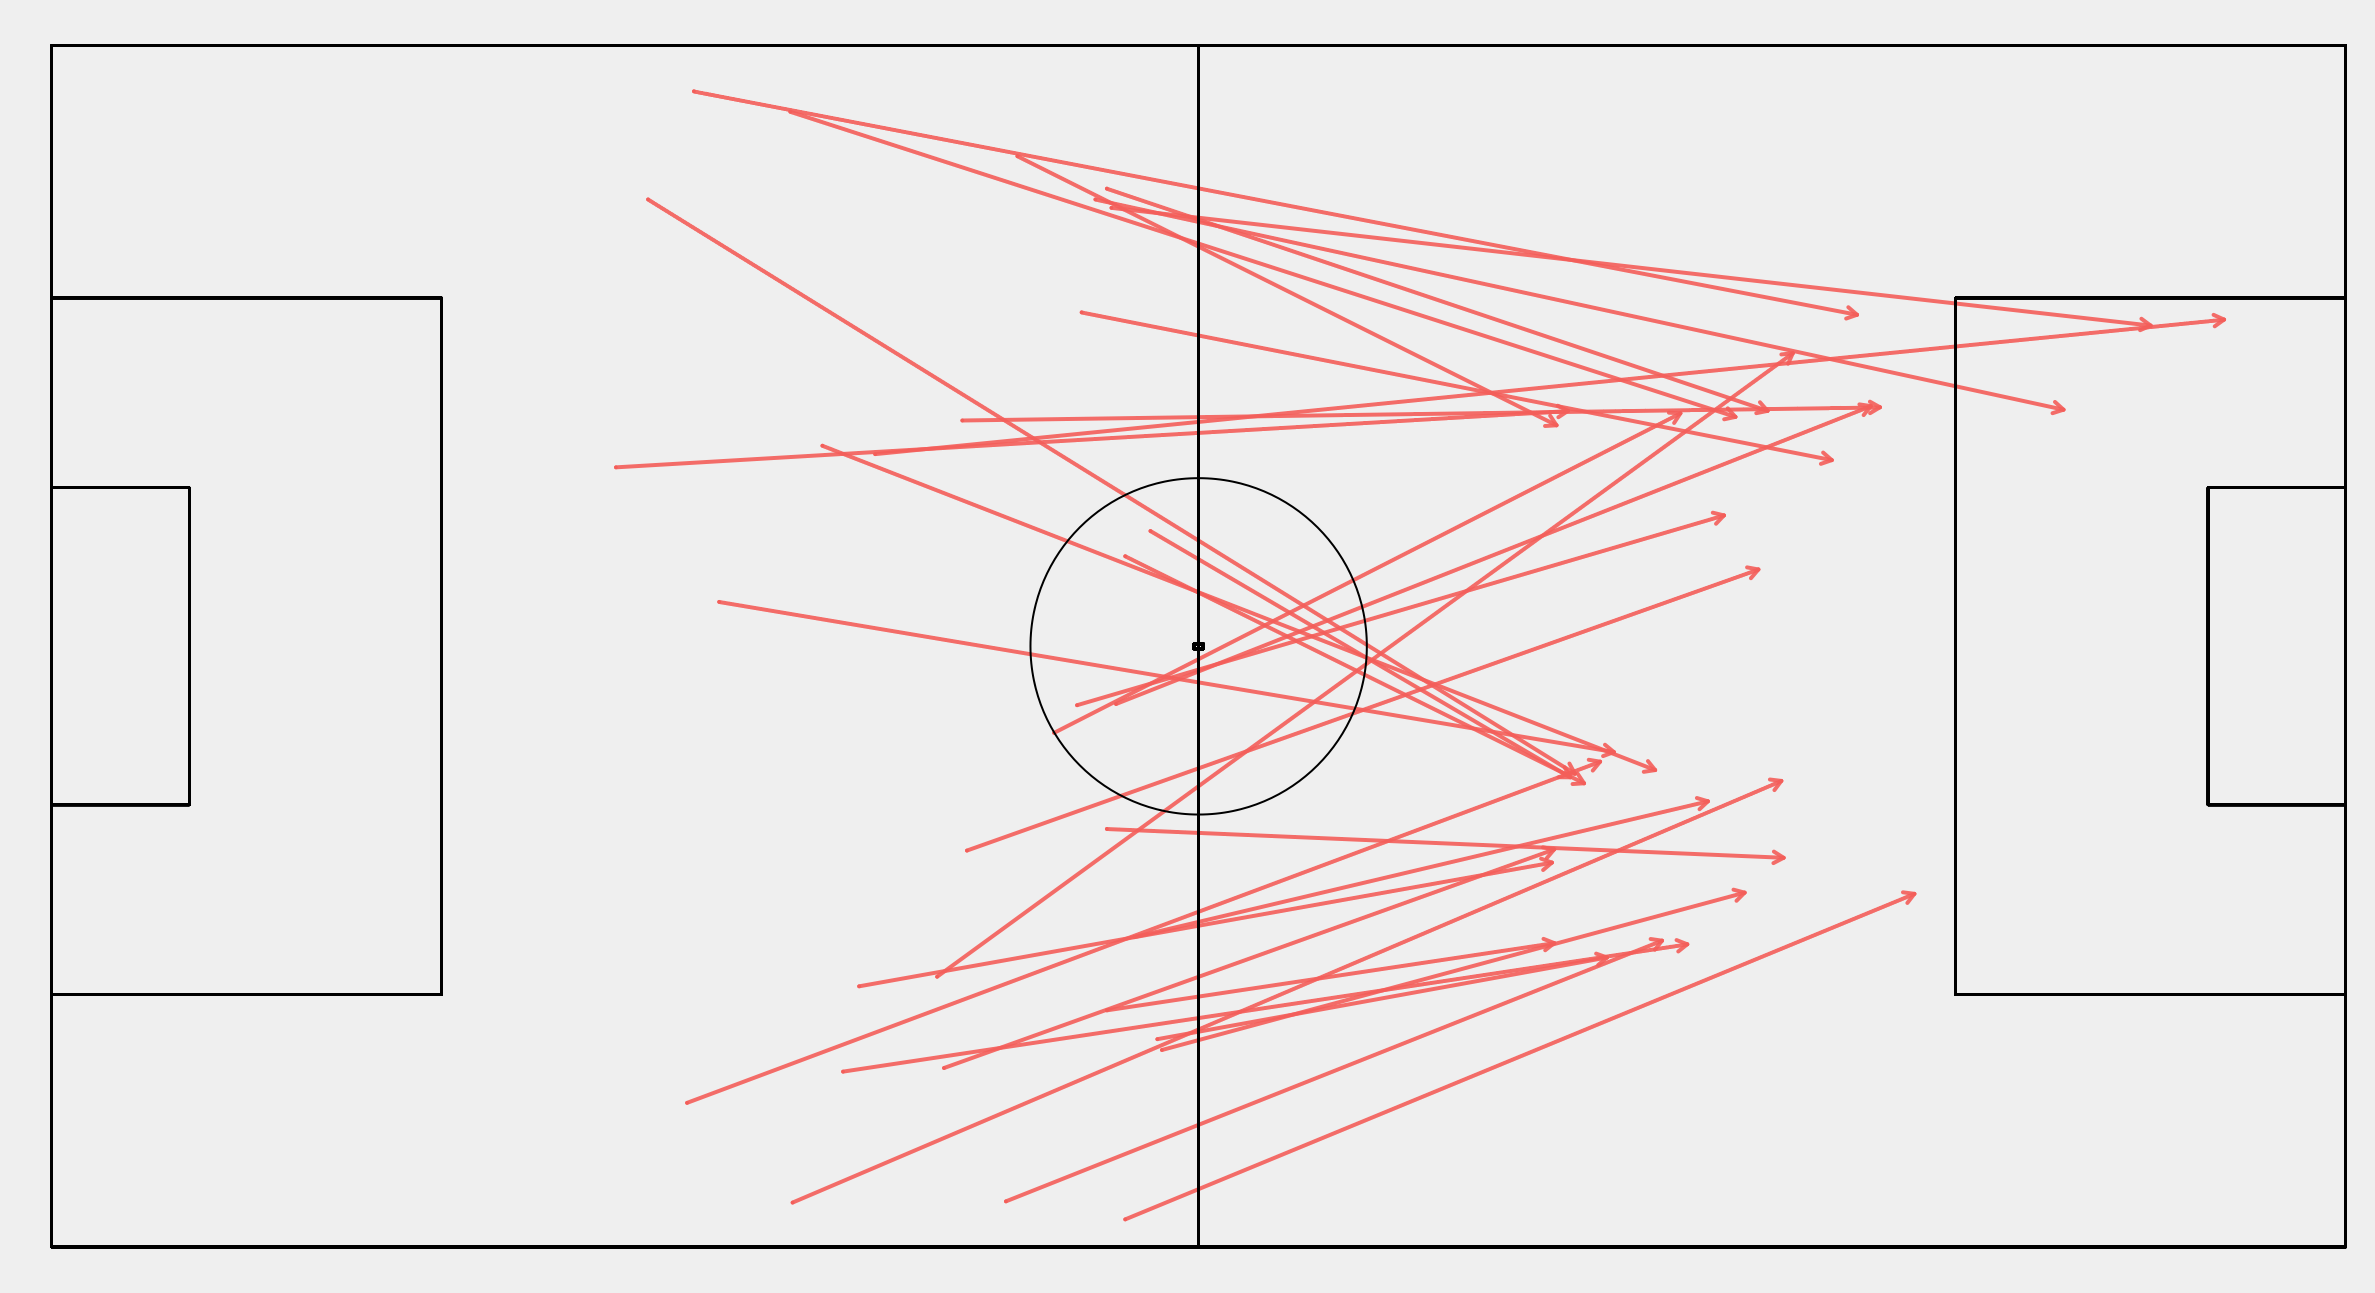
Going through zone by zone Huddersfield are always at or near the top in terms of completions that stay within the zone or go backwards, and are on the other end in terms of progressing forwards. Their best route is the longer option as goalkeeper Jonas Lössl actually ranks 3rd in the league for completions from zones 1-2 into the opposition half. When that doesn't work though the responsibility usually falls to Australian midfielder Aaron Mooy, who is responsible for the largest proportion of his team’s completions. He plays a lot of backwards passes but is also their best hope for progressing the ball. Mooy has the most completions forward from zone 4 to zones 5 & 6 on the team, 11 more than the next closest player, as well as the most completions from zone 5 to 6.
When they are actually able to get the ball in dangerous positions things break down even further. They’ve the fewest completions into the opposition box of any team in the league. Mooy again leads the team in this regard and seems like their best shot at generating opportunities but even he is having a tough go of it.
Chelsea
Last season's champions are off to a bit of a precarious start. After losing a total of 5 games in all of 2016/17 they've lost 3 of their first 9 already, including a fairly important one at home to Man City. Even in their wins - such as the 4-2 against Watford on Saturday - there are signs of issues.
Defensive stubbornness was the bedrock of their title success but after averaging 8.5 shots per game conceded last season that's gone up to 12.7 per game this season. The change can likely be traced to a couple key areas of pass disruption that were previously their bread and butter. Overall it's become much easier to get the ball into dangerous areas against Chelsea than it was previously.
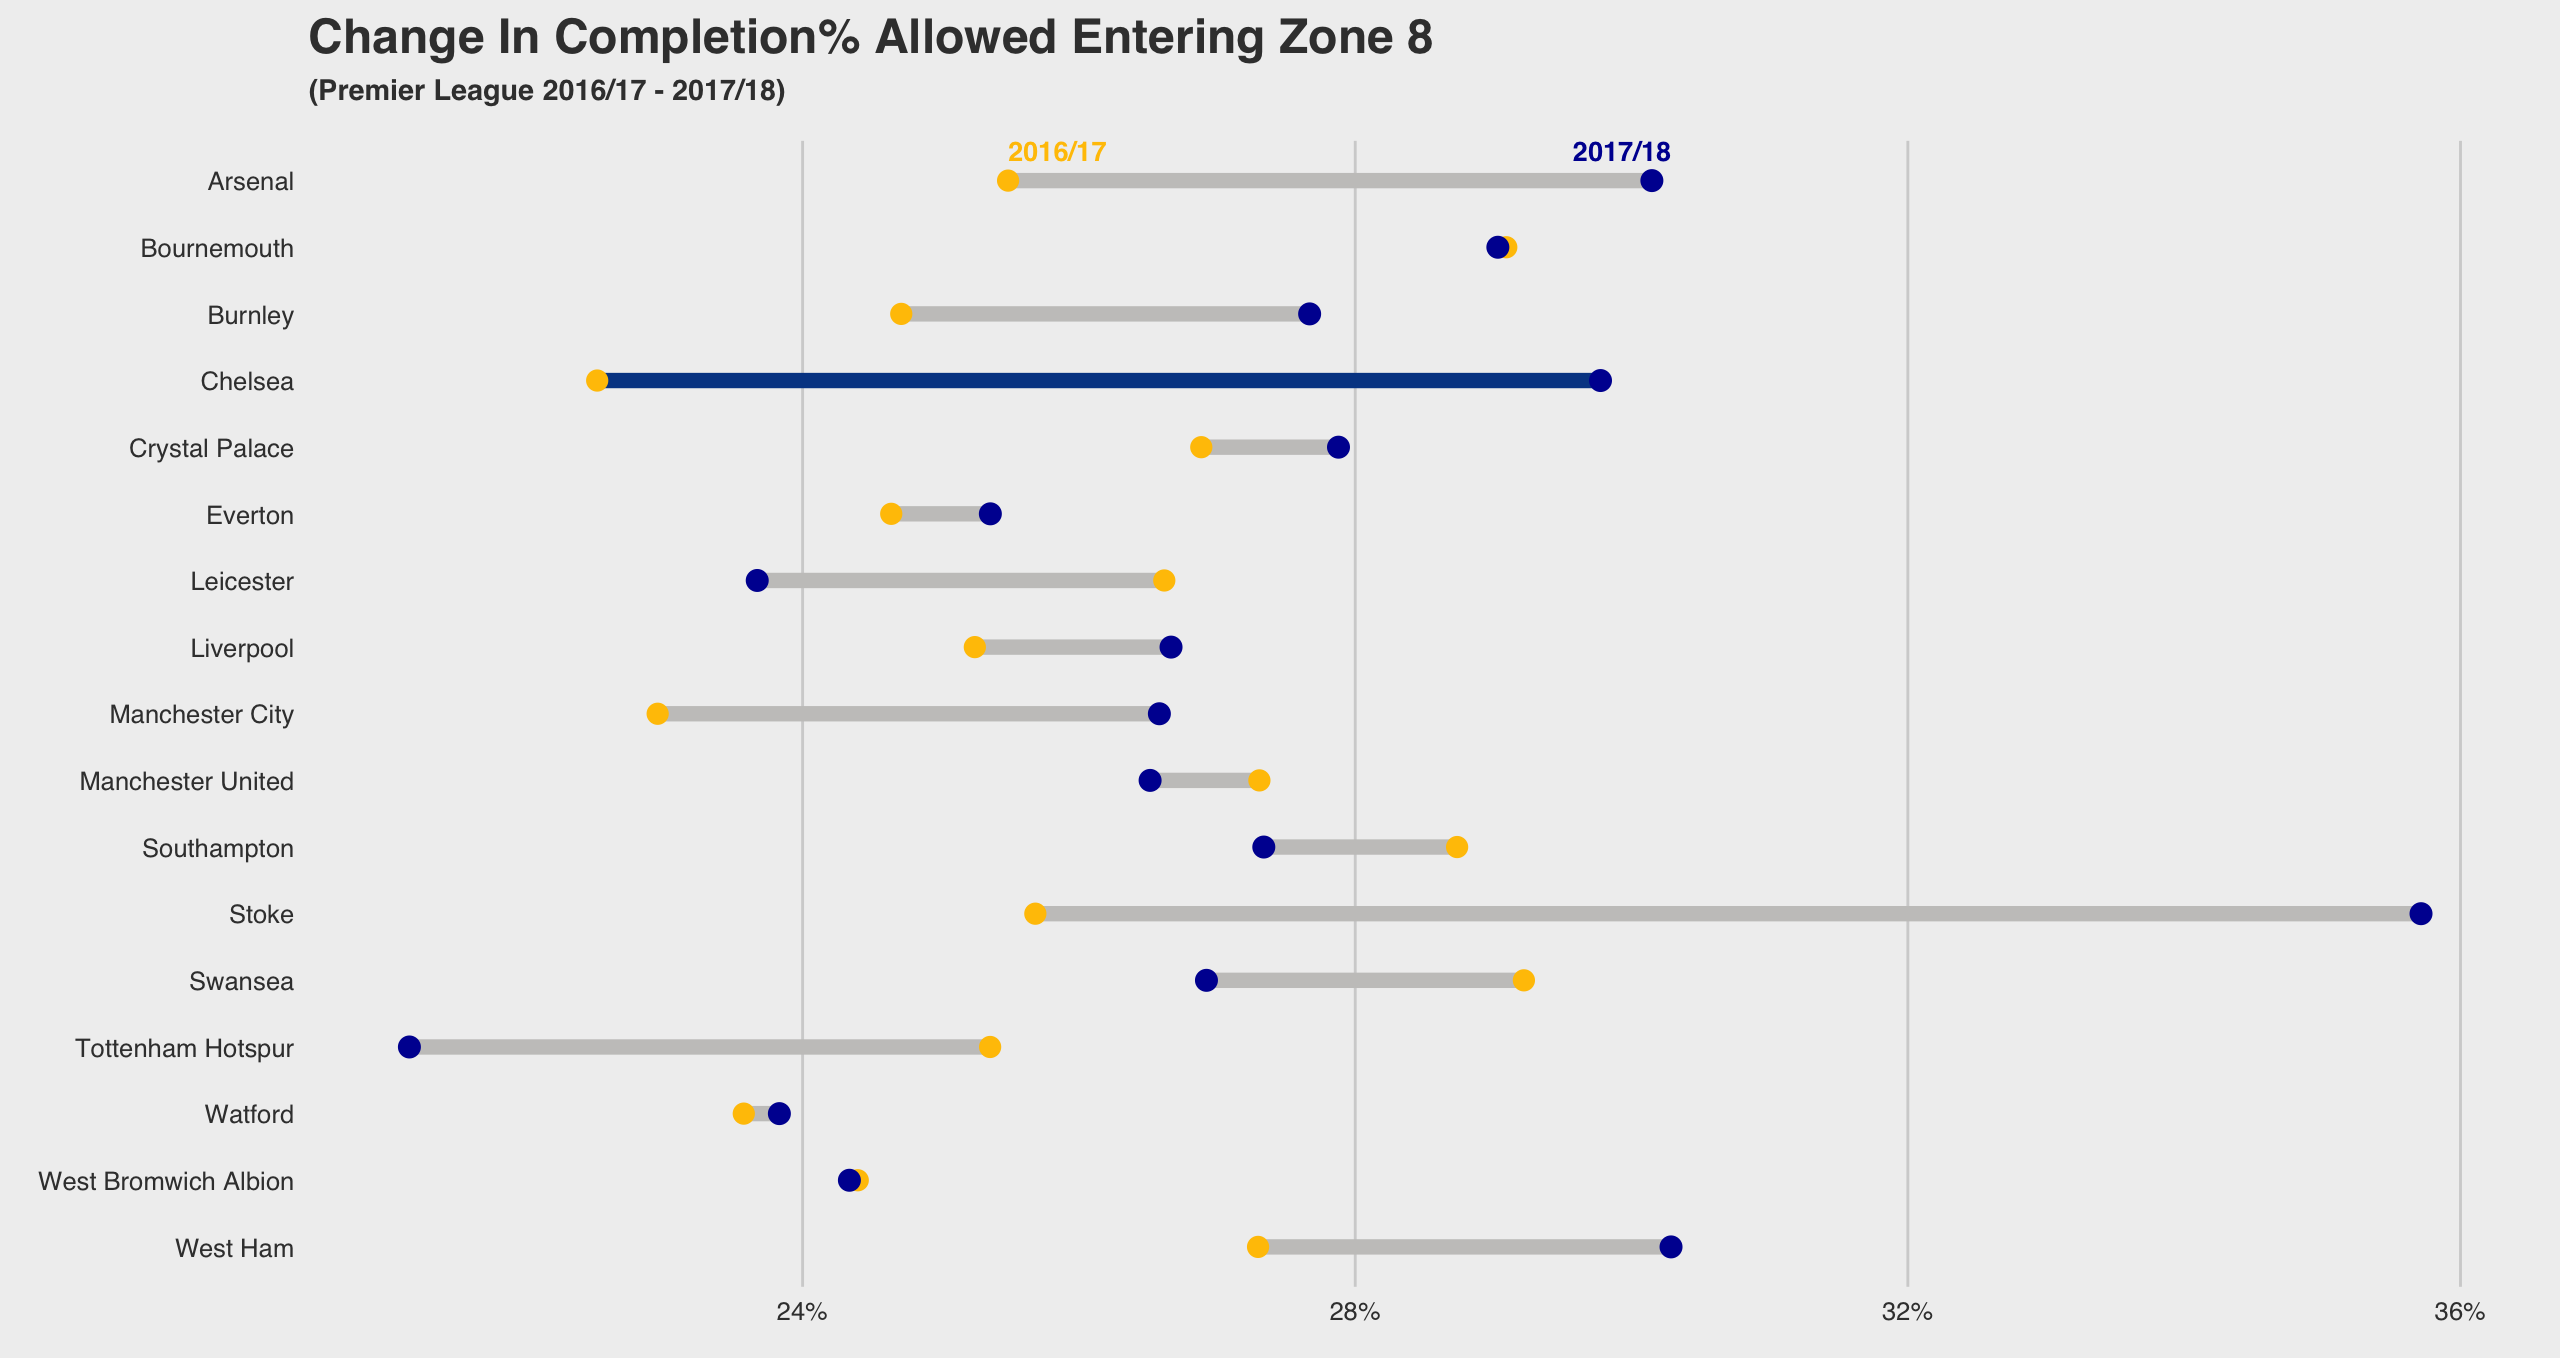
The number of completions they're allowing into their own box is also up (by an increase of around 4 per game, the 2nd highest increase in the league) and the same is true in zone 8. Chelsea's calling card last season was being steadfast in not allowing the opposition into the most high value areas. Now the underbelly is a bit softer than before. If you look at matches this season where teams allowed the most completions into Zone 8 Chelsea have several of the top 20 or so, alongside sides like Swansea and Crystal Palace. Against Watford last weekend they allowed 10, the joint 6th most any team has allowed this season. This iteration of Watford are a solid midtable side but at home that just isn't good enough.
On the attacking side things are also looking iffy. As you may have noticed in one of the charts above they're spending a whole lot of buildup time within their own half. When they do get out they're only midtable on completions into the opposition box (they were 4th last season). Their shots per game tally is down from 15.3 to 12.8 with a much higher percentage of them coming from outside the box (49%, the highest in the league!). Combine that with them not speeding ahead in the set piece goals standings - another key edge for them last season - and things are starting to look a little worrisome. This is a squad of very technically gifted players who've shown they can outperform attacking metrics in the past so it might all be work out anyway if they hit one of their customary hot streaks. If they don't it could be a real struggle.
Man City
Guardiola's blue machine has been so good so far this season that there's genuinely too much to praise. Rather than bombard you with more charts or passmaps or whathaveyou here are just some metrics and where they rank in them. They tell you all you need to know:
Shots (for) per game - 1st
Shots conceded per game - 1st (i.e they concede the fewest)
Non-penalty Expected Goals (for) per game - 1st (0.65 more than the next closest team. There are a couple teams that don't even average 0.65 per game.)
Non-penalty Expected Goals conceded per game - 1st
Passes completed into the opposition box - 1st (Kevin De Bruyne and David Silva are no.1 and 2 respectively on the equivalent players list)
Passes allowed into their own box - 1st (i.e they allow the fewest)
You get the picture. They're doing OK.
A Quick Bit On Coaching Style
Leicester sacked interim-turned-full time manager Craig Shakespeare last week and announced his replacement yesterday in the form of Claude Puel. Puel himself was sacked by Southampton last year after finishing 8th and reaching the League Cup final. Whether Puel is a good manager or whether they were right to sack Shakespeare is neither here nor there. What's so thought-provoking about this is the fit.
The Leicester sides of recent seasons and Puel's Southampton team are in different worlds, stylistically speaking. The former has been one of the most direct teams in the league and the latter were the polar opposite.
| Long Balls From Their Own Defensive Third |
Proportion of Overall Completions In Midfield
|
|
| Leicester 15/16 | 2nd most in PL | 3rd lowest |
| Leicester 16/17 | 3rd most in PL | 5th lowest |
| Southampton 16/17 | 3rd fewest in PL | 6th highest |
Does this mean the appointment is doomed from the start? No, not at all. Managers and players can change with time. But that's the thing: one of the two parties here will have to change and that will take time. If you've spent the last couple of years coaching or playing in a specific style you build up muscle memory and habits within it. Puel has shown some flexibility in the past, to his credit, but there will likely be growing pains regardless. Anyhoo, here's to good times ahead, hopefully.
__________________
As always if you have any questions you can DM me on twitter @EuanDewar. All the best!
![]()
Chelsea 2017/18 Season Preview
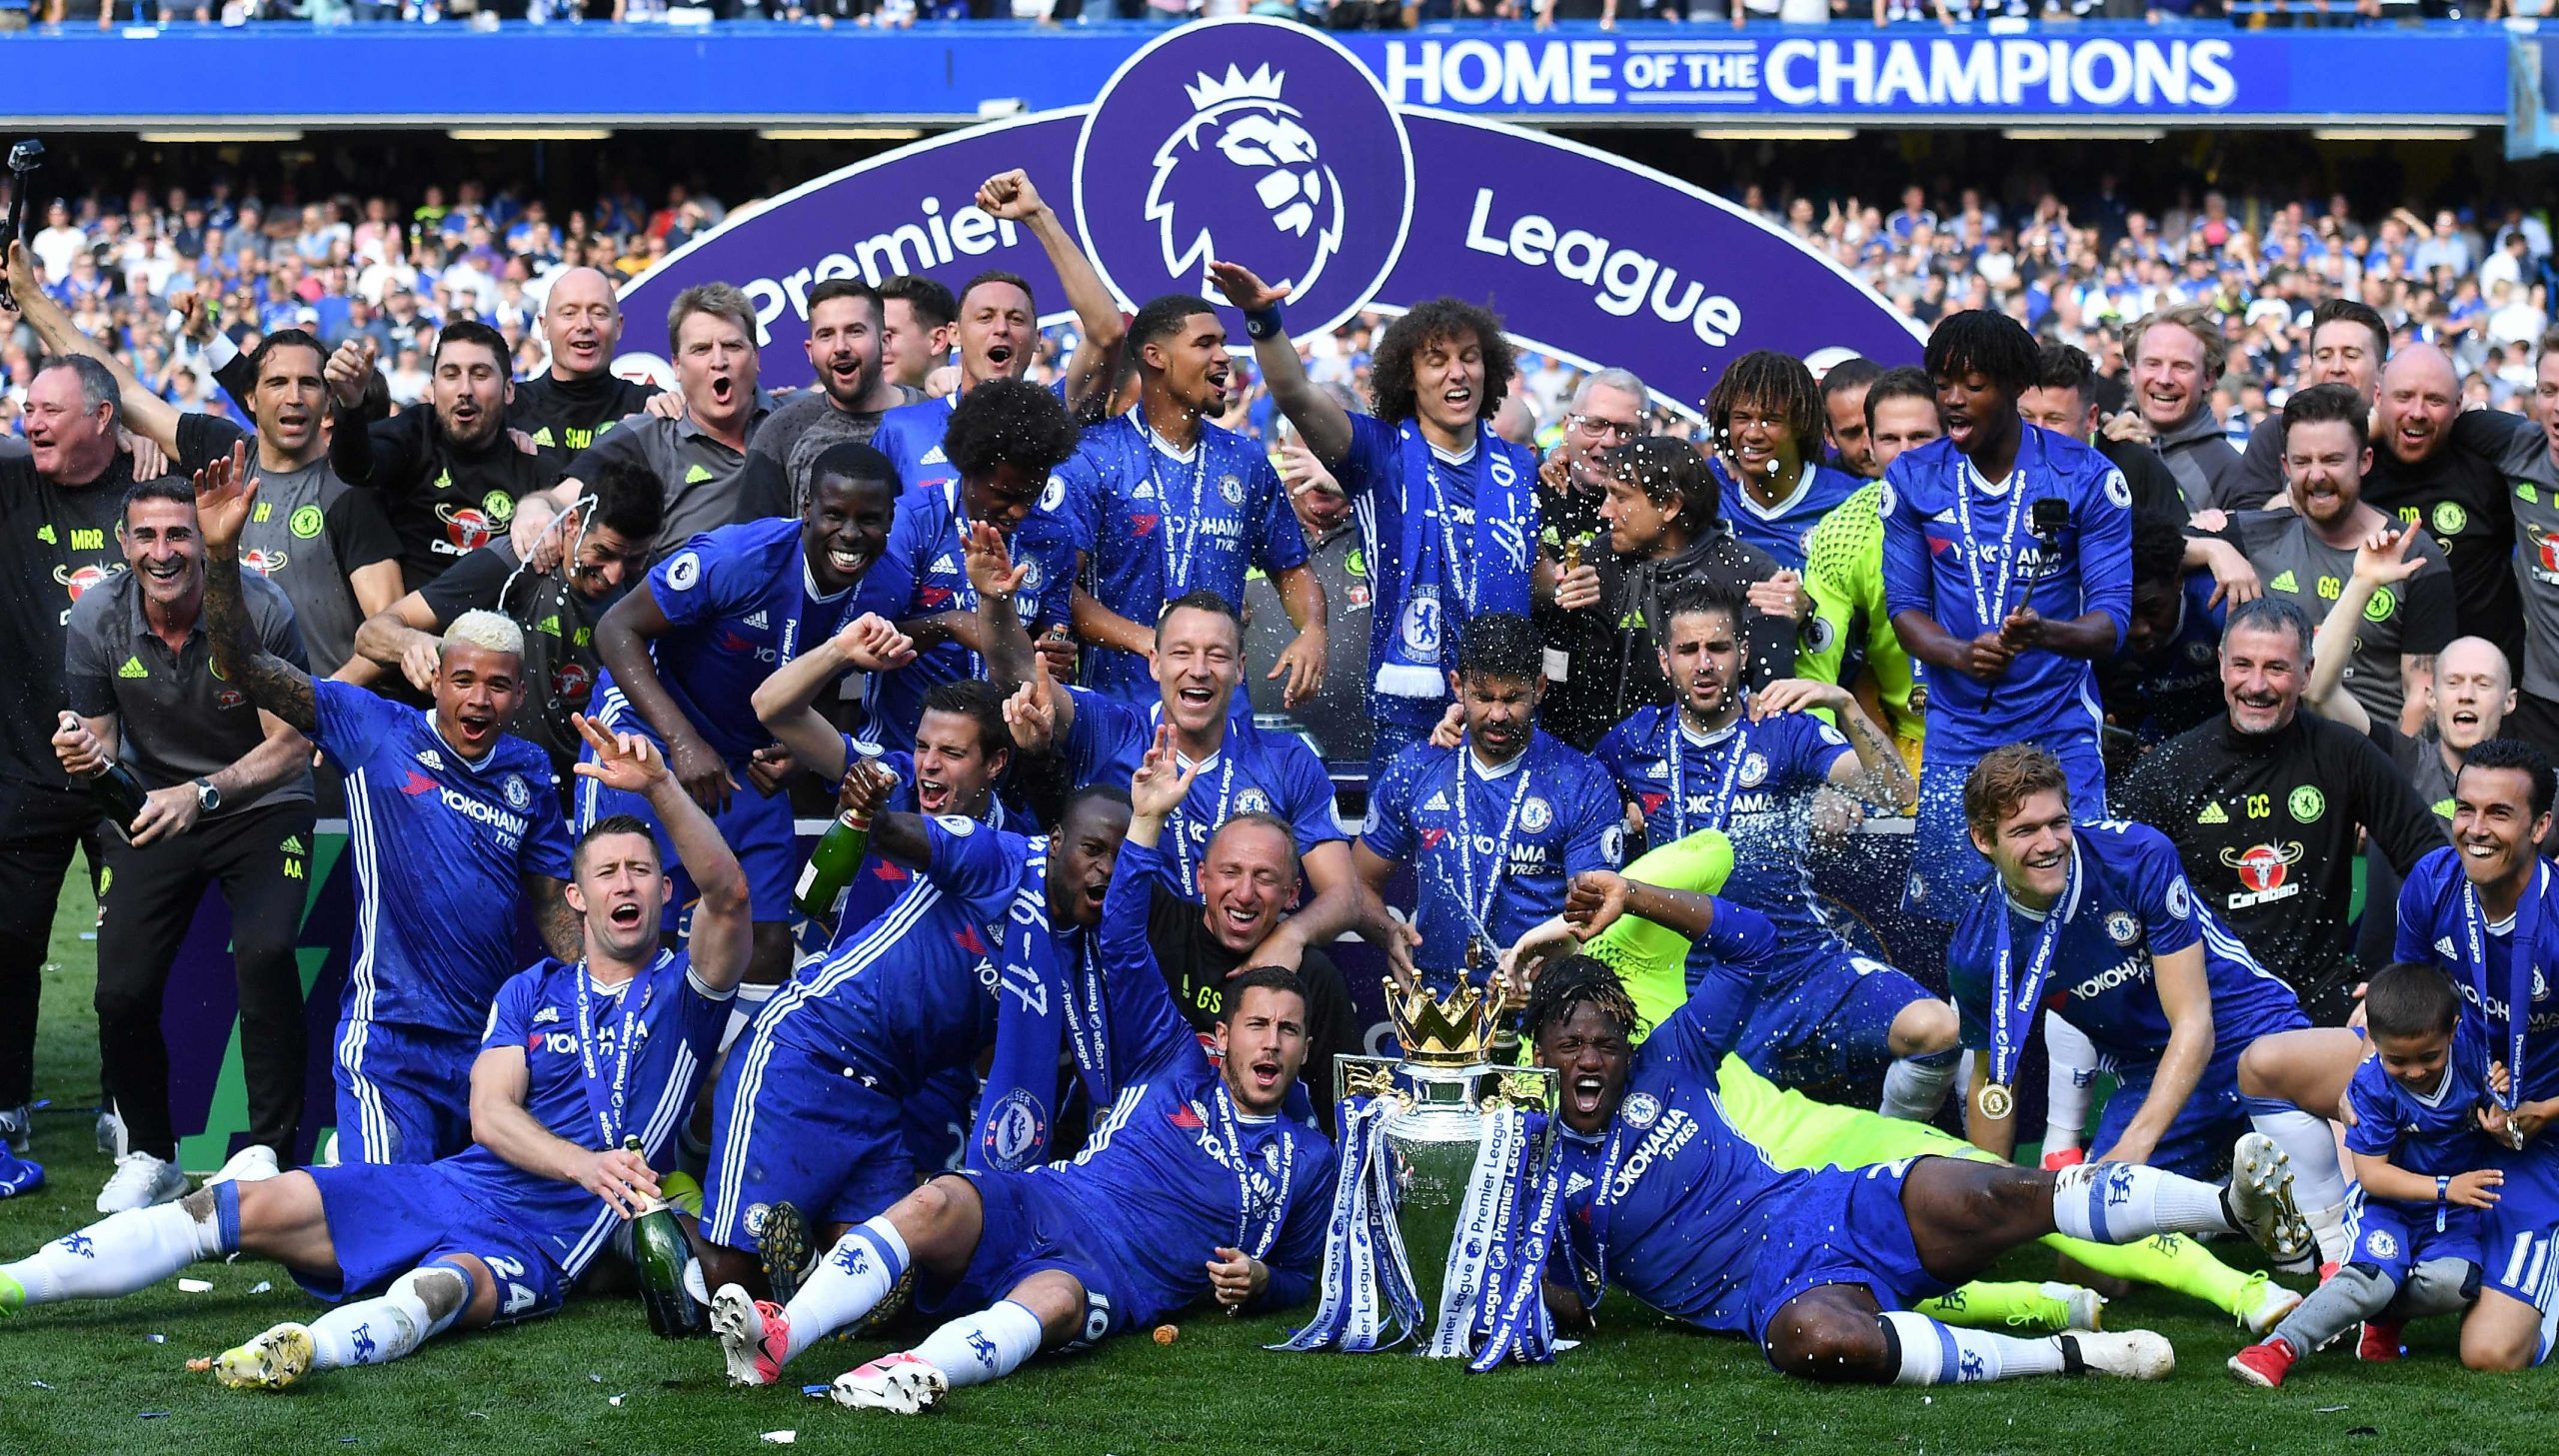
After the madness of the 2015/16 Premier League season it appears normal service has been resumed. We head into 17/18 with Chelsea as defending champions once again, having strode to the title without really much fuss at all in the end.
Antonio Conte arrived, dug through the rubble left behind by his Portuguese predecessor, and restored the club to a spot at the top of English football. The squad Conte inherited was - despite its defective state - obviously fantastic. Nonetheless he should be applauded for reassembling them into a team with no real holes in their game. The move to a 3-4-3 was inspired and the speed with which the players adapted to it a testament to Conte's management. As was bringing Victor Moses out of the wilderness and somehow turning him into Cafu.
Any measure you want to look at, they ranked highly. The bedrock of their success being the killer combo of conceding a low amount of shots (8.5 per game, 3rd fewest in the league) + low quality of those shots. Between the 11th of December and the 25th of February they had a run where they conceded fewer than 10 shots in every match - 12 matches in total. They also made superb use of set pieces, scoring 22 goals from them, 9 goals more than any other top-6 team. Back to front they were just solid. Their defensive numbers might have been even better had they not spent the first few matches testing other formations.
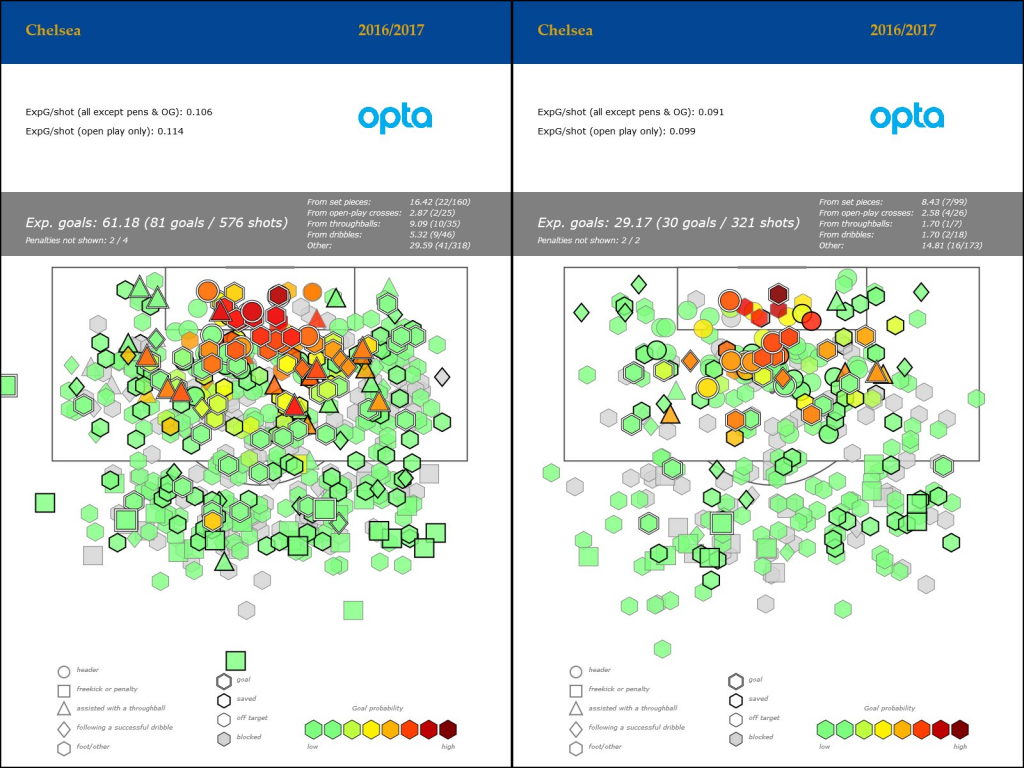
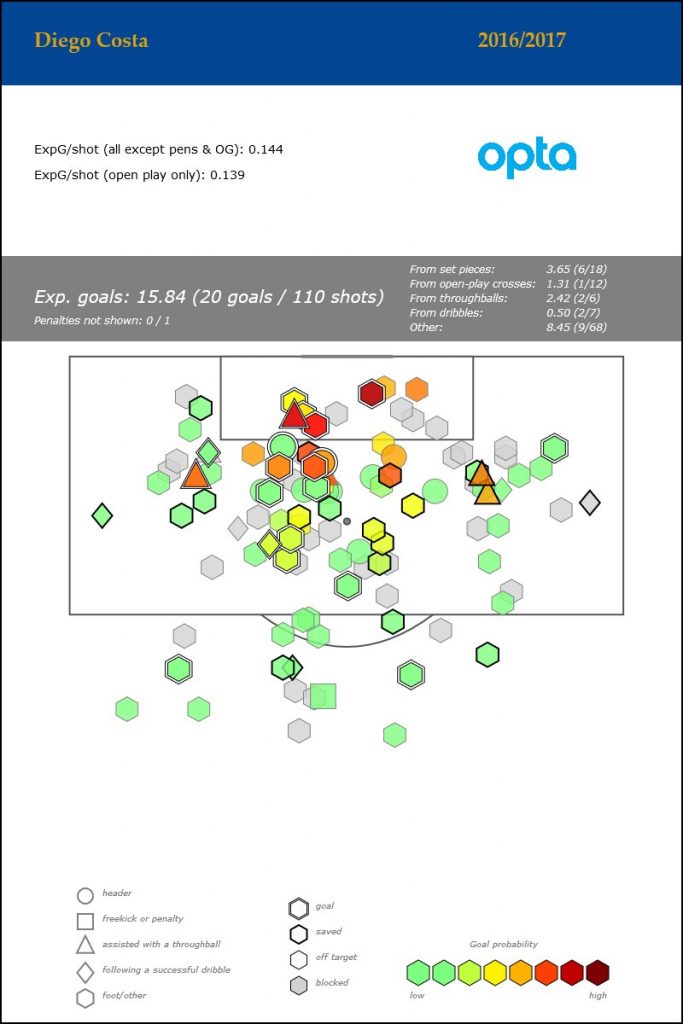
With that said, they were also fortunate in some aspects. They overshot their expected goals by a wide margin, racking up 81 non-penalty goals which was about 20 more than expected. Diego Costa was the main culprit in this, starting the season off with a ridiculously hot 14 goals in 19 matches. He cooled off, scoring just 6 goals in the final half of the season.
The rest of the team didn’t, including the highest conversion rate on shots from outside the box in the league (leading to 12 goals). As James Yorke has noted before this hot scoring was a part of them spending an unusually high amount of their game time in a winning position, never having to really chase a lead. This is also an ingredient that is common amongst title-winners of years gone by. With the margins at the very top of the league being so thin, these sorts of positive variance factors can help separate a team from the pack.
In reality though, all of this variance talk is a footnote. They were an excellent team with negligible flaws. As a result the objective for the upcoming seasons is clear: consolidate where they are and prepare for the added weight of the extra Champions League matches. They used the joint-2nd fewest players in the league last season and were mostly unfettered by injury. The squad needs fattening up.
Transfers
After three productive years Diego Costa is on the out and to replace him the club has brought in Real Madrid’s Álvaro Morata, for around £58m + vague add-ons. Morata’s production in previous seasons hints towards an impressive talent, yet it remains an opaque sample. At 24-years-old he’s never played over 1500 minutes in a league season and has never been the first choice striker on a team. 2016/17 La Liga was the first time in his career where his number of starts trumped his appearances off the bench, racking up a mind-boggling 15 goals and 4 assists in 1334 minutes.
Despite the small sample size his underlying numbers in that time are great and point to a fairly diverse range of skills. He attempted 21 headed shots (converting 6 of them), more than Costa has attempted in the last two seasons combined, and showed a penchant for creating decent shots off of dribbles, all with a skew towards the left side of the box - a preference that Costa shared. The overall shot selection is solid too with a very nice cluster (mostly headers) right in the middle of the box.
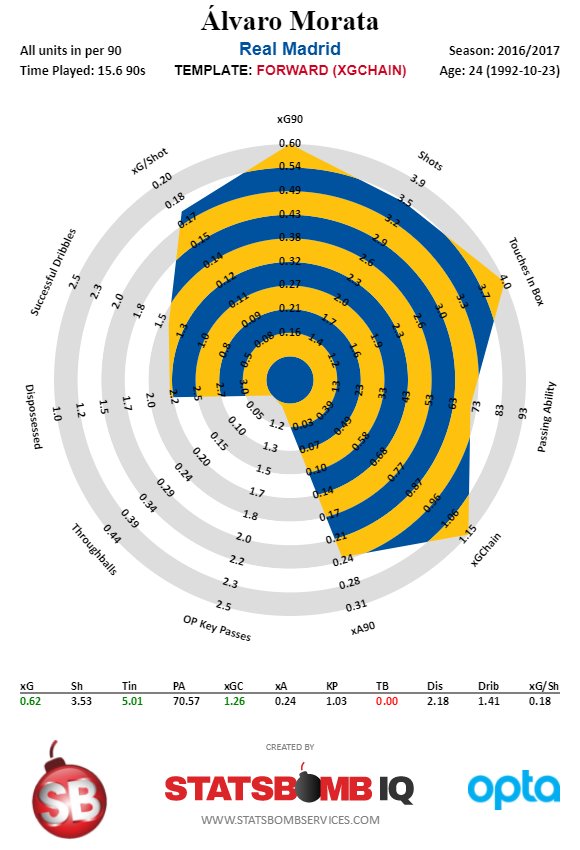
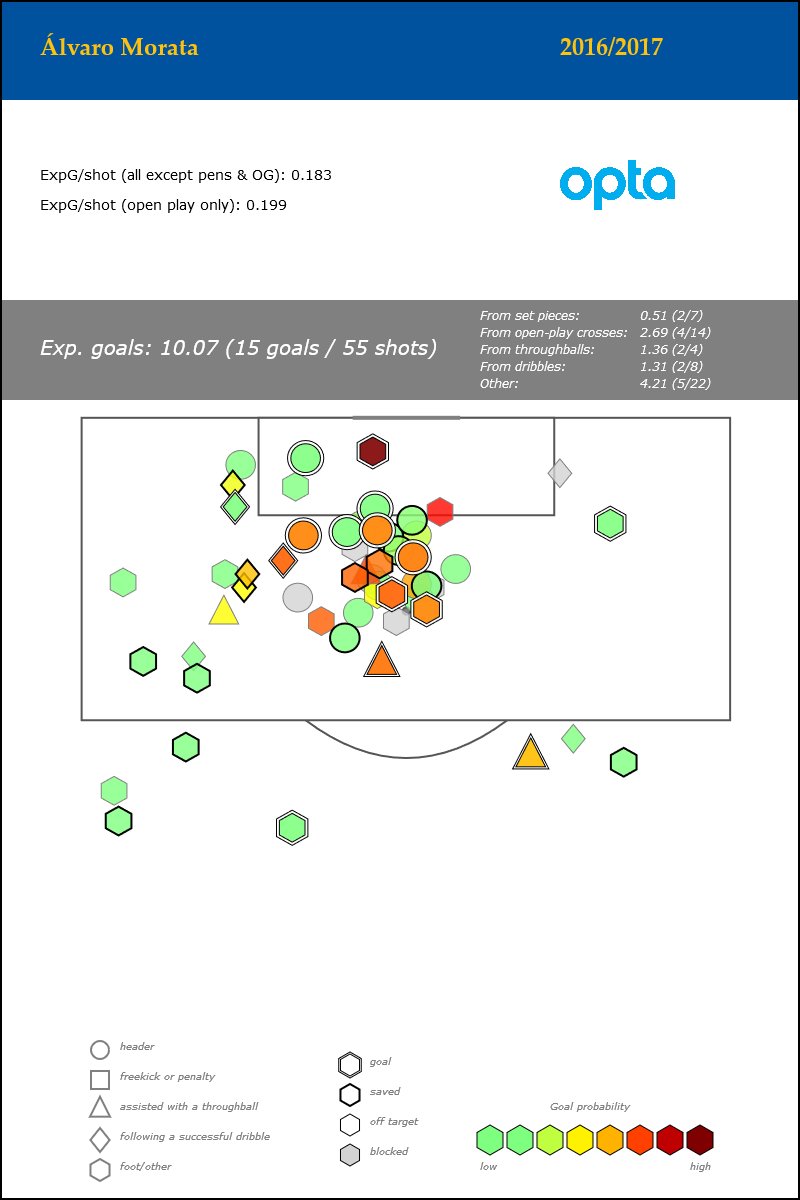
Looking back on his previous seasons, both in Madrid and in a similar role for Juventus, he’s never had a problem getting shots off. Not once has he dropped below 3 shots per90 in a league season, which includes as of late lopping off the long-rangers he once had a taste for. In fact, he’s never really had a problem with anything.
During limited minutes, season after season, he's repeatedly done everything that's been asked of him in terms of goalscoring and being a focal point at the top of European football. The question hanging over all of this though is how he’ll translate to a greater workload on a different team. Chelsea obviously have an elite set of talent but Real Madrid’s attacking firepower is as good as it gets and playing with them is likely to maximise a player's output. How much of his splendid 16-17 is down to situation? How much of it is small sample size theatre? Will Chelsea (having played the joint-third fewest crosses per game in the league last season) tailor their attack to his strengths, or will he fit into theirs?
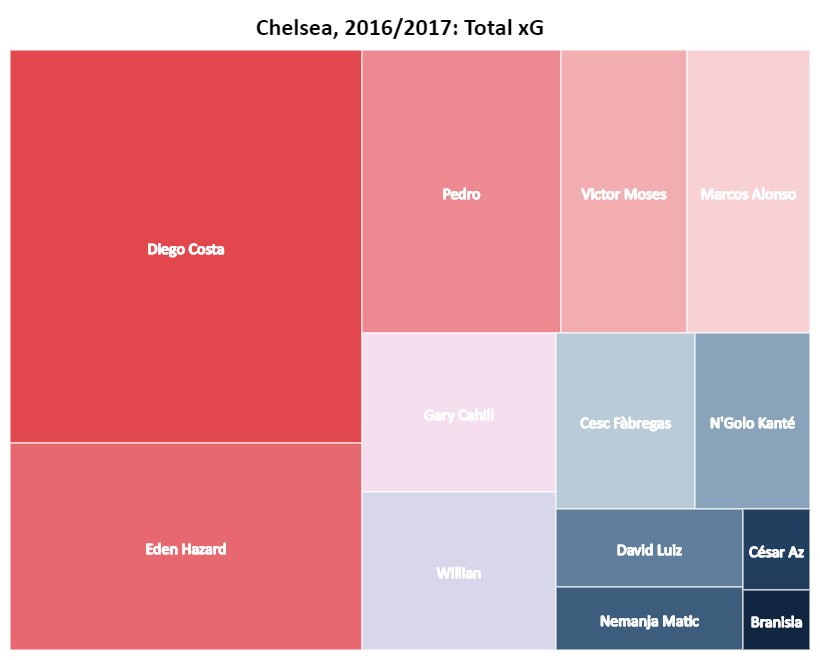
Morata is young, clearly very talented, carries no injury concerns and has a malleable enough skillset. It’s a smart gamble yet it remains a risk. One you might not expect a club in Chelsea's position to take. Brought in to bolster the midfield is 22-year-old Tiemoué Bakayoko, who spent last season at the heart of that Monaco side.
What immediately jumps out is his high number of dribbles, completing 2.16 out of a total 3.4 dribbles attempted per90 in Ligue 1 last season. That’s an unusually high number for a nominal defensive midfielder. More than both N'Golo Kanté and Nemanja Matić combined completed last season. It’s indicative of how furious an attack Monaco were that a DM was tearing through the middle of the pitch like a winger.
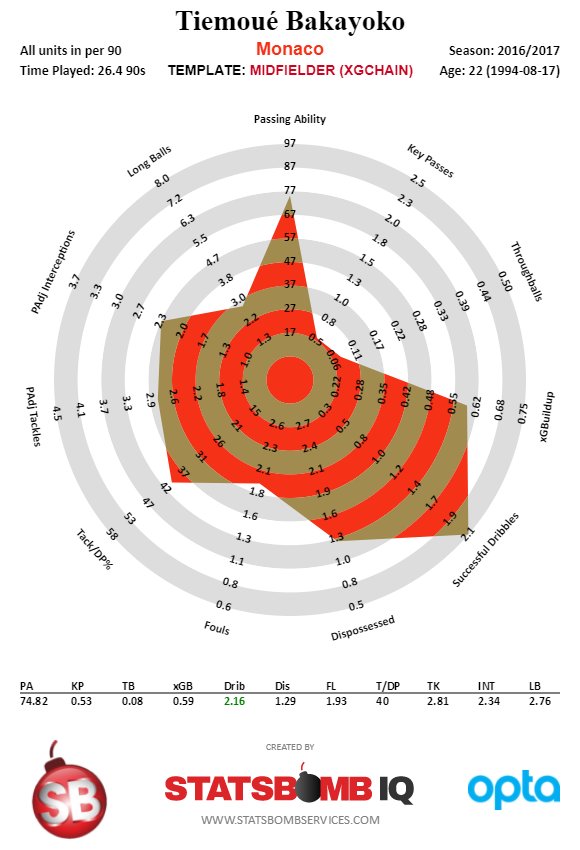
One suspects that the purpose of signing Bakayoko is twofold: to add a different option in terms of midfield ball progression and to lighten Kanté's load somewhat. While Matić’s creative contribution has stayed the same with time, his defensive activity has lowered. In the 14/15 title-winning season the Serb's defensive numbers were actually pretty Kanté-esque: a split of 2.35 Padj interceptions per90, 4.07 Padj Tackles per90 and a 43% Tackle/Dribbled past %. In 16/17 this changed to 1.70/1.89/40%. Is this age or is it the effect of playing next to Kanté? Or both?
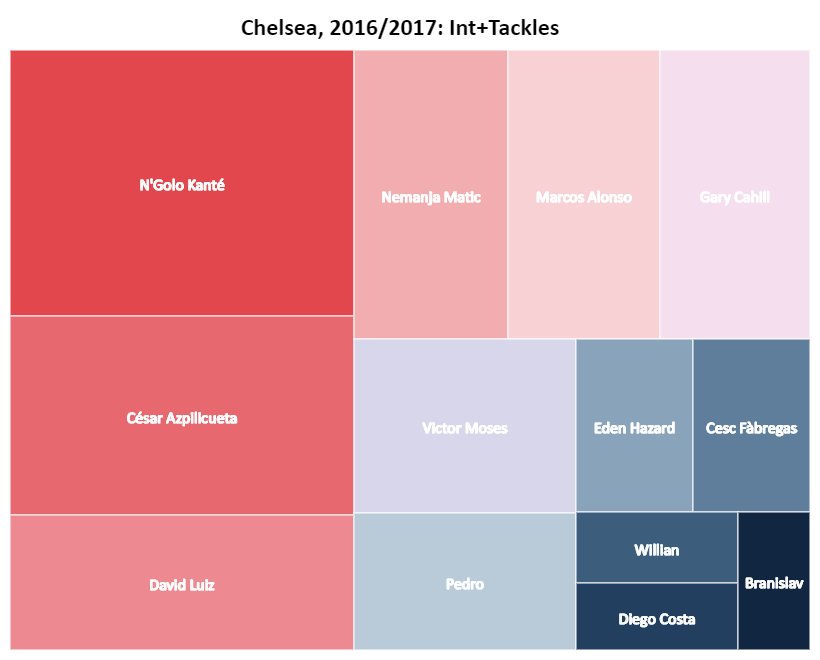
Regardless of the answer the end result is that Kanté ends up doing a lot of work. He’s sustained his energy for two full seasons now but with the addition of a Champions League campaign the workload will be greater than he's ever dealt with before. Bakayako is not the same type of defensive wizard as his compatriot, nor is he as exceptional in any one facet of the game, making the £40m fee seem a tad high. Nevertheless he's a well-rounded midfielder with time to improve who can both compliment Kanté and fill in for him against certain teams.
Having him in the fold helps ease the weight on Kanté's shoulders. However that easing is reduced now that Matić has left Chelsea to re-join José Mourinho at Manchester United, leaving the depth situation somewhat back at square one. Moving forward having a a young Bakayoko is better than having a 29-year-old Matić but it's all a bit moot if your two main midfielders are exhausted and one injury away from panic stations. Bakayoko's value as a different form of creator (a dribbler with good but not great passing ability) is also lessened when rather than an alternative he becomes the main option.
Chelsea may have to use Cesc more often or switch up the formation if they want meaningful passing in midfield, a route which of course brings its own headaches. We'll have to see what the rest of the transfer window brings on this one. Finally, slotting in at centre back, is Antonio Rüdiger. This is a quietly intriguing purchase as the German has a few quirks.
Despite being a CB he has moonlighted as a fullback on numerous occasions during his time at Roma (mainly on the right) meaning his game is a mishmash of skills. He completed 0.7 dribbles per90 for last season which, like Bakayoko, is on the high side for his position, even when you factor in the odd game at FB.
His passing numbers also are closer to David Luiz in terms of adventurousness (many an attempted long ball) than they are Gary Cahill. At 24-years-old it’s likely that his role will start out small, growing in the future as Luiz and Cahill - both in their 30s - age out of contention. Roma used him in a three-at-the-back, something Conte no doubt took note of, and his positional flexibility means he could fill in for Victor Moses too should the situation demand it. Perhaps Kurt Zouma (who has just been loaned to Stoke) could have filled that role but for now it appears Conte doesn’t consider him ready. Andreas Christensen - who impressed on loan at Borussia Mönchengladbach - has been preferred instead.
Michy
The case of Michy Batshuayi is an odd one.
Chelsea bought him last summer for around £33m off the back of a 15 open play goals(+2 pens)/9 assists season at Marseille, with some great expected goals numbers to boot. At Chelsea he has played a total of 239 league minutes, almost all of them in short cameos off the bench, with one token start in the dying embers of the season. It makes sense that he didn’t play much in the first half of the season given that Diego Costa was on a ridiculously hot run of goalscoring. Yet in the second half, when Costa regressed, he didn’t get a look in.
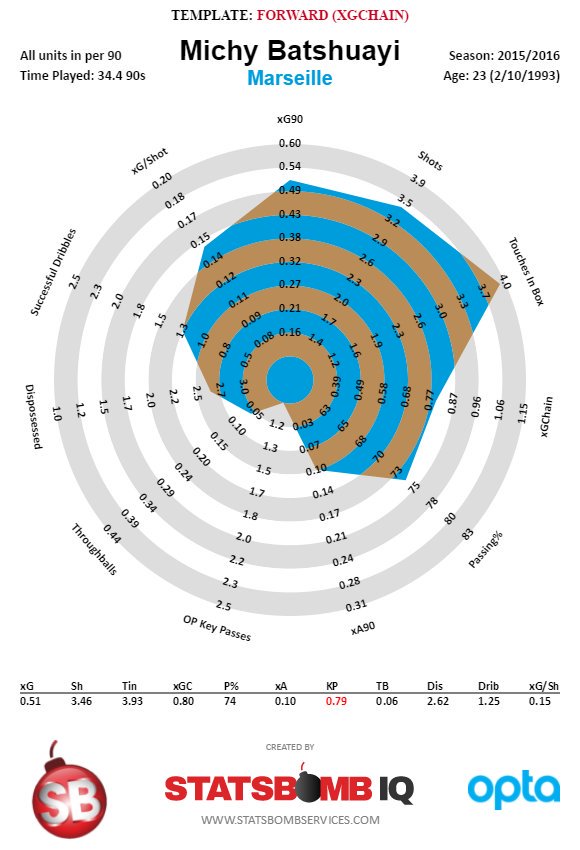
Michy for his part was also red hot in those minuscule minutes, scoring 5 goals (including the one that clinched the title) with xG output to match but it isn't clear how real that production is. At 23-years-old the club needs a bigger sample size so they can figure out what they actually have with him. If he had played more time and continued to produce then maybe the club doesn’t have to buy Morata this summer.
Instead of gambling on the young striker from elsewhere they can gamble on the young striker already on their books. Now there’s talk that he won't even be Morata’s backup, that the club is looking for an extra striker and Michy will be loaned elsewhere. We lack the context of what goes on in training and behind closed doors. Context that might illuminate why he has been handled this way. From an outsider’s perspective though, it’s confusing. Going into 2017/18 there are a few nagging concerns if you’re a Chelsea supporter.
The midfield situation will likely be solved in some fashion before the transfer window ends but others - wingback and attacking midfield particularly - are less certain. The dual broad objectives of replacing Diego Costa and filling out the squad have only been half accomplished at this point. There are slight opportunities for regression and an apprehension about how good Morata will be but these aren’t apocalyptic concerns. As things stand though, there's still a few holes to fill.
Bournemouth: South Coasting
In May 2015 Bournemouth clinched top spot in the Championship and achieved promotion to England's top division for the first time in the club’s history. When that happened there was much fanfare (deserved, of course), yet a few matches into 2015/16 season the novelty appeared to wear off a little and they haven’t received a great deal of coverage since. This despite having achieved safety from relegation twice in a row. It’s a shame really because a deeper look at them reveals some interesting tidbits and lessons to learn.
Their first season in the Premier League was shaky in the extreme. They finished 16th and five points above the relegation spots, yet had a worse goal difference (-22) than the two teams below them (Sunderland and the relegated Newcastle). Their non-pen expected goal difference however was -11.4.
This disparity stems from a defence with a tendency to collapse. Despite having a non-pen xGA of 48.4 they ended up actually conceding 63 goals. Parts of this may well be variance, but we have to also consider that goals were possibly easier to score against them than a team with a more defensive focus. They conceded 3 or more goals in 11 matches. Of those 11 only 5 were against teams who finished in the PL’s top 6, so this wasn’t a case of just getting bullied by the big boys.
Cut to the end of the 2016/17 season and they finished 9th with an improved goal difference of -12. So they sorted out that defence then? Well, no. In fact, it got even worse. They conceded 60 non-penalty goals and again conceded 3 or more goals in 11 matches. But this time with an expected goals against of 57.2. They gave up more shots (11.6 in 15/16 vs 14.5 in 16/17) and those shots were also closer to goal on average (17.7 metres in 16/17 vs 18.3 metres in 15/16).
There’s also little to suggest they’re getting defenders in front of shots and fooling expected goals models in a Burnley-esque style. Stratagem data for 2016/17 shows that they had 2 to 4 players in front of the shot 72% of the time and 5+ players in front of it 13.7% of the time, both numbers being bang in line with the league average.
The improvement they did make, such as it is, lay in the attack. Last season they posted an iffy non-pen 36.9 expected goals for tally. This season that has moved forward to 43.0 xGF, a number more befitting a midtable finish.
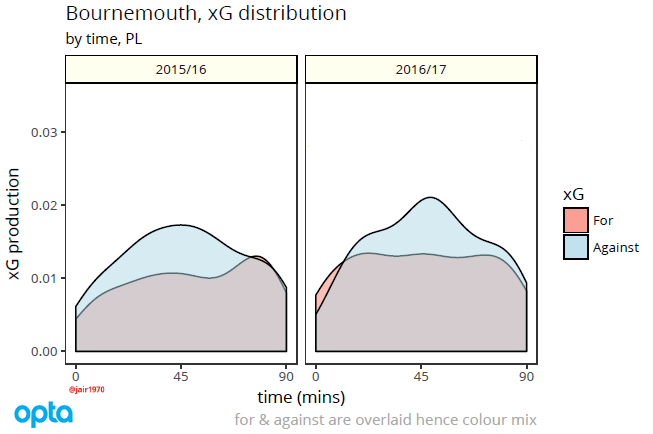
Despite this improvement, however, open play is not where Bournemouth’s bread is buttered. They scored 7 penalties in 16/17, joint-first in the PL alongside teams you’d perhaps ‘expect’ to be there: Tottenham, Liverpool and Man City. It could have been even more as their 10 penalties won overall was the best in the league.
This is an interesting quirk to Howe’s Bournemouth. It appeared absent in 15/16 when they only won 4 penalties, but if you look back to their time in the Championship it becomes clear it is a point of emphasis. In 2014/15 when they achieved promotion and the Championship title they won a staggering 16 penalties, a full 7(!) more than the team who won the 2nd most.
This could well be a result (intended or otherwise) of Bournemouth’s playing style. Per Stratagem data, they were 8th in the league in key entries into the box via a run this last season:
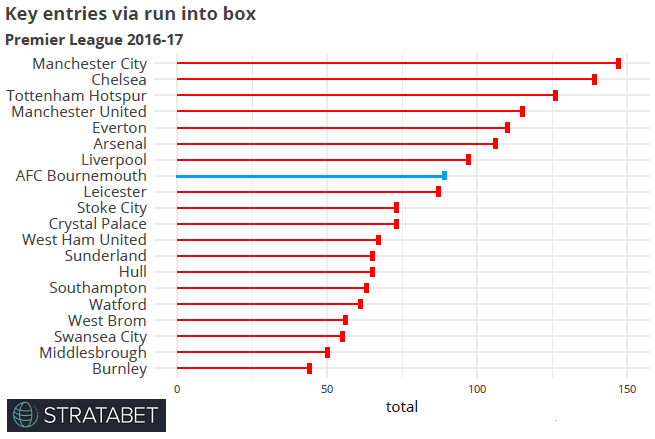
The seven teams that were ahead of them are the league's actual top seven, so in this regard Bournemouth are the best of the rest. The evidence points towards Howe telling his players to put their heads down and run when near the opposition box, and to some degree it’s working. Something he should be given praise for as most teams are dying for anything similar that separates them from the morass. Whether it’s a sustainable edge is another question entirely. One that depends on how thoroughly their opponents are scouting them and whether their coaching staff can drill it into them to just not foul.
Transfer business needs to be addressed because it’s been a bit of a bumpy ride in that department. There has been a degree of success. Benik Afobe, Josh King and Nathan Aké on loan were all agreeable moves. Problem is these bright spots have been in the margins of a wider, more confusing transfer picture.
Jordon Ibe - a player who, with the best will in the world, didn’t even flash much talent at Liverpool - was brought in for £15m. Even if he did turn out to be the absolute bee's knees Bournemouth were rumoured to have very generously offered Liverpool a buy-back clause, all but dooming the deal to be an overpaid loan at best and a complete waste at worst (Ibe played a shade over 1000 minutes in 2016/17, registering no goals or assists).
This week, as you’ve no doubt heard, they picked up Jermaine Defoe on a three-year deal from newly relegated Sunderland. There’s plenty of reason to believe that Defoe isn’t all he’s cracked up to be but let’s put that to side for a moment and assume for the sake of argument that the conventional wisdom (‘he gets you goals’) is correct on him. He’s 34-years-old, turning 35 in October yet has been signed up on a three-year deal.
Josh King alone scored 16 for Bournemouth in 16/17 as a primary option, not to mention Afobe and Callum Wilson’s contributions. Defoe had a whole team built around him last season and notched 15 goals, 5 of those being penalties (Is that it? Did they bring him in to take all these penalties they’re winning? He certainly didn't win any penalties himself last year). There's no case for him as a creation option either: Last season Defoe produced fewer key passes (20) in 3323 minutes than Afobe produced in 1454 minutes (23).
(While we're here: Bournemouth were dead last in terms of regaining the ball past their opposition's 18-yard-line via a turnover this season, and by a large margin too. Having a 35-year-old up front doing the pressuring will not help with generating those sorts of opportunities.)
Then you have all these players hanging around the squad seemingly without much purpose like Lys Mousset or Max Gradel. Howe has been loyal to his starting group of players, but left others apparently marginalised. Not to mention the strange Jack Wilshere experiment. It’s very hard to get a grasp on what the overall plan is, if one exists.
That’s Bournemouth in a nutshell really. Their supporters should probably feel relatively at ease as they head into a third year in the PL. The team’s overall profile is likely complete enough to expect safety for the near future, barring a freak season. An accomplishment that is fairly ahead of schedule for a club their size. Yet with a defence as dodgy as theirs that margin of error is is always going to be a bit slighter than you’d like. However, Aké and Begovic are decent defensive signings that could be the bedrock for good things to come and may well address this.
At the moment they scan as a side devoid of a direction outside of just keeping on keeping on. Cut out the head-scratcher signings, tighten up the defence and we could be looking at a Premier League mainstay. As it stands though, there's plenty to work on.
(Parts of this article were written with the aid of StrataData, which is property of Stratagem Technologies. StrataData powers the StrataBet Sports Trading Platform, in addition to StrataBet Premium Recommendations.)
Creeping Forward: Improving Shot Location
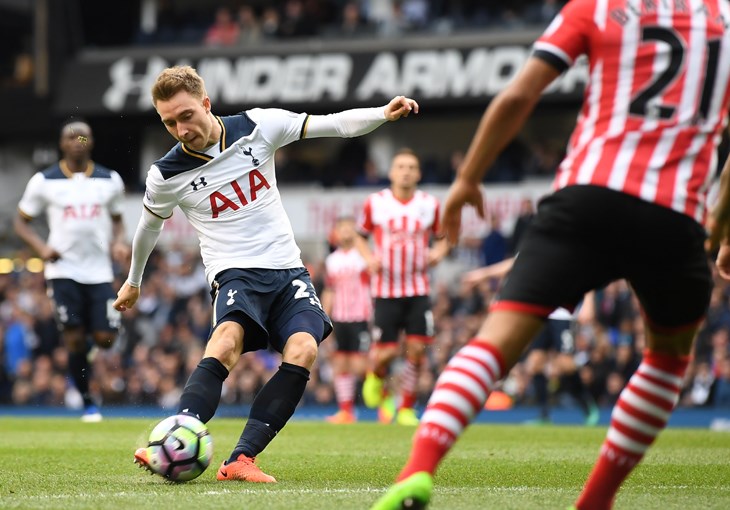
The idea behind shot quality in football is really a fairly intuitive one. A shot from the halfway line isn’t as good an idea as a shot from inside the six-yard box. There’s more nuance to it but you don’t need any sort of deep analytical education to grasp it. Hell, it’s right there in why goals like this one from Memphis are so memorable: because we don’t expect them to happen.

Yet, in spite of this, shot quality and the improvement of it feels like a bit of an uphill battle. Especially when it comes to coaching the idea into younger players who have a particularly frustrating problem with their shot selection (Hakim Ziyech, bij voorbeeld). However, it would appear that, one way or another, teams are starting to pay real attention to their shot selection. I noticed this while compiling some shots numbers and tweeted about it, prompting the ever lovely Colin Trainor to produce this nice summary:
Shots are being taken from closer to goal in recent seasons. Seems teams are appreciating shot quality more. Prompted by @EuanDewar's tweet. pic.twitter.com/AP5Uvf3dFv
— Colin Trainor (@colintrainor) May 28, 2017
Whether you talk about it in terms of shot distance or shot zones, teams across Europe’s top five leagues are cutting the fat off of their shots. This article is going to focus on the Premier League specifically, mainly because there’s just so many things to digest across Europe that this could go on forever, so a cutoff point has to be set somewhere. If you want details on what's going elsewhere give me a bell on twitter and if there's enough curiosity there might be a follow up.
| Season | Total Shots | Outside Box Shots | % of shots outside box | Average shot distance (metres) |
| 12/13 | 10562 | 4626 | 43.80% | 18.96 |
| 13/14 | 10238 | 4599 | 44.92% | 19.15 |
| 14/15 | 9881 | 4221 | 42.72% | 18.72 |
| 15/16 | 9781 | 4046 | 41.37% | 18.50 |
| 16/17 | 9734 | 3971 | 40.80% | 18.37 |
(*distance numbers for 16/17 are a few matches out of date, but you get the gist)
The first thing that sticks out is the relationship between shots taken outside the box and the total shots numbers. Bits are getting shaved off the outside numbers with each passing season, yet those shots aren’t really being replaced with anything. However, this isn’t really ending up as a loss in end product because of the increased focus on better shots. Everything is floating around in similar totals, and the goals aren't going away that's for sure.
(If you’re wondering about the slight increase in distance in 13/14 that season was very, very odd in an attacking sense. There were 184 goals scored from outside the box that season, 22 more goals than the next highest total over the last five seasons. Most of those were Luis Suarez scoring against Norwich. Or at least that’s what it felt like).
Which teams then are embracing this change and leading the charge in these numbers?
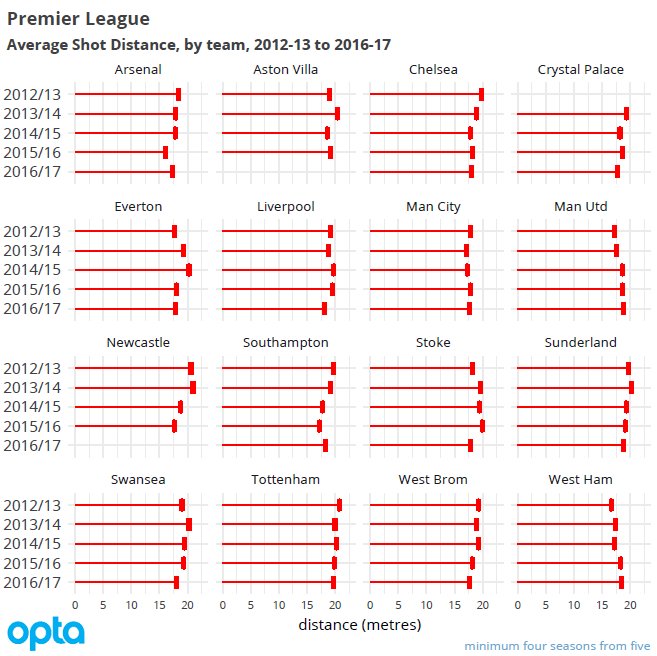
Arsenal put up the lowest % from outside the box in the recently finished 2016/17 season with an exceedingly low 33.03%. This makes sense for a couple of reasons. Firstly it fits with the image of them of as the English Barcelona, building their attack around getting high value shots (by the by, Barca’s % of shots outside the box in 16/17 was 31.9%). You may also remember that in late 2014 they bought StatsDNA, an analytics company. Now, obviously it’s hard to tell from the outside how much sway they have, but Wenger has mentioned things like expected goals in the past so it seems quite likely that the sharp dropoff between the 14/15 to 15/16 season is at least partially down to StatsDNA being in the discussion and Wenger being open to what they have to say.
In that 15/16 season they absolutely crushed it on the attacking end. It was the ne plus ultra of ‘they always try to walk it in’. Their average shot distance that season was the lowest of any team over the last 5 seasons. This saw their xG per shot jump from 0.105 in 2014/15 to 0.125 which, again, was the highest of any team over that timeframe. This season they’ve become more dysfunctional in attack but that’s a whole other story entirely.
| Arsenal | ||
| Season | xG per shot | Average shot distance (metres) |
| 12/13 | 0.1056 | 18.45 |
| 13/14 | 0.1114 | 17.93 |
| 14/15 | 0.1056 | 17.80 |
| 15/16 | 0.1253 | 16.08 |
| 16/17 | 0.1035 | 17.25 |
Their North London neighbours Tottenham are another interesting case. Plenty has been said about how Mauricio Pochettino seems to emphasise long range shots as a part of his gameplan, and sure enough his Tottenham sides have a similarly high % from outside the box as his Southampton one. Yet even though they had the highest % overall in the 16/17 season he has still actually brought the number down from where it was before he took over. It appears that AVB was even more content for his players to take pot shots than Pochettino is. Bless his soul.
| Tottenham | |
| Season | Average shot distance (metres) |
| 12/13 | 20.75 |
| 13/14 | 19.98 |
| 14/15 | 20.22 |
| 15/16 | 19.81 |
| 16/17 | 19.76 |
Another big (and perhaps unexpected) contributor to the overall league dropoff is your friend and mine Sam Allardyce. West Ham under Allardyce from 2012 to 2015 were always posting low %s, and then as soon as he leaves and Slaven Billic takes over those numbers shoot up. Sure enough in his lone season at Palace they had a similarly low average. His time at Sunderland is the outlier, but it seems none of the many managers they’ve gone through have been able to greatly change their numbers. Much was made from early on in Allardyce's career about how he embraced stats and let it shape how he worked. Billic meanwhile seems to prefer the volume over quality approach.
| West Ham under Allardyce | West Ham under Billic | ||
| Season | Average shot distance (metres) | Season | Average shot distance (metres) |
| 12/13 | 16.60 | 15/16 | 18.29 |
| 13/14 | 17.33 | 16/17 | 18.52 |
| 14/15 | 17.25 |
Funnily enough there's another manager who has this effect: the Right Honourable Tony Pulis.
| West Brom Pre-Pulis | West Brom under Pulis | ||
| Season | Average shot distance (metres) | Season | Average shot distance (metres) |
| 12/13 | 19.27 | 15/16 | 18.13 |
| 13/14 | 18.85 | 16/17 | 17.68 |
| 14/15 | 19.25 |
Allardyce and Pulis doing this shows that it's the idea of shot location that matters, not how you achieve it. They aren't bringing down their teams' average shot distances with intricate play and sly throughballs like an Arsenal or a Man City are. They're adapting the idea to the strengths of their players, utilising more headers and the like. An equally valid way of reaching the same end result.
And that's the point of all this: teams are getting the message on shot locations and starting to remove some of the more pointless shots out of their attacking diet. Will long shots ever go away? No, nor should they. Everyone loves a thunderbastard goal from outside the box. The aim here isn't to turn every team into a Poundland version of Barcelona. It's just to make them a little bit smarter and to maximise what they get out of their attack.