Author: James Yorke
Messi Data Biography Analysis: Young Messi 2004-05 to 2007-08
Pass Footedness in the Premier League
One of the many enhanced features of StatsBomb Data is pass footedness. Today we’re going to look at some results from looking at this feature of the data and show how pass footedness manifests within the Premier League. Footedness has historically been a feature that has been added to shot data and not passes, but shot volumes are small, and genuine clues around footedness can be concealed by player style or availability or opportunity; for example a centre back who finds the ball at their feet in their opponents six yard box will likely swing whatever boot is nearest to generate a shot. Back in their own half comfortable in possession, they are more likely to make a conscious choice as to which foot they pass with. Already we have a more detailed cut to look at player preferences.
Right: since this is new, let’s get some simple facts out of the way.
- There are an average of 870 passes in a 2018-19 Premier League game.
- Of those passes, around two thirds are made with a player’s right foot.
- Of the players, around three quarters are dominantly right footed.
- Right footed players average around 87% of their passes with their dominant foot, left footed players around 85%.
- On average, right footed passes are one metre longer than left footed passes.
- Right footed passes are completed around 81% of the time, left footed passes 78.5%. This trend holds regardless of the foot dominance of players.
- The difference between left footed players completion rates for their left foot (78.3%) and right foot (81.2%) is slightly larger than that of right footed players: left foot (78.6%) and right foot (80.9%).
- These trends all generally hold if you shrink the width of the pitch to the width of the penalty box, which was my idea of how to minimise the effect of full backs and wide players versus the touchline.
These are just counted stats, modelling work would no doubt start to highlight confounding factors but it’s interesting to see nonetheless.
We can see trends towards fewer left footed passes being completed across the pitch:
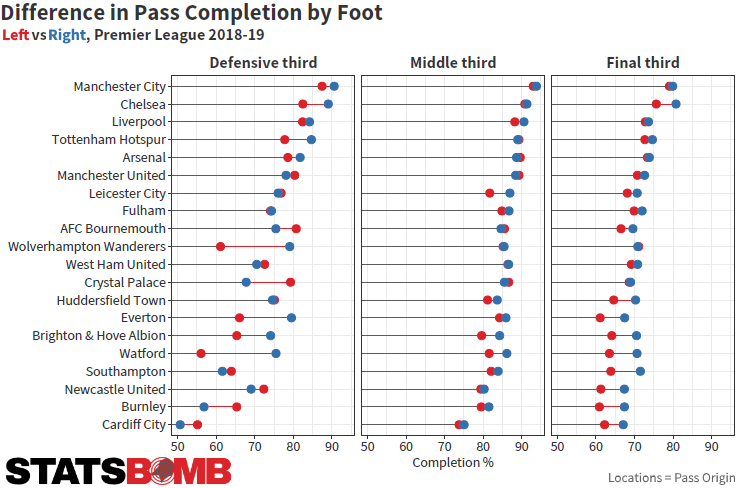
Here we see a fascinating signifier, every team in the Premier League bar one, Wolves, completes passes in the final third at a higher percentage with the right foot than left.
Team Breakdowns
Most teams will have a minimum of one left footed player--their left full back--but usually more. We can contrast opposites in the Premier League by looking at the two teams that attempt more passes than any other teams: Chelsea and Manchester City.
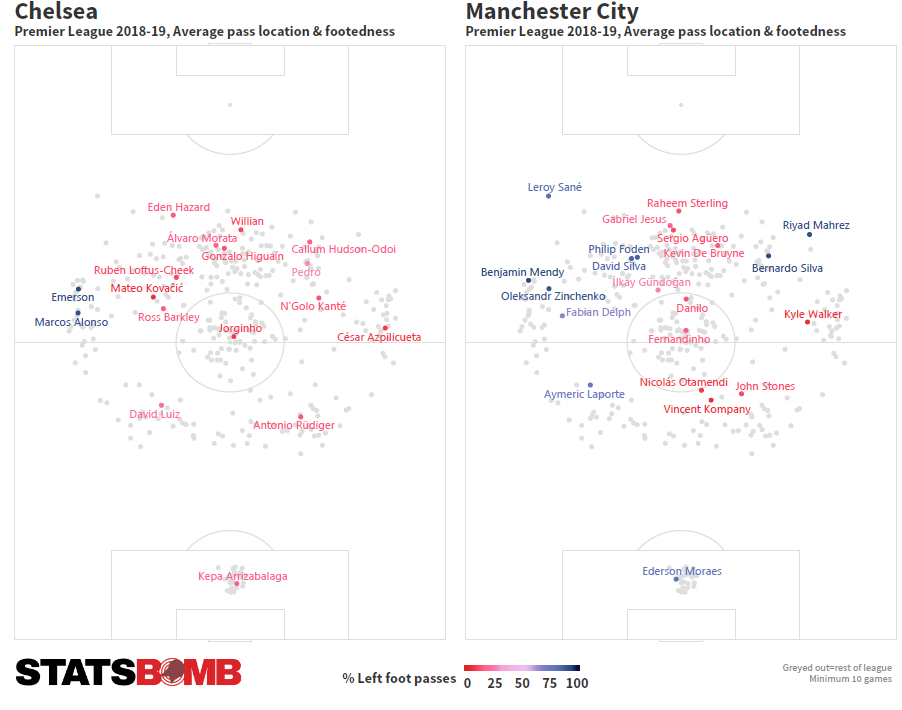
Even allowing for the effect of positional switches, a season long overview gives fairly strong indicators of player location and team structures and tendencies.
Of Chelsea players to have appeared in ten or more games, only their two left backs can be considered to be left footed. Pedro is the only attacker to approach two-footedness from a passing perspective and his Left/Right split is 27%:73%. Manchester City’s squad is chock full of left footed enterprise, with centre back Aymeric Laporte, converted midfielder-cum-full back Fabian Delph (who with a 35%:65% split would actually be a top three in the league two footed player, but lacks minutes, more on this later), Benjamin Mendy and Oleksandr Zinchenko all nominally part of the defensive corps, while David Silva and Phil Foden patrol midfield and Riyad Mahrez and Bernardo Silva usually occupy the right-to left orientated location so many left footed attacking players now do. Even keeper Ederson is left footed.
The example of Man City is extreme, but it’s notable that five of ten high priced outfielders they have signed since the summer of 2016 are left footed, including the one player we’ve omitted so far: Leroy Sané. As a left footed, left sided forward, Sané is legitimately unique in the Premier League:
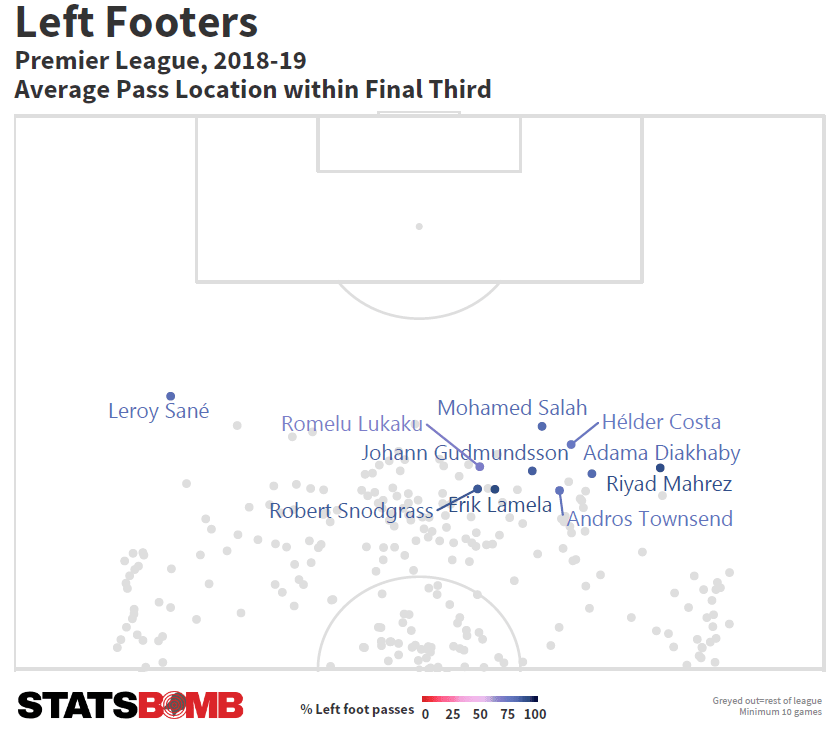
That chart shows every left footed player (minimum 10 games) who has an average pass location within the final third, and the chart for 2017-18 shows the same trend. Not only are Sané’s pass locations on the other side of the pitch to all his inverted lefty compadres, but his passes are recorded higher up the pitch than any other player in the league. Raheem Sterling may have acquired the starting left forward role for Manchester City in recent months, but Sané remains a useful and different attacking weapon.
Two footed players
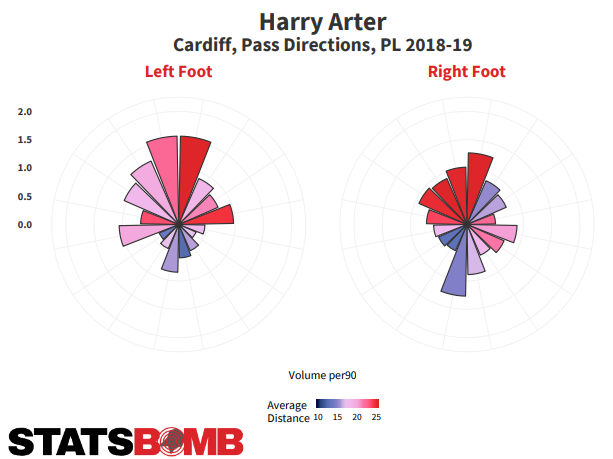
Part of the motivation to look at this was the search for that most elusive of player: a two footed genius, for which every pass is a decision made by the unconscious mind and for whom the balance of footedness is entirely natural. To my surprise, it turns out that idyllic vision is inhabited currently by just one player in the Premier League, Cardiff’s Harry Arter:
Credit @etmckinley for the viz concept
We’ll see some different scales on these as we go along so stay alert, but here we can see that although Arter doesn’t make a ton of passes (around 25 per 90), there’s a fair split between each foot. He also completes passes at the highest rate for his team at 78%. No player in the league comes close to his 48% : 52%, left to right split (sounds familiar…) and his range of mid to long passes forward with either foot have been a useful pressure release as Cardiff looked to remain in the Premier League this season.
We can see just how scarce this balance is here with this chart of open play passers:
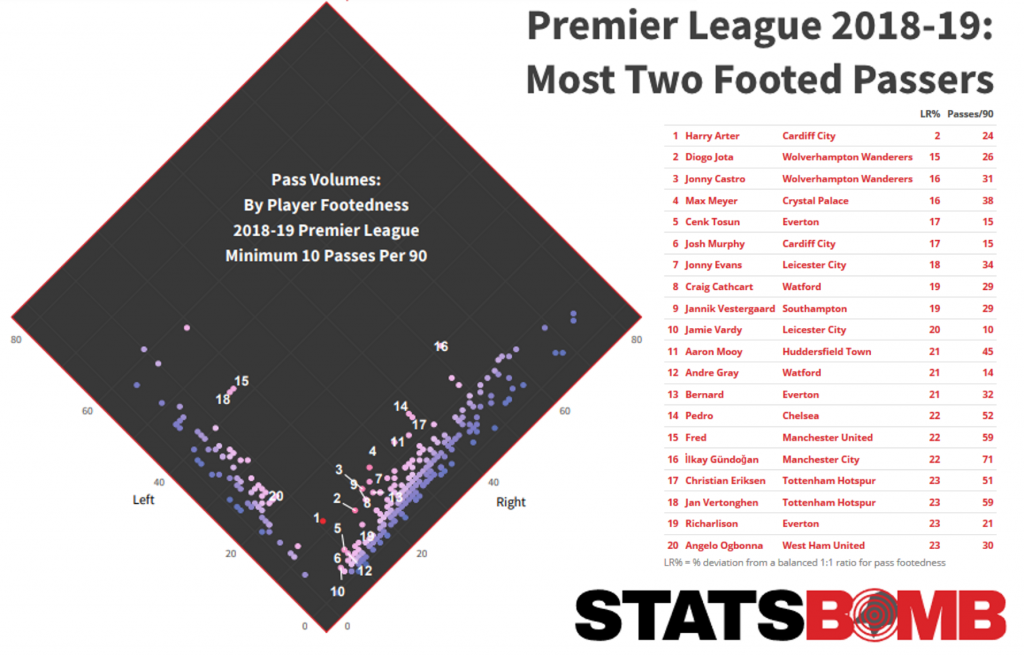
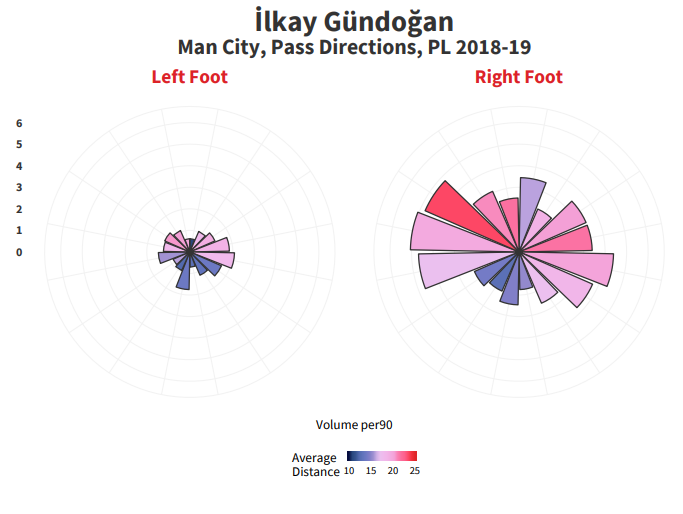
The solitary red dot is Arter, and you can see the rest of the top twenty most two footed passers highlighted within and listed adjacent. There are simply very few players who balance their passing output between feet, especially at high volumes and even for those that do here, there’s perhaps a skew towards those who spend time in mostly central positions, which is logical. İlkay Gündoğan is the highest volume passer in the top list, and as we can see here, his general profile skews strongly towards his favoured right foot:
It's interesting to think of players in these terms though. Even if a player is using their off-foot infrequently, it still feels like a useful skill, if only to avert trouble. The player with the least diverse footedness profile this season is Arsenal's Shkodran Mustafi:
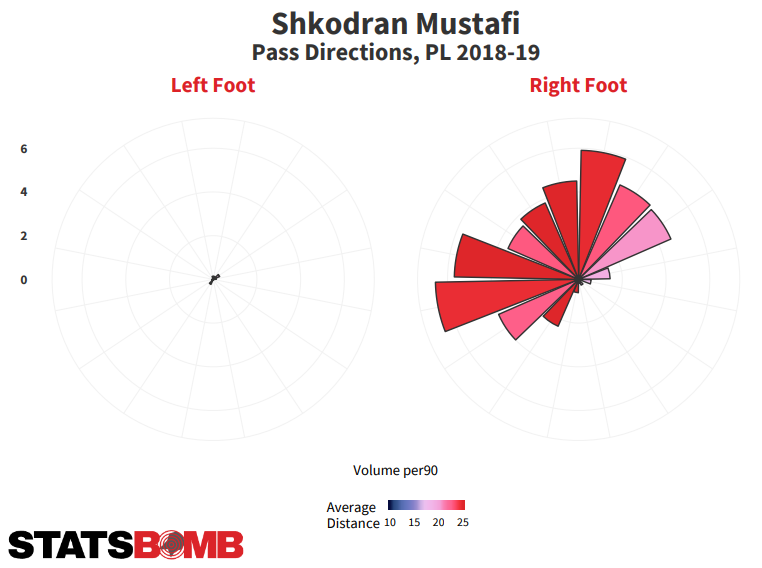
There's no 48 to 52 split for Mustafi, he literally attempts one left footed pass for every 48 right footed attempts. The features of his passing; often long and upfield, or to his left, and far less to his right, gives a window into his positioning in possession, Arsenal's use of a fairly high right full back, and perhaps a weakness, after all there are a limited set of directions Mustafi makes passes towards, and it will always be with his right foot.
Contrast quickly with Sokratis and Laurent Koscielny:
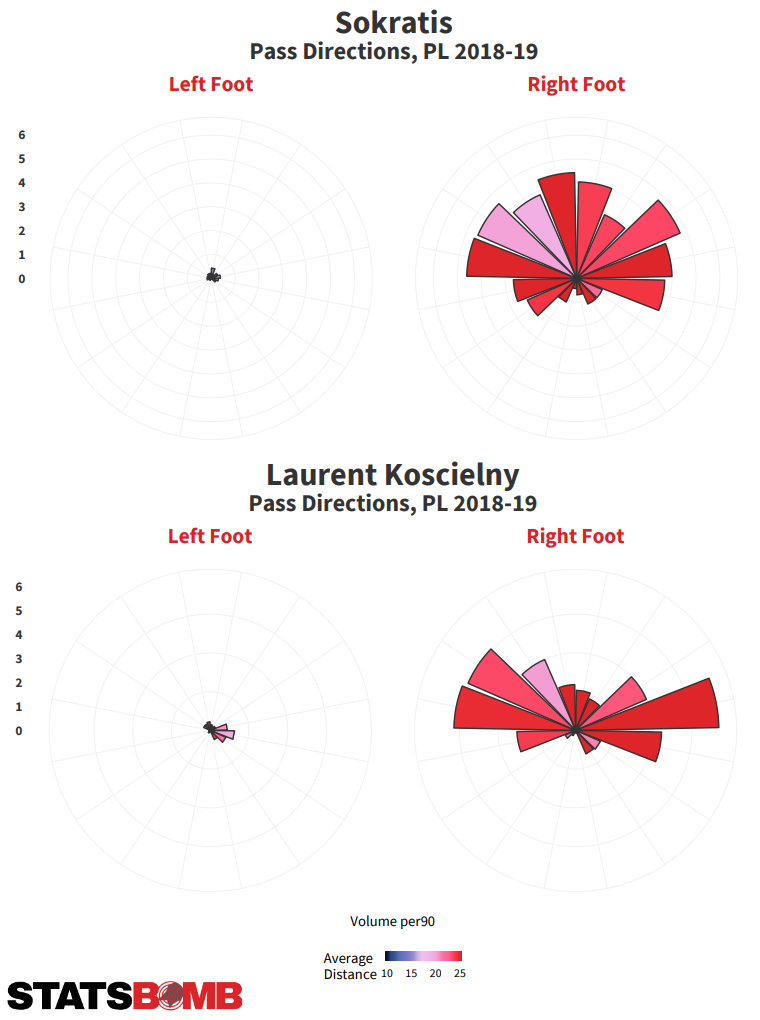
Each of Arsenal's three main centre backs are almost entirely right footed, but have different passing profiles. Koscielny looks to switch between his fellow defenders, from side to side, while Sokratis will pass forwards with range, left or right. Should an opponent run a press against Arsenal, and consider blocking passing lanes and preventing easy outs, there is information here to work with.
We've just touched the surface of ideas around pass footedness here, but hopefully it's given a flavour of how useful and informative it can be as a standard feature of a modern data specification. The reason why it helps as an aspect for pass modelling work or an input into recruitment analysis or opposition analysis: it scales. Every pass, in every game, in every league that StatsBomb collects holds body part information. Do remember too that StatsBomb has provided free data for women's football and the 2018 World Cup, so if your interest is piqued by some of the ideas enclosed here, there are datasets available for you to work on too.
Now i'm off to petition the PFA to correct their Team of the Year oversight and replace Paul Pogba with Harry Arter.
Evaluating Mohamed Salah
When you call a transfer the "Signing of the Summer" and then the player proceeds to score 32 league goals and 10 Champions League goals in a season, it's fair to say you can be happy with your work. Hell, I even mocked up a picture of Mo Salah in a Liverpool tracksuit for the accompanying artwork. I was high on this guy and Salah chipped in on his end of the deal. Good lad.
This season had been progressing very well too, at least until recently. He has recorded 20 goals in the league and Champions League (albeit with four penalties), it's just that while last season saw an overwhelming overperformance--StatsBomb model had him at 31 non-penalty goals from about 20 expected-- this season he's basically matched expectation. As such, there is a view in the darkest corners of the fan world that perhaps he's been a bit disappointing. In general this would be wrong. But there is no doubt that specifically recently, his contribution to scoring both in expected terms and in reality has somewhat slowed down. He has only one goal and one assist in his last ten club matches, and he's been out there: he has only been substituted once. As I discussed last week, in the aggregate, all this might not matter, since Liverpool's dynamo front three are scoring at a rate commensurate with what came before, it's just Sadio Mané has received the goodwill of the footballing gods this season, and his goalscoring has matched that of Salah. Two forwards, 20 goals each.
Let's have a look at Salah from a data perspective and see if we can identify any aspects of his game that have changed.
Here are his Premier League shot maps year to year (prior to the Fulham game):
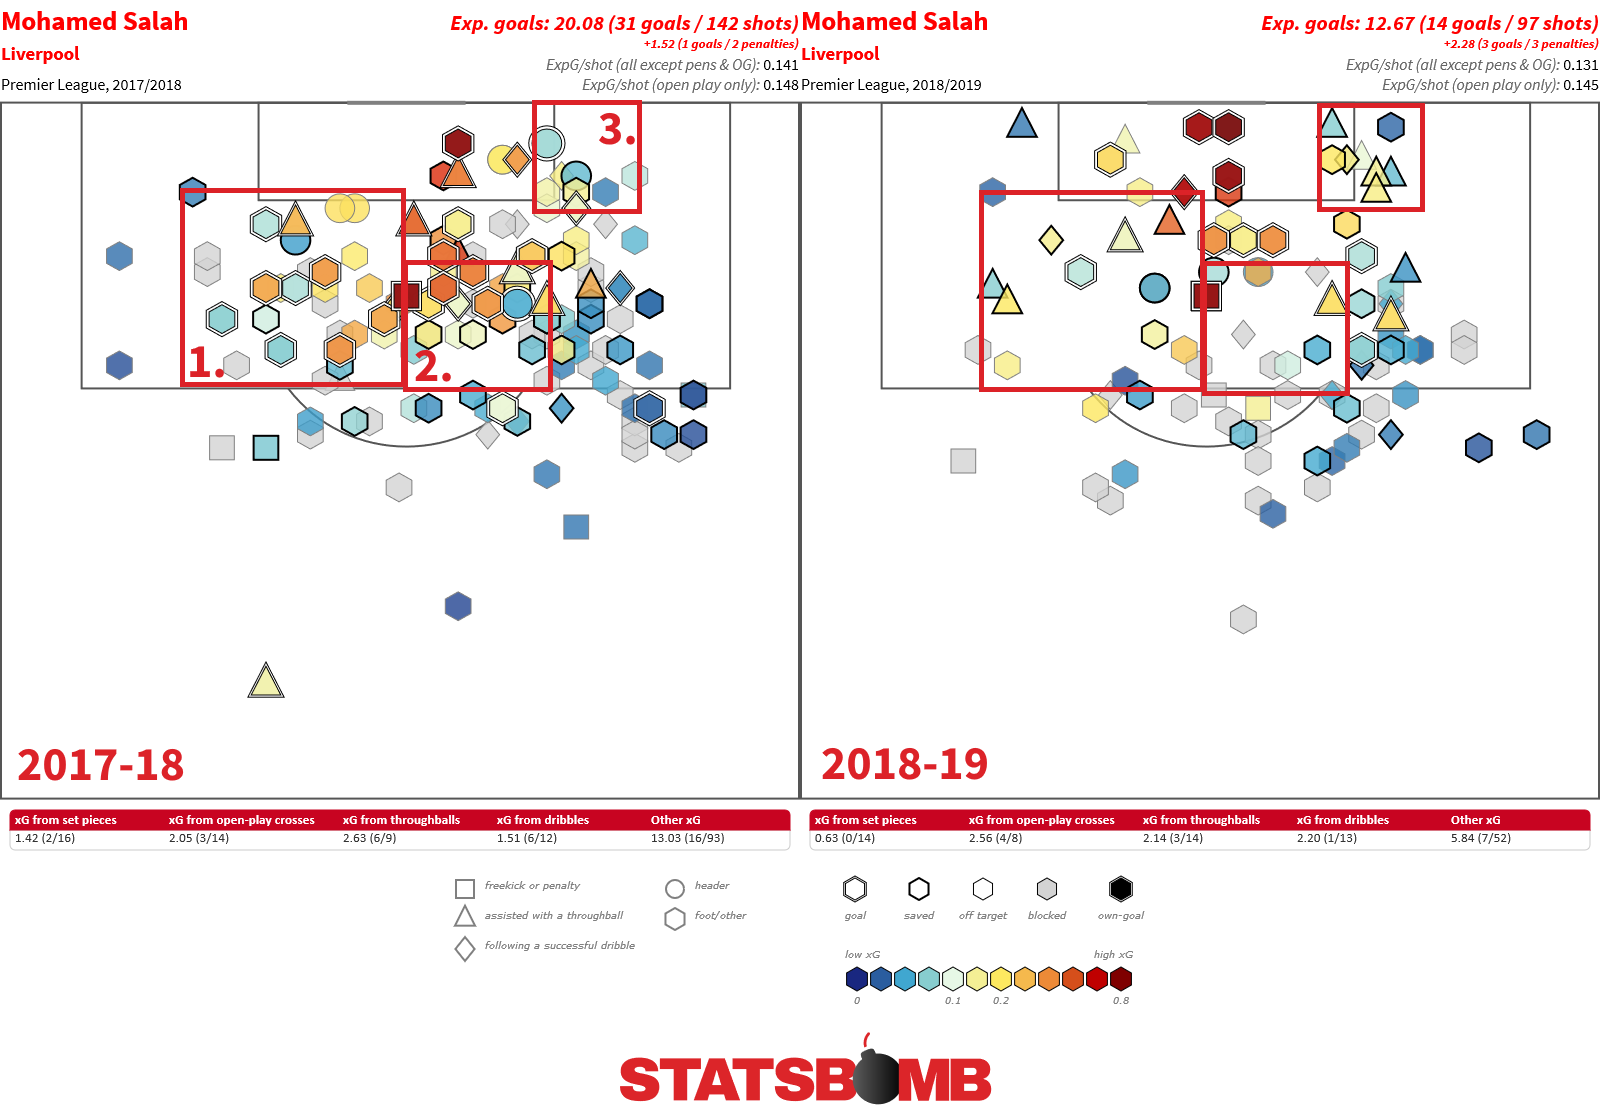
To get one thing out of the way; we're not being ignorant to the slightly different position he's played at times this season, more central. The general shape of his shot map hasn't really changed, there's still a skew to his most usual right sided starting position. I've highlighted some segments that I think are of note though, so let's work through them:
1. Salah's opposite side saw him finish at a fantastic rate last season, by my reckoning he converted nine goals from around 27 shots in that zone left of the penalty spot. So he had a decent volume there and finished at a very high rate. This season he simply hasn't gained shots over on that side at anything like the same rate. He has a couple of goals in there, but despite being nominally more central at times, it hasn't translated into shots or goals.
2. This zone fascinates me because it's the zone I envisage Salah operating in; cutting in from the right, perhaps beating a defender or creating space for a shot, nicely faced up in front of the keeper. Another nine or so of his goals last season came from this area, whereas this season he's barely even shooting in there. He has one goal from that zone but there's a huge gap where last season shots existed, and this season they just don't. If there is one specific aspect in which the league as a whole may have become somewhat accustomed to Salah's shooting tendencies, this might be it, the Robben zone. Whatever you do, don't let him onto his left foot in that area, if you can help it.
3. This feeds into a smaller factor which I think is borne out in zone three. If Salah is diverted away from that golden shooting spot, where does he go? That little cluster of shots derived from throughballs in there feels like the resulting aspect of Salah having had his shooting angle closed off, before ending up with a tight finish with his right foot further in. Even right footers struggle to finish from these kind of zones, so for Salah to struggle there with his off foot, would be quite normal.
Slowing down is normal, and was always likely, but we have a window there into where shooting locations are actually different.
Here's an simple experimental viz to identify where players move to generate their own shots. It shows the position in which they received the ball (start of the line) and the resulting shot location as well as a footed indicator for the shot. It's important to recognise that the actual movement of the player may or may not be in a straight line (as represented), so what we're mainly interested in are the starting and finishing locations. There's a cut off of 3 metres so as not to overload the visualisation and also to highlight events in which the player has made a significant move, be it a dribble or a carry, between receiving or recovering the ball and shooting it.
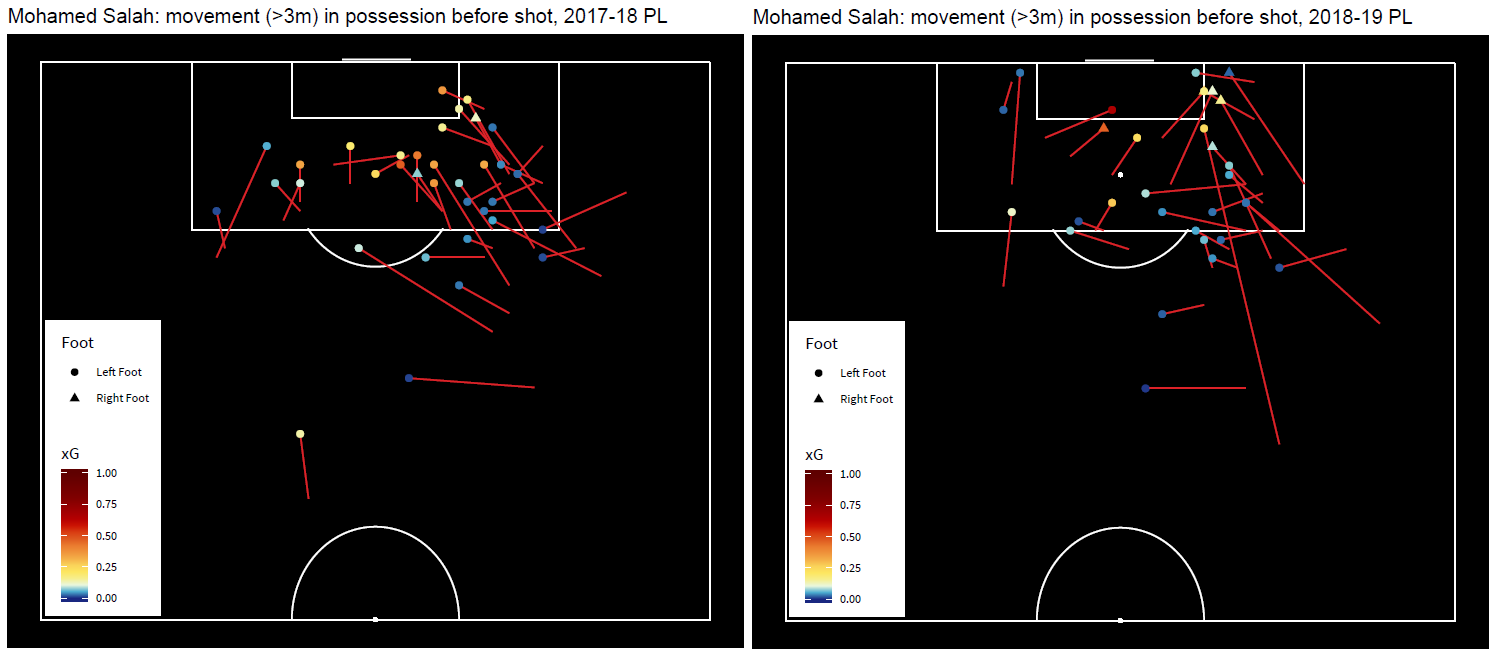
Now some of this will be in the eye of the beholder, but it looks to me that Salah was more proficient at generating shots from his right sided starting position, these kind of 5 to 10 yard snappy bursts in a North West direction during 2017-18, while this season, has tended to move inside or take it down towards the touchline. This chimes with what we saw earlier regarding overall location of shots too. He's perhaps starting his shooting moves in that back quarter of the penalty box less frequently too.
Let's try and segment the season to see what's changing elsewhere:
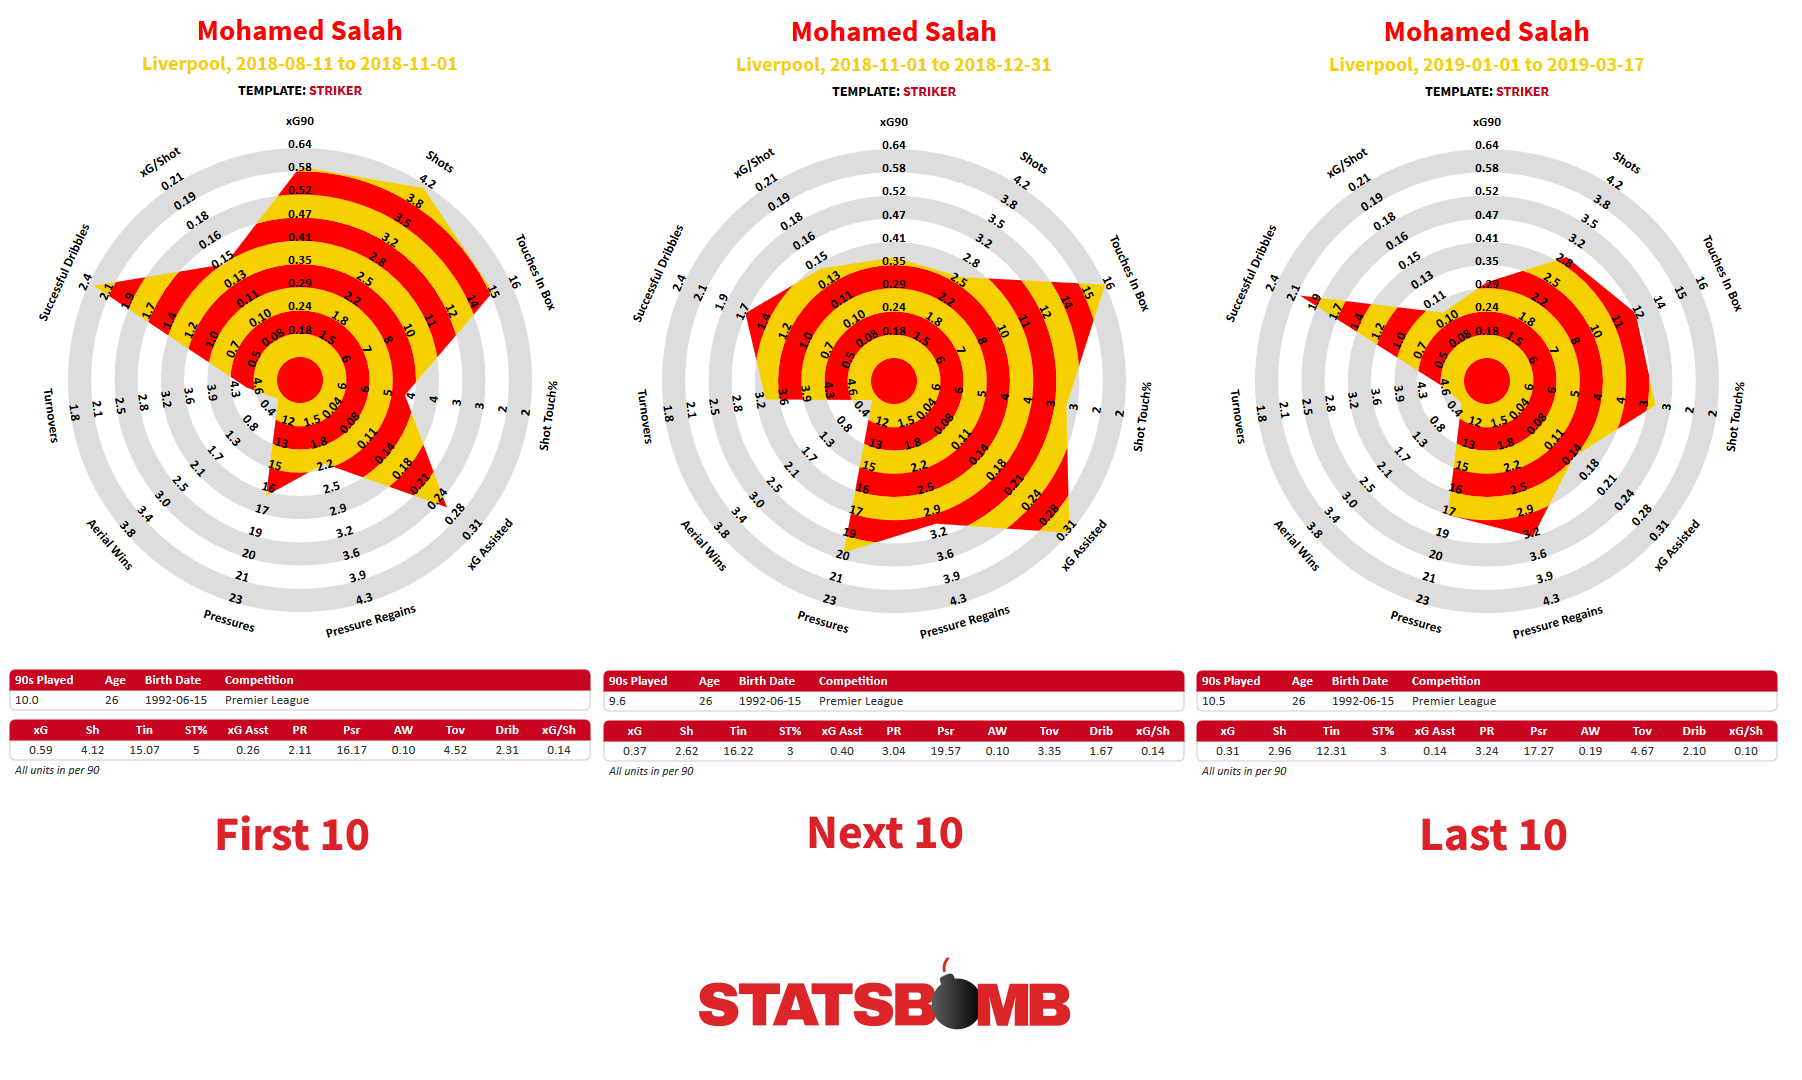
Usefully Salah has appeared in every one of Liverpool's games this season, so we can slice up his season into tidy ten game segments (data is from prior to the Fulham game, he has one substitute appearance in there too). Ten games is probably about as small as you might want to slice this for analysis purposes, and the schedule is fairly balanced through here too (3/3/2 games vs top 6 rivals) but we can see significant differences.
First ten games: High shot rate, over four per game (same as last season) feeding into high xG (nearly 0.6 per 90) and solid but unspectacular xG assisted (0.26 per 90).
Next ten games: Shot rate has come down by 1.5 per game to 2.6, and xG has followed (0.37) however he's taken some slack in creativity (0.40 xG Assisted per 90)
Last ten games: Tough times. Shots moved closer to three per game, but xG is down again (0.31 per 90) powered by a big drop off in xG per shot (0.14 in both prior segments, 0.10 in this one) and the xG assisted has gone AWOL (0.14 per 90).
Segmented shot maps bring out that xG per shot decline clearly:
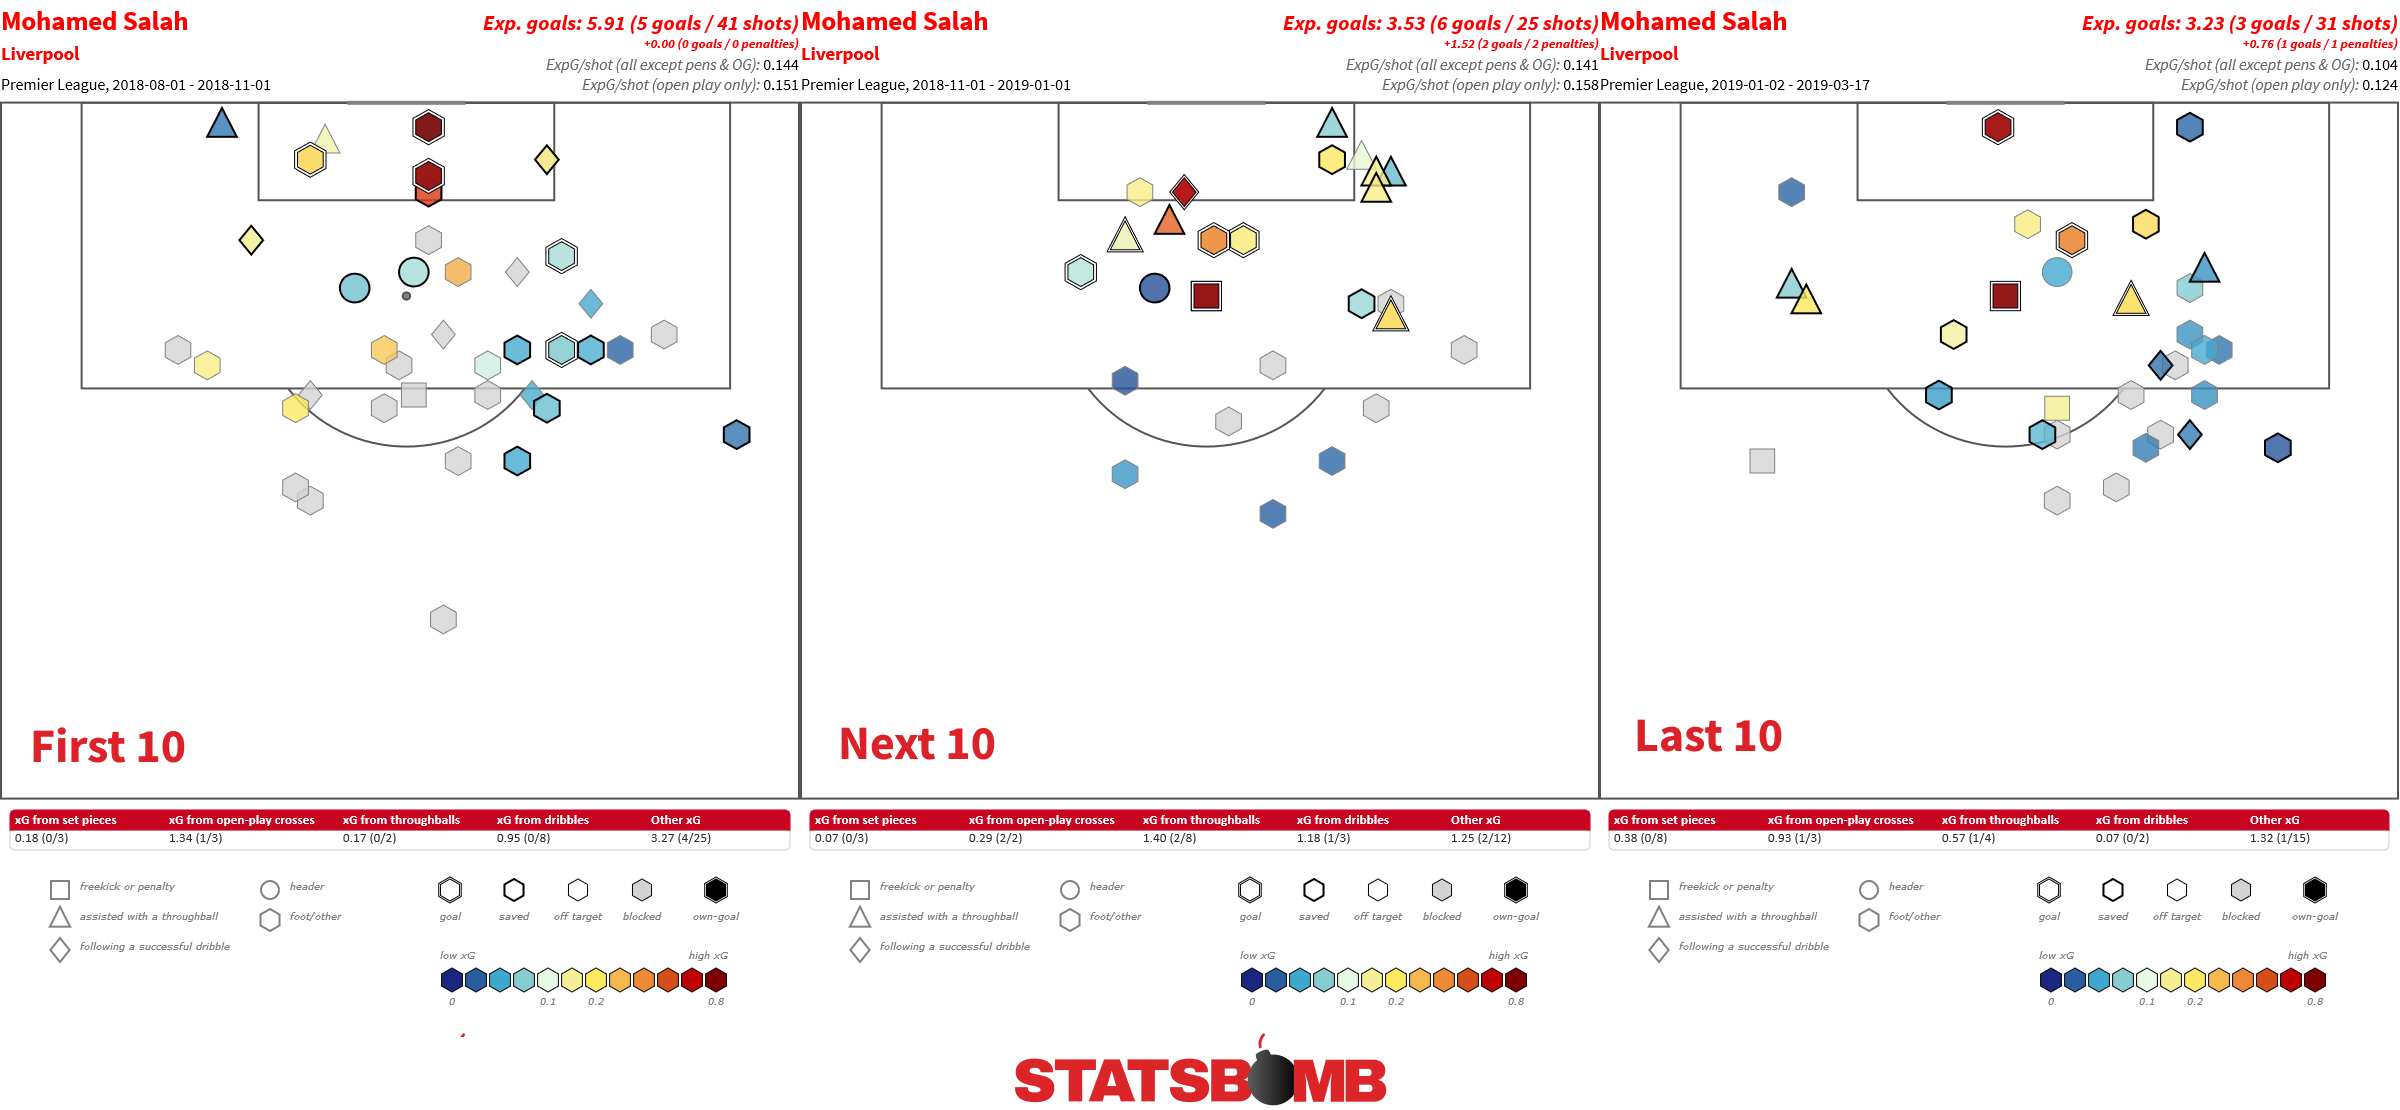
First ten games: few too many blocked shots from range, nice xG boost from a bunch of shots deep in the six yard box.
Next ten games: where did all the blocks go? Really quite a nice mix of shots, then that odd little cluster in a bit of a no man's zone outside the edge of the six yard box.
Last ten games: I don't like all these wide shots from range. It's hard to score from out there, even with an open look at goal. Not saying it's easy to achieve but Salah somehow needs to work to shift these 5 yards closer to the centre. Look at the lack of shots closer in than the penalty spot and within the width of the six yard box.
It's worth reframing this whole discussion around expectation too. Without last season, this season would look like an excellent return for a new wide forward. Mané is another player who has had stick at times, entirely unfairly when factored against his general contribution as a non-traditional forward rather than a typical goal-getter. And the team itself is having one of the great seasons of the Premier League era, yet amazingly remain in a title race. I had a look at Salah's passing high up the pitch, but could see little difference season to season in how he interacts with those around him, or how he progresses the ball. He will always turn the ball over quite frequently, it's a trait related to his tendency to try and carve out his own chances through ball carrying, but he is a good passer in dangerous areas (ninth in the league for open play passes into the box).
Salah is going through his first major quiet period as a Liverpool player. It's to his credit that it's taken the best part of two seasons before he has reached this point. One concern could be around tiredness. He played a full season last year then got injured in the Champions League final and rushed back to the World Cup then has been nearly ever present again in 2018-19. The recent drift towards wider and rangier shots is something to keep abreast of moving forward but luckily, we well know that Liverpool have some of the smartest guys around working on analysis, so one would presume it's in hand. And spending time with the video will shed further light on the story too.
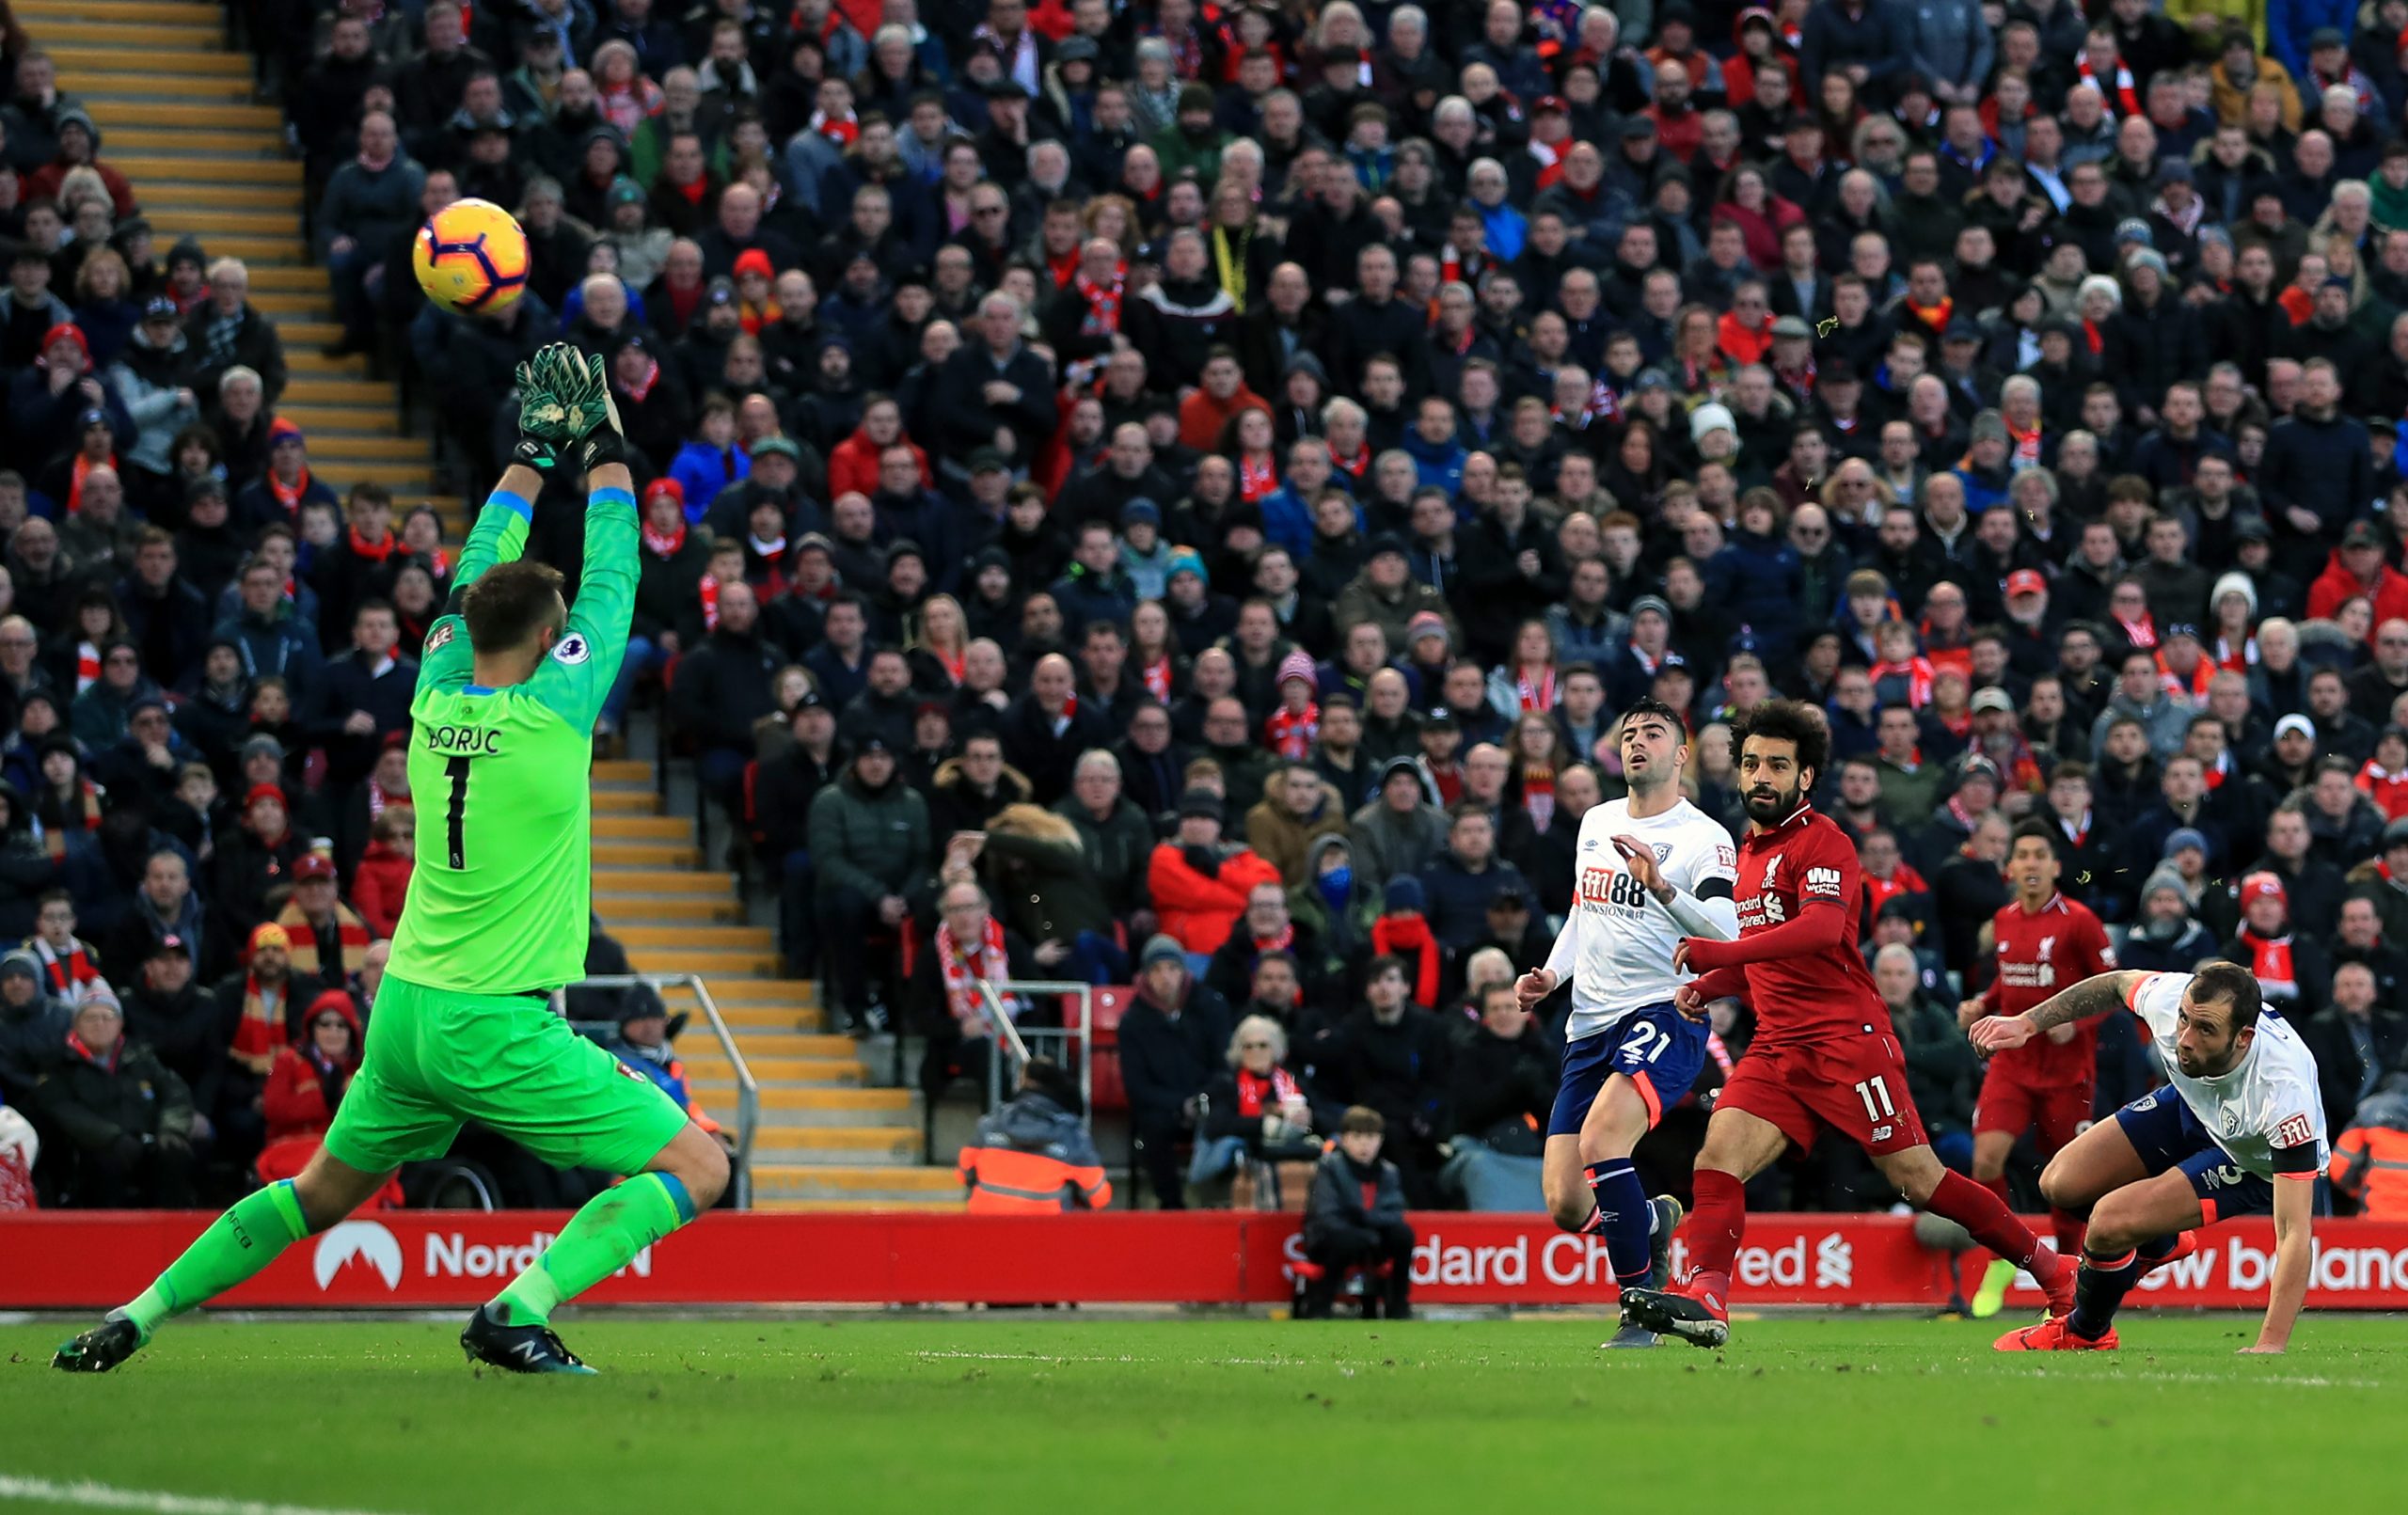
It's tough for Mo. He had a season which lit up like Messi, and as we saw again this past weekend, nobody is a Messi but Messi. Salah will shin one in soon enough and people will forget about this blip. The battle between defenders desperately trying to shift him onto his right foot will rage on, no doubt for years to come. How well he adapts to that will be fascinating to follow.
The Football Stats War May Not Be Over But One Side Is Winning
Expected goals are in the news again as Man Utd have rocketed back into the top four race under the tutelage of Ole-Gunnar Solskjaer. In the wake of an odds-defying result in the Champions League (they were around 4% to get through v PSG) things looked great, and a defeat in an open game against Arsenal has only slightly reduced the shine on the Norwegian’s halo. To anyone switched on to evaluating football though there is a simple truth: Borne out by both actual analysis and the general feeling of watching the team, during 2019, at times, Man Utd have got the breaks.
What this has done, in part, is create a schism between ideas around Solskjaer’s future. I think it’s straightforward: he has improved results and the basis in which they have been achieved, so points and expected goal accumulation are heading in the right direction. He also gave everyone a fun night by “masterminding” a last minute comeback, something that heralded memories of 20 years ago, when he himself did it before. It’s all very romantic and sweet but even through an analytical prism, I’m not sure what more he could have done in his time at the helm, ergo, give him the job.
This isn’t the only idea though, notable analytics post-match chartist 11tegen11 got a ton of grief for suggesting that as Solskjaer had outperformed metrics and was likely to never have it so good, he should turn down the job if offered. This was a clumsy way of representing the point and clearly a step too far, but the core truth was valid: ahead of the defeat at Arsenal, Solskjaer had been riding the top of the wave. Some that were offended by stats jumped in to the debate too, including ESPN editor Alex Shaw, who opined that:
Just seen someone say Solskjaer may not be the right man because 'United are out performing their xG, long term that will revert.' What a joyless phrase that is.
One person’s joylessness is another’s useful information. Again, to reiterate, Solskjaer has improved Utd, but arguably only to a level that matches their undeniable talent, so in the mix behind Liverpool and Manchester City for the top four. Whether he can take the job on and move them up to the next level--to challenge for the title--is a key point. The gap to bridge is enormous, and will be for anyone. Man Utd still hold many of the same problems they did under Jose Mourinho, yet harbour ambitions of the highest realm. Aspects of the squad are aging and the defence appears to need remedial work, in truth it has done for years. That improvement will be a challenge and with Liverpool and City well bedded in to long term projects, it doesn’t feel like they will be careering back to the pack any time soon.
StatsBomb editor Mike Goodman noted that this round of “xG versus the world” featured a distinctly broader base of invested parties and perhaps that this represented progess. And that’s a healthy move. The stylised nerds against Real Football Men war may well rage on, but an increasing group of younger, engaged fans and people involved with football are interested in any aspect or analysis that broadens out their knowledge. Expected goals are well past the realm of niche outsider chat, for all that it probably hasn’t reached your dad’s mates down at the golf club. The future has arrived, as it tends to.
The essential wins created by following and understanding the numbers are frequently obvious and arrive often: Man Utd were always highly likely to drop back this season, Arsenal’s underlying quality was not very well reflected by their unbeaten start, Dortmund were never away and clear in Germany, Real Madrid are a declining unit full stop. There are further elements that are showing themselves even more recently as both Liverpool and Tottenham’s results quieten down to varying degrees. We can easily understand that both were ballooning over expectation throughout the autumn and early winter:
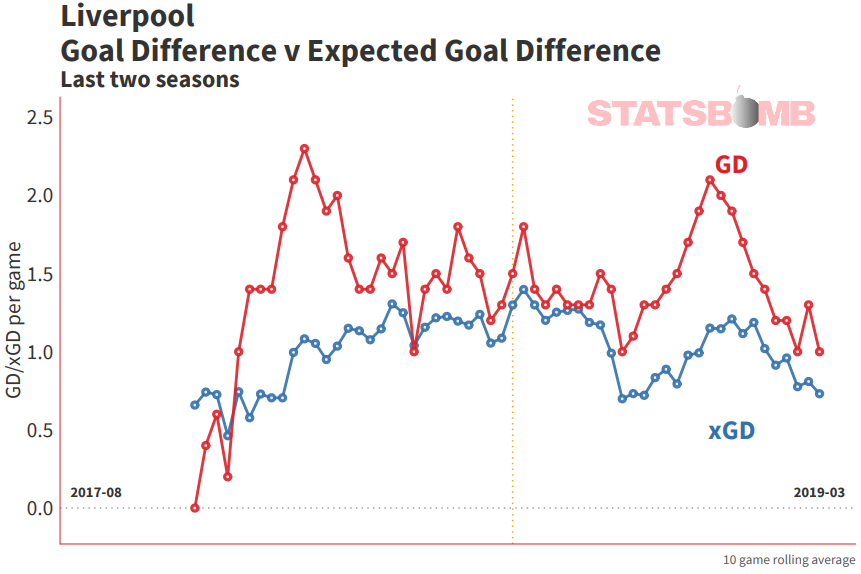
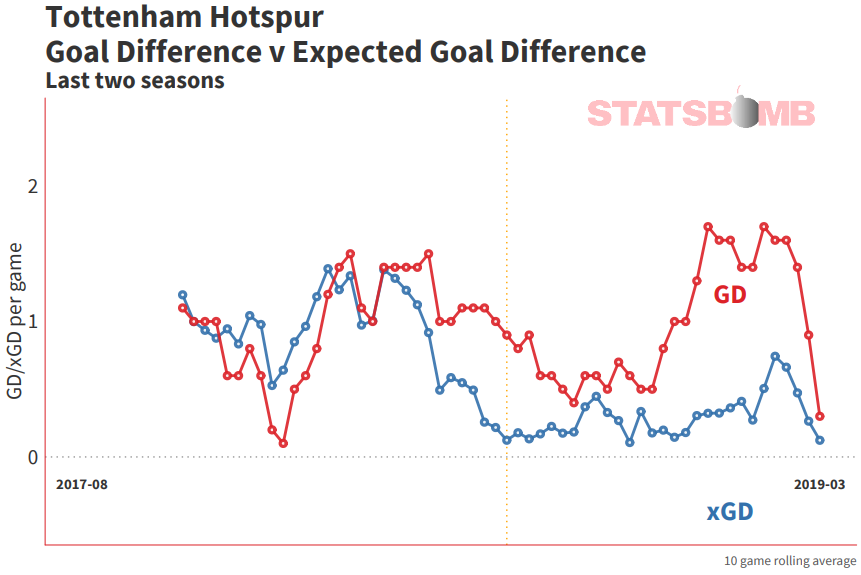
All the narratives exist in the difference between the red (reality) and blue (expectation) lines. However, the blue (xG) line gives us a strong idea of a team’s definable quality and quickly shows us that Liverpool are very good, but also that they were last season. Has the team actually improved? Now that’s hard to say. For Tottenham, the reality is rose-tinted, while expectation shows tangible decline. That they have hit a bumpy patch eventually in this season, feels long overdue, especially given issues around multiple injuries and a lack of squad reinforcement. None of this is to denigrate the enjoyment of the game, and you will find that people who are engaged in this stuff are every bit as interested in the sport as those that aren’t, perhaps moreso.
For players it can be more nuanced: Harry Kane’s shooting flagged him as a Premier League starter quickly, Cristiano Ronaldo’s goal drought during 2017-18 was always going to fade out as long as he was peppering the goal. It can work otherwise too: Marcus Rashford never had the shot volume to match his early goal totals when he broke through in his first season. It’s only now having been empowered into a striking role with an engaged manager in Solskjaer that we have seen his shot and goal volume enter the territory where he is no longer just an attractive attacking prospect, he’s now an attractive goalscoring prospect too.
Rashford’s emergence at such a young age mirrored that of Raheem Sterling. That they were even on the pitch for top clubs at early points in their development was a huge signifier. Sterling’s best season in a pre-Pep Guardiola world was arguably for Liverpool in 2013-14 but how did we really know that he had made the leap into becoming one of the league’s top performers in 2017-18? Clutch goals helped the casual fan notice, as did the sheer volume of goals, but plenty of players have hot scoring streaks. The reason we knew he was now undeniably the real deal was that the goals and creativity were backed up by the expected numbers, so more than likely were sustainable. Between 2016-17 and 2017-18 his expected goal contribution nearly doubledl. That's huge. These rates have continued this season too. The kid grew up and delivered.
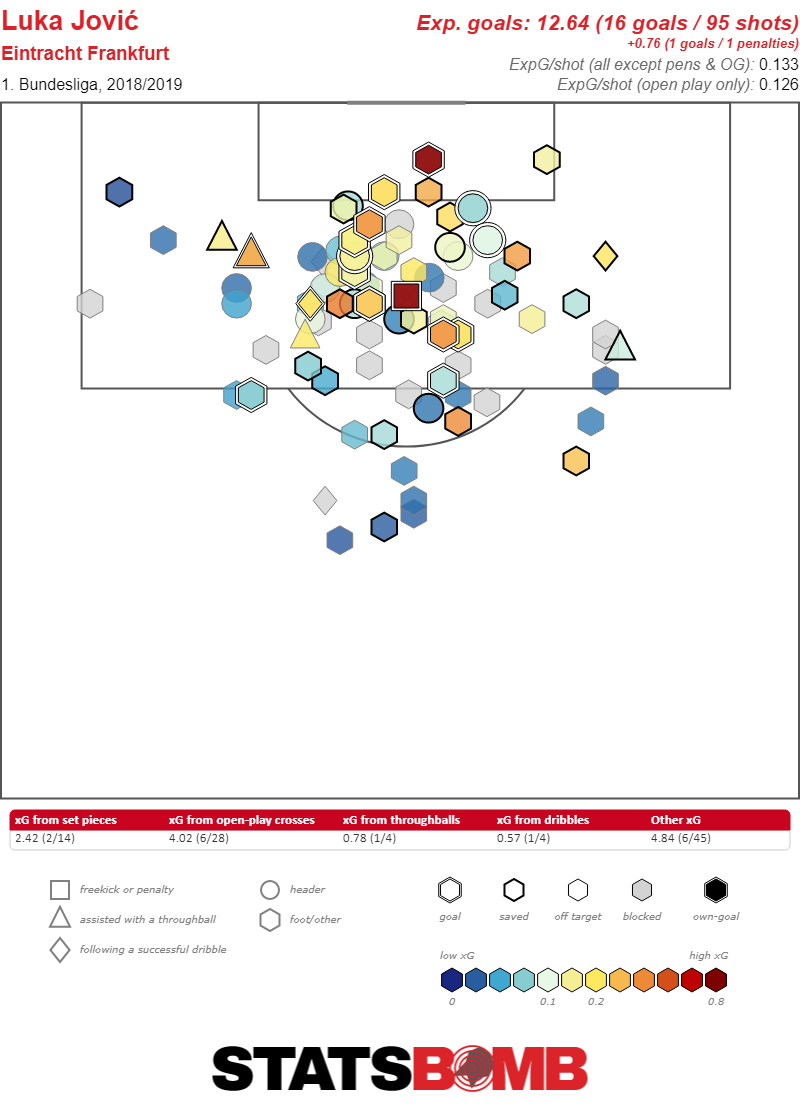
Expected goals do help us make solid preliminary evaluations. Luka Jovic has had two goal filled seasons at Eintracht Frankfurt, and he has both good expected numbers and looks to be overshooting expectation:
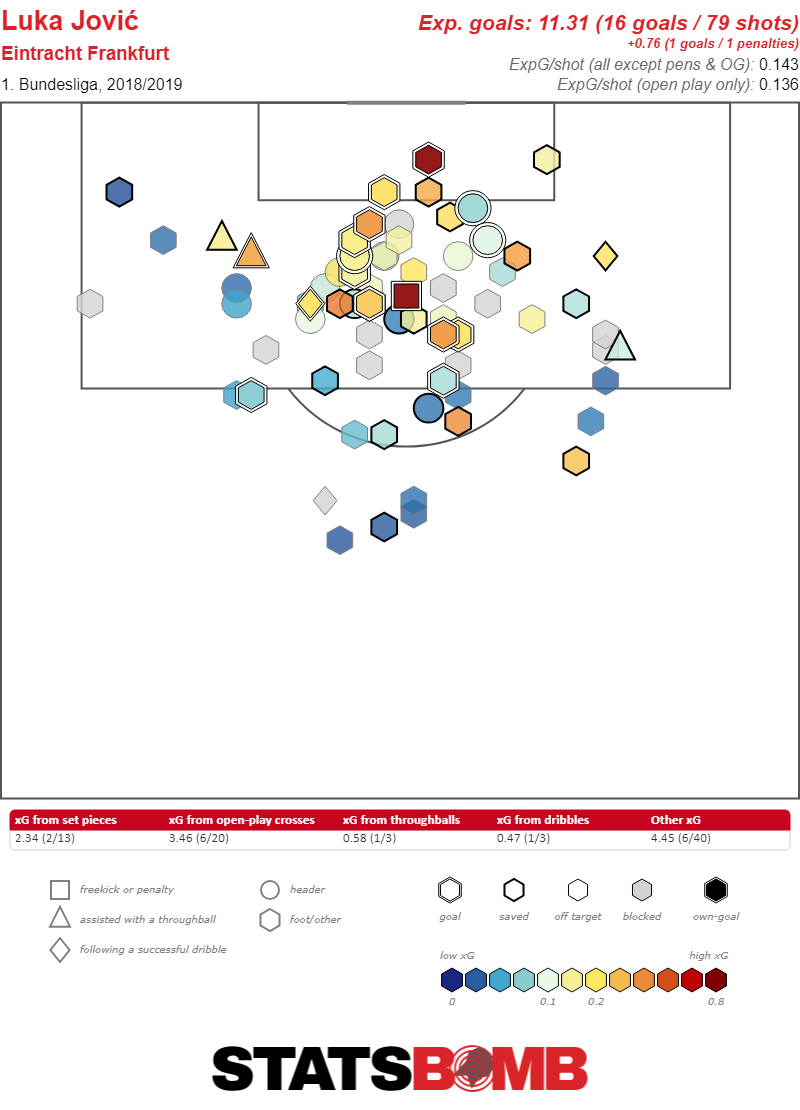
The main point here is not a fear of unsustainable overachievement, but that his expected totals are extremely solid. For a 21 year old to be recording around 0.6 xG per game is a hugely positive indicator and that his goalscoring has landed on the positive side of that is a bonus. It's no wonder he looks to be attracting attention from Europe's top clubs as a versatile scorer who can shoot with either foot or his head, and scores freely.
But he's an obvious pick. Elsewhere, Lille’s Rafael Leão is intriguing. He has seven goals in Ligue 1 this season and at just 19 years old, there's certainly a touch of the Rashfords about his early profile; even moreso when you realise his shot volume (just over two per game) and expected goals (0.30 per 90) are more modest than his outputs (a goal rate of double that).
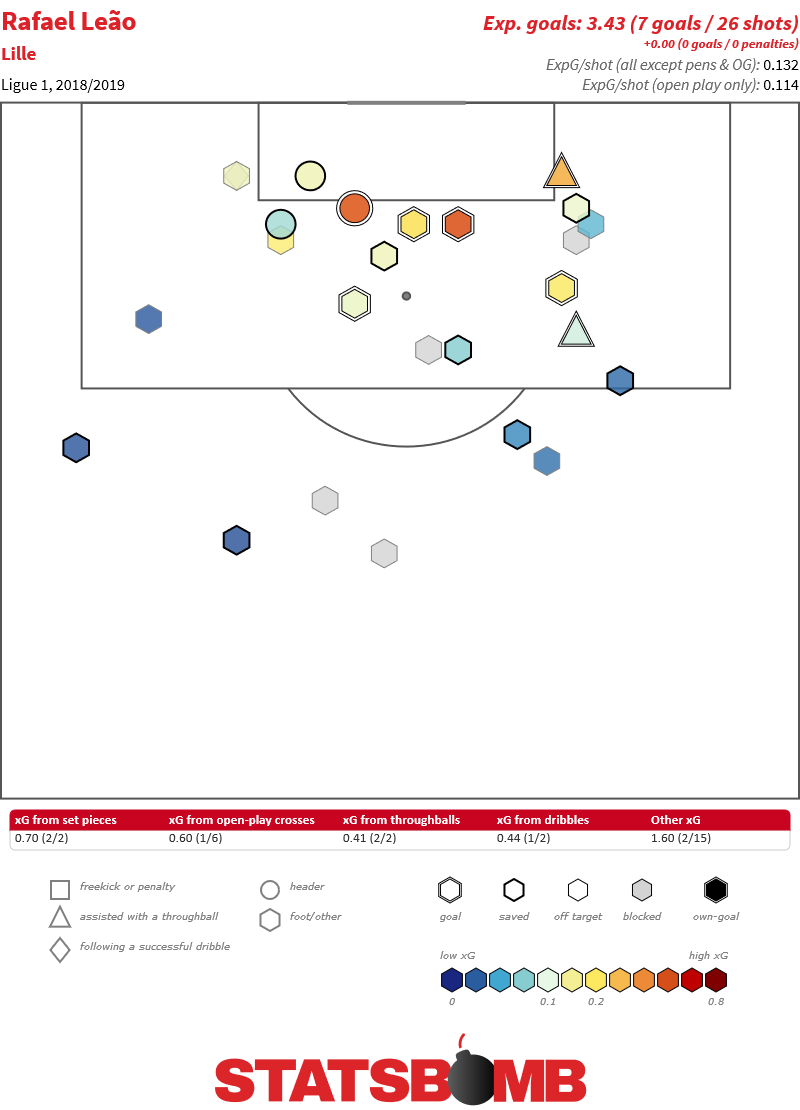
That’s not to denigrate his achievements, and you would certainly look at him as a young talent, but despite the goals, it could be that he is more of an forward prospect than a goalscoring prospect. He has converted most of his decent probability chances and expected goals helps us rationalise the expectation.
Expected goals also showed us Mohamed Salah was likely an elite player when he joined Liverpool rather than the Chelsea wash-out that many idle viewers thought. They backed up that he was having a season for the ages in 2017-18 too on two levels: his rates were superb but also that he was overshooting them. They also helped us understand that he was performing at a fairly similar level this season, and that a more “normal” goal return--which has still been enough to be high in the scoring charts--was more than fine too.
In fact Liverpool’s elite three man strikeforce as a whole are an informative case. Between them taken as a total (obviously they weren’t on the pitch 100% of the time) their expected goals per 90 were a combined 1.28 per 90 minutes in 2017-18 while their actual goal output was 1.73. This season their expected output is basically the same (1.24) while their output is 1.44. Everything around this conversation is elite, but to suggest that they’re less productive because they are exceeding expected goals by less than before fundamentally misunderstands the variable nature of finishing. Different levels of “great” are still great.
I started writing about football analytics in March 2014. Five years on, the uptake has been enormous, and what was once niche has found its way into the mainstream. There still remain challenges to broaden out analysis outside the expected goal framework, and to ensure that the key concepts are understood and not misused, but we have more and better information at our fingertips in 2019, and there is no excuse for the old tropes (“my grandmother could have finished that”) to take precedence any more.
Man Utd should give Solskjaer the job, but they should also give it him with a realistic expectation of what he can achieve in a given timeframe. They have a large upwards gap to traverse and it will take them time even if they get everything right. As one of the world’s wealthiest clubs, they should have a long term strategy to achieve those goals. Now, who is going to decide which players they buy this summer?
An Overview of Pass Heights In the Premier League, English Football League and Scottish Premiership
StatsBomb’s dataspec was designed with a view to capture more of what happens on the football pitch. To that regard, passing was an area in which it was felt that improvements could be made from the perspectives of simply recording how the game is played right through to the functional utility of applying analytical processes on top of that data.
Pass footedness is one of the primary upgraded features of StatsBomb data and a useful indicator for player evaluation, but today we are going to look primarily at graded pass heights. Passes within StatsBomb Data can be either "High" (above shoulder height), "Low" (below shoulder height) or "Ground" (self explanatory). For some added clarity we will omit headers from the following charts. As you will see, team and league styles can be quite pronounced.
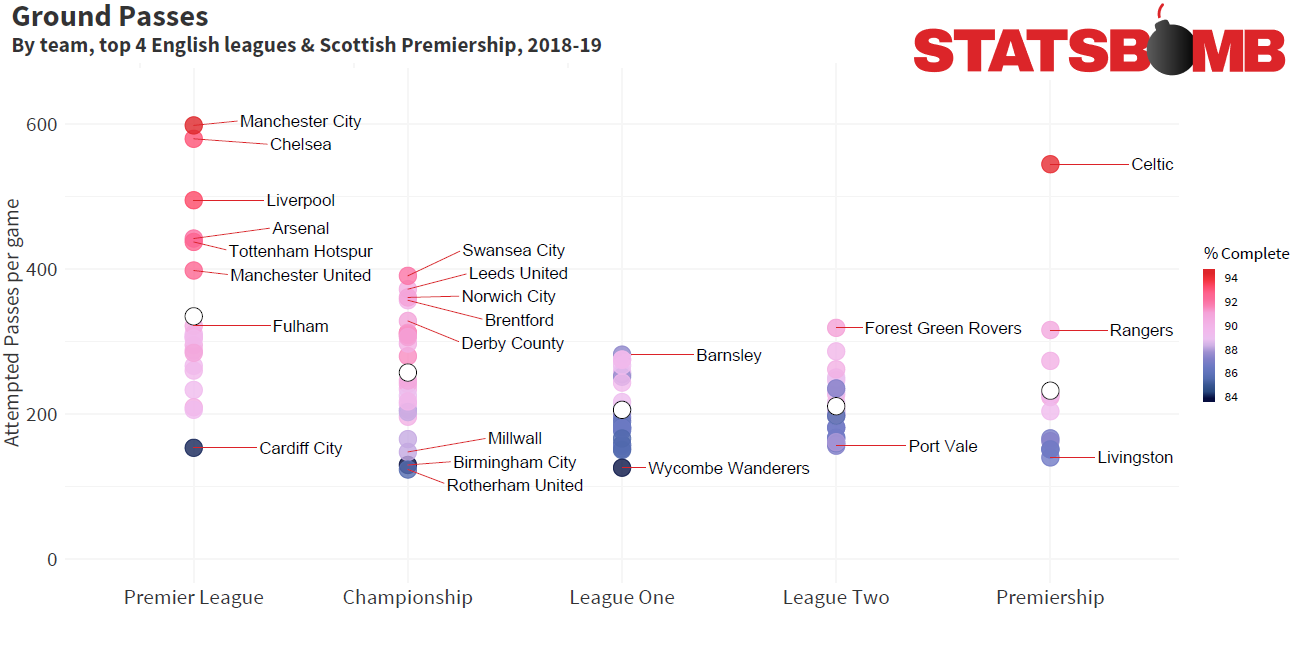
One of the benefits of collecting data across the entire 92 Premier League and Football League clubs, as well as the Scottish Premiership is to enable stylistic comparisons. We can see that at least in relation to the volume of ground passes. The big six Premier League clubs are in a league of their own--as are Celtic in Scotland. This is no surprise, but as we move elsewhere, there are further intriguing comparisons: Cardiff are complete stylistic outliers in the Premier League this season, and their completion rate here of 83.6% is third lowest of all 104 clubs in the sample.
That's a full six percent beneath the rates that Crystal Palace (89.7%) and Newcastle (89.9%) connect with their ground passes. Of course opportunity impacts volumes, but we see that the Championship possesses a clutch of teams that focus on a ground passing strategy: Graham Potter's Swansea, Marcelo Bielsa's Leeds United, Daniel Farke's Norwich City to name just three. One stylistic feature not shown here that emerged strongly from Leeds' overall profile was the high volume of low passes attempted; with over 48 per game, they try a full six more than any other team listed. With Bielsa ever interesting as a manager to study, this statistical quirk could well be worth further investigation. Far more compressed are Leagues One and Two.
They appear similar in general scope, but surprisingly, League One sees a slightly lower average volume and completion rate for both low and ground passes. Individual teams that stand out are Barnsley and Forest Green Rovers, both organisations that have forward thinking inputs, despite their relative positions in the league ladder. Discussions around the quality of the Scottish Premiership often yield arguments, but at least here, stylistically, the pass volumes and completion rates look more like the lower two leagues than the Championship, with Celtic a considerable outlier.
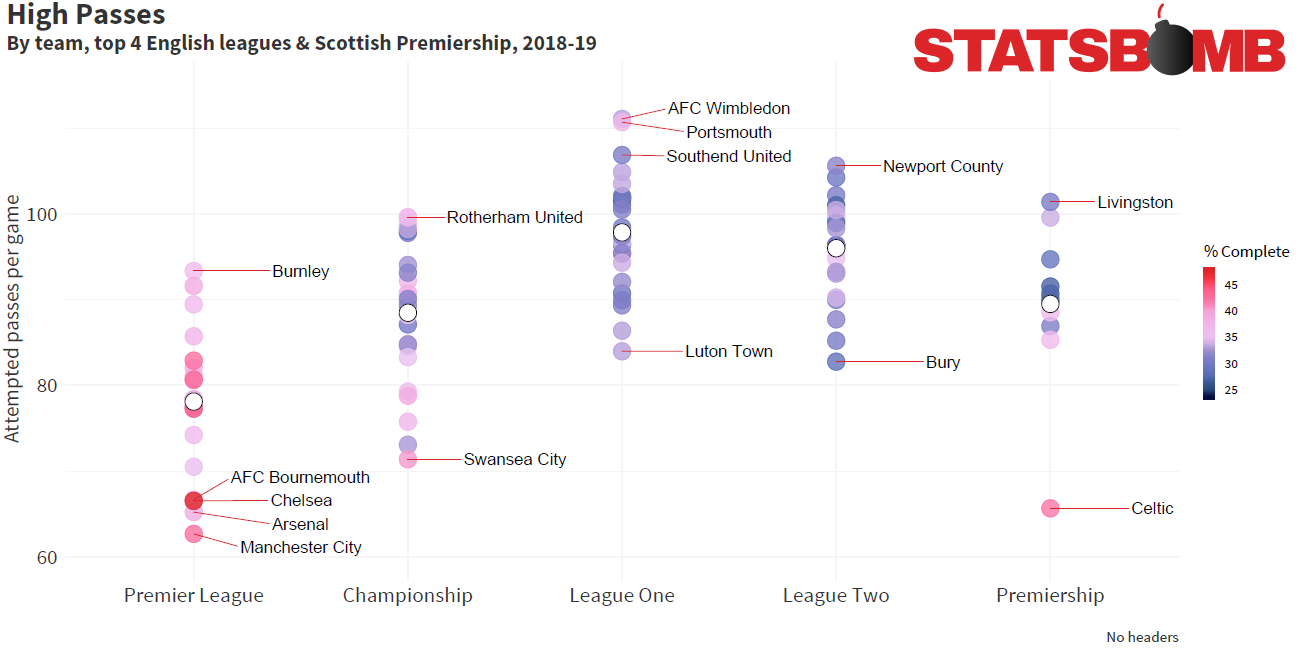
If we flip this to high passes, again clear distinctions between the leagues are apparent. Have Swansea refound the Swansea Way? The last two charts imply that they might have. Celtic once more look different to everyone else in Scotland and Leagues One and Two are again very similar in profile. One standout trend from this whole chart is the way that pass completion rates of high passes trend differently to ground passes.
In the last chart we saw a fairly simple and logical correlation between the volume of passes attempted and completion rate (r=0.84), here we see a weaker negative correlation (r=-0.50) but also what appears to be a skew towards completion rates for high passes at their highest in the Premier League. This offers ideas around player quality, both in passing ability and the ability to make space to attempt and receive such passes. Again logical, but nonetheless distinct.
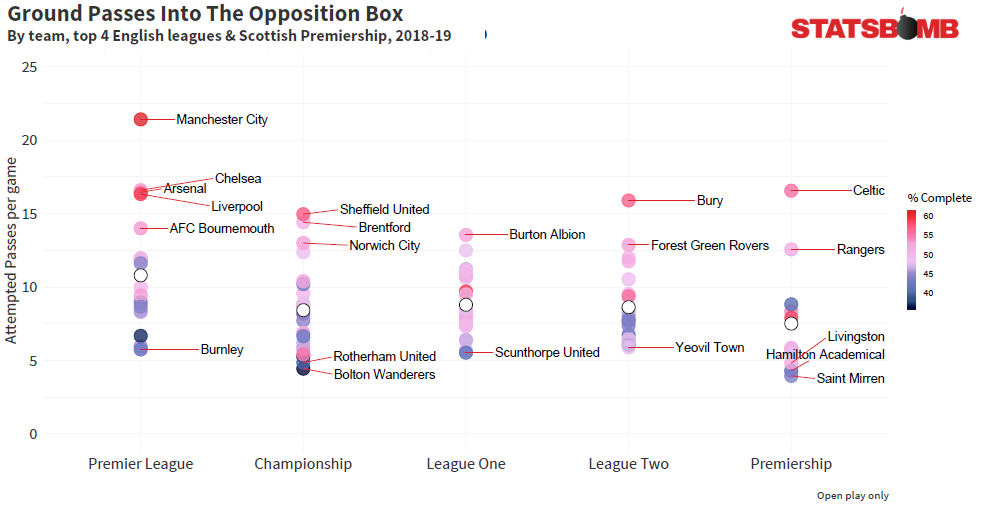
To get ideas around attacking intent we can extend our look into passes into the box from open play. General trends persist and once more most of the big Premier League clubs and Celtic stand out. But what of Bournemouth? Or Sheffield United, Burton or Bury? All clearly use a ground based philosophy when attacking their opponents' box and appear to have reasonable success.
At the other end, teams are attempting just a handful of such passes and completing barely any. These are teams that likely use the set-piece as a weapon or prioritise higher balls over low and ground passes. Overall trends we saw in general play appear weaker when filtered down to this level.
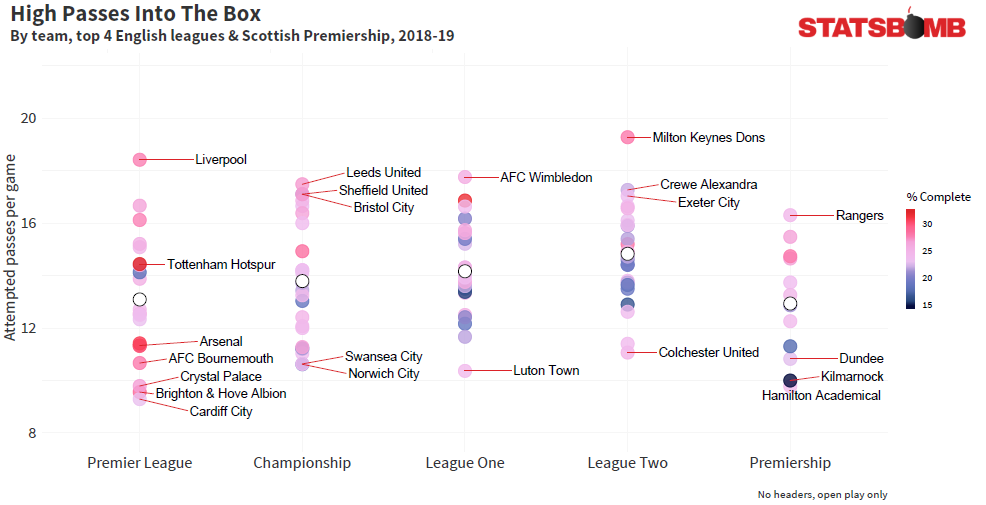
Now we see genuine stylistic curiosity--recall these are open play box entries via high passes. Would anyone expect that Liverpool would lead the Premier League numbers here? It's clear that they are well capable of attacking the box either on the deck or aerially and they show high volumes for both. Tottenham and Arsenal both show up less so for volume but for the rate in which they complete these type of passes.
Swansea are disinterested in this method as are Norwich, but Leeds--purveyors of high "ground pass" and "low pass" volume-- frequently put the ball in the air in the final third. Sheffield United, like Liverpool, show a varied and successful method of box entry. AFC Wimbledon and MK Dons top their respective divisions showing that regardless of which direction the club went, the old Wimbledon way looks to have persisted...
Hopefully this look at pass heights has offered some insight into how considering trends within the whole league pyramid can be informative. We've just scratched the surface, but when recruitment is so often local, it makes sense to understand the dynamics of teams across a whole market, and detailed data such as that collected by StatsBomb can help identify teams that play preferred styles for loan opportunities too. Look out for more of these charts on the twitter feed soon.
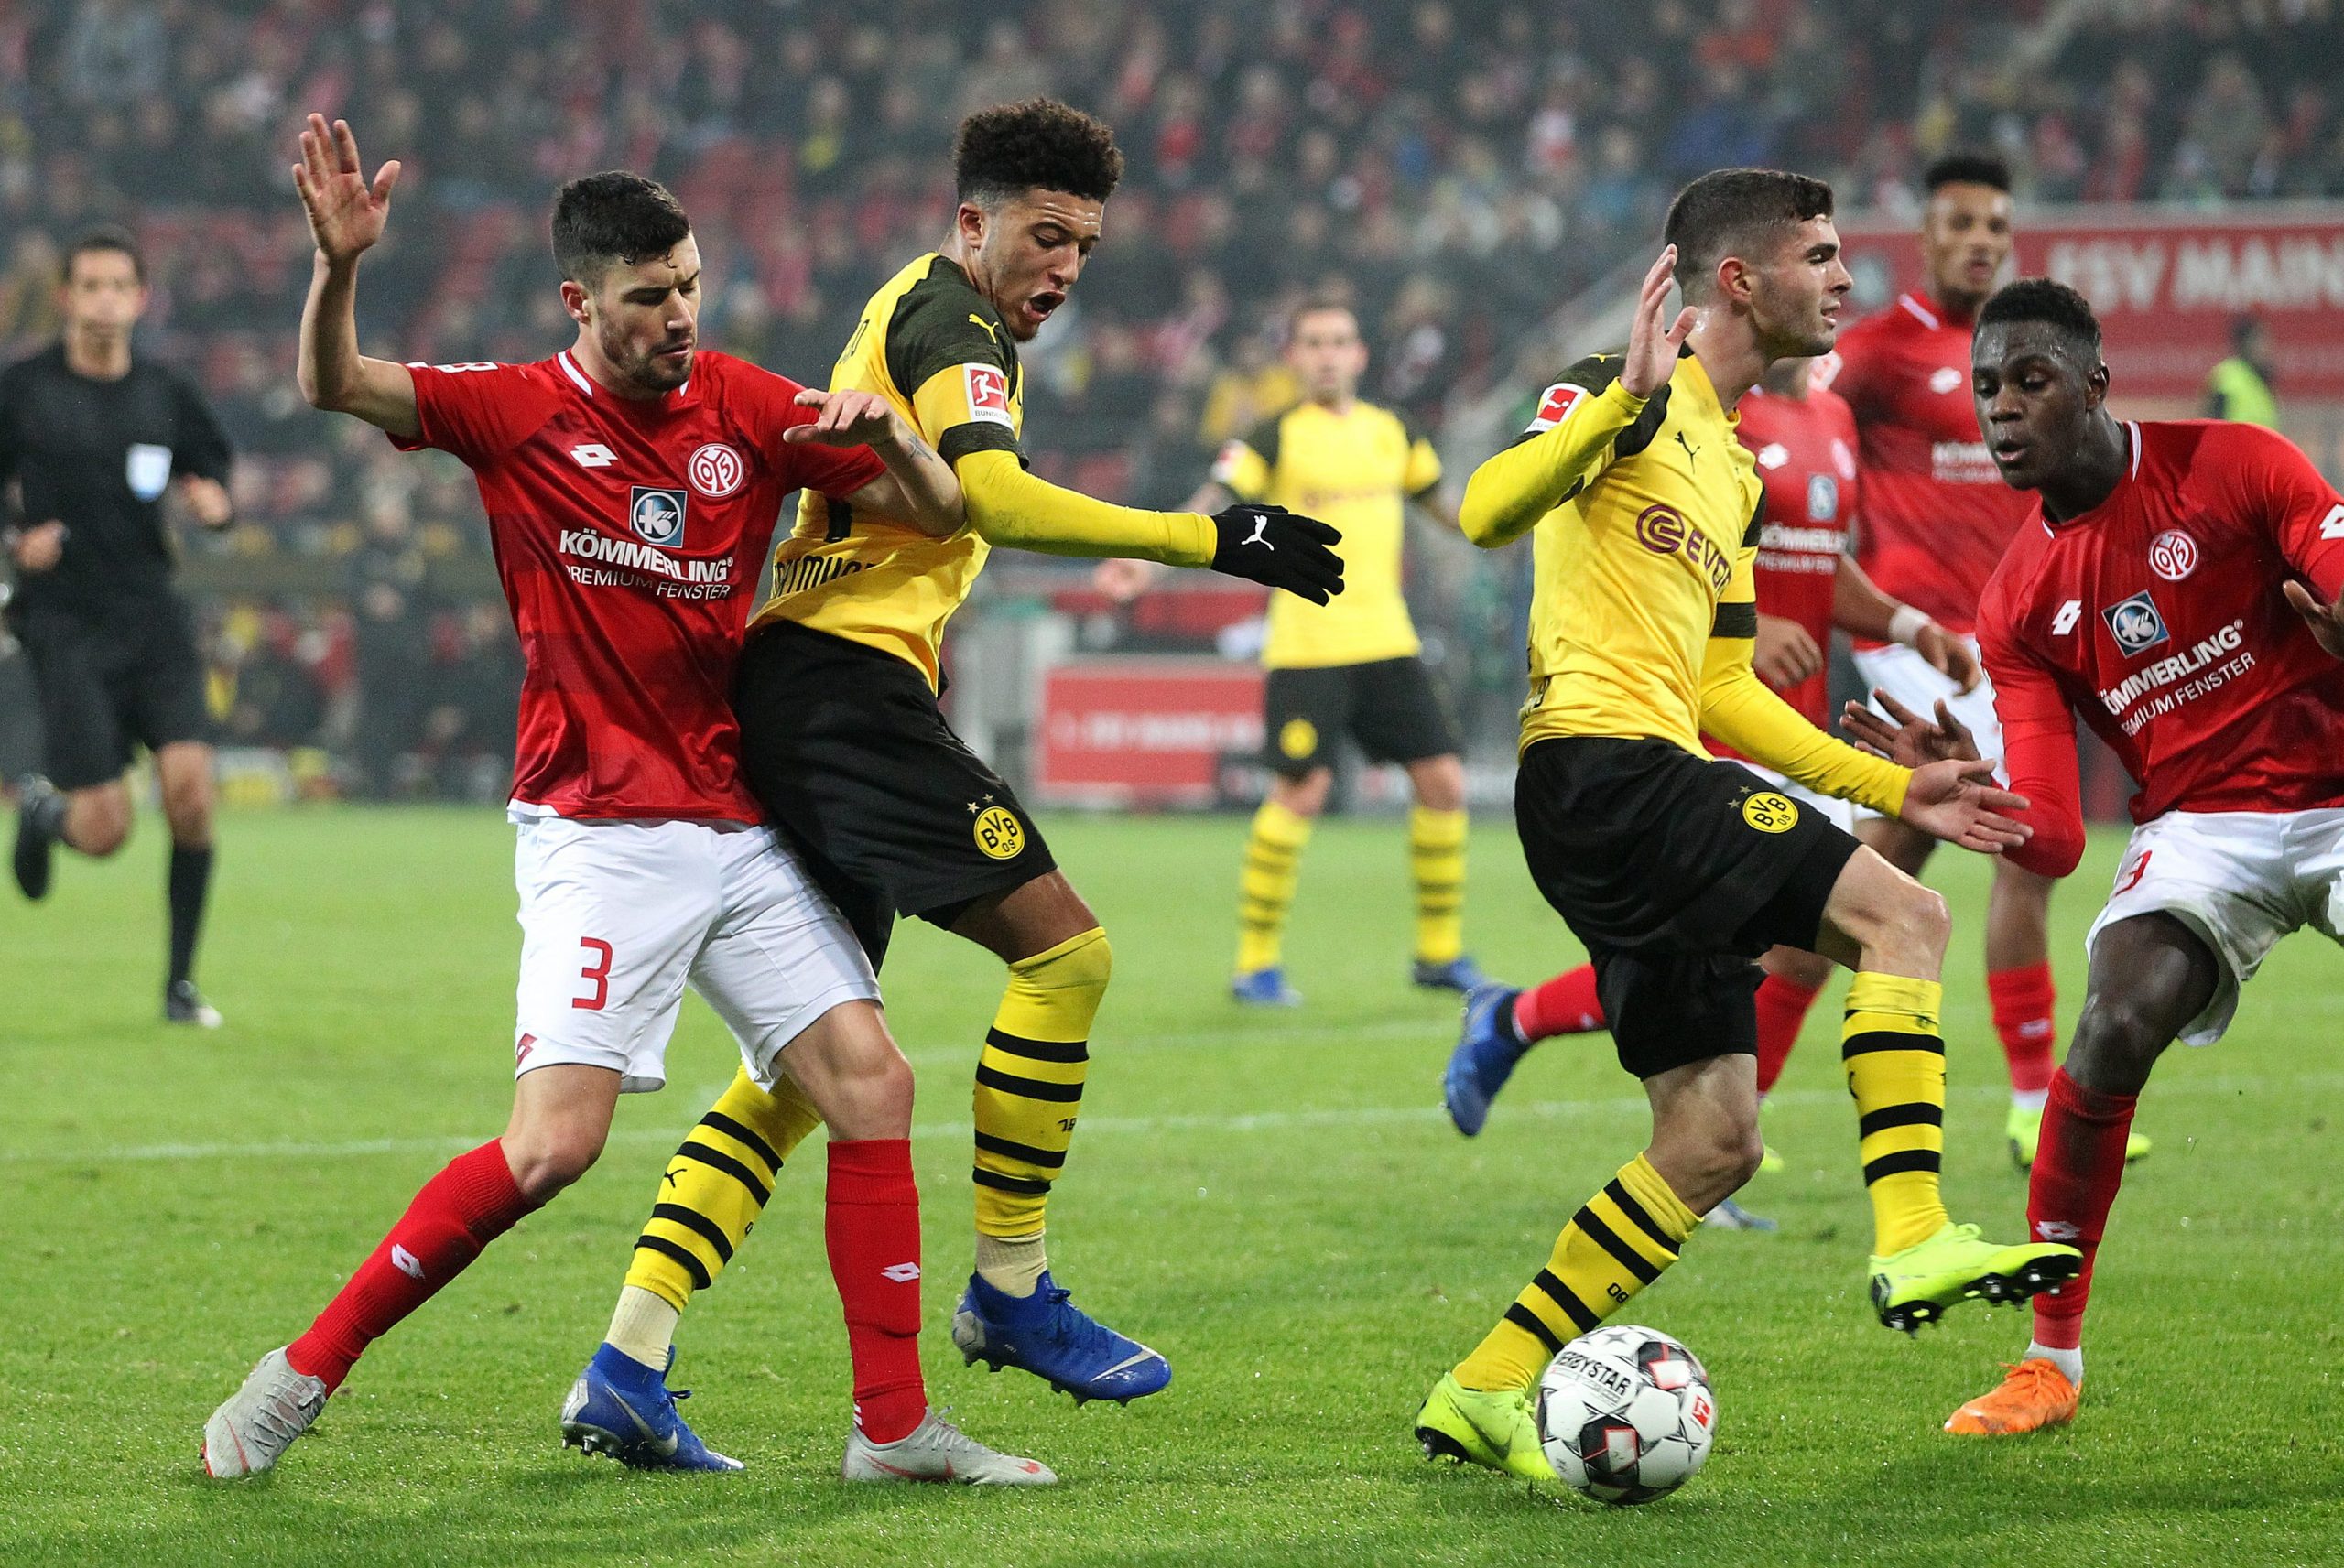
Christian Pulisic Is Very Good. It’s Just That Jadon Sancho Is Amazing.
The only thing people love more than heralding new, exciting young talents is discarding them for newer, more exciting young talents.
This is the story with Christian Pulisic and Jadon Sancho. Way back in the final stretches of the 2015/16 season, when it looked as though Thomas Tuchel could build a dynasty at Borussia Dortmund, a 17 year old Pulisic was beginning to receive some minutes off the bench and looking rather interesting in the process.
The following year, he managed to become a more integrated part of the side and managed to get everyone excited. The United States had produced its first great men’s soccer player. The rumours of a big money move to the Premier League were abound. The world was to have a new superstar. Then Sancho turned up in Dortmund and stole his career.
Let’s track back on that slightly.
Sancho arrived at Dortmund from Manchester City in the summer of 2017, with the then 17 year old having to wait until the second half of the season to get on the pitch, just as Pulisic did at the same age. In what was a mess of a Dortmund side, he took to the Bundesliga like a duck to water and established himself as the poster boy for young Englishmen plying their trade in Germany.
He initially started this season on the bench, but a string of great performances as a substitute ha meant he has forced his way not just into the starting eleven but has become a key player for Lucien Favre’s potential title winners. The player he displaced from the starting line up? Christian Pulisic. Let’s take a closer look at them both to see what’s going on.
Christian Pulisic
In some senses, Pulisic feels like the star of a Dortmund team that never existed. Having been signed by the club as a 16 year old back in 2015, he was clearly groomed for the kind of football we saw from the club under then manager Jürgen Klopp. With Klopp’s reign coming to an unceremonious end, Thomas Tuchel came in with broadly the same principles, albeit a greater emphasis on possession play.
While Tuchel’s first season was built around Henrikh Mkhitaryan, Marco Reus and Shinji Kagawa in the attacking midfield roles, his second saw a changing of the guard, with Pulisic and new signing Ousmane Dembélé now trusted behind Pierre-Emerick Aubameyang. Dembélé was clearly the senior partner here, setting himself up for the big move to Barcelona. But Pulisic showed himself to be well on the way to stardom, combining a terrific natural talent at dribbling through congested areas with intelligent off the ball movement.
Of course, the side’s inability to build on the previous season’s results combined with reported clashes with senior figures at the club led to the end of Tuchel’s reign, though a theoretically similarly minded figure in Peter Bosz was appointed. The less said about Bosz’s reign, the better, and he was replaced by Peter Stöger in less than ideal circumstances halfway through the season. Almost by accident, Stöger began the trend away from the club’s famed pressing game and towards a deeper counter-attacking approach, a move that has been heavily reinforced this year by Favre.
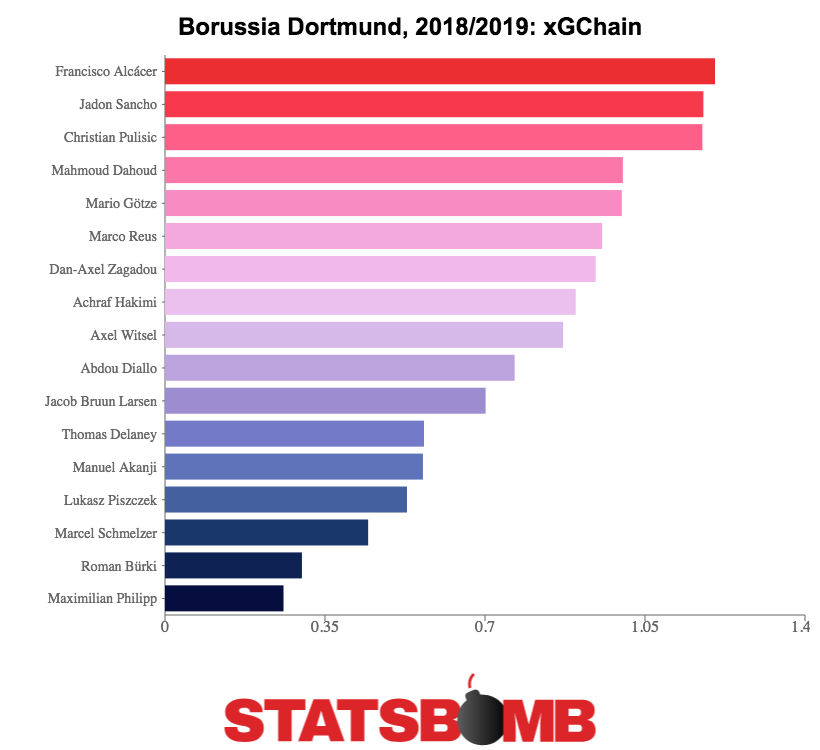
In an alternate world where Dortmund are in the fourth year of Tuchel, it’s easy to imagine Pulisic as a key player. Under Favre, he increasingly seems sidelined. So is he failing to have any impact? Well, not quite. For Dortmund, his xGChain this season remains as strong as Sancho and behind only Paco Alcácer.
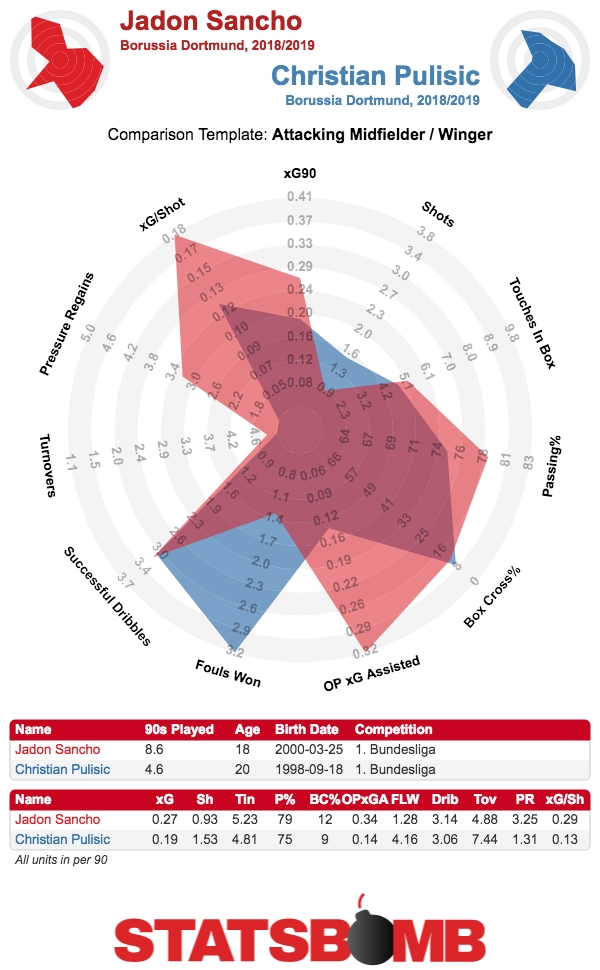
He is involving himself in just as many sequences that lead to high quality chances as Sancho, albeit not in such noticeable and arguably decisive ways as the Englishman. He is dribbling a solid amount (3.06 times per 90) but his expected goals and assists remain fairly middling. Nothing about his creative passing really stands out as much as it perhaps should for his ability in the numbers. It does feel as though he has stalled.
As he matures and evolves his game, it may be that he is more suited to being a ball progressing midfielder than a wide player. In recent weeks, Pulisic has been heavily linked with both Chelsea and Liverpool.
If he were to move to Liverpool, it is easy to imagine a positional evolution similar to Alex Oxlade-Chamberlain, with the American’s skillset well suited to Klopp’s quest to turn stalling attacking midfielders into deeper ball progressors.
The Chelsea move would also have logic behind it, with Sarri’s possession heavy pressing system probably much better suited to the Favre set up. While one could see him as the most advanced midfielder in the 4-3-3, a position currently occupied by Ross Barkley, it’s easy to imagine him as a zone moving wide forward replacing Willian long term and sharing some of the burden currently taken by Eden Hazard.
This could help Hazard become the goalscoring wide forward Sarri wants him to be while replacing some of the ball progression he’s been doing in the past few years. If he goes to either of these clubs, it seems like he could have an excellent career in the Premier League. As it stands, the more ball progressing part of his skillset doesn’t seem especially useful to a Dortmund side who want to move up the pitch quickly with the speed of some of the other attacking players. Such as…
Jadon Sancho
If Favre’s arrival at the Westfalenstadion has been a hindrance to Pulisic, it might have been the best thing that could have happened to Sancho. During the player’s time in English youth football, the player was seen as something of an unpredictable dribbler, someone who could do something truly surprising at any point.
“You get a lot of players in academies who have been coached, but [Sancho] has got that natural street ability where you don't necessarily know what he is going to do before he gets the ball. He then goes and carries it past two or three players with ease”, stated former England Under 16 coach Paul Williams.
“He could be our Neymar-type player – in terms of being unpredictable, playing on that left-hand side”, claimed another former England youth coach Dan Micche. That is, of course, “provided he doesn’t become restricted”.
Favre is, of course, not a manager who likes to play “unrestricted” football. “Efficient” would be a better word to describe his approach, with his continual ability to overperform expected goals in part a feature of compact organisation and getting men behind the ball.
At Borussia Dortmund in particular, this has been accompanied by a counter attack at blistering pace, with relatively little scope for slowing down and overcomplication. This has kept him at a relatively medium 3.1 dribbles per 90, while Micche’s proposed idol Neymar puts up 4.8 and stat breaker Adama Traoré manages 5.0.
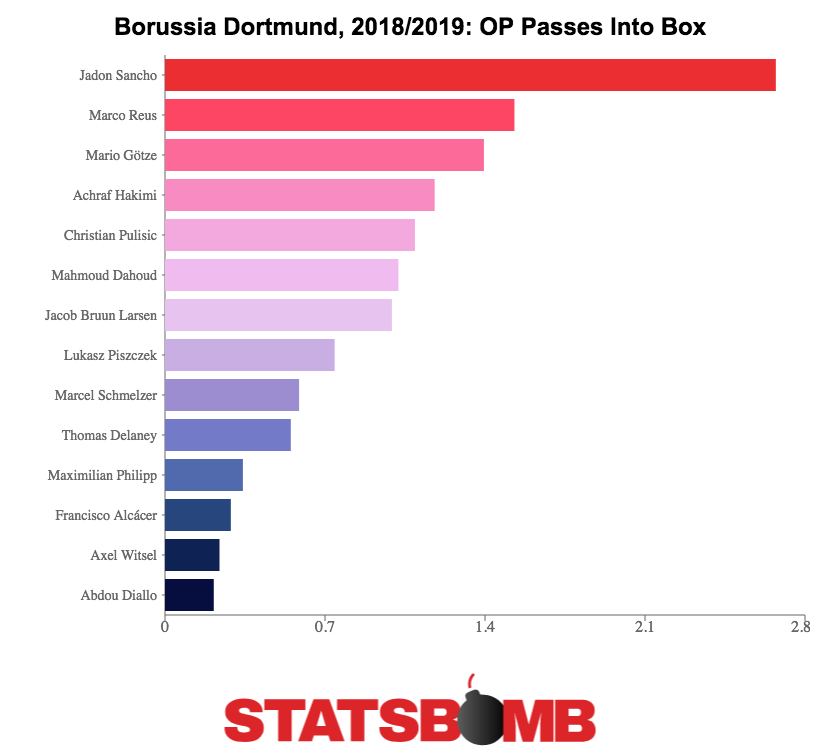
What he is doing a lot of, though, is creating chances, with Sancho assisting as many expected goals in open play per 90 as anyone else in the Bundesliga. He’s also become a key ball progressing cog, becoming comfortably Dortmund’s most frequent player to complete open play passes into the box. This is a team that are top of the Bundesliga and a not insignificant amount of their attacking plan seems to be to give the ball to this 18 year old.
It has at times felt recently as though some particularly gifted young English players have been allowed to be a little too unrestricted. Players such as Jack Wilshere and Ross Barkley have been encouraged to flourish without really being defined to specific roles and tasks, and it does feel as though it has contributed to them stalling, as Barkley himself implied when he admitted he hadn’t been coached at Everton to the extent he is right now at Chelsea.
Sancho, meanwhile, finds himself in a situation where he is being given clear instructions and responsibilities. Though Neymar is the superstar Micche suggested he should emulate, perhaps Sancho might be best off looking at the early evolution of Cristiano Ronaldo. Under the tutelage of Sir Alex Ferguson, a young Ronaldo was taught to generally simplify his game, reducing the “tricks” and becoming a more decisive footballer in the process. While it is unlikely that any player will achieve as much as Ronaldo, this does seem to be the path that he should be aiming for under Favre.
Conclusion
Predicting the path of player development is hard and fraught with elements that are difficult to control. Pulisic seemed to be blazing a path to great success before dipping somewhat in the past 18 months. Sancho is currently defying logic with his form, but it is very possible that he will see similar frustrations in the future.
A player such as Raheem Sterling spent several years unable to perform like he did at age 19 before having a sudden leap in production under Pep Guardiola. It happens. Improvement is not linear. While he has the advantage of being more suited to the style of football, it does feel right now as though Sancho has a higher ceiling than Pulisic.
That Dortmund have tied Sancho down to a new deal while apparently being open to letting Pulisic go suggests the view is the same internally. But this is not a huge indictment of Pulisic rather than an endorsement of Sancho. Both look more than capable of having terrific careers. Bear that in mind if you’re reading an article in two years’ time about how Sancho is struggling to live up to expectations.
Beyond The Narrative: What's The Truth Behind Wolves' Poor Run?
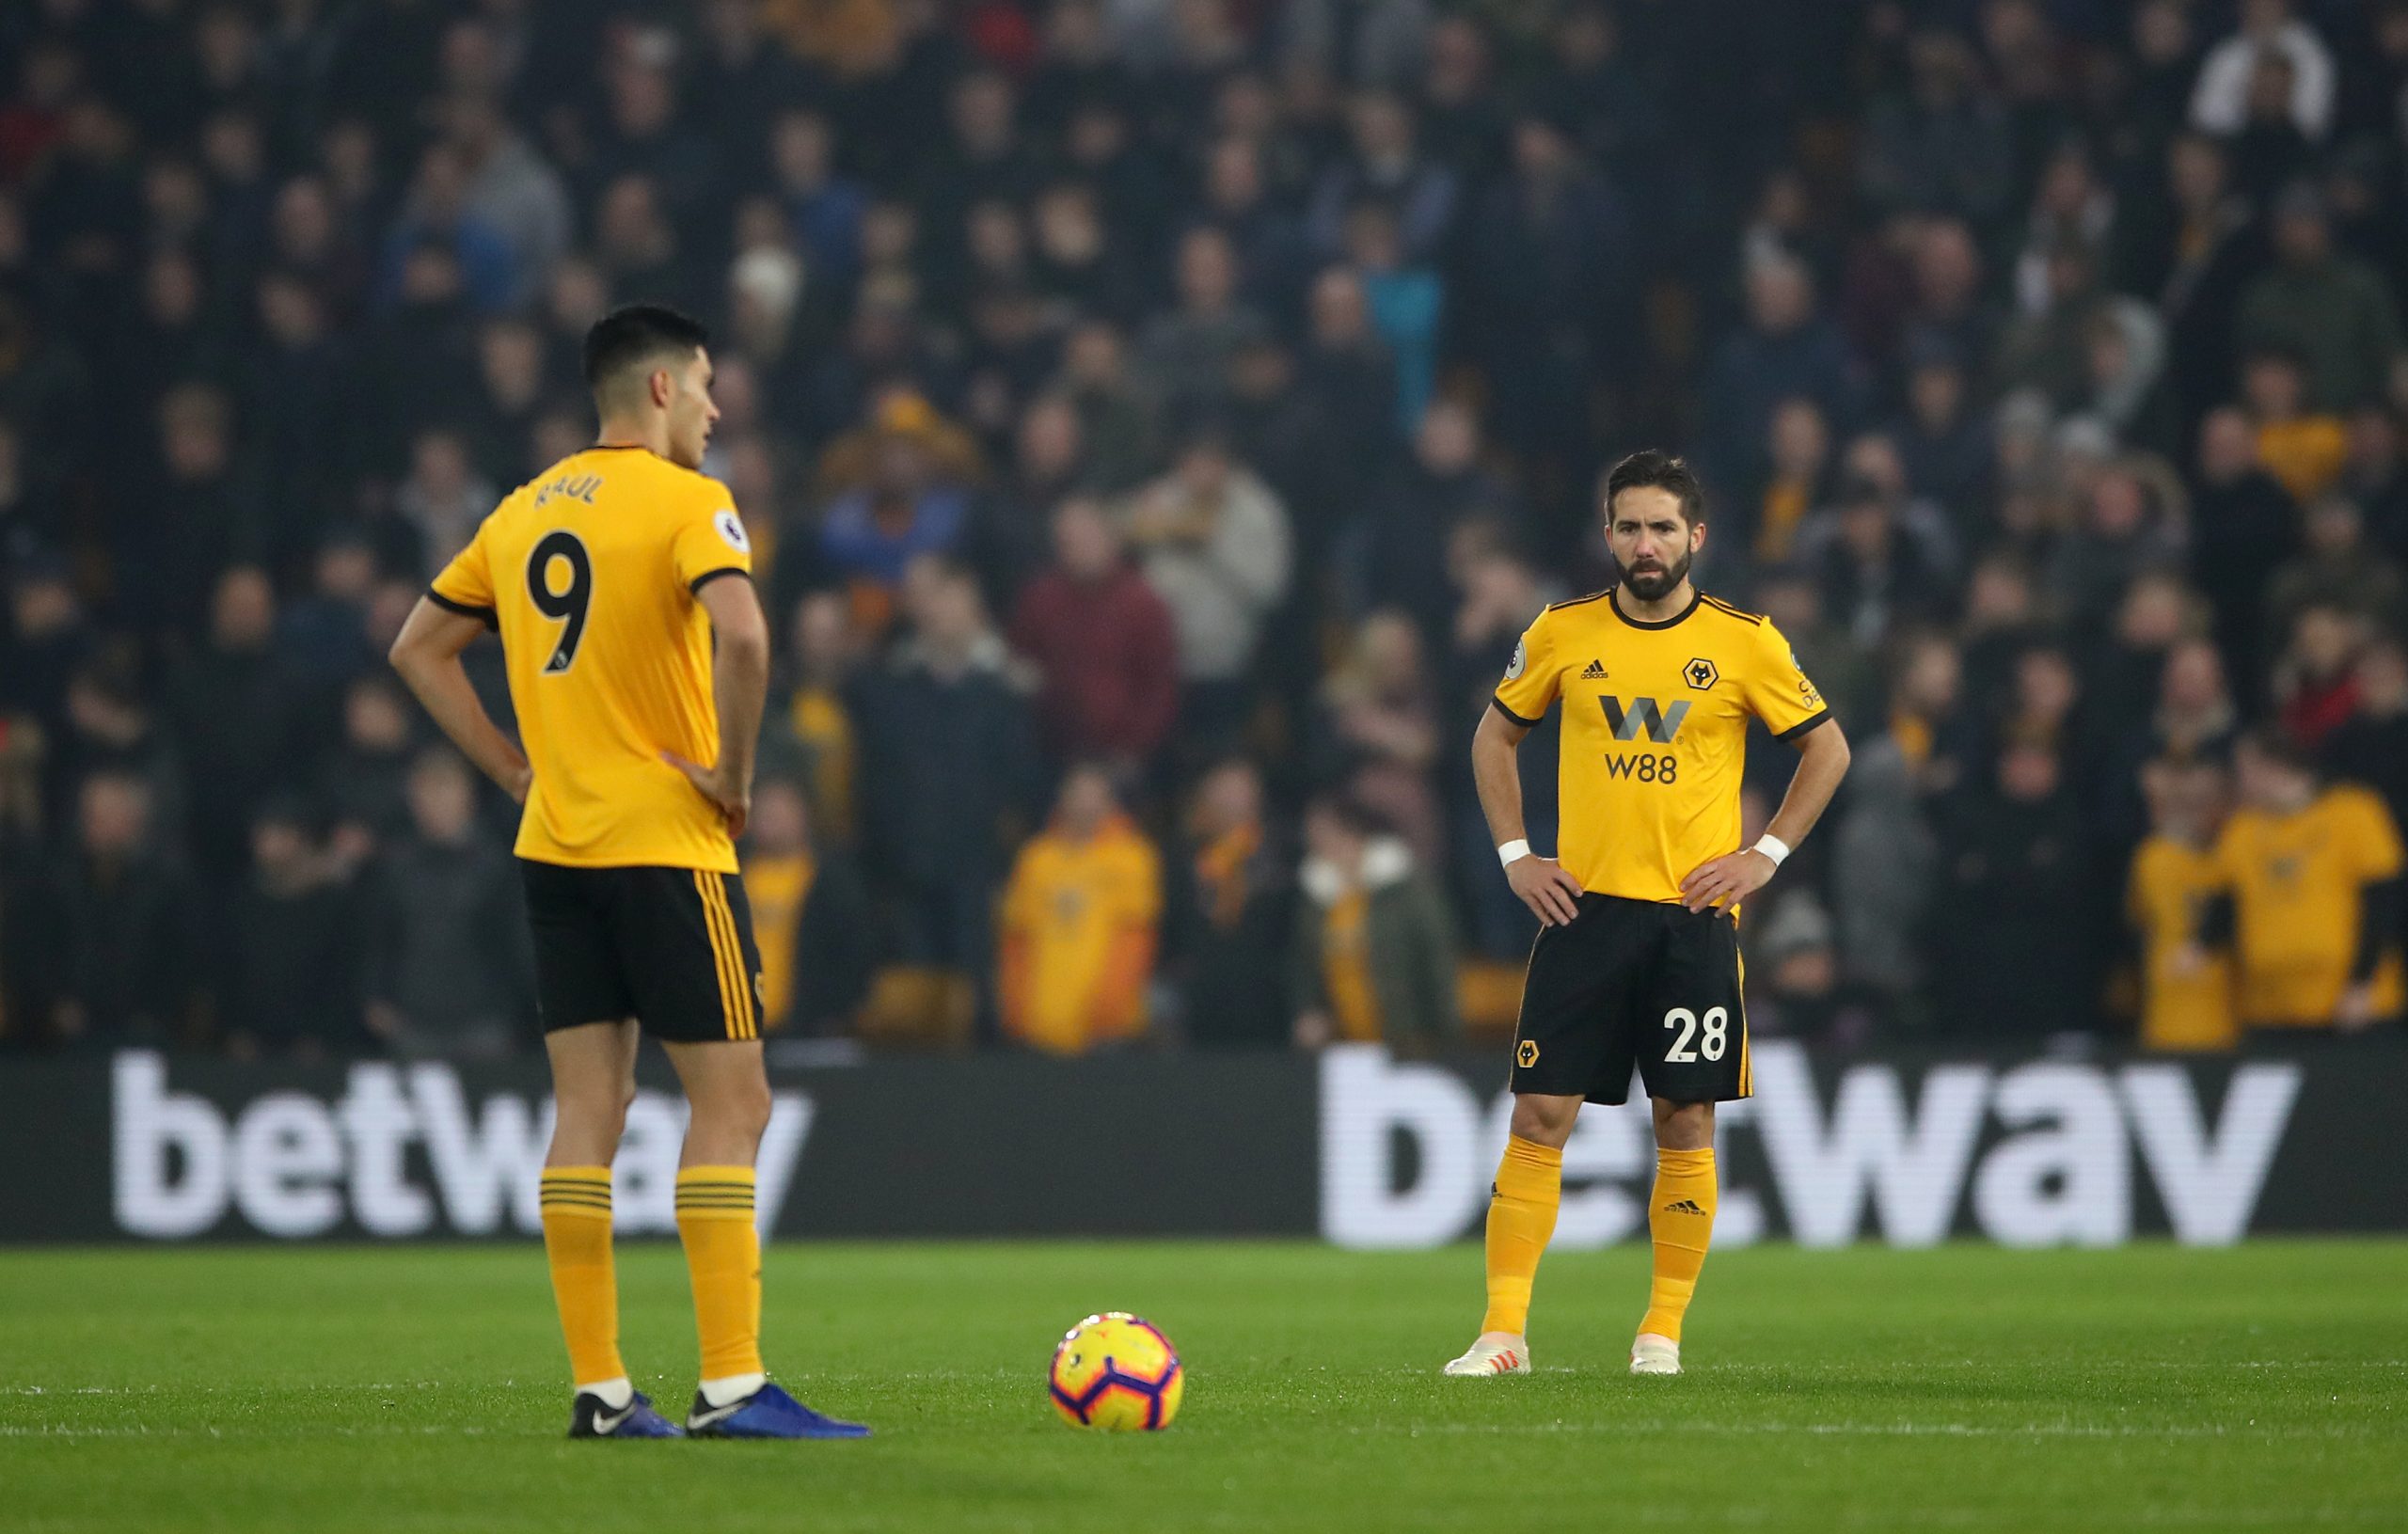
Wolves’ time in the Premier League was hotly tipped to be a roaring success. In recent weeks, the results have waned and they now find themselves down in twelfth place: perfectly respectable for a newly promoted team, but perhaps slightly underwhelming given the pre-season hype. So how good are Wolves?
Promotion and a fine start
Powered by significant investment, the team readily won the Championship in 2017-18 having retained their position at the top of the league from the end of October through til May. The summer saw more investment, or at least a bunch of the previous season’s loans got made permanent, and a sprinkling of class was added on top. The aging but richly decorated João Moutinho arrived to form a “Portugal, Then And Now” central midfield alongside last year’s club Player of the Season Rúben Neves while Rui Patrício gave the team what every newly promoted side could do with, a competent goalkeeper. Football stats fans also got the coin in the Christmas pudding when late on Adama Traoré confirmed a move from Middlesbrough, to continue his love affair with ball carrying and the touchline at the highest level.
And for two months, it went really well.
Draws with Everton, Manchester United and most notably Manchester City were all more than ample reward for a team new to the division, and a 30 shot 1-0 beatdown of last season’s seventh placers, Burnley showed the world that Wolves could compete well at this level. On the 6th October, Wolves sat seventh with a 4-3-1 record and a plus-two goal difference, a shade behind their plus-four and a half goal expected rate:
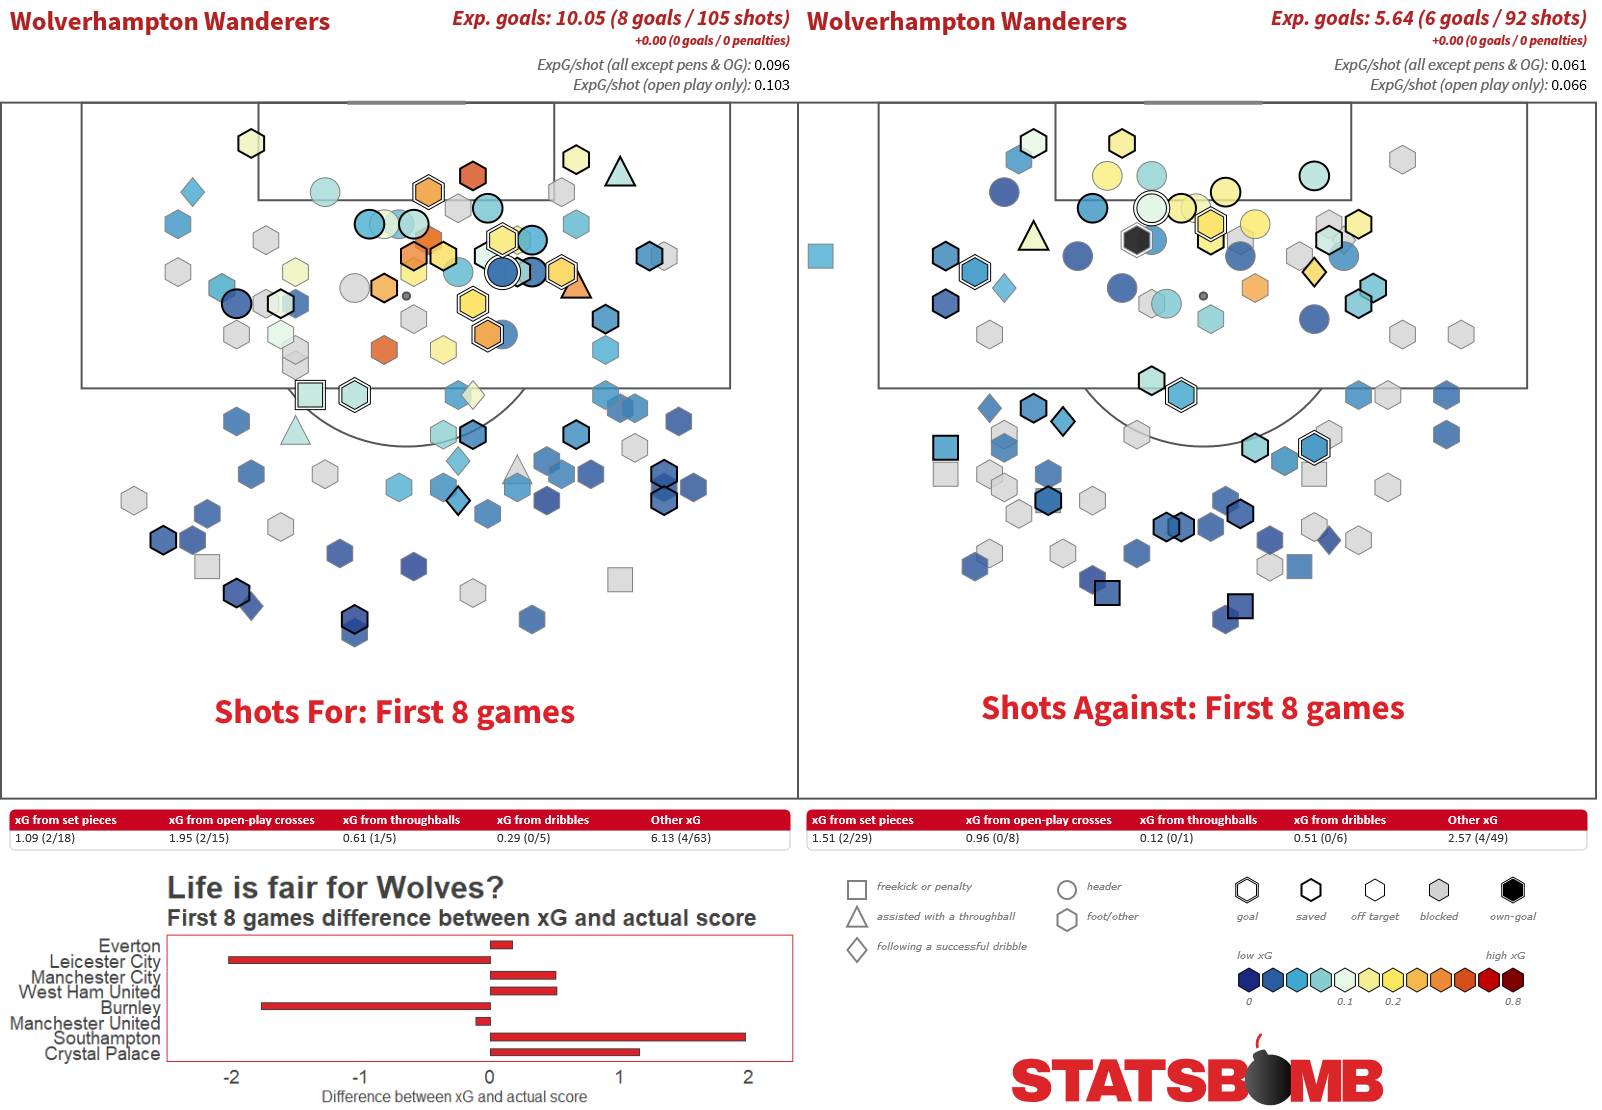
The inset bar chart shows the single game differences between expected goals and the actual score. As is evident, throughout the first eight games, there was a fairly usual split between expected goals skewing in favour or against Wolves.
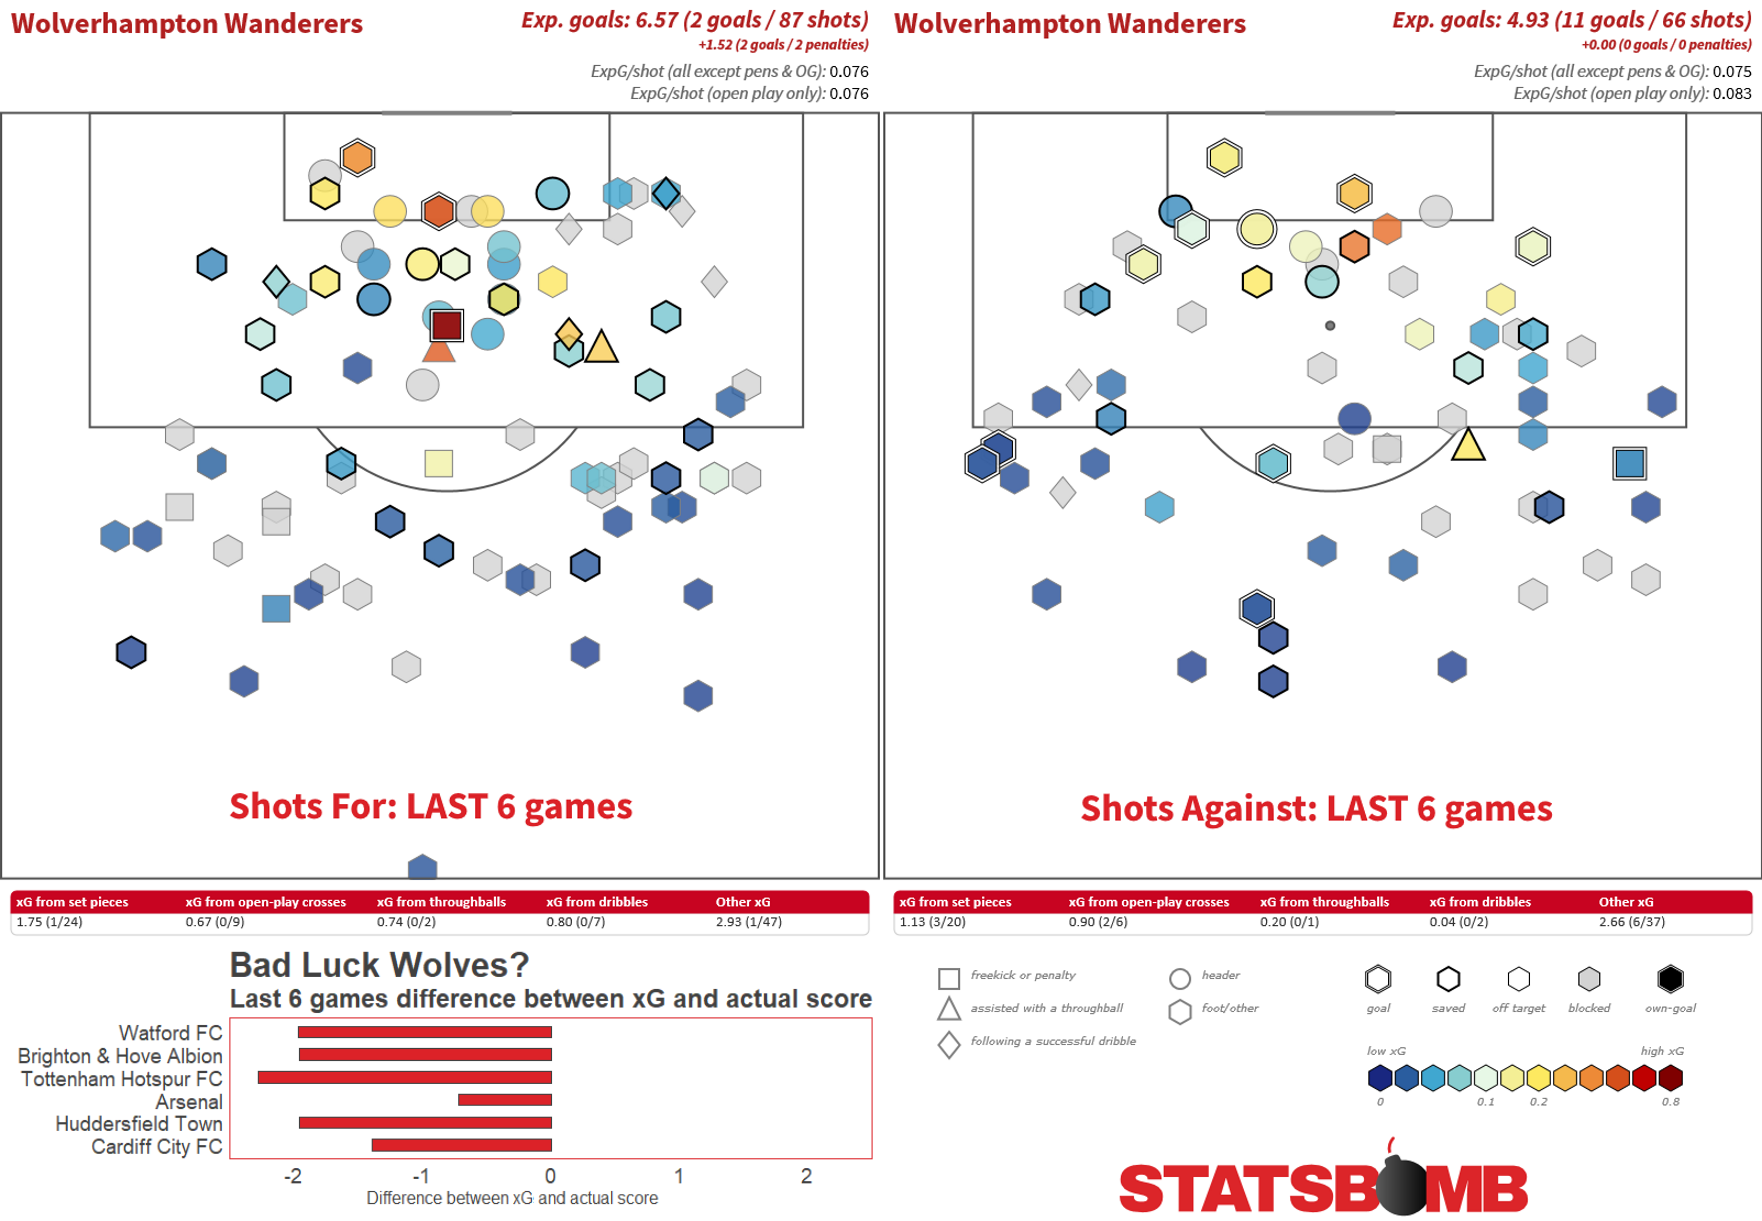
Six games of misery
The last six games have been close to a disaster for Wolves: in a mixed schedule they have lost five and drawn one. There is no shame in being edged out by the odd goal in five against Tottenham and a draw against Arsenal was good, perhaps even disappointing given Henrikh Mkhitaryan’s late equaliser. Otherwise, home defeats to Watford and Huddersfield don’t read too well on the surface and neither do away defeats at Brighton and Cardiff. Yes, Wolves are a newly promoted team, but also these are all teams that they need to perform well against and pick up points. To hit a bad run at exactly this moment is far from ideal, especially given that they host Chelsea and Liverpool as well as the return games against Man City and Tottenham, all within the next six weeks. Points may be hard to find this at times through early winter.
However, the last six games have had an almost comical negative skew for Wolves. Expected goals still likes them--a lot-- and has them (including their two penalties against Tottenham) at about eight goals to five across this period, so a healthy +0.5 xG per game. Reality has taken a far darker turn, with four scored and 11 allowed. Ignore the penalties and you’ve got the overall attack at four and a half goals behind expectation and the defence behind by six goals. And consistent too! Check out the skews in the bar chart subset. Wolves just can’t buy a break right now:
If you evaluate the goals Wolves have conceded recently, quite a few have emerged from the realm of the improbable. Mkhitaryan’s goal was a cross that went the whole way, Etienne Capoue drilled one from thirty yards and Junior Hoilett’s winner last Friday night was the type of hit that might go in once in fifty attempts, possibly less than that if the pace of it could truly be accounted for. That estimate isn’t trivial, they all spec out as between 1.5 and 2.5% chances.
Attack
So we’ve established that Wolves have been on the mother of all cold streaks recently, but the simple interpretation is that their profile isn’t that of a team that will struggle long term. There are two aspects in play though: in attack Wolves look no more than okay but have finishing woes, while in defence they look very solid.
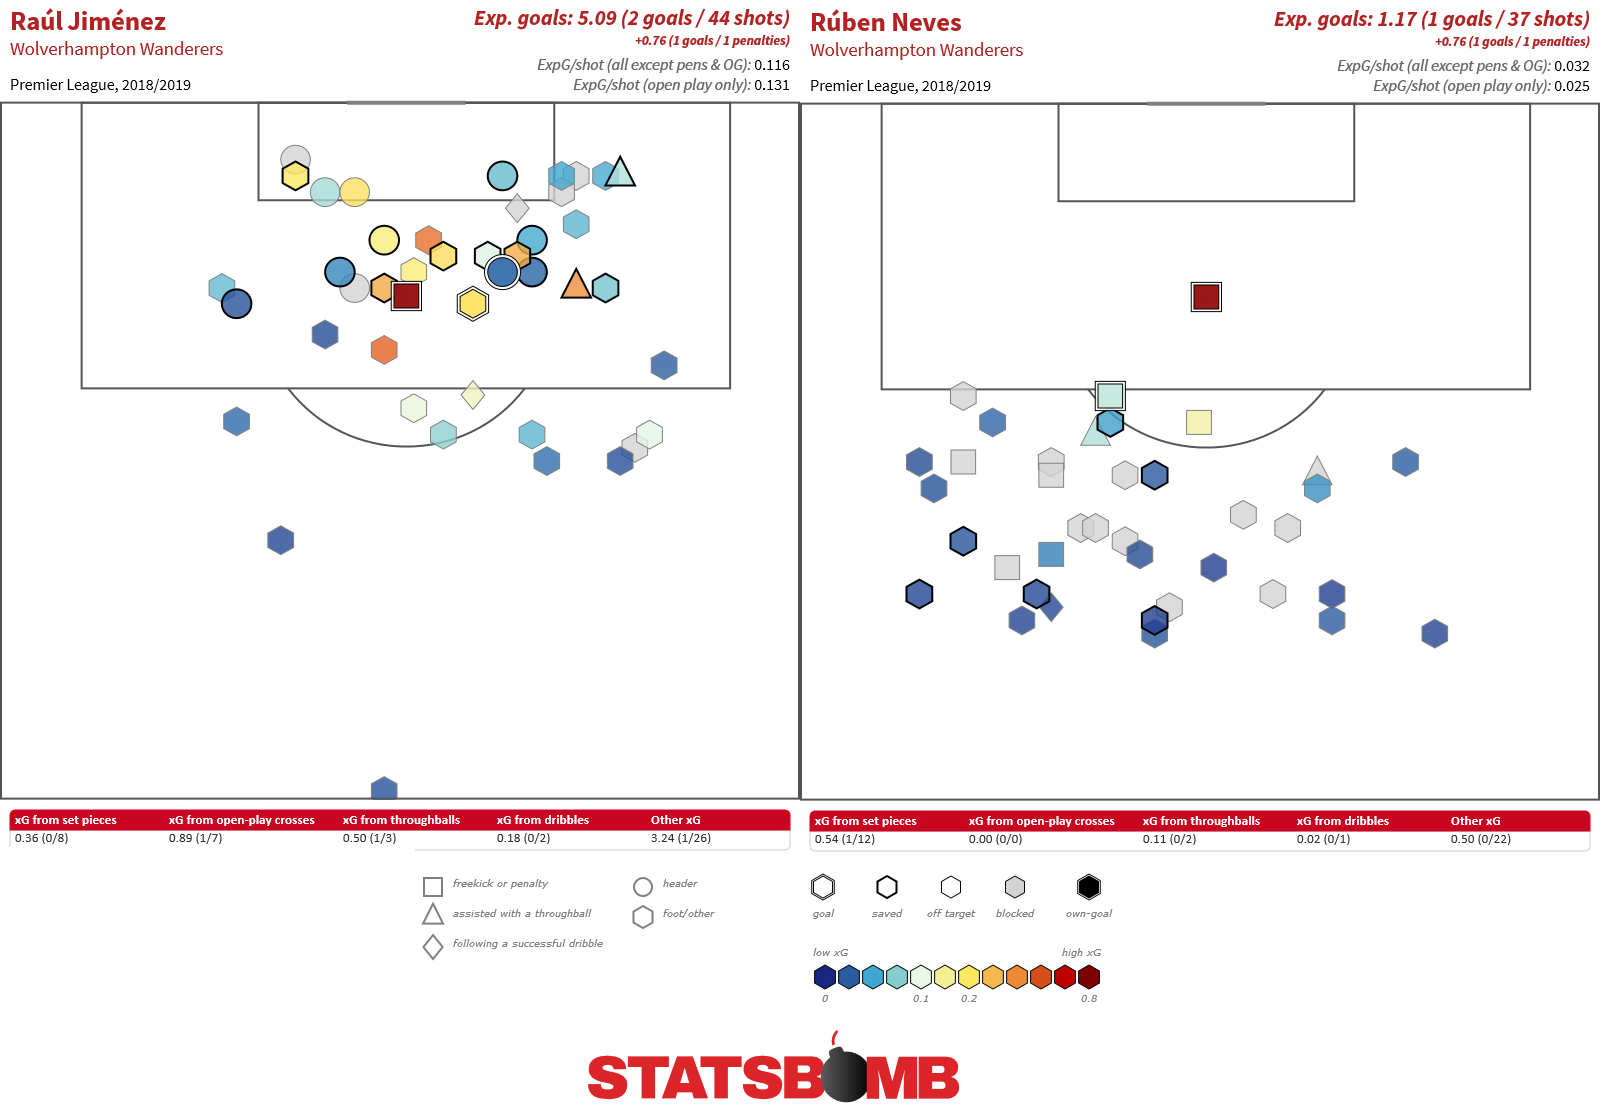
Being behind expected rates in attack can happen to any team in short bursts, but with the league now up to 14 games, there is the consideration of whether or not Wolves’ attackers are contributing enough overall or if this is an area of the team that may benefit from yet more investment. Raúl Jiménez has two goals (and a penalty) from an expectation of five. He was bought to fit into the team ahead of Léo Bonatini who hasn’t scored a league goal since December and having not started a league game this season looks well out of favour. It’s also surprising that none of the support cast has pitched in with goals, in particular, Diogo Jota, after his 17 league goals last season, but also Hélder Costa. Between the two of them, 1800 minutes for zero goals and zero assists is distinctly underwhelming while Traoré and Ivan Cavaleiro have made small contributions in fleeting minutes. Indeed, behind Jiménez nobody in the team who has played any significant time has any kind of notable goal expectation. Neves is the only regular starter other than Jiménez to average more than two shots per game, and the single shot he’s taken in the penalty area was a penalty. Indeed, feeding into a lack of creativity high up the pitch, 46% of shots they take from outside the box, enough to rank fifth most in the league. For chance creation, Jiménez leads the way for regular starters at around 0.22 expected goals assisted per game that feed into four assists. Jota is at 0.16, but the only other contributors here are the bench men. Overall, there's distinct room for improvement in the final third.
Defence
It’s possible the push-pull effect of running an effective defence has hampered Wolves’ attack. We’ve seen similar recently with Liverpool, who while fixing defensive issues have slowed down a smidgen up front. Unless you’re Man City, getting the best of both worlds appears to be extremely difficult to attain. Yet in adapting to the Premier League, Wolves’ defence appears to be very good. They have persisted with the three centre back formation they used in the Championship and Ryan Bennett, Conor Coady and Willy Boly have missed one start between them. They are the only team in the Premier League this season to have started consistently with three centre backs, Huddersfield have used it in the majority of their games but not all and a bunch of teams have tried it more occasionally. Perhaps the effect of Antonio Conte's Chelsea title winners is starting to wear off? After all fashions are fickle in football but Wolves and Nuno Espírito Santo are admirably committed to their method. Consistency in selection has extended to Moutinho and Neves, both ever present shielding in front of the defence. The core and strategy has been stable.
Wolves’ defensive focus can be initially identified by the opposition pass success rate, which at over 80% is third highest in the league. Easy to pass against? Not quite, move into their final third and Wolves rank tenth. They are happy to allow sterile possession but will put the squeeze on when you enter their defensive areas. Closer in it gets even better, they rank sixth for passes allowed in the box. The shots they allow are generally of low value. Their expected goals per shot against rate leads the league (around 0.07 per shot, reliable throughout the season), and is powered at least in part by the league's longest average distance for non-penalty shots. This kicks into other defensive indicators which all imply organisation and structure. When facing shots they have the most defenders between the shooter and the goal, and they also lead the league for the most defenders within the “cone” between the shooter and the goal. All told, Wolves’ expected goals against at 0.82 per game is better than everyone but Liverpool and Man City. Stern stuff.
There have been some noises around the form of Rui Patrício recently. He left his line for Aron Gunnarsson's goal against Cardiff and was perhaps easily beaten by Aaron Mooy's free kick last week, but at least in terms of general shot stopping across the season, he rates as bang on expectation via StatsBomb's model for shot outcomes.
What next?
As mentioned, Wolves’ short term future is not without tough games, and December may well stretch their resources. No team in the Premier League has used as few players--just 17 so far--and the squad looks as though it lacks depth. The first team is stable and capable, but should injuries bite at some point, the depth of the squad will be tested. They have already lost left back Jonny ahead of this busy period and 19 year old Rúben Vinagre has stepped in, while in midfield Leander Dendoncker has been unsighted in the league since a summer loan move and the promising 18 year old Morgan Gibbs-White has been empowered to play. Ahead of the January window, Wolves have a choice whether to bulk out their squad and continue building or run with a thin squad and wait for the summer. At least one attacking, creative option would appear a prudent play.
Regardless, this Wolves team is well capable of landing comfortably in mid-table, and with the right breaks and some life instilled into the attack, potentially more. Their current run of form looks like nothing more than a freakish blip and their defensive level should carry them a fairly long way. A combination of what is a well drilled and now fairly unique system for the league and decent talent levels should ensure that Wolves turn the corner soon enough. Ultimately, teams that beat Wolves during this part of the season may look back and be very thankful for their points.
Header picture courtesy of the Press Association
Inside League One: Teams, Trends And Metrics
StatsBomb Data has been collected for League One 2017-18 and will be collected for the forthcoming season too. Last week we looked at some players who stood out via the numbers to examine how to get a starting point for player evaluation, so do check out that article if you missed it. This time round we’re going to look at some metrics that are part of or derivable from StatsBomb Data and discuss the results.
In The Clear
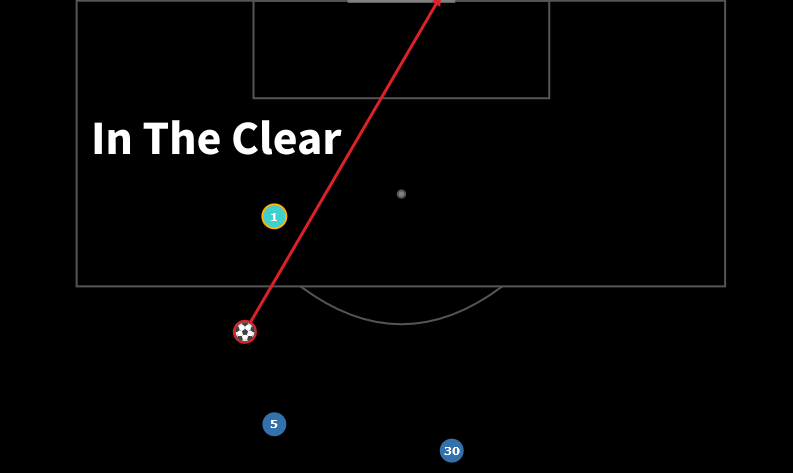
One of the major upgrades that StatsBomb Data incorporates is player positioning for all shots. Not just the shooter, but everyone visible within the “frame” of the shot for both teams. This Freeze Frame means that we are able to evaluate the pressure a player might be under at the time of shooting, whether there are blockers prevent a good sight of goal--for the shooter or the goalkeeper--or if a teammate was better placed or open, whether they made the wrong decision to shoot. The data is fundamentally objective too. We are not making a binary decision whether or not a chance is a certain size or simply counting players. We are mapping the location of the players. The potential for exploration within this part of the data is extensive and we are only scratching the surface here. Much more can be done whether you are a StatsBomb Data customer or enjoying the free women’s football data that we have made available. In this instance we are going to look at shots “In The Clear”. Definition: Shots where only the goalkeeper was in between shot-taker and goal, i.e: within a cone between the shot-taker and the goalposts. Open play shots only. Here are a couple of shots from League One top scorer, Peterborough's Jack Marriott, that qualify as in the clear: 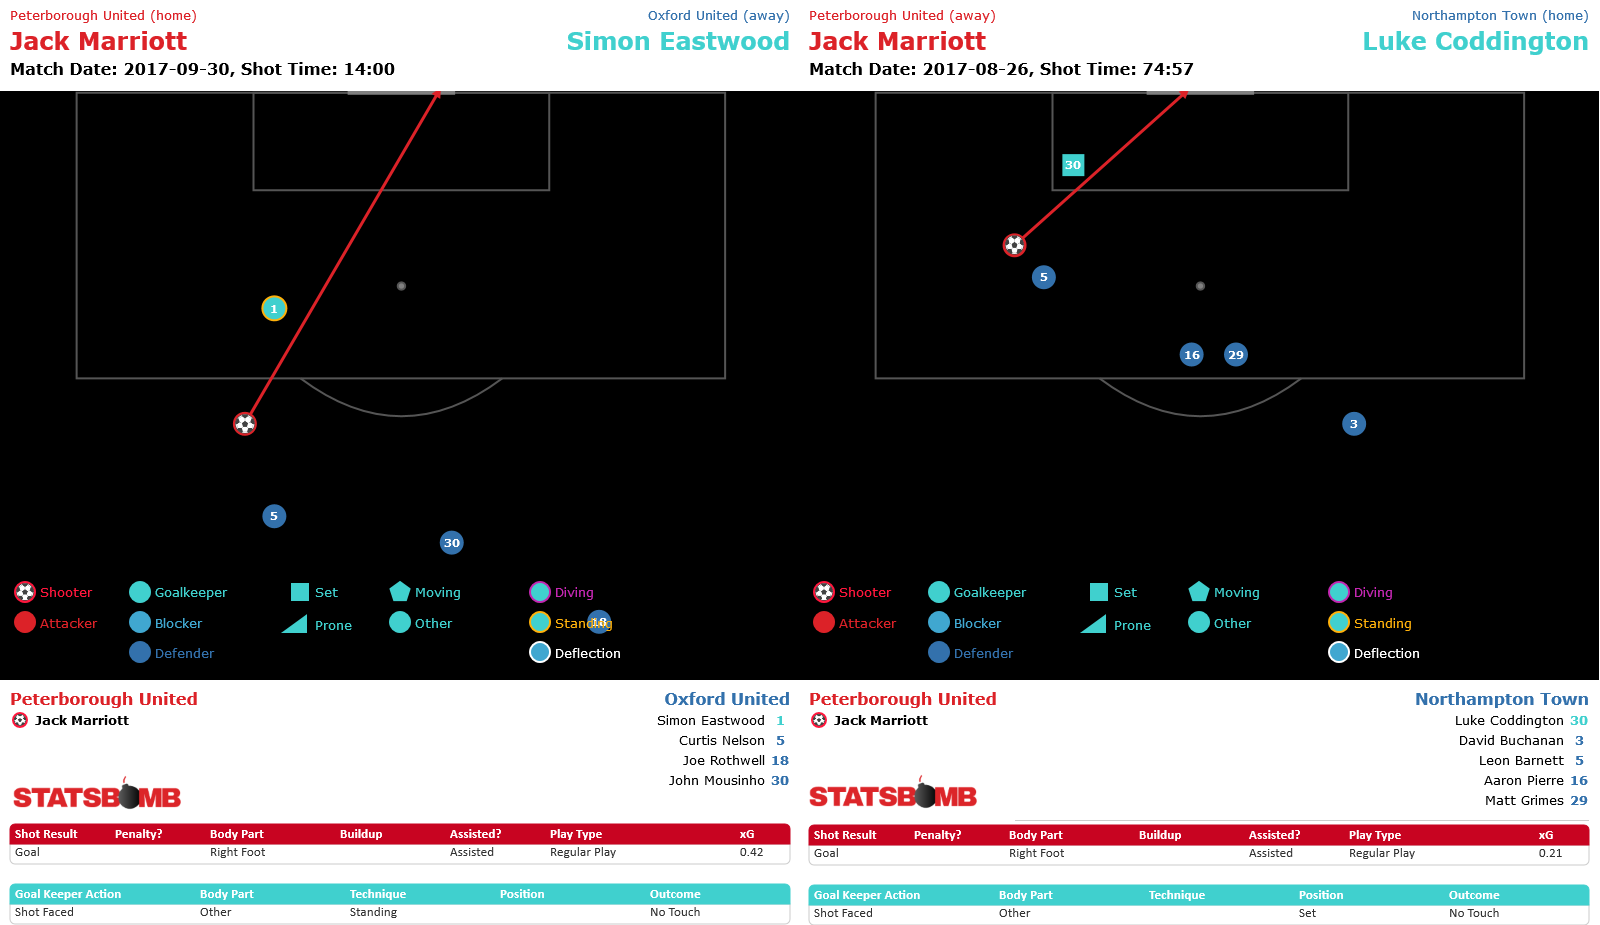 As we can see, the defence trails behind him and he's significantly ahead of his teammates--none of whom are in the frame. These are particularly obvious examples, but a free header would likely also qualify as would plenty of shots in which the player has made space for a shot quite normally. So how did League One shape up in total? Let's look at how many of each team's shots were In The Clear:
 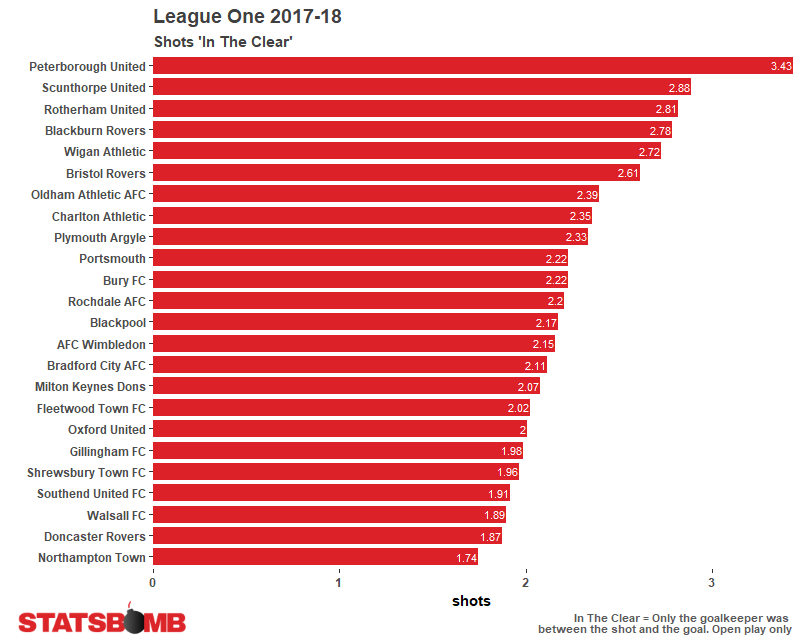 Peterborough (powered at least in part by Marriott) created the highest percentage of shots here, and in fact Marriott himself not only led the league for shot volume but also for in the clear volume too. Of the players with 100 shots or more in the division, the player with the highest percentage of in the clear shots was Ellis Harrison, the player with the lowest percentage was Nick Powell:
 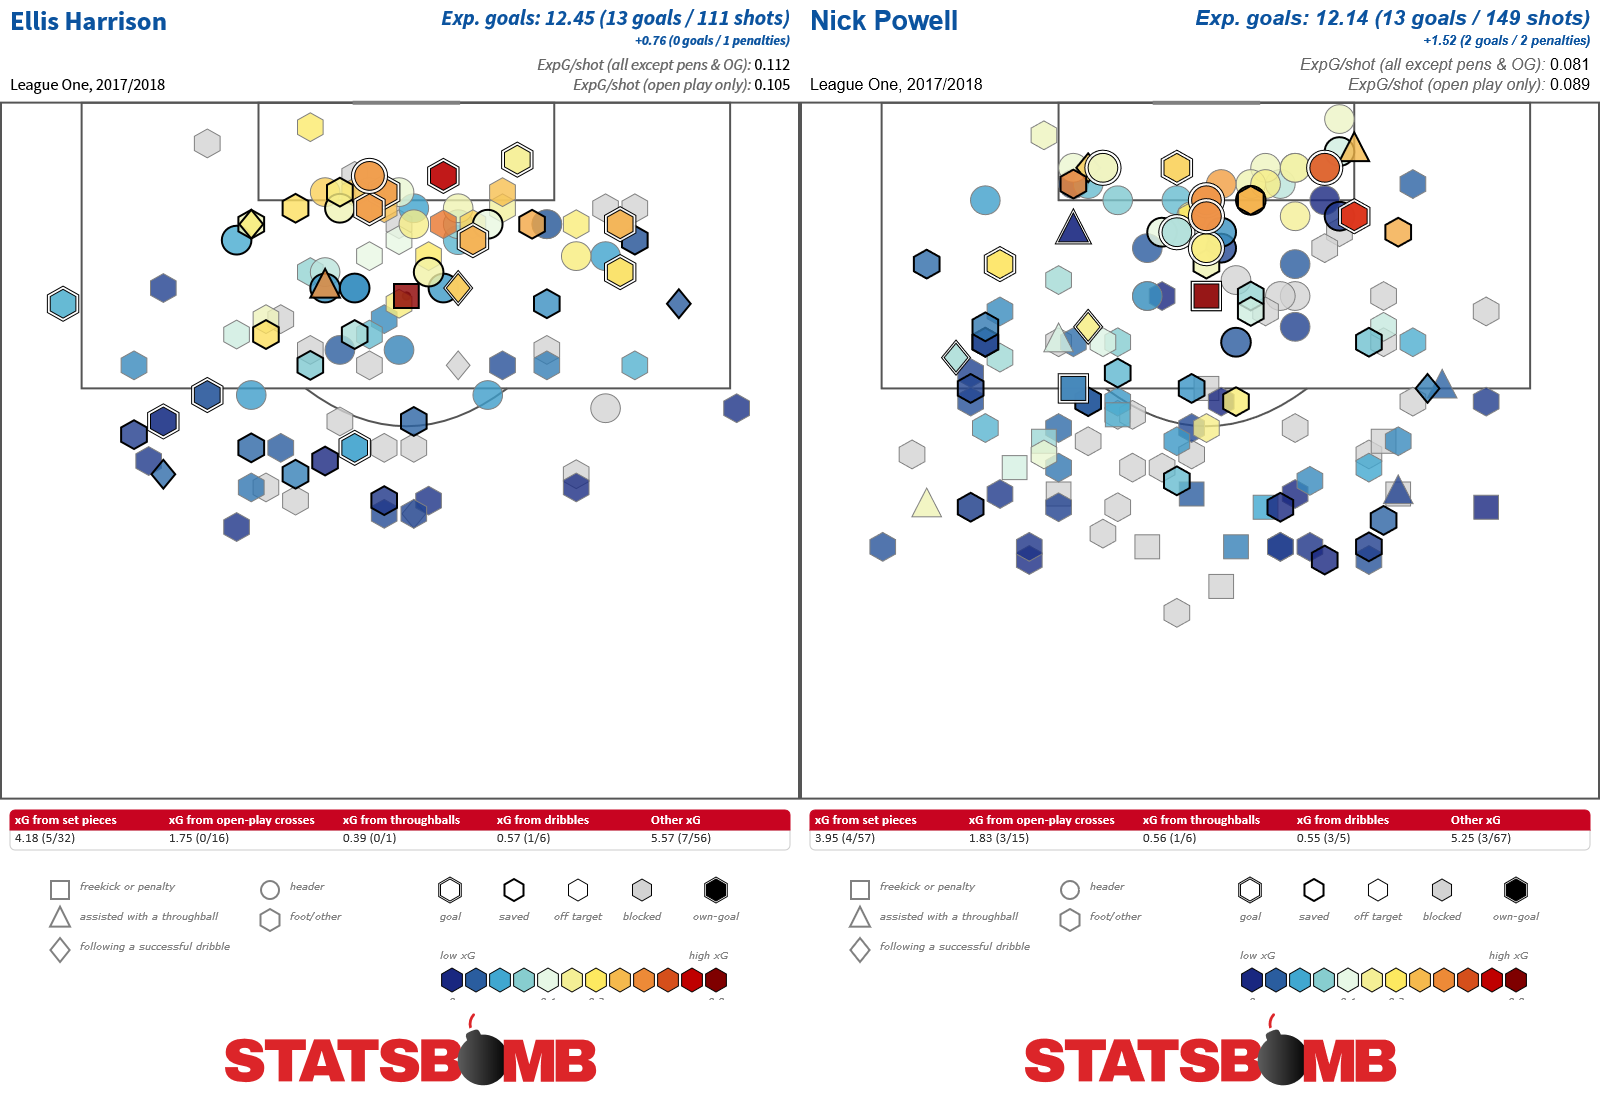 Visually the differences aren't hugely pronounced between the two players, but we know that Harrison took a ton more shots that were in the clear while Powell's total was augmented by lower value less clear shots from range. So we've added an extra layer to our shooting analysis, thanks to the information contained in the Freeze Frames. As mentioned, this is just a starting point but we have a great basic example of scalable data analysis that once enacted can be applied across an entire dataset, be that a single league or many.
Pressure in the opposition half
Pressure events are another unique aspect of StatsBomb Data for which there are many avenues of exploration ahead. Here we're going to take a straightforward look at events higher up the pitch in League One. The team that recorded the most pressure events in the opposition half of the pitch were the champions Wigan. This may be something of a surprise given they were also the team that recorded the most possession (54%) but it shows that their work rate was first class in the zones where it mattered for their attack: 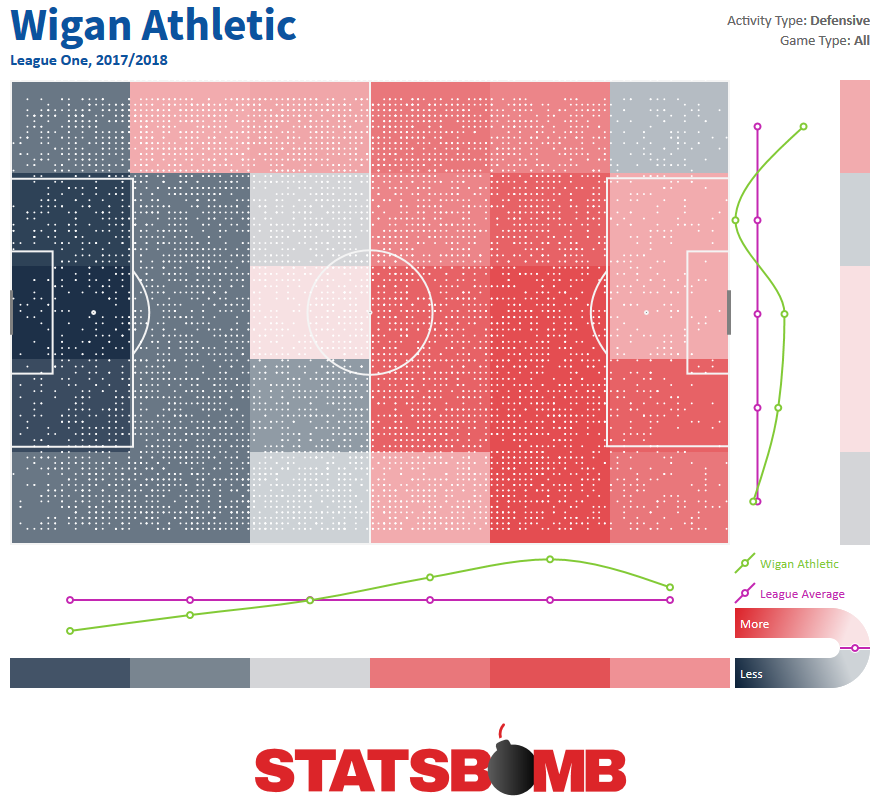 By way of contrast, Bradford City recorded the fewest pressure events in the opposition half in the division--over eight per game fewer than next lowest Oldham Athletic:
 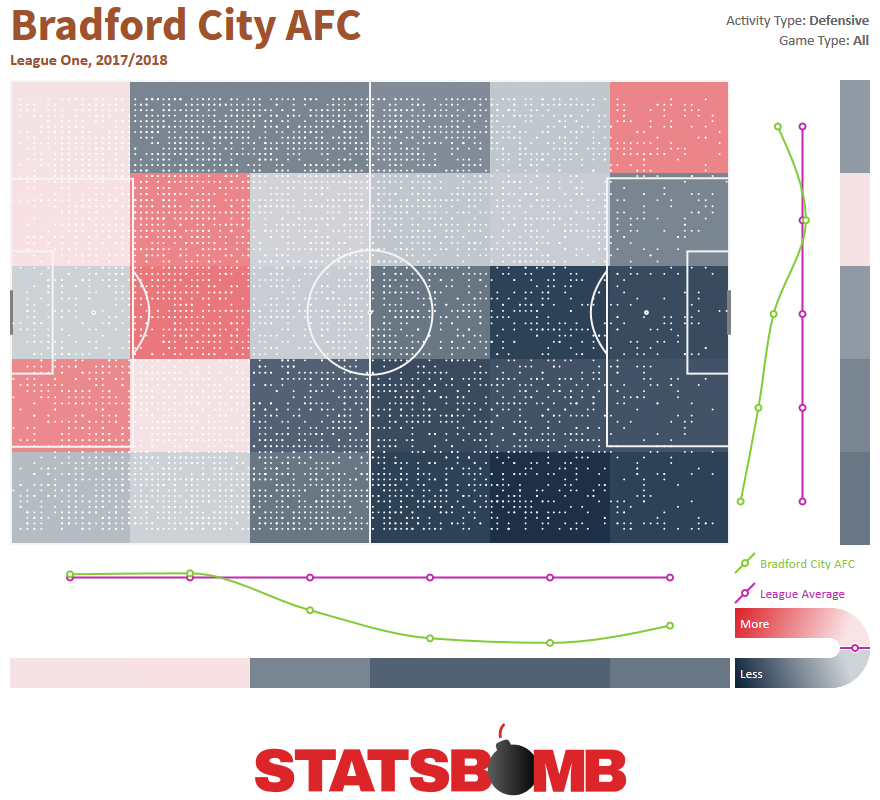 Their passivity extended over most of the pitch but perhaps crucially not within their own defensive zone. Overall, this less aggressive style did not appear to have had a strong negative impact on their performances as they landed squarely in mid-table in eleventh place. However, they offer a distinct contrast to every other team in League One in skewing so heavily away from pressure events up the pitch. In relation to players, a willingness to chase down the opposition can be a useful string to a forward's bow as Devante Cole found. He had a stellar first half to 2017-18 at Fleetwood Town, part of which meant that he led the league for opposition half pressure events per game:
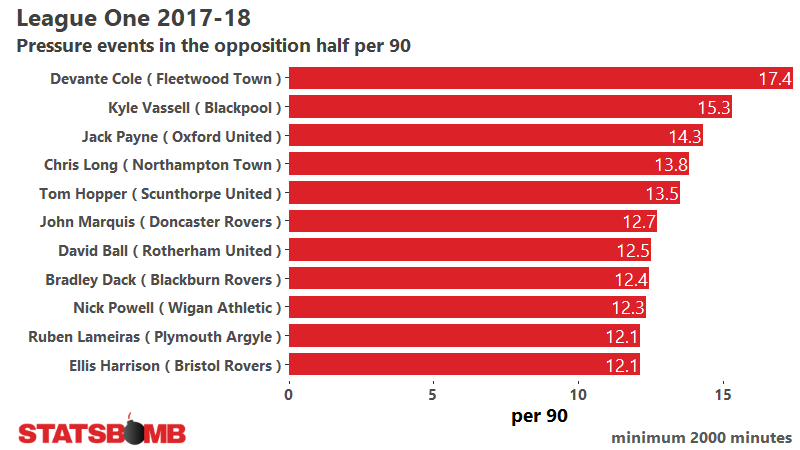
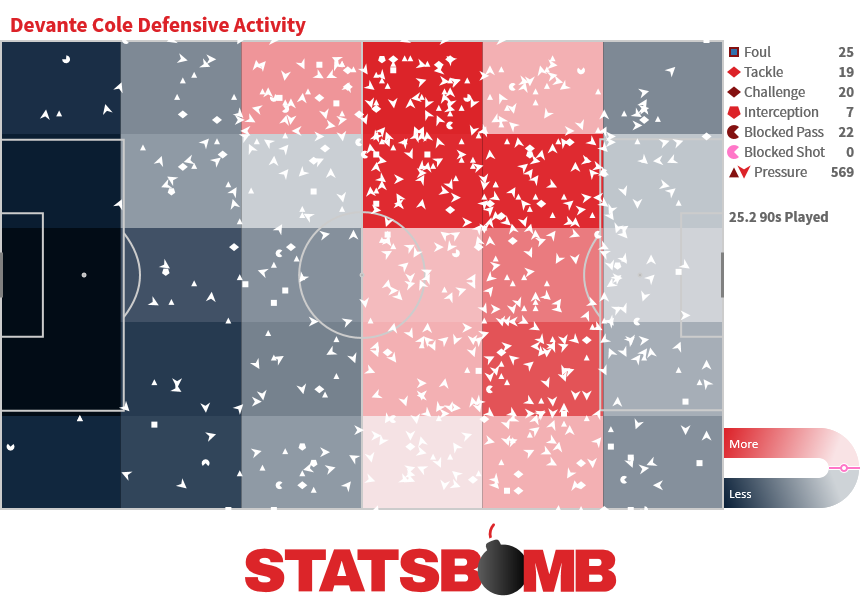 Exactly the kind of profile that might attract a team oriented towards opposition half pressing like Wigan... who promptly signed him in the January transfer window. Sadly for Cole, he only managed six all too brief substitute appearances for the champions in the second half of the season, but we can at least understand part of the thinking behind his signing--beyond the 10 goals he scored for Fleetwood. Expected Goals Lastly, a quick note about expected goals in the division. StatsBomb Data comes with expected goals values for each shot as part of the package so full player and team analysis can be conducted straight away using the benefit of our extensive knowledge in this area. There is occasionally talk that expected goals is a less reliable indicator in non-top divisions. However, using the StatsBomb xG model, we found that there were few surprises at the top of the League One table in 2017-18. The three teams most impressive via expected goals finished first, second and fourth and all ended up being promoted:
 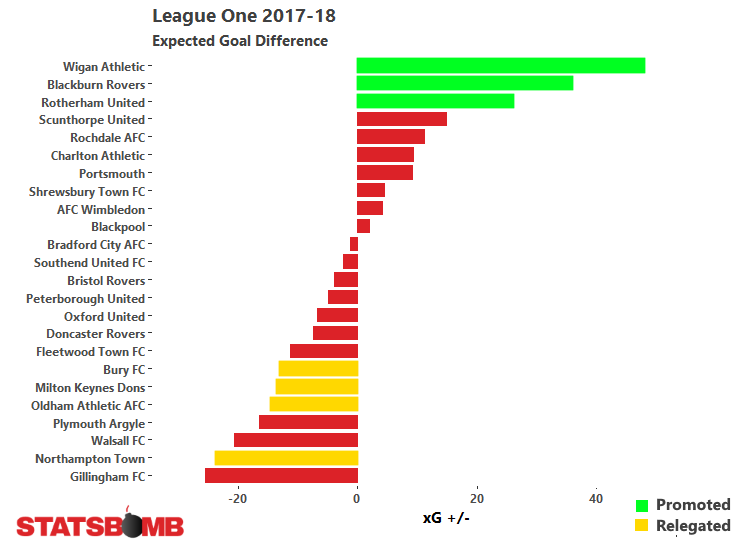 At the bottom of the table, four of the seven lowest ranked teams found themselves relegated, and perhaps Gillingham can consider themselves the biggest beneficiaries of a positive skew in their numbers. By landing 56 points they ended up two wins clear of the drop, yet in doing so overshot expectation by the greatest margin in the whole league:
 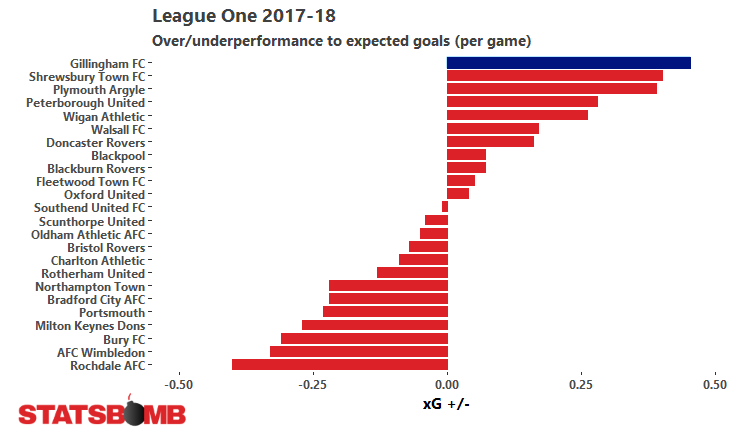 Plymouth were a team who had a season of two halves, 24 points before Christmas and 44 points after and they too look as though they benefited from a positive skew ahead of expectation. For both of these teams expectation ahead of 2018-19 may well need to be tempered, as the structural basis for their final 2017-18 positions indicate possible problems in the future--all things being equal--but it's best to know this ahead of time, rather than be surprised on the other side of any potential reversion.
StatsBomb will be collecting high quality data for the English Premier League, Championship, League One and League Two in 2018-19 as well as a host of other leagues. Get in touch with us via sales@statsbomb.com if interested or submit our online form. Thanks for reading part two of our look at League One. Part One is here, where we majored on players highlighted by the data. And ahead of the new season we have been tweeting out further highlights from last season's League One data here. Enjoy the new season!
Inside League One: Using Data to Look At Players
One of the key benefits of forming a football data company is that you can choose which leagues to collect data for. As such, StatsBomb have added English League One to the roster and collected data for 2017-18, and will continue to do so going forward. Having high quality data for a league that has been under served in the past is a fascinating starting point for analysis, so let’s dive in, identify some players who performed well and discuss their game. This will be the first of two articles written discussing League One via data, so be sure to keep an eye out for the second one next week.
A relevant disclaimer: StatsBomb endorses data use as part of a fuller process that involves traditional scouting methods too. Data has an important role in refining ideas but cannot be the sole driver towards a complete analysis. The profiles here can act as a start off point and show how data can help refining multiple leagues worth of players towards a far more efficient process.
Jack Marriott (Peterborough)
Marriott’s 27 league goals led the division, and his move up a division to Derby appears well deserved. While the league’s top scorer might appear to be an obvious pick, when evaluating players, it’s important to understand the inputs that went into a performance to get an idea of whether or not it’s intrinsically likely to recur.
A look at his shot chart shows how the Peterborough man accrued his impressive total:
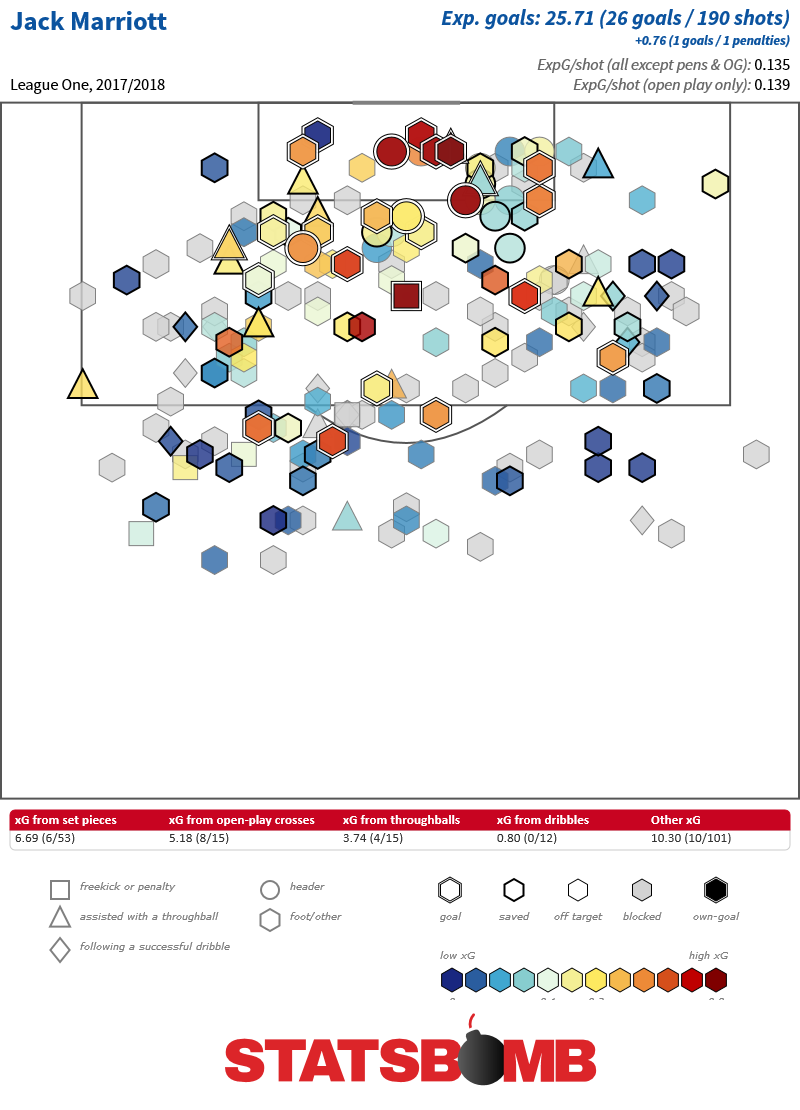
Chiefly impressive here is the sheer variety of his goals. He scores from set pieces, he scores from crosses, he scores from through balls. He scores headers, he scores from outside the box, from wide and from close in. He’s also matched expectation: 26 goals from an xG of 25.7. His rate of over four shots per game ranked second only to Wigan’s Nick Powell and his rate of shots related to all touches was over 7%, nearly 2% higher than anyone in the league; he’s a pure striker. Without even going any deeper we can see that his season has been an accurate reflection of the chances his teammates have created for him. If we are to be critical, the volume of wider shots he took, particularly from the right side, is probably too high, but he’s not intrinsically wasteful, and this is a good shot chart for a striker.
He did not manage to score after a dribble, but he showed an ability to carve out his own opportunities in that manner, ranking second in the league for shots inside the box after a dribble with ten. We can see here his next actions post-dribble, and those wide shots crop up. The ability to generate his own shot should not be undervalued though, as it’s likely that this type of chance allows his team to relieve pressure, and lightly implies a good workrate.
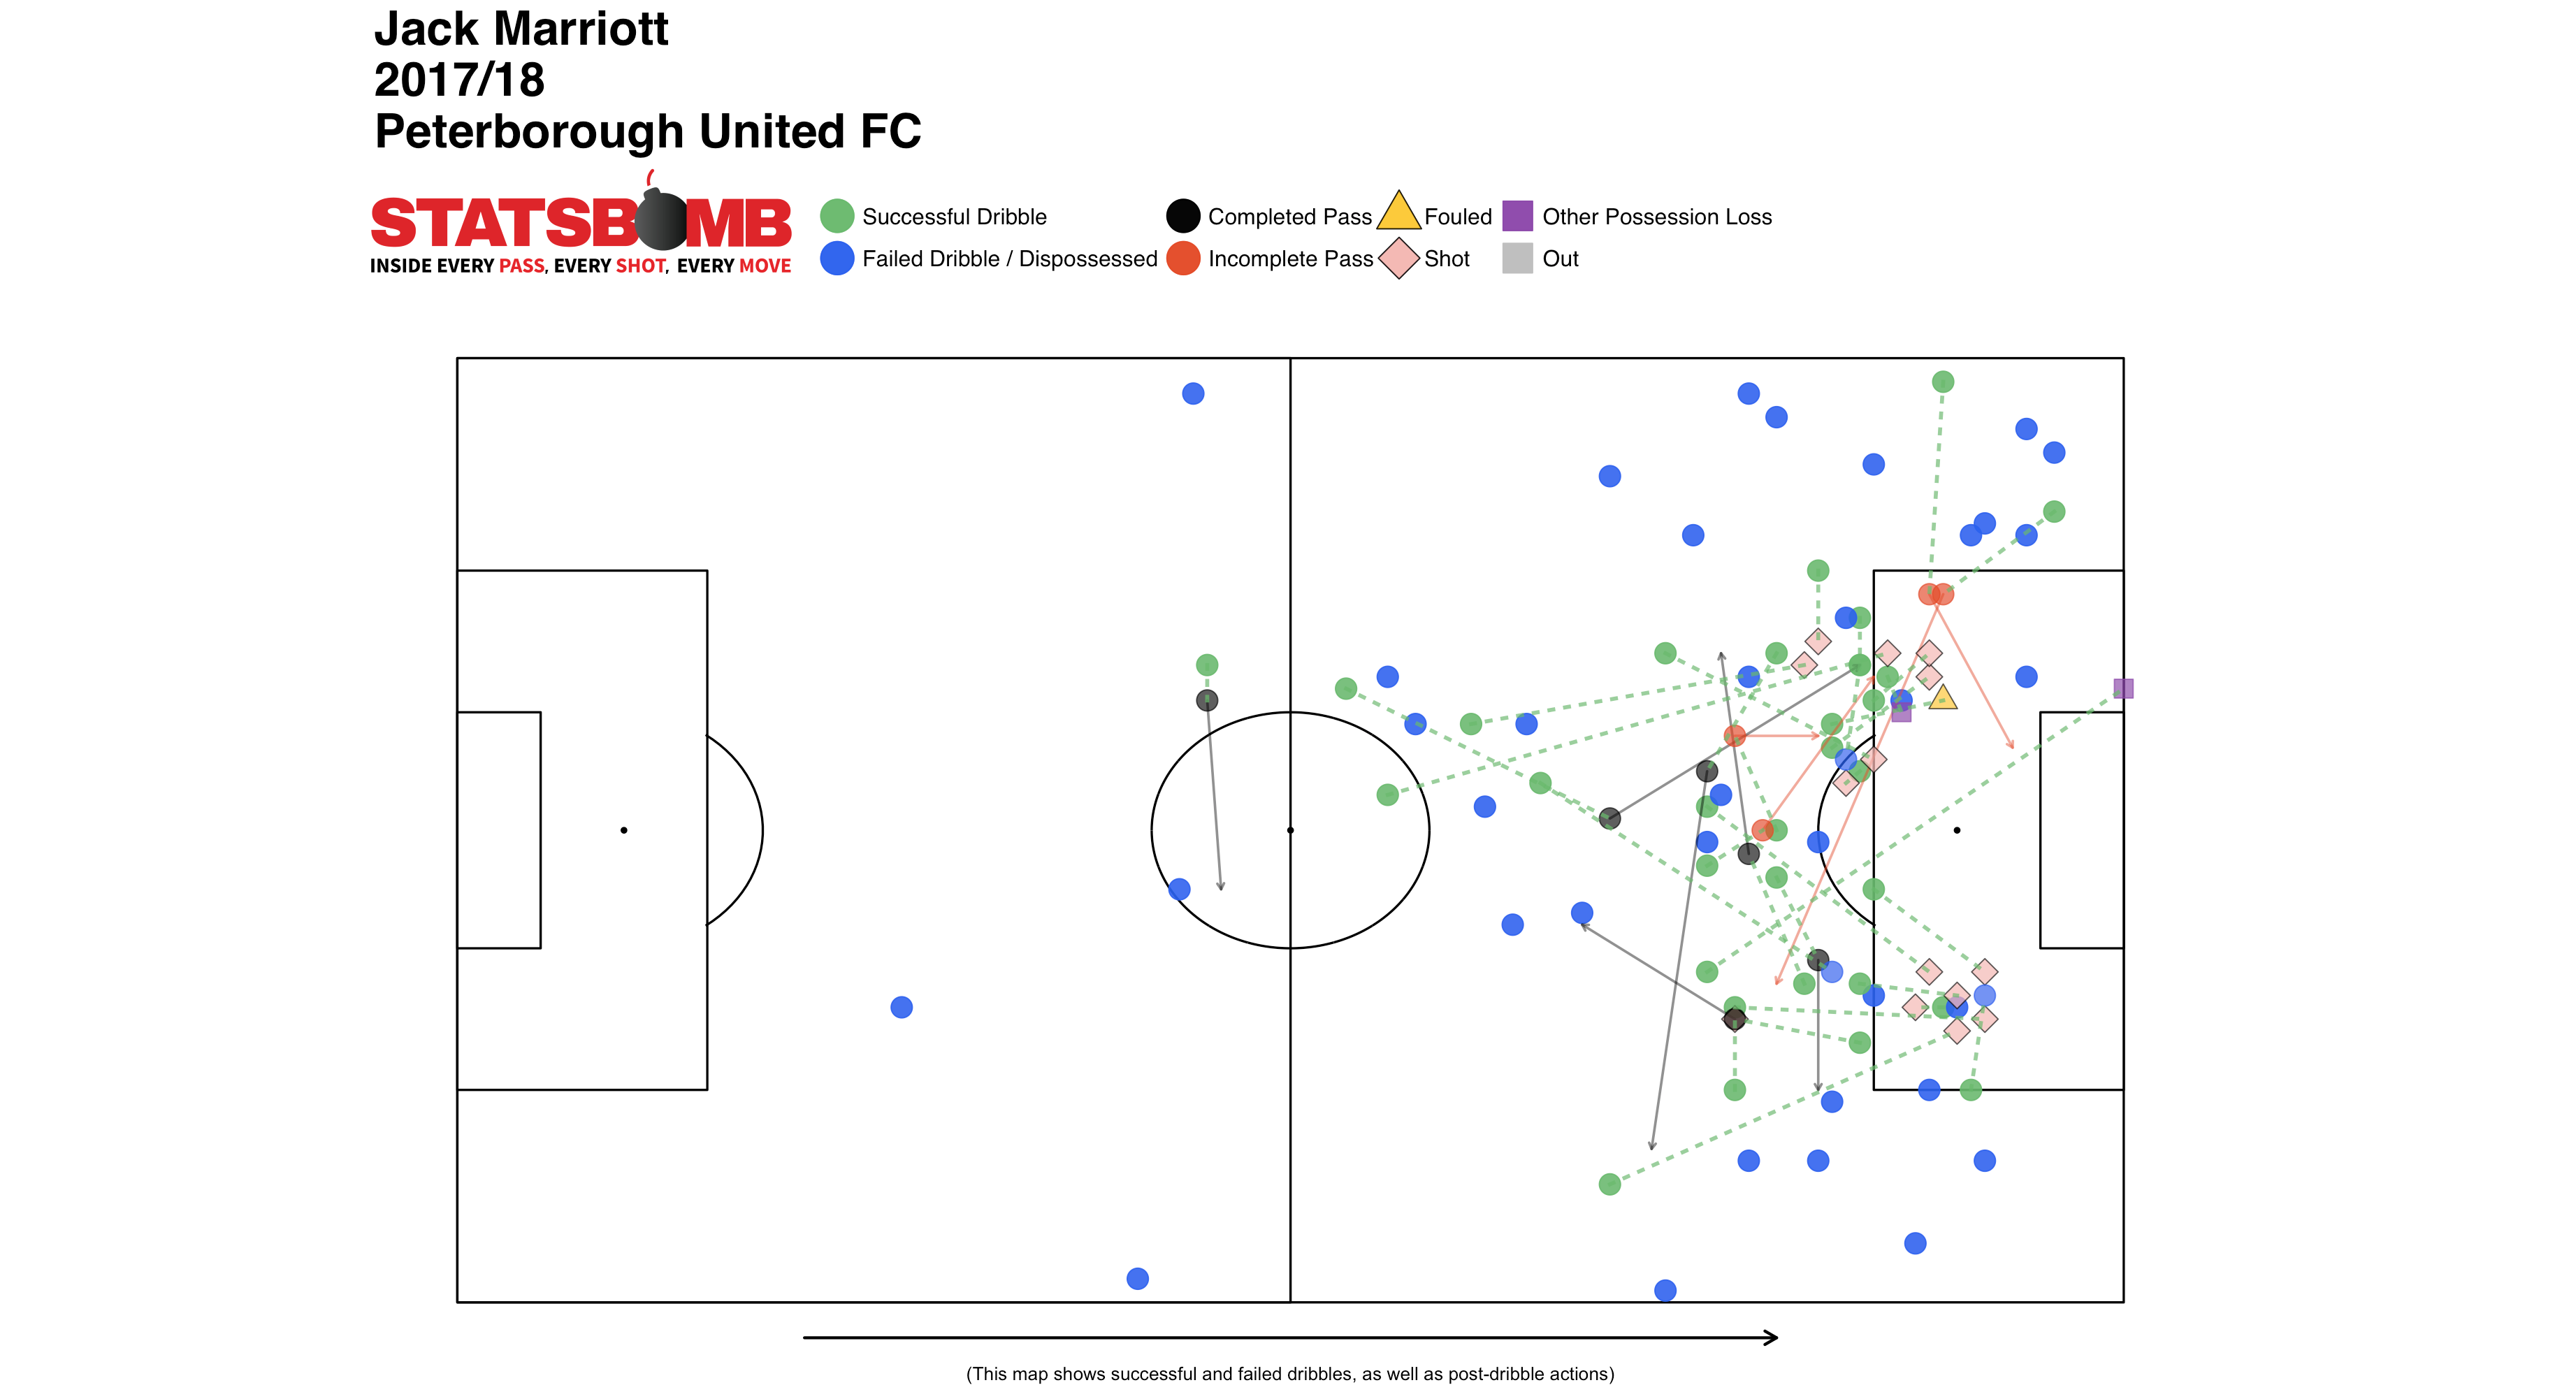
Something that more strongly implies workrate are pressure events, and Marriott scores fairly well here. His rate of around twelve opposition half pressure events per 90 puts him in the top 10% of players and fourth for those with over 3000 minutes registered. Like many pure strikers, he doesn’t possess the ball to any great volume, but he does put work in to retrieve it.
Callum Styles (Bury)
Sometimes a young player can raise interest from a brief first team spell and while you would like more minutes to evaluate, what they have done in a short period of time is enough to merit further investigation. Callum Styles to date is chiefly known as the first player born in the 21st century to play in the Football League, which he did for Bury back in 2016. Still just 18, Styles got 900 minutes for Bury in the back half of 2016-17 but then figured only sporadically for Bury during the majority of their dismal 2017-18 season that eventually saw them relegated after finishing rock bottom by nine points.
Styles' time in the team this time round started in March 2018, and from there on in he completed the full 90 minutes in Bury’s last eight games. Bury were all but doomed at this point, but given the chance to contribute, Styles certainly did just that:
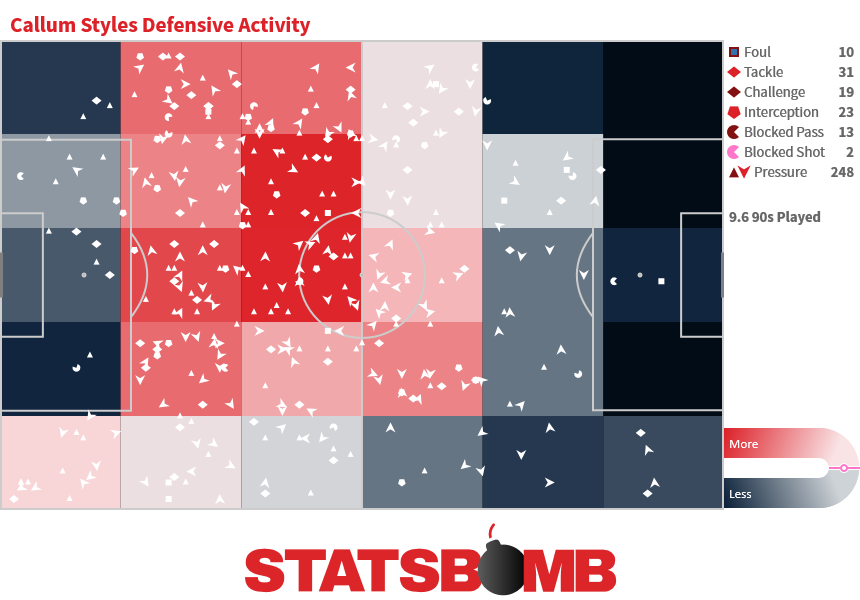
Via the pressure data we record at StatsBomb we can see that in the ~850 minutes Styles played, he led the league for pressure events recorded, with 25.6 per 90. We can see from the chart here the areas that he covered (where grades of red equate to exceeding league average). Pretty much the whole midfield band.
Related to this, he also led the league for pressure regains--defined as occasions in which his team regained the ball within five seconds of the player’s pressure event--which suggests that he targeted his pressing effectively within the team. Beyond that, of the 25 players who recorded 20+ pressure events per game Styles ranked second to another young player who played limited minutes, Aidan O’Neill of Fleetwood, for the volume of which turned into pressure regains--around 19%.
The caution here is the small sample of games but this is a good example of where data use can point towards player performance, and start the process towards fuller evaluation.
Cheyenne Dunkley (Wigan)
In truth, this whole article could have been about Wigan players. They won the league and were never out of the top three from the end of September onwards and though Blackburn Rovers pushed them hard to secure the second automatic promotion slot, Wigan were top scorers and had the best defence too.
Nick Powell was a contender for the best player in the division and was joined by defenders Dan Burn and Nathan Byrne and forward Will Grigg in the PFA Team of the Year while Sam Morsy was a stalwart in midfield.
However in a post-World Cup environment where Harry Maguire is one of the most important attackers in world football, the performances of Cheyenne Dunkley were notable. Signed on a free transfer from Oxford United in the summer of 2017, last season was only Dunkley’s second in League One having battled his way up from non-league. He scored seven goals and it’s fair to say he had a method:
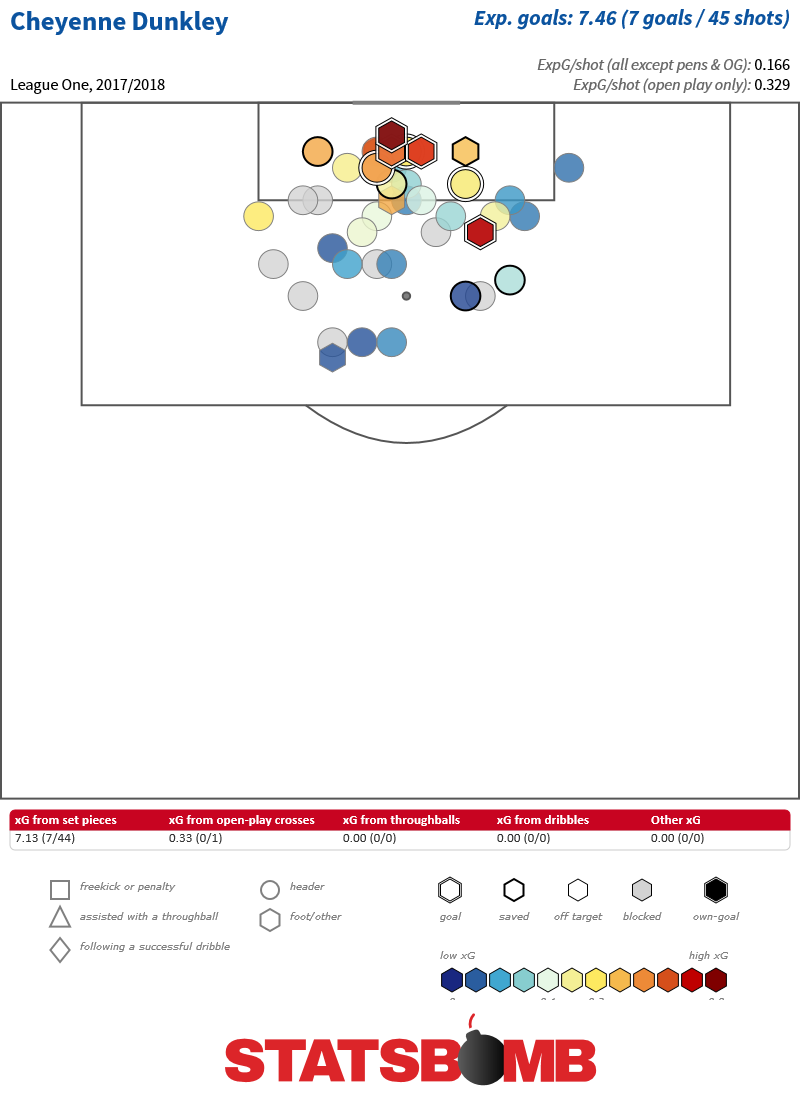
A striker would be proud of a shot chart like that. Dunkley’s success here once more represents the value in using set pieces as part of a mixed attacking strategy.
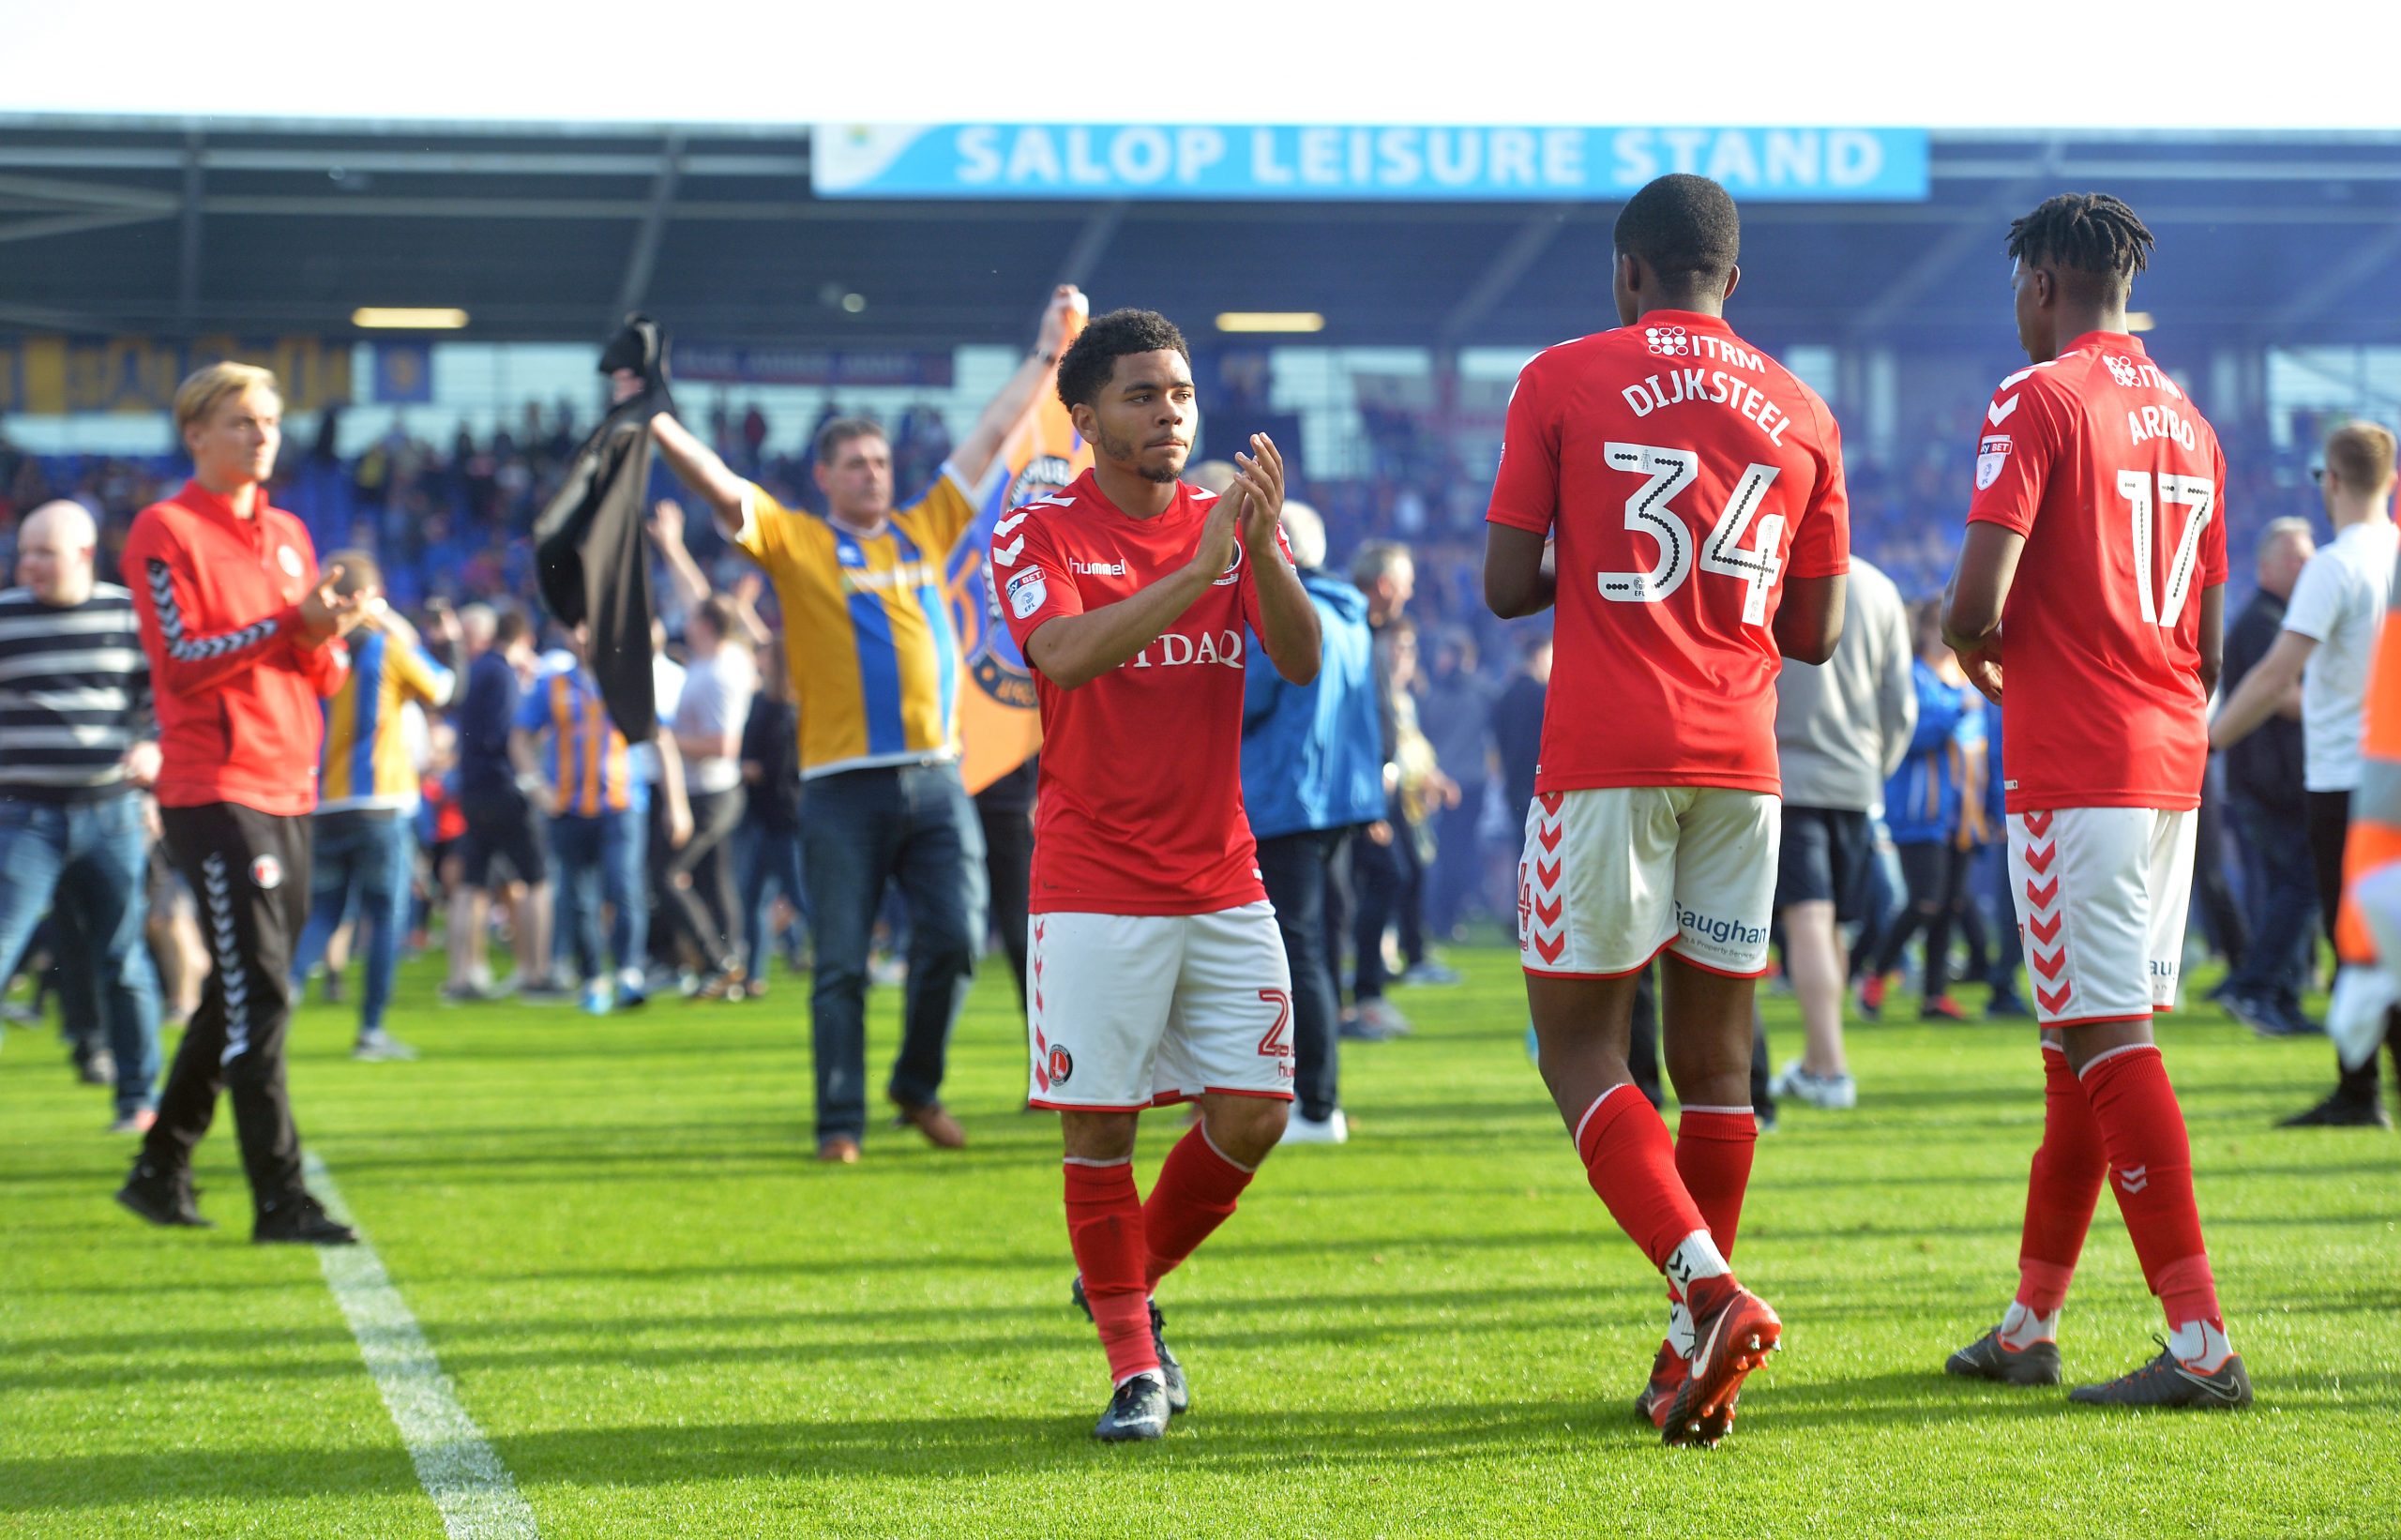
Jay Dasilva (Charlton)
League One is a division that is still used by top clubs as a breaking ground for their young talent, and one unarguable success story last season was Jay Dasilva during his time at Charlton. The young Chelsea prospect rejoined Charlton after a spell there during 2016-17 and after captaining England’s side that won the UEFA Under-19 European Championships during the following summer. He started 34 games for Charlton last season, won their Fans Player of the Year award and graduated to under-21 honours.
Out of possession, left back Dasilva did his job:
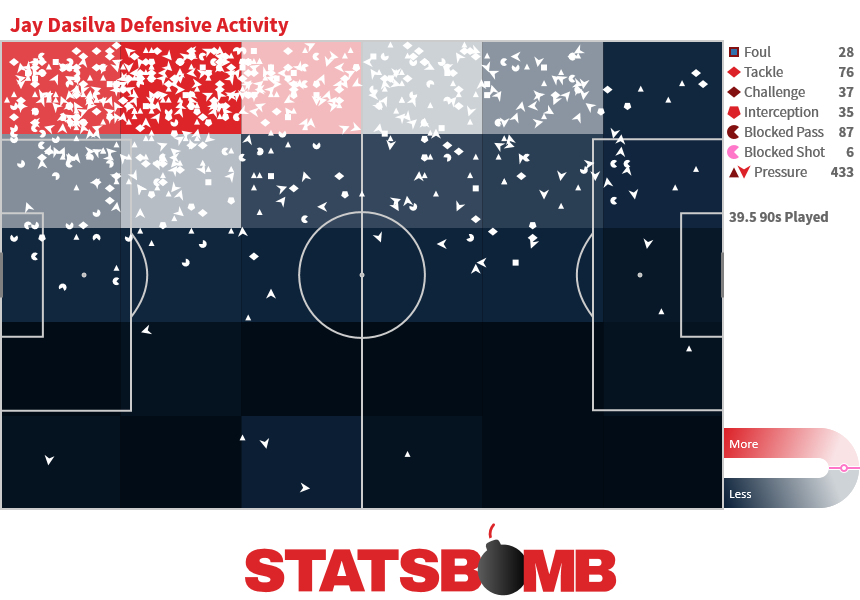
At the other end of the pitch, Dasilva showed signs of being well capable of playing within a possession-oriented team. He led his team for final third passes completed (17.2 per game, and ranked tenth within the division) of which 30% were forward, enough to rank second among the top twenty players for final third volume. And these number weren’t padded by crosses, he scarcely attempted them.
He was also able to contribute to chance creation; 1.3 key passes per game (with a value of 0.15xG Assisted) ranked third for Charlton, impressive from left back. He’s also a capable dribbler and ranked second in his team for the percentage of pressure events that led to a regain of possession (21%).
It appears likely that Dasilva will once more head out among Chelsea’s loan army this summer, and his general progress in League One implies that he will be capable of performing at a higher level. His time at Charlton is the ideal representation of how the selective loan of a young player can benefit the player’s owner and the loan club to an equal degree.
That's just a flavour of what you can pull from via StatsBomb's League One data.
Ahead of the new season starting next week, we will return with a further post, and as the season progresses keep checking our social media for updates.
Header image courtesy of the Press Association
*NEW* StatsBomb Podcast: April 2017

Ted Knutson and James Yorke chat football, with a statistical angle
Downloadable on the soundcloud link and also available on iTunes, subscribe HERE
Thanks!
Arsenal's Defence and Monaco's Crazy Attack

There’s a difference between using statistics to inform and actually performing analytical tasks. When this column was weekly it was predominantly the former, and even now that it is more occasional, it feels like few others have really taken the baton and tried to draw out trends, traits or differences that become clear when you stare for long enough at a wall of data. Gamblers will have, but they aren’t prone to writing blogs about the edges they have discovered. Regardless there are still stories that present themselves on a week by week basis, and provide greater insight as to how or why teams and players are doing whatever they are doing, and why it may or may not continue. So here’s a couple that have caught my eye just recently.
- Arsenal’s defence AKA simple truths
The average team in the Premier League has allowed 4.3 shots on target this season.
Arsenal in the first half of the season allowed 3.6 shots on target per game and conceded a goal a game meaning they were tied 7th for the shots and tied third for the goals.
Since that point, they’ve played seven and gone 3-1-3 while allowing 1.7 goals per game and 5.6 shots on target per game. These rates, over this relatively short period rank 15th and 18th respectively. Petr Cech has come in for some criticism, which is perhaps harsh given that he’s 34 and his workload has just gone up by over 50%. The volume is the problem, even in this short period, especially when held against rivals.
We can spin it back across the season. If 4.3 is the average rate of shot on target allowed, a top side is doing badly to exceed this with any regularity. Arsenal have allowed five or more shots on target on 12 occasions this season. In comparison to the rest of the top six, this is standout bad, the rest have allowed that on between four (Man City) and seven (Tottenham) occasions.
Also the trend is poor. It’s occurred seven times since the start of December in just 13 games. Arsenal are simply not protecting their goalkeeper adequately to an extent that they need to if they are to match their ambition. Again rival teams kill them in comparison. Man City last allowed a team to land five shots on target against Leicester on the 10th of December, Man Utd last did on the 4th of December against Everton. Chelsea have twice in three months both against top four rivals, Liverpool three times er… not against top four rivals, and Tottenham four times, three times against rivals and once against Hull. Arsenal have suffered against all and sundry. This seven game stretch has faced visits to Chelsea and Liverpool (both games qualify) but also they've failed to adequately protect Cech in the Watford defeat, the draw at Bournemouth and the insane late win against Burnley. These teams shouldn’t be laying a glove on Arsenal’s defence, yet they are and turning their porousness into results.
There's also the small factor that as the team has become unable to restrict the opposition, the volume of total shots in their games has increased. At the halfway point, Arsenal games featured around 25 shots per game and they had 60% of them. Since then, they are averaging nearly 28 per game and they have only 54% of them. This implies again, to some degree, a lack of control and the dial moving in the wrong direction.
Yet another factor is in their overall shot profile for distance. Last season Arsenal took the closest shots in the league and allowed shots from the furthest away--it looked as though talk of expected goals influencing their on-field play was legitimate. This season, they still take the closest shots of any team in the league, but their opposition are taking their shots from an average of 1.5 metres closer. That's huge. They now rank 17th here and only Bournemouth, West Ham and Swansea are worse by this measure. So: the opposition are getting closer, which allows them to get shots on target more frequently and Arsenal are conceding more goals. Their current goals against rate of 1.2 per game is only exceeded once by Arsenal in the last 16 seasons, in 2011-12. Who is to blame? Francis Coquelin? He usually gets it. What about new players? Has Granit Xhaka done well enough? Is Shkodran Mustafi a reason? Has the manager lost sight of his tactics? Is there a wider malaise?
In another season, the traditional mid-season blip--and this is at least the third season in a row Arsenal's performances have dropped off at some point between the halfway point and the end of the season--might not be so vital. This time round though, the quality of their rivals and their ability to rack up the points means that this top four race is the most keenly contested in years. Arsenal need to pick up quickly, or an ignominious fifth or sixth place finish is going to loom large. The knock on effect from that would likely be a summer of turmoil.
2. Monaco
The big numbers story across this Europe is the insane jet powered Monaco attack. They’ve now scored 72 league goals from 378 shots, a rate of 19% and added on a perfect ten from ten penalties. Here’s a list of teams that have scored above 15% in a big five European League since 2010-11:
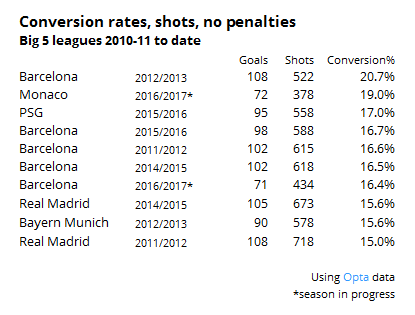
A few quick takes here: this is from a list of 686 club seasons. Just TEN of them landed at over 15% conversion. Five of these seasons are Barcelona seasons (their other two ranked 11th and 32nd), so Lionel Messi era. Then you have two Real Madrid years, so Cristiano Ronaldo era. Then Zlatan Ibrahimovic's 38 goal PSG season and Bayern Munich's all conquering 2012-13 season. The idea here is pretty strong, right? Mega clubs firing on all cylinders powered by world stars.
Monaco are different, a well drilled, fast team who are structurally very strong and well competent within their league. But: they don't take that many shots (~13 per game). If we divert into an expected goals model and drill down to a per shot basis to allow comparison to a part season, they are ahead of every other team in this 686 team sample, one of only two teams to be more than 0.05 goals per shot ahead of expectation in either direction, Tito Vilanova's 2012-13 Barcelona team, the other. And they aren't just slightly ahead of that mark, their per shot xG overperformance is at 0.08 per shot. Even allowing for some generous error bars here we're into unchartered territory. Monaco are pulling up alongside a newly discovered sun and its seven planets. Adding to the confusion their expected goal per shot rate is lower this season (0.10) than last (0.11), when they broadly matched their rate. So we have a team that takes a non-exceptional volume of shots, with a non-exceptional expectation of scoring them.
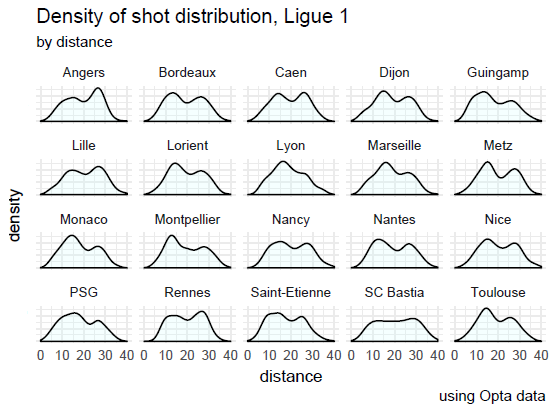
Let's go back outside the model. If we're going to be generous there are good aspects here. We can see here that they have a spike of shots around 10 metres out from goal, and a preference towards shots from closer in, compared to the opposite extreme, Angers:
But there is nothing here to imply a multi season outlier. Even if we presume that models are missing aspects of Monaco's play: they play with great speed, their wingers are excellent crossers of the ball, Kylian Mbappe might be a world class talent, Radamel Falcao may well be a world class poacher, it doesn't explain all of their overperformance. It can't. Even if we presume that all these factors accounted for just half of it, they would still be one of the top ten over performing teams out of 686 regardless of whether you model it or not.
Would any other team on that original list above ship five goals at Man City? They would all probably score three! That's a bit tricksy, but it does focus the idea around what Monaco have achieved: it seems hard to believe that it is anything more than the mother of all positive goal skews.
Now ~700 club seasons is a reasonable but not gigantic sample to compare. The more seasons we witness, the more likely we will see weird outliers at both ends. Twenty years from now when we have nearly 3000 club seasons to look at, we'll likely spot a few more like this Monaco team. This does not mean that simple shot analysis is non-informative, nor does it mean an expected goals model is faulty (beyond it's obvious limitations). It just means that sometimes shit just happens, and a football season is short enough that a full reversion may well not take place.
Leicester City's 2015-16 season is the worst and best example for many things. Among others--and whether this is good or bad will depend on your perspective--it gave the general public belief that anything can happen in sport way above and beyond any realistic probability, but it also absolutely cemented the idea that extreme positive skews can occur for long enough in the space of a season to see a team home. It again highlighted why these type of stories are fascinating, because the reasons why these clubs bounce forward are locked up in the intangibles. We see the outputs, and we know that there are elements of luck involved, but no coach can plan for an extreme skew.
And this is where the Monaco style season is a slight hoodwink, because it distracts us from other more reliable stories.
A manager can make plans and hope to improve his team's shots structure. He has some degree of control there. That growth is more sustainable over time if achieved. What of Atalanta? Under Gian Piero Gasperini, the club has gone from a team that never recorded a positive shots total across five seasons and finished between 11th and 17th each time to battling for a European slot, buoyed by solid metrics. They've taken 58% of the shots in their games and can even consider themselves slightly unfortunate having undershot the defensive end of their expected goals volumes by a small margin. The return might not be so shiny, but it looks as though their improvement is potentially sustainable rather than just a skew. Monaco are definitely one of the best three sides in France but their goal total makes them look like world beaters, Atalanta look like a top five team in Italy because they are probably a top five team in Italy.
The message here is to try and take a wider view. It's the same message this site has been putting forward since its inception in 2013. We're looking to round out the picture and reveal aspects that might otherwise be concealed. Twenty years ago the analysis of Monaco would have started and finished with "they are a brilliant attacking side". Now we are armed with a ton more information and techniques that can challenge whether or not that statement holds or whether they will sustain. The same discussion revolved around Marcus Rashford last season when he blew onto the scene with a glut of goals. Like Monaco he had all the outputs but mystifyingly few of the inputs: the shot volume just wasn't there, and seven goals from his first 26 career shots (26% conversion) was deceptive. Sure enough a season on, and he has recorded a further three goals from 33 shots (9%), a far more realistic output for a young winger/forward type that matched his shot profile. Outlying players and teams are fun because they almost invite the challenge of analysis and cases like these occur across any league. Finding reliable signals are the challenges of analytics but when a team like Monaco is so far off the charts and the reliable metrics aren't singing the same song, you can be pretty sure that they will come back down to earth eventually.
"But Leicester" does not invalidate that.
____________
Find me on twitter @jair1970