Early skews
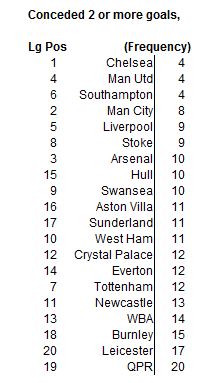
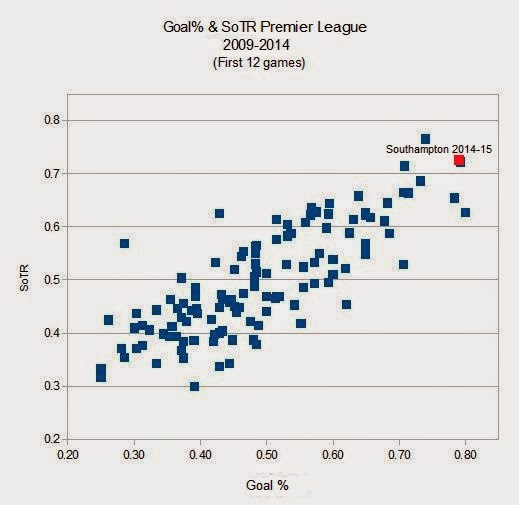
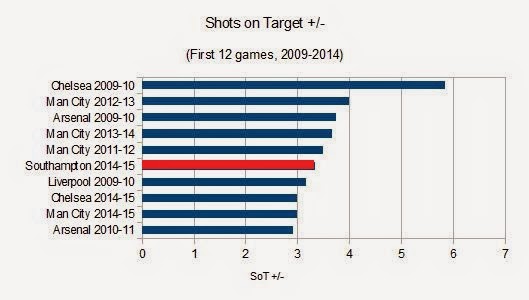
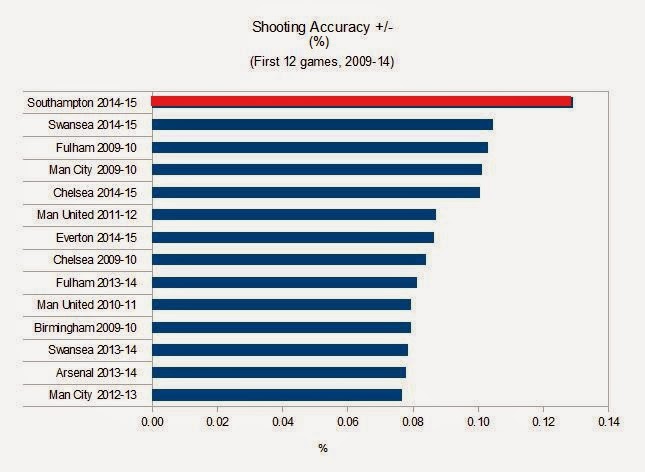
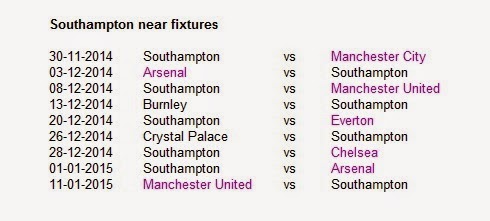
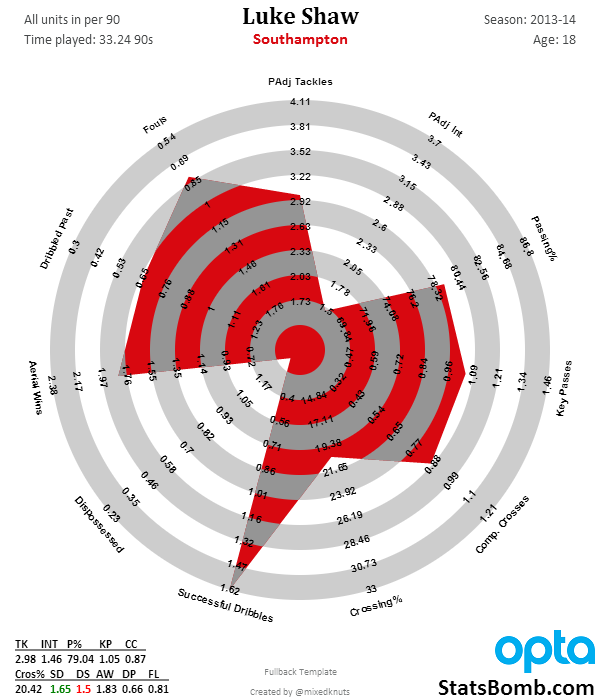
We've hit the crucial juncture of two (!) games now and already firm story lines are appearing around the media. Simple hooks are readily available to explain any positive or negative deviation, depending on which direction a team appears to be turning. Take Southampton; last season they conceded four or more shots on target on 14 separate occasions and yet in only five of those games they conceded twice or more. In all those matches combined, they ran a pretty much bang on league average 70% save percentage.
This year they've played two matches, conceded four shots on target in each and conceded five goals. Over double the previous rate. Now what we can't do is make a hard conclusion about where Southampton are as a team after two games, but what we can say is that in the games played they have conceded goals at an extremely high and unsustainable rate; this kind of thing happens regularly in a tiny sample. Already though i'm seeing the loss of Schneiderlin being called key and analysis homing in on perceived areas of weakness within the team. The two matches have also featured 15 and 17 shots from Southampton's attack- a very good 25 of which have been inside the box and shows it hasn't been a raft of potshots. It also means the true alarm bells are only humming gently in the far, far distance, almost imperceptible to anyone but the very few people prepared to shrug, make a plea for calm, look at the numbers and say: "it's early days and it could just be one of those things".
Man City v Chelsea
After the tiresome and miserable events and after-effects around the "doctors" issue, it was refreshing to get back to the football; the two top teams in the land, of course, and for 90 minutes we found a treat of a game that seemed quickly forgotten- at least by the Sky Sports pundits- and replaced by yet another dull narrative surrounding John Terry.
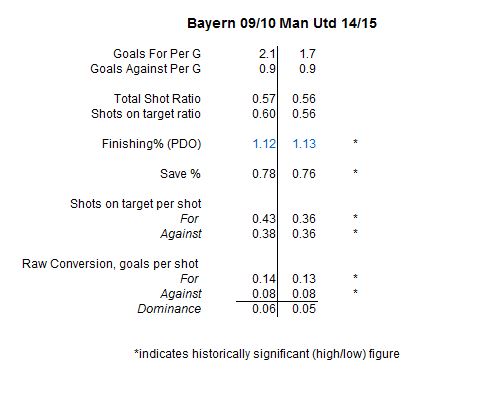
Terry's withdrawal was more interesting when held against the new found defensive generosity that has beset Chelsea so far Over the last two seasons, Chelsea have conceded eight or more shots on target on only five occasions, it's extremely rare. Now they've already done just that in both of their games this season. For all that Aguero remains the most impressive forward in the league, to repeatedly allow him to arrive ball at feet in the centre of the penalty box was not part of the Mourinho plan and we're into the realm of theories: are they worn out? Are they too old? Is it just one of those things?
Now whilst I'm happily giving Southampton a free pass for now, Chelsea's mediocre underlying numbers stretch back over much of 2015. Rarely convincing, but regularly winning, they put in a string of under-par away performances as last season wound down. They visited West Ham, Hull and QPR consecutively and contrived to be thoroughly out-shot in each match yet scored five goals from seven shots on target and picked up nine points. That two of those teams were subsequently relegated and the other showed relegation form throughout the second half of the season makes turning up at Man City and being comprehensively beaten seem a more logical extension than you might otherwise think.
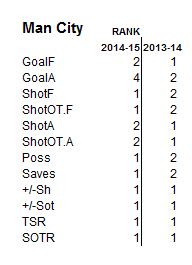
In contrast, Man City who, lest we forget, are a team who many pundits predicted were in decline and would finish fourth or even fifth, have contrived to make a mockery of such half-baked predictions rather quickly. Stronger in defence than they are often credited, they have now won eight straight games in the league scoring 24 goals, conceding just four and regularly take double the amount of shots of their opponents. Criticism of the Sterling signing seemed to be more about the nature of the transfer than the talents of Sterling himself and having pruned their attackers by letting Jovetic and Dzeko move on, they now have the extremely attractive options of Nasri and Bony as first change attackers. With the possible promise of further strengthening to add to what is already the most intelligent attack in the league, there is a distinct possibility that they just may be able to sneak a few more wins.
Bonus content
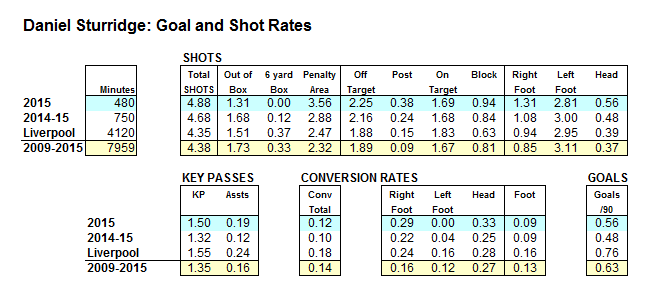
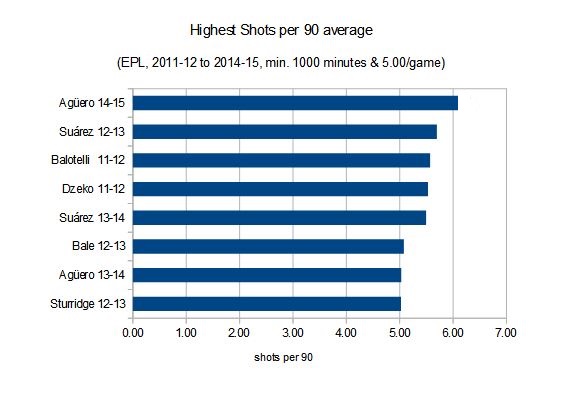
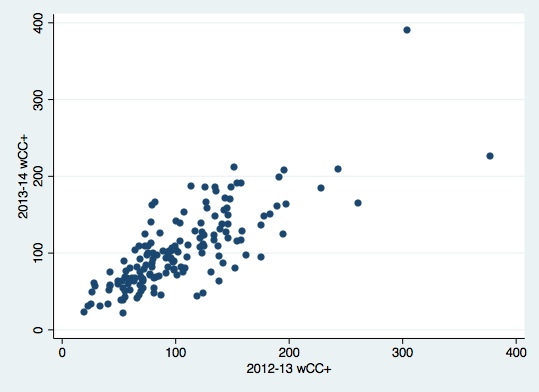
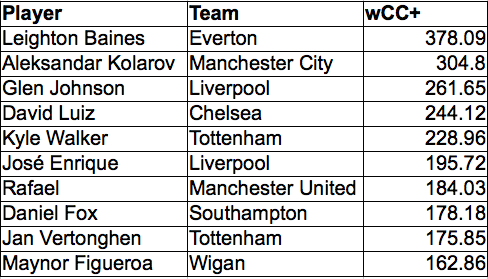
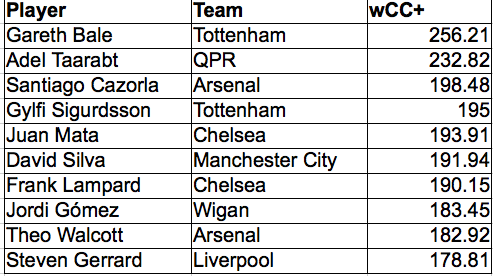
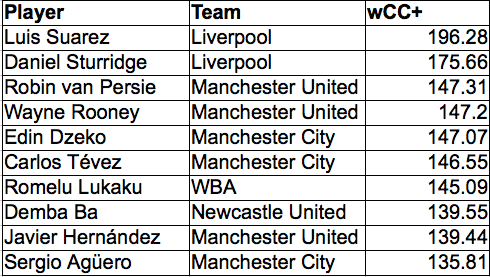
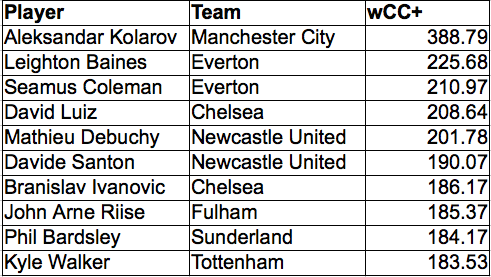
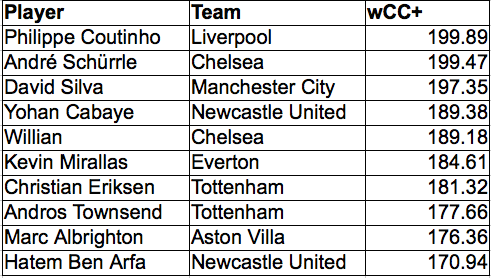
Having spent a deal of time really trying not to make snap judgements based on two games it's time to take a small diversion. Over the summer I finally put down on paper a little starter on some research i'd done on footedness in shooting and as a further hors d'oeuvre to a meal that admittedly may never be served, we have this:
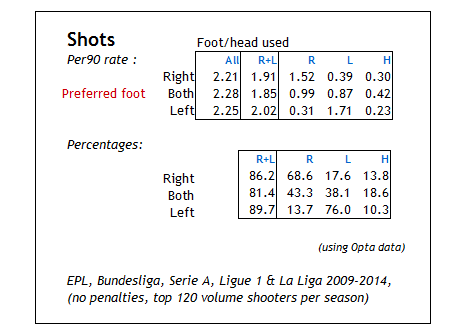
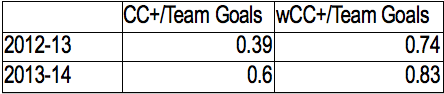
The sample is sized as such as it represents an average of six players per team, or realistically a starting midfield and forward line and there was a requirement of a certain volume of shots to ascertain which foot preference a player had. In this instance I used a 60% cut-off as a definition: a player that took 60% or more of their footed shots with a certain foot was deemed to favour that foot, and in between were deemed two-footed. This gave 70% of players as right footed, 8% as two footed and 22% as left footed.
What can we take away here?
Well, it seems that left footed shooters are more predominantly left footed than their right footed counterparts are right footed. They take 77% of all shots with their left foot compared to 68% for right footers. Left footers also make fewer headers than both two footed players and right footers. In fact, two footed players appear to show greater versatility with regard headed attempts too.
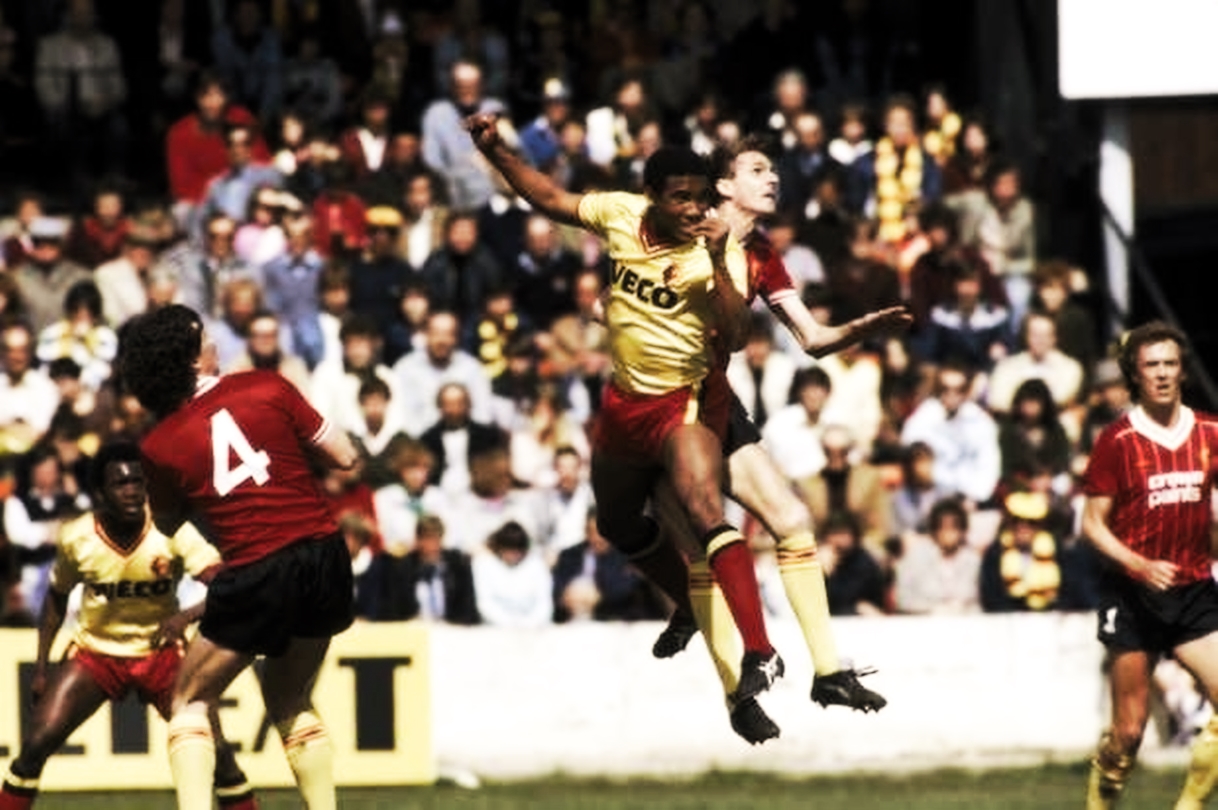
That left footers may favour their dominant foot to a greater degree seems to chime with recollections of significantly one-footed players. Erik Lamela's rabona is just one extreme example. Historically, fans have regularly eulogised about the qualities of left footers- "he's got a wand of a left foot"- to a degree that seems to exceed that of the far more common right footer. Maybe that's a partial comment on scarcity but to think of special dribblers such as Barnes, Giggs, Maradona and Messi is to evoke a thrilling aspect of the game.
Another type of left footer can also find favour: the "Hammer" left foot of Branco, Stuart Pearce, Roberto Carlos or Christian Ziege through to more modern players like Riise, Kolorov, Podolski or Bale. All players extremely and vividly biased towards their stronger foot. Maybe this is a function of position? The left footer is more obviously sent to his wing as a balance- although less so in the era of inverse wingers- and again do we recall due to uniqueness?
Anyway, that's just a few thoughts, i'm sure people have many more and I'll return to this in future.
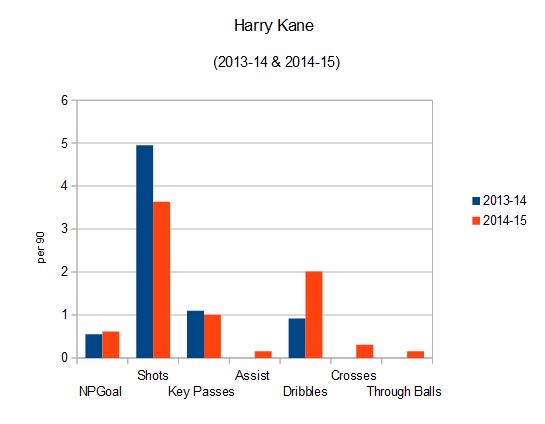
Obligatory Tottenham bit
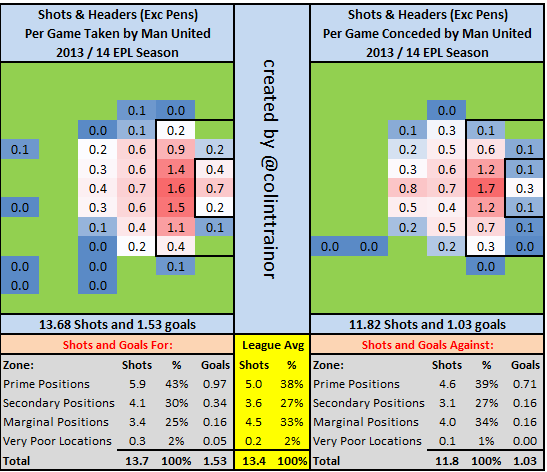
I noted last week that the seemingly improved defensive performance against Man Utd was likely to be as much about how Man Utd structure their game as to a genuine example of problem solving and in a fairly grim fashion, Tottenham proceeded to concede 16 shots at home to Stoke in the course of snatching a draw from the clutches of victory. An hour of the game was good: solid play and a couple of goals but much like this fixture last year, Stoke came on stronger as the game wore on and Tottenham visibly shrank. By the finish Tottenham were so devoid of control and nous that you'd have found fresher ideas in a new episode of the Simpsons and the lack of a Schweinsteiger figure to come on and steady the ship, much like er... Schweinsteiger had done for Utd the previous evening, was telling.
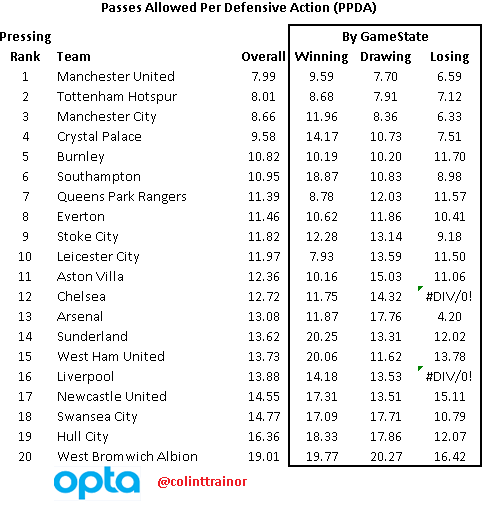
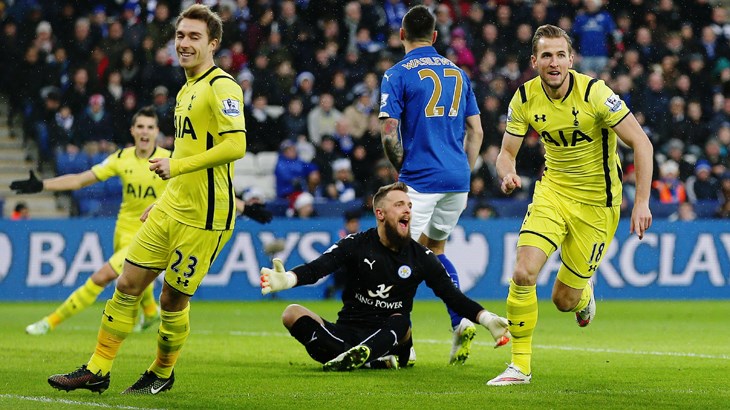
This is an inexperienced side, and it really showed here. The exciting but also young Clinton N'Jie has arrived and will at least provide some sorely needed forward options and further deals may need to be made. A visit to the Mahrez inspired Leicester beckons.
Thanks for reading!
______________
Follow me on Twitter: @jair1970