The Invincibles Project and Classics Data Pack 1

As those of you who follow me on social media are aware, earlier this year we started working on The Invincibles Project. The idea behind this was to collect all of the data from this historic season to be able to look at it through a modern lens. I had initially pitched this as a follow-up project after the Messi Data Biography as something different, and another way of unlocking football's history.

As an Arsenal fan, I found the whole thing exciting. Prime Thierry Henry! Doing things like this:

The majesty of Robert Pires. Taking bodies!

Dennis Bergkamp! Patrick Vieira! Jose Antonio Reyes! Kolo kolo Toure! Sol Campbell! Mad Jens!

*Highbury roars*

OMG SO EXCITING.

Cashley.

*crickets chirping*

Also as an Arsenal fan, I know that other Arsenal fans could use a little joy in their lives and this seemed like the only way we were getting anything fun out of the Gunners in 2019-20.

We started collecting this with an eye to releasing it side by side with the data set from a different red team, should they manage to finish their season undefeated. Sorry Liverpool fans, due to circumstances beyond our control, that data release slipped through our fingers. You'll have to settle for merely a league title and one of the largest title winning margins in history.

The Problem

In order to collect data, we need to have video. It was fortunate for us that Lionel Messi has played his entire career for Barcelona, because that is one of the few teams in the world that has historic video available on the internet from pre-2010 without needing to jump through a million hoops. That doesn't mean that getting all of the video to reconstruct Messi's club career was easy - far from it. It was merely doable.

Arsenal? The only undefeated season in Premier League history? You would think this would be at least as simple as sourcing 15 seasons of Messi, right?

It was not.

We managed to get about half the 2003-04 season from the usual sources of football video history. And then we hit a wall. Our man in Spain and historic video expert Pablo Rodriguez then went to work, checking with various and sundry collectors that he knows who have large archives of historic, important football video. Through these wonderful people and the standard exchange of goods and services we were able to get to 32 matches of video. And then we hit another wall.

Why? well as Andrew Mangan of Arseblog reminded me, not all matches during that time period were broadcast to TV. In the modern day, every Premier League match is broadcast to air in multiple countries, which makes it easy to grab that video and store it away on a giant hard drive. Back then? A number of 3PM matches on Saturdays were simply never broadcast. (At least to our knowledge.) Which means that the collectors would not have that video unless they somehow tapped into different sources.

We checked with Arsenal. I've been lucky enough to meet people that work for the club over the years, and we figured maybe they would let us have access to the video to collaborate on the data release and some cool stuff with club media. And they totally would have been...

Except they didn't have the video either.

Someone who worked for Prozone back in the day suggested that the opponents might have those videos, as they would have been delivered by courier as part of their service. But that ran into a variety of snags, including the fact that football clubs change personnel on this end with remarkable regularity, and having the archive, being able to access it, and even knowing who to talk to was insurmountable for us.

The other problem here is the transition from analog to digital. Pretty much all archives back then were tape archives that would later need to be digitised so the match would be preserved for history. Rob Bateman of Opta tells the tale of trying to collect old Premier League matches from the 90s and being surrounded by crumbling video tape from the league's first decade. These Arsenal matches came right at the tail end of that period, and my understanding is that the PL has started to archive its history as much as possible, but it's still very much a work in progress.

Finally you hit the problem of a license fee. We got in touch with the archive service with a willingness to pay a fee to obtain the final six matches needed to complete the project. We were quoted a figure to license the video for the entire Arsenal season that frankly didn't make any sense to me, and certainly eclipsed my budget for a public service project.

I wanted to get everyone a data gift to bring people some joy during the pandemic, but I didn't want to/could not pay the price of a car to make that happen.

The Premier League itself actually showed willingness to help us out, but as you can understand, they are rather busy with other priorities right now (like restarting the league during the middle of a viral pandemic) and suggested maybe we can revisit this when the world wasn't quite so mad? Which totally makes sense.

But I have an anniversary data release deadline, and thus here we are.

Incomplete Invincibles.

Classics Data Pack 1

To make up for my own disappointment in not being able to complete this project, I added some extra matches I thought might interest people, including non-Arsenal fans. So what you are getting today as a gift from StatsBomb is a hefty little slice of football history, wrapped in the above-named package. In addition to delivering 32 of 38 matches from the Arsenal 2003-04 Premier League season, we are also giving you UEFA Champions League Finals data from 2000-2019. The collection on those CL matches aren't all finished, so will trickle out to the repository gradually over the next week to complete the set.

Thank you to all of the fans out there who have supported StatsBomb over the years. Thank you to our customers who buy our products and give us feedback to make us better every day.

And thanks to Arsenal for a truly magnificent season and set of memories. It would be great if we could get some more of those sooner rather than later. Information on how to access the data is here

A complete primer (in English and Espanol) on how to work with the data via StatsBombR is here

*EDIT: A new, updated version of the R Guide can be found here

The data comes with our standard non-commercial license that is usable for fan analysis and academic research. If you are a commercial entity that would like to use this data, get in touch with sales@statsbomb.com and we can have a conversation.

All the best,
--Ted Knutson
CEO, StatsBomb

*If we get video and I still run StatsBomb, we will finish this project.

StatsBomb's Introduction to Analytics Course is Now Available

Today StatsBomb have launched our Introduction to Analytics course as a fully online video course. Adapted from our one-day course, it is designed to get anyone - from professional coaches and analysts, to fanalysts and fans - up to speed on the basics of football analytics. This is the same course we have taught to FAs and professional football teams around the world, and now it is available for everyone to learn from their homes. The course covers the following topics:

  1. Expected Goals and Shot Locations
  2. Types of Attack
  3. Set Piece Data and Analysis
  4. Defensive Choices
  5. Team and Opposition Analysis

You can purchase the online Introduction course here: https://courses.statsbomb.com/

We had almost 1000 people signal interest in the course within a week when we first announced it was coming. We’ve also had very positive feedback from Directors of Coaching at multiple professional clubs because they want all the coaches in their system to learn the course material. If you have any questions about it, feel free to send an email to support@statsbomb.com

Frequently Asked Questions

Are you ever going to make a book out of this?

One of the reasons we didn’t turn this into a book is because it includes considerable video examples that help explain and emphasize the points. We feel this is important in easing coaches and new data people into the idea that when collected correctly, data and the video should be the same thing. That’s not to say that we won’t make a book eventually, but it will probably look quite different from the courses as they currently exist.

Will you make this course available in other languages?

Yes. We intend to produce a Spanish language version of this course and make it available in May 2020. Depending on how that is received, we may make more courses available in Spanish and look to expand the languages as well.

Are you going to make other StatsBomb courses available online?

Yes. Signups to a webinar version of the Designing and Coaching Set Pieces course should be posted on our social media this week. The new Player Evaluation course will also be taught via webinar. The first airing of this course will likely come in May. 

Why haven’t you made the course available for free?

When we teach this course in person, the cost is usually £125, which helps to cover travel and venue costs. We still have some costs - we have to pay for the hosting and signup site - but we’ve been able to drop the base price for the online version all the way down to £50 + VAT. That said, it took us over three man months to create and build the course material. It has also taken multiple additional weeks to update, adapt and record it to be delivered online. We strongly encourage analysts not to do free work for people - your time has value.

We therefore didn’t think it was out of line to ask people to pay for this.

To be honest, people have asked me since 2013 how they can give back to StatsBomb. They appreciate all of the free learning, analysis, and data we have provided over the years with zero monetisation.

If you are interested in showing us some love, paying for our courses and recommending them to your friends is a great way to do so. --Ted Knutson CEO, StatsBomb

StatsBomb Release... Not Radars

At StatsBomb, radars are our iconic way of visualising player and team stats. There has been a ton of development and research put into them since 2014, and if you are interested, you can read about various updates here and here.These days they are seemingly ubiquitous in the football landscape.

However, we know that radars are not the only way to visualise data. Radars are actually quite good at serving their purpose, but StatsBomb IQ is mature enough to deliver other options. Today’s StatsBomb IQ updates did the following:

1. Update radar position specific stat boundaries with new data from the past year.

2. Add percentile radars as a visualisation option.

3. Update the information provided on radars into a new panel.

4. Add distributions as a visualisation with many different options for use cases. (Which I will explain in detail below.)

5. Comparisons happen in the radar screen now rather than saving to compare -> going somewhere else. We feel this offers a cleaner UI than what we had before.

6. Using distributions you can now explore team and player stats as percentiles in the league pages.

We wanted to release these updates to allow customers to become comfortable with the changes and new features before moving to the next step of the Customisation project. That step will allow customers to build their own templates for radars and distributions from scratch, which is probably the most requested new functionality we have had.

First things first though…

Template Boundaries Have Been Updated

We update these about once a year as more data comes into the system. They remain based on positional populations for each stat in the big 5 leagues across multiple seasons. However...

New Positional Population Distributions

One element we are working on is creating new population distributions to compare against. In our email to customers, we explained that they should read the detailed WARNING included on the website before making changes to the distribution settings.

And then, as if by magic, we proved exactly WHY you would want to be careful messing with the default settings ourselves by accidentally including all the historic La Liga data we collected for the Messi Data Biography in with the default population calculations.

The problem? Those league seasons only include games from Barcelona, where they are typically trouncing 19 other opponents, and nothing else. Barcelona and the 19 cream puffs then made their way into the team data set, where for some reason defensive stats went kind of crazy as 13 * 20 additional funhouse mirror La Liga seasons were included in the population. It was now weirdly normal for teams to concede 3 xG a match on the defensive side of the ball.

So uh… we’re fixing that bug ASAP.

And thanks Messi!

Percentile Radars

In addition to normal stat radars, you can now choose to show stats as percentiles for the position. This gets rid of the 5%/95% cutoffs from the normal templates and replaces calculated stats with percentiles for the entire population of output at that position. Depending on your use case, these may be strictly better ways to display player skill sets than the traditional value radars.

Information Display Updates

We have changed how we display information quite a bit with this update. The new table contains the basic statistical output per 90 as well as the percentile for that stat.

New Display Option: Distributions

I have wanted to add non-radar, sciency ways to display player and team data for a long time. We  researched (actually, I say we, but Nat James did most of the work on this) and tested a variety of potential options and these were the ones we felt matched what we wanted to accomplish in terms of information display and statistical precision.

They also have a number of selectable display options under “Distribution” on the left hand menu. We’ll work through each option and the use case below.

Plot Type: Area/Violin

Area is selected by default. Violin mirrors the area plot.

Distribution Displayed: Positionally Filtered/Any Position/Both

In the distro plots, we allow you to choose your options. Positionally filtered cuts the distribution of that stat to only players who have played significant minutes at that position. Any Position shows the distribution of that stat for all players.

Both… this is where things get a bit more complicated. If you have Area chosen for Plot Type, then choosing Both here displays the full population distribution as a dotted line.

However, if you have Violins for plot type, the top distribution will show the position filtered distro and the bottom one will show the full population.

Distribution Colouring: Radar Colours/Percentile Gradient/Metric Distinction

These are just preferences for how to colour the distros. Percentile Gradient offers some colour clarity to what percentile a player comes in at, but those values are also contained at the end of the vis.

Template Limits: Not Displayed/Dotted/Notches

In case you want to keep some grounding to the old radar style, you can choose to add either Dotted marks at the 5%/95% boundary of the population or you can add notches for each part of that distribution.

Comparison UI

Comparisons now happen on the front page. There is a drop down that loads your favourites for comparisons, or you can type to search for new ones. On any radar, clicking the star in the top left will add a new favourite. These can then be managed under the favourites menu that loads when you click the person icon in the top right of the IQ screen.

Both radars and distributions now offer overlays for comparing players and teams.

It's a big update to our platform and one where explaining the design choices and showing the new vis doesn't really encompass how much new stuff there is for customers to explore. And, as noted earlier, this is the first phase in a multi-phase release that will allow customers massive customisation options in how they choose to visualise and analyses information in StatsBomb IQ.

Thanks for listening!

--Ted Knutson CEO, StatsBomb

One fantastic result against Bayern is a reminder that Adi Hütter is good for Eintracht

It's an apt time to praise Eintracht Frankfurt, days after die Adler trounced the mighty Bayern, ending a 16-game winless streak and former SGE coach Niko Kovač’s tenure in one fell, 5-1, swoop.

In all honesty, we should have known better, or at least I should have.

Regretfully, I picked SGE to fight against relegation last season — on the back of losing to 4th-tier SSV Ulm in the first round of the cup and the 5-0 evisceration by Bayern in the Supercup. I shared others' concerns about new coach Adi Hütter, who wanted to play the RB school’s 4-4-2 without wide players, and only later switched of 3-5-2 when he realized he would have to reinvent the careers of Danny da Costa and Filip Kostić. So, this prediction was perhaps not as crazy as the results suggested — but at least I didn't say it aloud during my first-ever analyst appearance on TV or anything...

My prediction was doubly painful having followed and covered Eintracht’s long-awaited rise from being “the moody diva” of the Bundesliga to European relevance. Under the stewardship of Peter Fischer, who frequently speaks out against and bans AfD voters from being Eintracht members plus buys fans beer at matches, Eintracht have reinvigorated their football club into a passionate, multicultural project that Frankfurters can be proud of.

On the footballing side, board member Fredi Bobic’s wheeler-dealer attitude, aided by a smart scouting network coordinated by chief scout Ben Manga, has rescued many wayward talents from big clubs in need of playing time (Ante Rebić, Marius Wolf, Omar Mascarell, Jesús Vallejo, Evan N'Dicka) and scouted young gems from lesser-known leagues (Luka Jović, Mijat Gaćinović, Sébastien Haller, Daichi Kamada). They also turned veteran cast-offs like Kevin-Prince Boateng, Sebastian Rode, Gelson Fernandes and Jonathan de Guzmán into competitors.

The Buffalo Herd has become the Portuguese Pack

Despite their success last season, few (including myself once again) thought that after profiting 100 million Euros from the Jović and Haller departures and losing Rebić, Eintracht would somehow emerge as an even better side! But that seems to be exactly what happened, as the combined 10 million spent on Porto’s Gonçalo Paciência (who put up some good numbers off the bench last season), and Bas Dost of Sporting, as well as swapping Ante Rebić for AC Milan's André Silva, has led to, if not an actual increase in production, certainly no drop-off.

Frankfurt have accumulated 1.50 non-penalty expected goals per match and conceded 1.31 xG against vs 1.46 and 1.43 numbers last season. So, while they are once again on 17 points from ten games this season, they have an improved xG difference of 0.19, up from 0.03 over the course of last year.  The Eagles have already faced the top five sides by xG difference.

With their next two opponents, Freiburg and Wolfsburg, coming back down to Earth, followed by three against bottom-dwellers Mainz, Cologne and Paderborn, don’t be surprised if Paciência and Co. are in the Champions League spots in January. On an individual level, last season’s 41 goals by Jović-Haller-Rebić (the "buffalo herd," as they were affectionately known) is the same pace that Paciência-Dost-Silva are on, with 12 in 10 games.

The other remarkable thing is that with 1.47 non-penalty xG per 90 minutes, the Portuguese Pack is bringing a better return than the 1.3 of Jović and his partners. Paciência, in particular, has really come into his own. He's not only a goal scorer but an increasingly well-rounded striker, contributing to all facets of Frankfurt's game.

Crossing their way forward

Eintracht's improvement is impressive. Throughout his time in Austria and Switzerland, Hütter’s teams shunned possession and instead relied on vertical ball progression and counterpressing to create attacks. Unlike last season, Frankfurt almost never play three strikers at the same time (though it’s easy to forget that Hütter didn't install Rebić behind Haller and Jović until early November). Instead, behind the front two of Paciência and either Dost or Silva, Frankfurt play the creative Daichi Kamada, who remains scoreless despite averaging almost 0.3 xG per 90.

The 23-year-old, signed for 1.6 million from the J-Leauge's Sagan Tosu, scored 12 goals while on loan with Sint-Truiden in Belgium last year, is a Hütter favorite, especially after tearing up the preseason. He flashes on tape for his ability to create space and chances for himself, and though Kamada has to improve his finishing and should consider better shot selection, it seems like Eintracht got themselves another potentially useful creator.

Although he does not have the defensive pressing skills of Rebić, Jović lacked this as well, so perhaps it all evens out. 

And despite losing Jović and Haller, they once again are the most cross-reliant team in the Bundesliga.

Bas Dost, despite his somewhat limited Bundesliga minutes, remains an absolute monster in the air. His 8.48 aerial wins per 90 are 1.5 more than any other attacker who's played over 300 minutes, and his 66% win percentage on aerial duels also leads all strikers in the German first division. Dost, especially if he plays more regularly, should be an apt replacement for Haller, the most prolific attacking aerial battler in last year's Bundesliga in that regard.

The challenge of crossing, of course, is that it's inherently inefficient and lots of balls into the box will amount to nothing. There's no greater example of this challenge than Filip Kostić. Hütter has converted the Serbian from a left winger into the league’s preeminent attacking wing back. The 27-year-old is an absolute crossing machine, but as you can see from all that yellow, most crossing machines, even the best ones, misfire a lot.

Never one to tire out, Kostić is also putting up a career-high 3.6 shots per 90, breaking an 0 for 27 start with a tap-in after a deflection off David Alaba in the 5-1 rout over Bayern. Congrats on upgrading your xG per shot to 0.07, Filip.

Aggression and Depth

While crosses may not be efficient, pile enough of them on top of each other and a team can generate a pretty effective attack. They also allow a side to have the spacing it needs to initiate an aggressive press on the defensive side of the ball.  Hütter has dialed up Eintracht's already above-average pressing. Their passes allowed per defensive action is down from 10.58 to 9.04 and Kostić’s left side seems even more aggressive this season. The average distance from their own goal to where they perform a defensive action has also increased, jumping from 43.96 to a league-best 47.71 this season.

Given the side's depth, Hütter can ramp up his already aggressive system. Last season, Frankfurt began showing signs of setting up in an intriguing three center back format.

Instead of playing three narrow defenders and urging the wing backs to come in deep to receive the ball (they only really do this when defending in a deep block), Hütter used Kostić and da Costa up as wingers last season. What's most significant is how they set up centrally and wide. Their defensive midfielders drop deep to aid ball circulation (in a five-minute spell in the first half against Bayern, all three — Djibril Sow, Sebastian Rode and Gelson Fernandes — did this), create numerical superiority and secure the middle against potential counterattacks.

This allows their wide center backs to press high near the opponent's box. In addition, they are instrumental in their ball progression via long diagonal balls to the central strikers dropping between the defense and midfield. The importance of diagonal balls, as RB Leipzig manager Julian Nagelsmann often likes to say, is that they are much harder to intercept, and the better angle gives an easier chance of completion.

The central center back is also tasked with dribbling up the pitch when given the opportunity. Last season that onus fell on 35-year-old Makoto Hasebe, who played like a modern-day libero and was considered by kicker to be one of the top CBs in the fall season. As his age and injuries have caught up to him, he’s made defensive mistakes (conceding a needless 90th-minute penalty vs. Bremen, for one), allowing Martin Hinteregger to move inside.

The 27-year-old Austrian has always been one of the more colorful Bundesliga characters:

    • While still an RB Salzburg player, lashed out against another Red Bull club, Leipzig, thus forcing a move to Augsburg.
    • He hanged his smartphone to a flip phone after he got fed up with Augsburg coach Manuel Baum sending him and his other players tactical videos on Whatsapp
    • During an interview, he famously “couldn’t say anything positive about Baum.” 
    • Shortly after, he asked to be released in a drunken training camp video
    • He was dismissed from the Austrian national team after staying out until 7am celebrating his 27th birthday during the Euro qualifiers
    • And he ecome a folk hero and the star of the legendary “Hinti Army” video  Yes, it’s a joke poking fun at Status Quo’s 1986 hit.)

On the other hand, Hinteregger can carry the ball out of defense like this:

Hinteregger, who has already scored three goals this year, is among the best Bundesliga defenders. Due to the risks Frankfurt take with their aggression and high counterpressing, they can get caught in the extreme three attackers against three wide center backs defensive system. This might result in slightly more clear shots and higher per match xG conceded, but so far the xG remains low enough, and the team's actual goals conceded remains in line with expectations.

Put these numbers together and it's obvious Frankfurt are an extremely well-managed side. Adi Hütter is now averaging 1.8 points in 71 matches, on a contract that runs until 2021. Though there's been no news out of Frankfurt regarding his future, if Niko Kovač's career and the last they years of Eintracht’s excellent operation is any indication, they might not be able to hold on to him for much longer. Of course, they’re probably just gonna pull another great coach out of that scouting folder….

We Want to Hire You

StatsBomb is currently experiencing explosive growth and has sailed through the startup phase straight into the scaling phase. 

In order to do that, we need great people.

Like you.

Why Should You Work At StatsBomb?

Because you love new challenges.

We are shaping the future of data in sport. That includes new technology, new visualisations, and completely new ways of thinking about the game. That is challenging work that changes on a regular basis, but if you are the type of person that loves figuring out new things, StatsBomb is a great place to be.

Stock Options.

Nearly every one of our employees receives stock options in their first year on the job. We believe strongly that our employees deserve a piece of the business they are helping to build, and our compensation plans reflect that.

Our revenues have more than doubled each of the last two years. If we can keep this up - and honestly, we are just getting started - it’s easy to see how this can turn into significant additional earnings over time.

Space to grow

One of the best things about working in a young startup that is growing is that new positions open up all the time. This means employees who excel have plenty of scope to move up in the organisation as the company grows.

Speaking of space, we are about to move into a brand new office before the end of the year, just outside the train station in Bath, fully equipped with a kitchen, free coffee, plus bicycle storage and showers.

Only 3 Days in the Office per week.

We hire highly motivated individuals, and in return we are able to offer huge work-life flexibility to our employees. Gathering the team together remains important, but most of our employees find quiet working days at home hugely valuable. Office hours are also somewhat flexible, removing much of the daily stress from commutes, school runs, etc that you get from more strict companies.

You want to work around incredibly talented people.

You can’t build a great company without a great team of people. We have that right now and already need more.  By joining our team, you get to work with some of the best people in the sports data field on a daily basis.  You also get to work with some of the biggest football clubs in the world.

Bath is gorgeous.

Bath is a UNESCO World Heritage city and one of the best cities in the UK for quality of life and work/life balance. It’s only 15 mins by train from Bristol, 30 minutes by train from Swindon, and an hour from Reading and Cardiff.

Job Openings

Our careers page is a work in progress, but expect to see new job postings frequently in the coming weeks. In addition to the 2 Junior Front End Developer roles and the Accounts Administrator role currently listed, we will also have full-time positions for

  • UI Designer Digital
  • Project Manager
  • Computer Vision
  • Developer Graphic
  • Designer Junior
  • Data Scientist
  • Quantitative Football Analyst

If you have ever wanted to come work at StatsBomb, now is the time. Even before a job description, if you think your skill set fills these titles, please send a CV to careers@statsbomb.com. To fill these roles, you will need a valid UK work permit and to work in Bath three days a week.

Ted Knutson

CEO, StatsBomb

A Sneak Peak at IQ Tactics + A Brief History of Radials/Sonars/Wagon Wheels in Soccer

Our summer project in StatsBomb IQ has been something I wanted to develop and release for more than 18 months now, but development work on the project was sidetracked by becoming a data company. Unintended consequences and all that jazz. Anyway, it looks like we will release this new section of StatsBomb IQ as a beta release next week and we are calling it IQ Tactics.

I’ll give you all some brief previews of the new module toward the end of this article, but first we’re going to talk about wagon wheels.

No, not THAT wagon wheel… these.

Why are we talking about wagon wheels? A fair question, and one I am glad you asked. The answer is partly because we have incorporated them into IQ Tactics for some good reasons, and partly because I’m a nerd who feels the need to cite and credit past examples and influences when producing new things. 

So what is a wagon wheel? It’s a cricket vis that shows where batters have hit the ball around the pitch. You can use them to better place fielders, find batter tendencies, or for various and sundry other reasons specific to the game of cricket. They make a lot of sense for cricket, because unlike nearly every other sport, cricket’s primary battles take place in one central spot of the pitch (okay, technically two) surrounded by a circular surface.

Obviously football is played on a rectangular pitch and has no consistent central points of origin - why are we talking about this type of vis at all?

Well, because passing data is a lot. Like, a lot, a lot. You can’t just map the data and have it make any sense because there is too much of it. This is sort of true for a single game, but especially true when it comes to mapping a high volume passer, or even a low volume team across a stretch of games or an entire season.


Here are maps of three different aggregations of passing data. Red represents one completed pass, yellow represents an incomplete one. The first map is Manchester City across a single game. The middle is Marco Verratti across the whole of last season. And the last one is Burnley from last year. As you can see, the last two kind of stretch our ability to make any sense of what is happening apart from the colors here suggesting that Marco Verratti is considerably better at completing his passes than… um… Burnley.

So what do you do? Well, lots of things are possible, but from a process perspective, you need to take all of this highly granular data and abstract it in a way that can be interpreted. Traditionally we use heat maps or zone maps to help here, but like all vis, these have their own strengths and weaknesses.

These are zone maps from Engine Room in StatsBomb IQ. They allow us to compare passing tendencies when the ball gets to a particular position in the pitch. In this case, I’m comparing Manchester City and Cardiff City from last year.

This vis shows where the NEXT pass typically goes for both teams. Notice the difference between how often either team plays the ball wide vs central, or in Man City’s case, directly backward from the zone they are in.

And this vis shows where the buildup pass came from. An entertaining 4% of all passes played into the zone directly outside the 18-yard box for Cardiff City came directly from the GK, while practically none of the passes Man City played into that zone came from their own half. Good ol’ Neil Warnock, out there tacticsing the place up.

Anyway, these are fine and zonal or topographical heat maps are probably better, but for our new module I wanted to explore the radial/wagon wheel/sonar vis style and see what we could do with that. 

As noted before, football differs from cricket in that it has no fixed origin point, but what if you made the origin of the pass the central point of the vis, and then looked at all passes from that perspective? These types of plots have been around in football/soccer for quite some time.

The first time I remember seeing them was a link from Howard Hamilton pointing to some random Chelsea blog doing the visualisation work in Tableau. Now this was before I was doing any work in football analytics (I was in gambling back then), so I didn’t pay much attention other than to mentally note, “hey this thing exists,” before totally forgetting about it again.

It turns out that piece was written by current interim editor-in-chief of SB Nation, Graham MacAree. Before he was being full-time obnoxious to Zito Madu (a noble cause, if ever there was one), Graham was creating unique data vis for Chelsea fans on We Ain’t Got No History. Two things continue to impress me about Graham’s foray into radial passing plots.

  1. He did this in 2011.
  2. The bloody thing STILL WORKS.

So yeah, Graham is very clever and has been for a very long time, and if you ask him, he will tell you all about it.

The next time I remember seeing these types of vis were in David Sumpter’s FourFourTwo pieces circa 2015.


Sumpter took a zonal approach to wagon wheels on the pitch that he called a “distribution map.” Longer lines meant longer passes on average from that zone, and he used a black-to-white colour scheme to indicate how common passes were in each radian, with black meaning very common and white meaning uncommon. With Graham’s design, this colour scheme isn’t necessary, but the single line scheme quickly gets overwhelmed as the season progresses.

The next iteration of these I saw came from Ben Torvaney in April 2016. He used radial shards from a single zone and analysed Middlesboro’s passing by game state to see how aggressive or conservative they had been. It’s a lovely wrinkle to the analysis and a very readable blog post.

The aforementioned Howard Hamilton circled back on these in late 2016 with a very faithful cricket-style vis.

Finally we get to Eliot McKinley’s work on Twitter and the American Soccer Analysis blog. The ASA guys have been quietly innovating different vis approaches for years - partly due to a willingness to just try shit and a lot because they are smart - and Eliot’s passing “sonars” are by far the most attractive version of the radial/wagon wheel vis that I have seen. The initial ones I saw were the positional sonars like the one below…

I looked at this and started thinking about zonal versions like what Sumpter and Torvaney had done to help look at game model information to make things more easily interpretable. Discussion around the concept even ended up in my Barcelona Coaches Summit presentation.

So even though the vis wasn’t there yet, the application was now fairly clear in my mind. The idea stemmed back to some old work Oliver Gage described in writing about his coaches’ game model when he was an analyst at University of Virginia. I’m paraphrasing here, but it was ideas like, “How often did we get the ball into these various zones? What did we do when we got there? We need to pass the ball forward x% of the time when we get into these spaces in order to put pressure on the opponent and have a chance of success.” This felt like one of those situations that these types of plots was made for.

Eliot also started doing zonal plots around the pitch, though he uses different size for his zones than we do at StatsBomb.

For our own versions, we ended up using length of shard compared to league average for the spatial component (shard length) and then the colour component is just raw pass completion percentage as default. However, we’ve added a number of other options that may still see release for IQ users to tweak to their liking.

We’re also keeping the name “sonars” out of respect for Eliot’s gorgeous work. He will tell you himself that he wasn’t the first to try this style of vis on passing data (and MacAree probably wasn’t either, he’s just the first I am aware of), but Eliot’s are certainly the best versions and he deserves the recognition.

Though we may choose to give the throw-in specific “thrownars” a miss...


So these are seasonal sonars for passes made by Manchester City and Cardiff City. It's a heatmap scale where deep red is a very high level of completion and blue is a comparatively low completion percentage.

And then these are sonars for Man City’s passes (again) but the second image is passes from Manchester City’s opponents.

You can also do player seasonal sonars like this one for Lionel Messi, Barcelona 2018-19. We also can go from abstraction (with the sonars) to explicit data with a simple click of the button.

My tweet of Ederson’s goalkicks compared to PSG’s went viral last week while I was playing around with the new tool. Then came a flood of requests for other comparisons. Here are Ederson, Allison, and Manuel Neuer’s goalkick maps from last season.


Even when compared to other famous goalkeepers, Ederson - and how Manchester City use him - really is something else.

And the new Tactics tool can do this type of vis for any team or player, with dozens of potential filters added on. And this is just the sonars section, which is probably the smallest and least powerful part of the new release.

*deep breath*

This is already long, but I’ll give you just one more teaser of what's coming next week before I wrap up.

Let’s say you wanted to look at Virgil van Dijk and those raking crossfield balls he plays for Liverpool. First you load up VVD’s profile. Then you click passes, and you select starting origin of his own half and ending origin of the wide zones on the pitch. 

Voila!

Okay, now just show me the ones to Salah and Mane.

And finally… just show me the passes he made with his left foot compared to those made with VVD's right.

IQ Tactics will change how coaches and analysts work with data from a tactical and opposition scouting perspective. Our goal is to take this information and make it as simple and intuitive as possible to deliver insight that helps our customers win games. I helped design the thing and I still can’t quite wrap my head around all of the cool stuff it can do. It is genuinely that exciting.

Anyway, it goes into Beta release on the StatsBomb IQ platform next week for our customers. If you are interested in having a demo of the new toys AHEM tools, ping sales@statsbomb.com to get started.

--Ted Knutson

CEO, StatsBomb

ted@statsbomb.com

PostScript: If you find yourself wondering what can be done with IQ Tactics and the Messi. Data Biography, you are in good company.

Introducing the Lionel Messi Data Biography

Scene: StatsBomb Strategy Meeting, Autumn 2018

“Should we release a new men’s data set soon? People seem to really enjoy the World Cup.”

“Probably? We’re definitely going to release the Women’s World Cup next summer, and we’ll put it out daily.”

“Oo, I like that.”

“Okay, but back to the men’s side… what could we release that would matter?”

“We could do a season of Premier League data. That would certainly get eyeballs.”

“Nah, Manchester City already did that in 12-13.”

“Really? Man, where did that data go? No one even knows that.”

“It’s not a terrible idea, but maybe we can do better.”

“What about a season of La Liga? I feel like that market has been under served and deserves some love.”

“Not bad. Maybe you do 17-18 so you get both Ronaldo and Messi in it.”

“That seems fine, but I’m still not excited.”

“I have this idea for some older matches. The Manchester United treble turns 20 this spring. It would be really interesting to collect some of that run and do the analysis of those games in a modern light.”

“Oo, I love that. Let’s do it.”

“Yeah, but it’s still not enough data for a public release. People want something they can sink their teeth into.”

“What if we release the last two seasons of Cristiano Ronaldo and Lionel Messi and really compare from a data perspective? They are clearly the two best players of all time.”

“Ronaldo, yuck.”

“One or two seasons of Lionel Messi isn’t cool."

"You know what would be cool? ALL of Lionel Messi.”

*silence*

“Oh shit... that’s never been done. Messi started in like 2005 - I don’t think data companies produced x/y data that early.”

“Can we even get the video on that?!?”

“Let’s find out!”

And that is how the Messi Data Biography began. Getting the video was an enormous pain in my ass. None of the usual video platforms have video anywhere near that far back. We then talked to friends, clubs, and former media rights holders for months trying to track down all these matches. I pulled every string I could think of and we were still only able to get to about 90% completion, hitting a hard wall with the last 10%. About at the point where we were going to buy DVDs off eBay in a hope we could fill in as much as possible, Pablo Rodriguez found a super-fan video archivist, and this source filled in all the missing matches. You all owe Pablo many, many drinks for his service. I’ve basically been floating on a cloud ever since.

So what is the Messi Data Biography? Quite simply, it is a data archive of every match Lionel Messi has played in La Liga since his career began in 2004-05.

We collected all of this data with our own time, energy, and crossed eyeballs (the old video is really poor quality) over the last few months as a kind of passion project. At this point, every single member of the StatsBomb and Arqam team has contributed, and I can only thank them for all of the hard work getting us to this point.

The MDB exists on the top tier StatsBomb Data spec for the 18-19 season, so despite the fact that these matches occurred as far back as 04-05, the data is the same incredibly rich event data our Champions League customers use right now.

It was expensive. It was painful. It is… fucking brilliant.

Messi's first senior goal? We've got that. Messi's entire Pep career? That too. The body count from all of the opponents Messi nutmegged in his career? Also in the data!

And we will be releasing all of this data TO THE PUBLIC over the next four weeks.

To recap: Free data. For the entire La Liga career. Of the greatest footballer ever.

The schedule from July 15-August 9 (a.k.a 'Messi Month') looks like this:

Monday - Analysis from each set of seasons will be published on StatsBomb.com and our media partners.

Tuesday - That same data will be released to the public for non-commercial use. The first Tuesday, we will also publish our own R primer written by Euan Dewar to help people who are new to the data and R get started.

Wednesday and every other day after - You get to analyse, visualise, and simply play with the data yourselves.

This is our gift to football. We hope you enjoy.

--Ted Knutson
CEO, StatsBomb
ted@statsbomb.com

P.S. I know there will be soooooo many questions people have. I may put out an FAQ next week to answer the bulk of the important ones. (Like will you release all of Messi's CL data, etc etc etc.) For now, just enjoy your weekend!

P.P.S. I said I wouldn't leak until July 15th. I didn't. This isn't a leak. This is an ANNOUNCEMENT. It's like, a totally different thing.

NOTE: If you wish to use any data from the Messi Data Biography for commercial purposes, please send an email to Sales@StatsBomb.com

Young Talent Reflections Part 1: Wingers

Over the past two seasons, I’ve dedicated the majority of my writing towards Europe's prospects and attempting to figure out makes them tick.

While my previous writing slanted towards player profiles on younger players, the general success rate of youngsters coming out of Ligue 1 was what drew my focus. The past two seasons have been an attempt at expanding coverage of young talents using the same model of analysis to cover the other big 5 leagues along with the Eredivisie. I’ve always found it to be more interesting in focusing at the individual level versus the team as a whole when examining football, which could be reasonably seen as a bit counter-intuitive given that soccer isn’t quite like basketball where a superstar can be such a dominating figure in affecting wins/losses. There’s also a much richer tapestry of public football writing at the team level compared to young talents, so there was a niche to be had in attempting to examine prospects at a deeper level.

Part of the inspiration for focusing on individuals comes from a website that actually has nothing to do with football, but rather a basketball website called The Stepien. The Stepien is a website dedicated to in-depth and nuanced coverage on young basketball prospects in relation to the NBA draft, their chances at being able to make it to the NBA, and what their potential ceiling is as prospects once they get into the league. One of the things I appreciate about them is that they’re able to contextualize the strengths/weaknesses of a prospect in relation to the current trends of the NBA and whether that hinders or elevates their standing, to go along with team fit/optimizing player development. Though public writing on footballing young talents has gotten better at including an examination on team fit, it could still do better at also comparing their skillset to the ever-changing landscape of the sport at the highest level.

Given that the season is over and the summer transfer window is nearing, this seemed like an opportune moment to do a deep reflection on some of the bits that I’ve learned from undertaking this two season journey into young talent evaluation. On the whole, I'm not sure how much value this will have, but I think there’s something to be said about having transparency on my end for future reference when looking at players. To be sure, even with what will be said moving forward, I would be the first to tell you that all of this is merely a fraction of what goes on inside clubs, especially ones that have their ducks in a row. People like myself who do this don’t have access to medical or background personal information on young talents when examining them, which are big parts of the overall picture. More than anything, this should be considered musings from someone on the outside.

As for the actual players being scouted, the image below is a rough list of the young players that I’ve watched some level of match footage over the past two seasons, divided into very broad player archetypes. While I’ve dipped my toe into looking at other positions like centre-back and goalkeepers, it would be disingenuous to try and write in detail on them, especially seeing as there are much more qualified individuals that would be valuable resources in that department (Mark Thompson for centre-backs, Paul Riley and David Preece for goalkeepers).

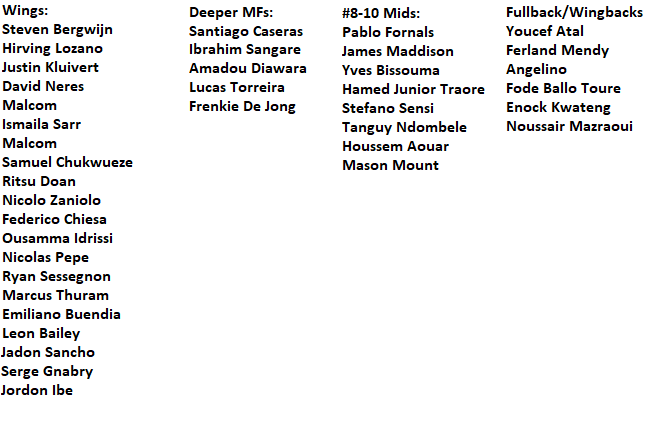
For part 1, we'll be solely looking at wingers. Without further ado...

Wingers:

Of the player archetypes that I’ve looked at, the wide position is definitely the one that I’ve looked at with the most detail. I also think that it’s the position that lends itself best when it comes to using crossover knowledge from basketball.

You can think of wingers in some ways like how analysts contextualize lead initiators in the NBA. The best of the best in basketball are able to shoot in multiple ways from numerous areas on the court (spot-up shooting, shooting off of a live dribble), have the requisite functional athleticism to beat their man with a live dribble, and have vision to make advanced level reads with their passing. Having demerits in either shooting/passing/dribbling pushes you down a rung, and in some instances, hurts your ability to play at the highest level. Certainly with young talents in the NBA, there’s leniency for not seeing that total package right away from the majority of them, but finding enough glimmers of hope for this is the goal. This type of mindset can be transferred quite easily when projecting young wide talents in football.

When people talk about dribbling when it comes to wingers, there can be a lack of analysis outside of “he can beat a man or two”. Certainly, the ability to beat people off the dribble is important, but clarity should be given when describing dribbling aptitude and the process behind it.

There are a multitude of ways for a wide player to execute a 1v1 dribble: cutting inside with their favored foot, walking the sideline by pushing the ball, quick intricate moves in tight spaces, carrying the ball from slightly deeper areas (the Hazard specialty). When it comes to the first one, the importance of gaining access to the halfspace (and beyond) are paramount: greater passing angles, the addition of being a threat to shoot, and even simply the continuation of possession. Finding wide players who are able to do this with some regularity can be such an asset. In sort of the same vein with how shooting is such a bedrock skill in the NBA, dribbling for wide players can be seen in something of a similar light because it is an avenue to unlocking other areas in their game.

Another dribble that some wide players have in their pocket is the ability to push the ball along the wide areas and sprint to receive it themselves while getting past their opponent in the process. This could happen either around the middle third or closer to the penalty box. Though the benefits that come from this play aren’t quite as pronounced as the inside dribble, you can still have better opportunities at delivering low passes/crosses into the box following good execution off the dribble along with getting into the box themselves.

Ismaila Sarr has so far shown enough ability to suggest he'll continue to be really good at this, and his improvement this season has come from his ability to utilize that threat along the sidelines into more playmaking opportunities. Justin Kluivert during his time at Ajax was another example of a winger who could turn his dribbling out wide into something productive near or just inside the wide area of the box.

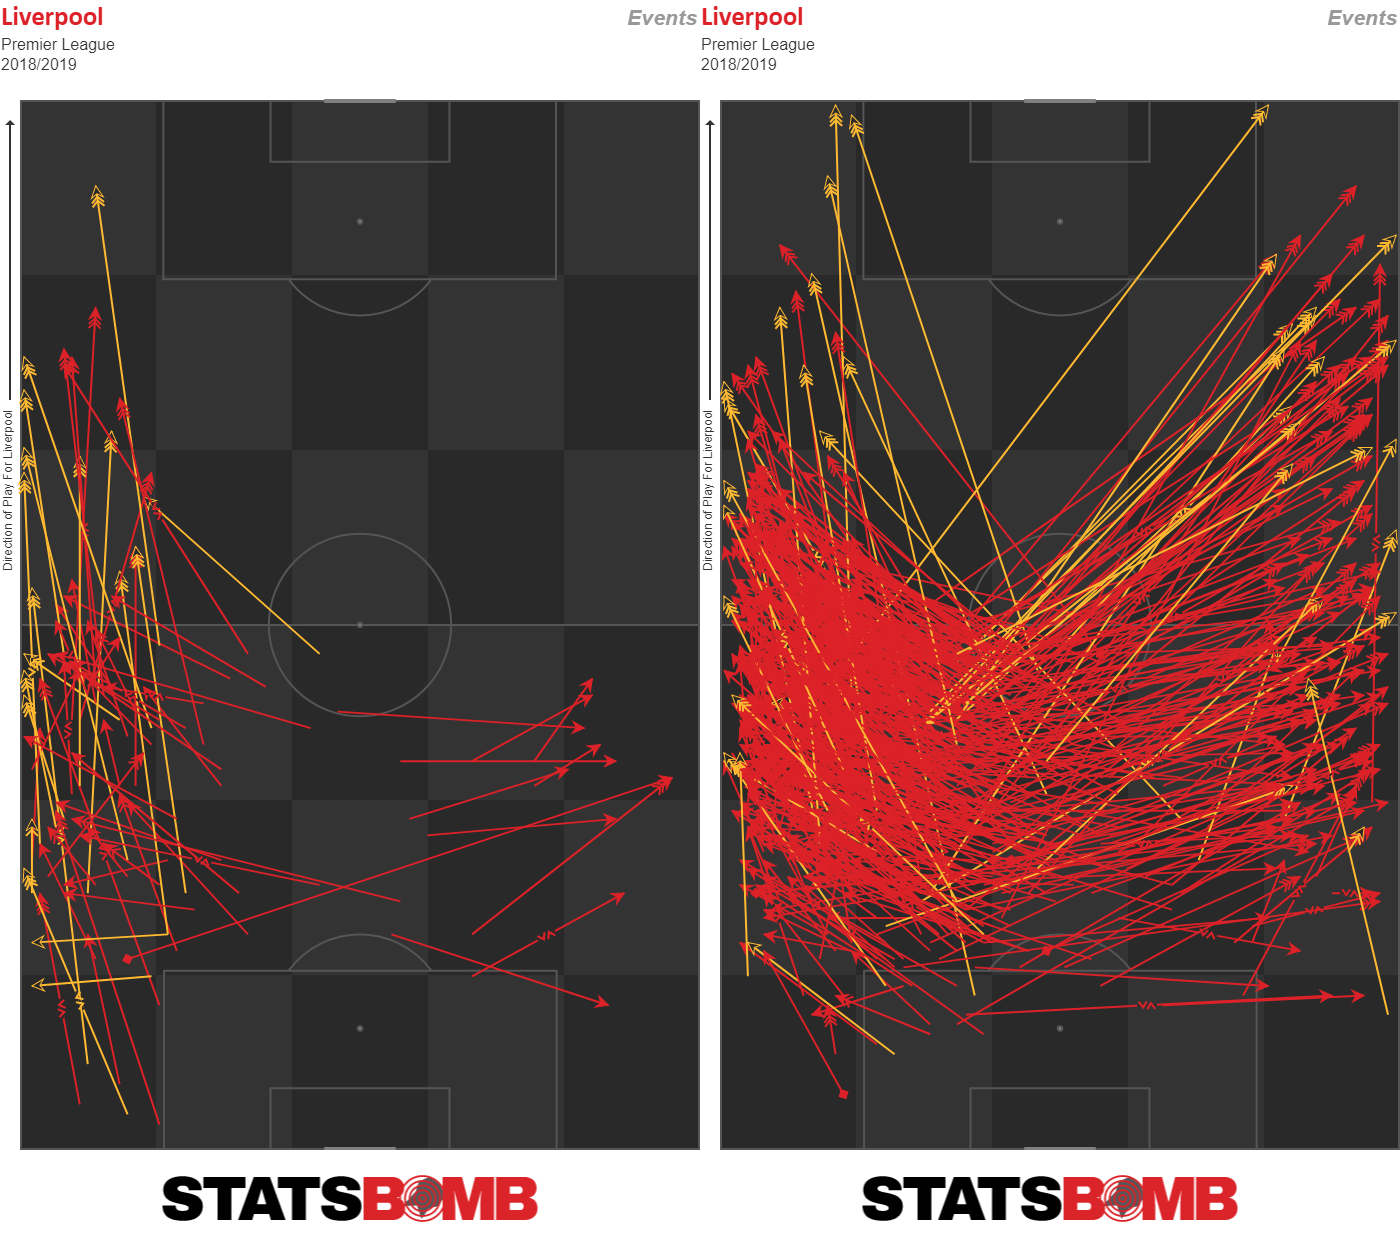
On the other end of the spectrum, a worry of mine for Oussama Idrissi was that he had issues trying to execute this type of dribble in the Eredivisie (below). While Idrissi was a proficient dribbler on the whole (3.28 dribbles per 90), there were enough instances of him not having that extra gear to make you wonder how he'd do outside of the Eredivisie (it's also fair to point out that his destiny could simply be moving up the ladder and playing for Ajax/PSV, which would alleviate these concerns).

One more note on dribbling skills in isolation: while it's not a death sentence to be extremely one-footed in terms of dribbling acumen, it does put a heightened emphasis on possessing on-ball athleticism. Two test cases for this are David Neres and Samuel Chukwueze. Both of them are on the extreme end of only utilizing their left foot for dribbling and overall on-ball actions, but there's more to believe in with Chukwueze than with Neres given his ball-carrying during transition and greater separation after using feints and sidesteps.

There's also a level of physicality that Chukwueze has that Neres doesn't quite possess, which helps with Chukwueze's dribbling. This isn't to say that I would rank Chukwueze as a better player than Neres, but both players make for an interesting comparison. While dribbling is a foundation skill for wide players and dribbling diversity should be examined, a winger becomes much less interesting if he can't bring much of anything else to the table.

It's all well and good to have the athleticism to rack up dribbling statistics, but if far less good comes out, it just adds up to a shoulder shrug. This is partly why someone like Jordon Ibe hasn't kicked on during his time at Bournemouth because of a lack of definable skills elsewhere post-dribble. It's best to look at wide players who can leverage their dribbling exploits into something greater, either for themselves or others. With regards to the skill intersection of dribbling + shooting, one area that is interesting is being able to create shots off the dribble.

This is admittedly a more niche area given that shots for wide players off the dribble don't make up a large portion of their shot distribution. These shots also tend to be on the lower end of shot quality, but it's still nice to have that shot in your back pocket from time to time when the game mucks down and getting 5-8% shots represents a semi-decent option. Among the many things that Leon Bailey did in 2017/18 that made him a valuable prospect, he definitely would classify as a wide player who could get his own shot.

If one was to look at shooting in a more isolated manner, that's where team dynamics become a much bigger factor and how that could affect shot locations. Certainly there's still individual influence that exists with shooting skills. If a wide player is able to have equity as a two-footed shooter or something close to that (Ousmane Dembele for example), that is valuable to have on your squad and makes them less likely to be shaded onto one foot when being defended.

Another skill of shooting when scouting young talents is whether or not there's enough confidence to project them being a good finisher when accounting for shot placement. Though you're overall better off finding wide players who have strong expected goals per 90 rates, because that's more of a repeatable skill over time, finishing skill is still something worth investigating.

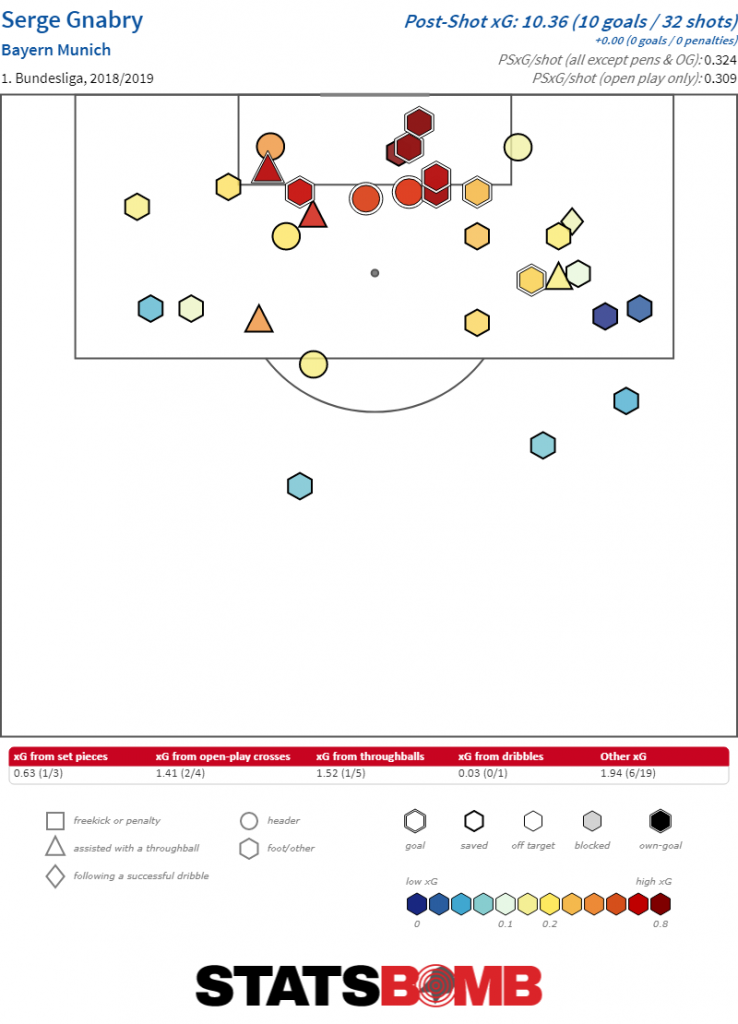
Though he no longer qualifies as a young talent, part of the appeal with Nabil Fekir during his younger days was him having a shooting style that would be conducive to outdoing post-shot expected goals models. Serge Gnabry is another test case given his goal tally outpacing pre-shot models in his previous two seasons in Germany, which presented the possibility that he could bring extra value as a plus finisher. It'll be interesting to see if that does turn out to be the case with Gnabry, as he was essentially level with his goal tally this season at Bayern when accounting for placement.

Playmaking responsibilities for wingers have evolved over the past 10-15 years, with full/wing-backs taking up a fair amount of the traditional duties that wingers used to have, one of those being pumping balls into the box from longer distances. This isn't to say that wingers still aren't tasked with lots of playmaking usage, but now you're much more often finding them making shorter ground passes into the box and accumulating open-play key passes in that manner (of course there's an added benefit if wingers can also have some crossing acumen).

There are metrics that when pulled together can give a decent picture at how good a winger is at making plays for others: open-play key passes, expected goals assisted, passes into the box. The more boxes that are ticked, the greater certainty there is. As for how playmaking can translate over film, a good sign is if they're able to have some level of diversity in the way they create their chances. This could be cut-backs, making reverse passes to slip runners at an angle into the wide areas of the box after accessing the halfspace areas, or throughball attempts that split the backline of the defense with different parts of their foot (outside/in/toe poke).

This shows a level of coordination that should instill some confidence that it's translatable across different levels of competition.

An interesting test case for this will be Steven Bergwijn, should he depart from PSV this summer. The Eredivisie has gotten a reputation over the years for not having their talents translate well elsewhere, but Bergwijn has displayed enough diversity with his chance creation over the past two seasons to believe that he'll not be another example of that. He's got near elite touch with his passing in the final third, and he's also able to possess this touch on the move, which is impressive.

Wingers not only create chances against a set defense, but can also provide value as playmakers during transition opportunities. This could mean that they're the initiators of the counter attack from deeper areas, or ending the transition attack with an incisive pass inside the penalty box. Being a good playmaker during transition involves the combination of decision-making along with on-ball coordination, all the while having to do that at top speed. That is far from being an easy task, which makes what Jadon Sancho has done at Dortmund quite special. He's an absolute terror during Dortmund transitions where he'll receive the ball in space and make either forward passes into the box for open teammate or cutbacks from the right side of the box.

Wingers can also act as playmakers but also have the burden of carrying the ball from deeper areas, particularly if the club is not exactly stacked in collective talent. Malcom's 2017-18 season was filled with these type of moments where he would be utilized as an outlet for transition play, push the ball up the field and still be tasked with making key plays in the final third and penalty box. What was difficult to project was how much this style of play could translate to bigger clubs that dominate play and face more set defenses.

On the negative end, it's a worry when not only a winger doesn't successfully complete difficult passes, but opts to look away and settle for merely recycling the ball. It's one thing to have failed attempts at passes, but to leave stuff off the table in opting for conservatism is a concern. With Nicolo Zaniolo, this was an issue of mine amidst the hype machine that was generating for him during parts of last season. He didn't provide ample value as a passer, which almost made it like Roma were playing with 9 outfield players instead of 10.

Will this linger with Zaniolo the rest of his career, or will it become less of a concern moving forward?

The majority of the discussion has focused on what wingers can do on-ball, but off-ball work is certainly a noteworthy component as well. Wingers who have some questions surrounding their athleticism on-ball can certainly make up some of the lost value with having elite or sub-elite speed + timing with runs. Of course finding wingers who can able perform on/off ball is the dream, but in the absence of that, there's still value to be had by being a speed demon with good positional sense.

Though he is proficient on-ball, Hirving Lozano is damn near special off of it, and Chiesa should project to do well in using his off-ball speed to create shooting opportunities once he gets to a good/great team. For all the worries I've had with David Neres as a prospect (documented here and here), a big reason why I can't get too down on him is because of how dangerous he can be with this part of his game to go along with his passing accumen. Certainly, how much of this skillset he will be able to show outside the Ajax cocoon is a genuine question, but Neres' off-ball work should be able to travel at some level and it's encouraging that he was able to show this part of his game during Ajax's Champions League run.

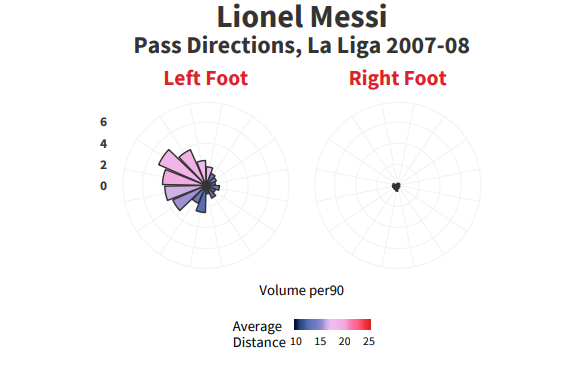
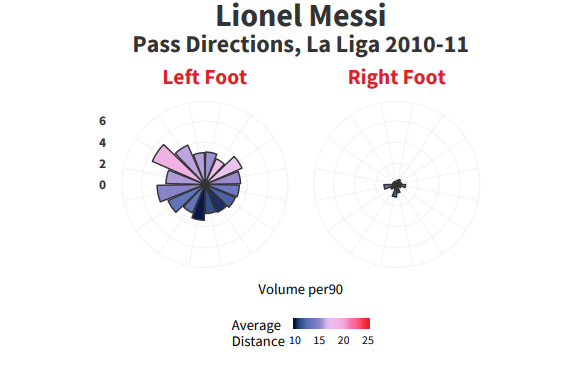
So after all that's been discussed, what can teams try to look for when scouting young wingers? There's no easy answer to this. In a perfect world you would find a prospect who checks off all the boxes, but that's not realistic because at that point, you would be searching for a young Lionel Messi. Dribbling diversity via functional athleticism is a near must, along with the ability to maneuver oneself within the halfspace.

Between looking at post-dribble actions concerning playmaking and shooting, I would lean towards playmaking being more important given the greater likelihood of good-to-great chances being accumulated via post-dribble passes versus individually creating your own shot. Ideally, the winger that's being scouted should have a repertoire of passes into the penalty box that they can make from the final third, but they should at least have the reverse pass into the wide areas of the box as something they can go to when trying to unlock the defense.

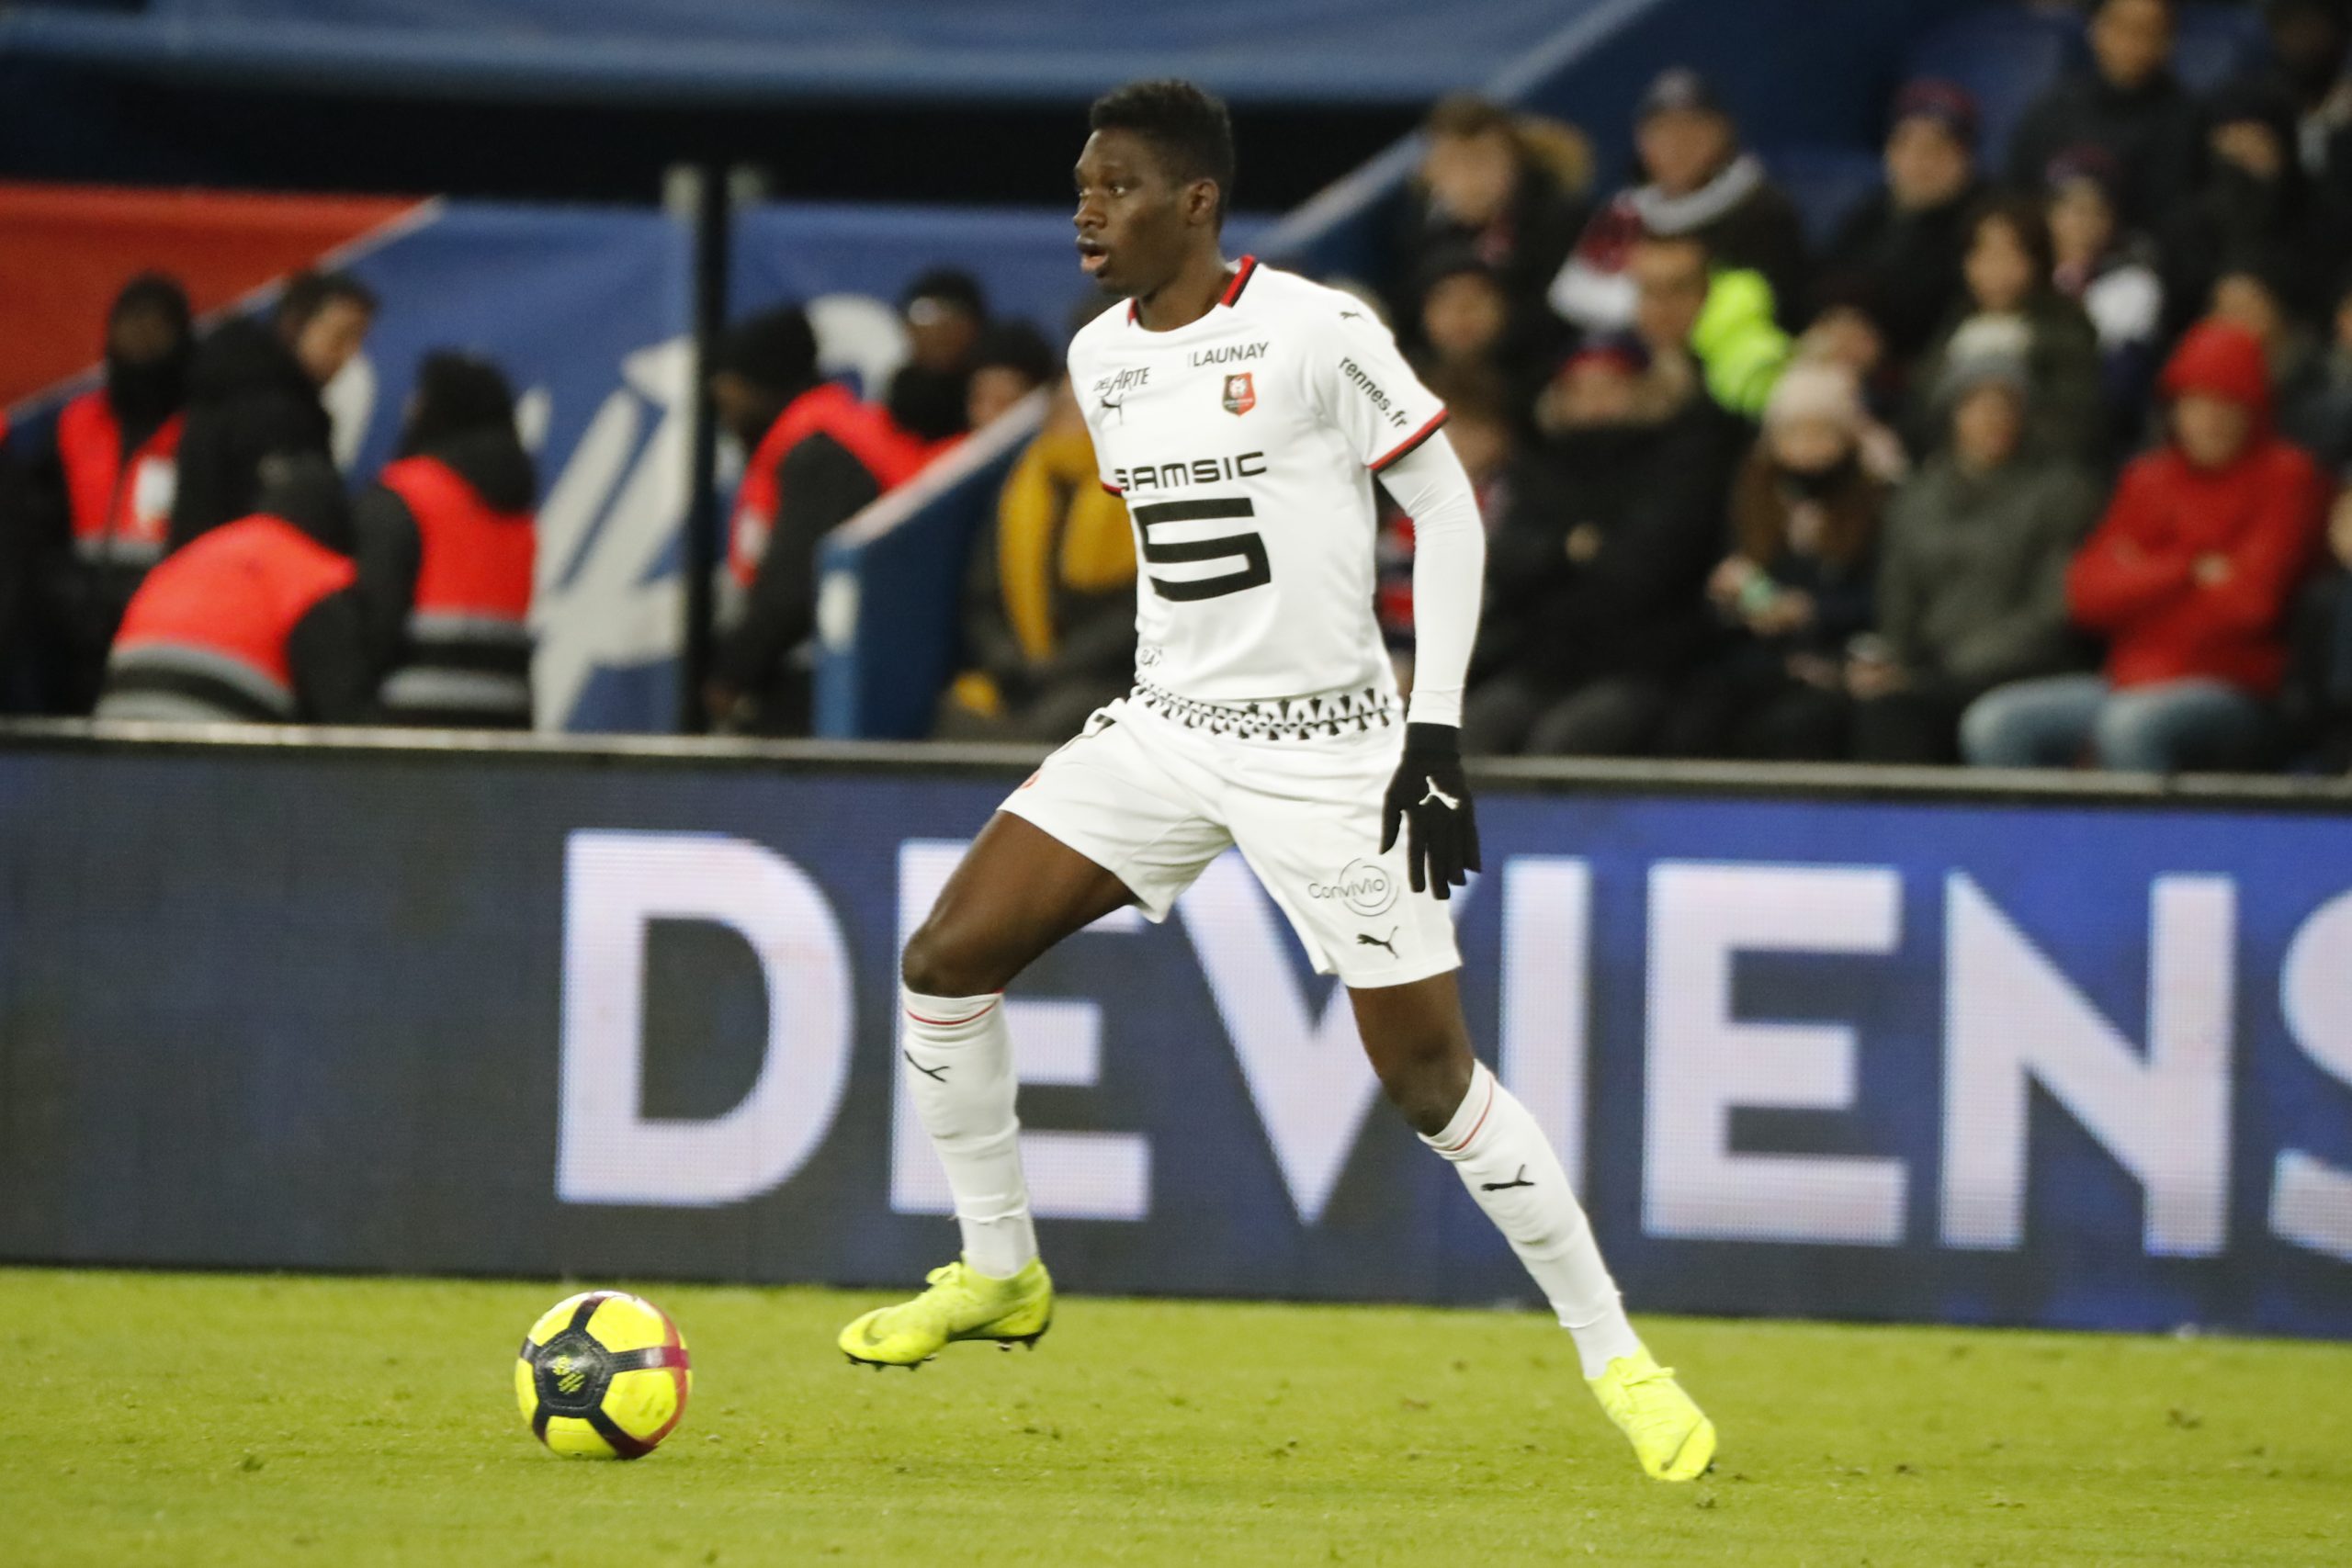
There are certainly clubs that would rather find a high-volume shooter from the wide areas rather than a dynamic playmaker, which goes back to team fit and optimization for the scouting club. Before ending part 1, I would be remiss if I didn't touch on perhaps the most intriguing prospect I've come across and one I've talked about quite a bit, Marcus Thuram. If I had to do a big board/ranking of wingers based on current talent level + future upside (something that's done all the time with American sports when looking at young talents), he'd probably be further down the list, but I still find him to be a fascinating player and something of an unknown despite having played over 4000 minutes in Ligue 1 over the past two seasons.

Part of that is due to playing for a small club like Guingamp, while there's also the wonder on whether he'll continue to be a wide player or shift towards more of a central role. The reason why I'm slightly more in favor of letting him continue to start from a wider position for the near future is his high level of functional athleticism to beat people off the dribble using his unique combination of size and speed, in particular his gift for covering ample ground with his first step and his usage of his off-arm to keep opponents away from the ball.

As well, he's shown just enough glimpses of playmaking equity that if I was running a mid/high level club, it would make me want to continue to see just how much he could grow in that part of his game as a winger when surrounded with better overall talent. It's not a situation where there's absolutely nothing to work with his actions post-dribble, though it's fair to wonder just how much room for improvement exists with Thuram's passing.

There's the real chance that should he play on a top 4-6 clubs in a big five league, he would be more of a utility player than a major contributor, but it isn't entirely unreasonable to think that he could hit his higher end outcomes and become a prominent player for notable European clubs if his passing really becomes a strong suit. With Guingamp's relegation to Ligue 2, Thuram should be able to be had at a fairly cheap rate and I would try to get him as a lottery ticket with the knowledge that weren't he not to appreciably improve over time and remain at more of his floor, it wouldn't be too much of a disappointment given transfer fee and wages.

And that's all for wingers. Next week in part two, we'll be looking at midfielders and fullbacks.

StatsBomb Data, One Year On

One year ago today, I stood in a lecture hall in South London, waiting for StatsBomb’s launch event to start. The Data project was secret, and had been under wraps from the outside world since inception. This event was the culmination of nearly a year of work.

It was also probably the biggest personal and financial risk I had taken in my career.

Needless to say, StatsBomb Data came as quite a surprise to the data world. That's because StatsBomb Data wasn’t supposed to exist.

It wasn’t supposed to be possible to build the infrastructure necessary to produce detailed event data at a higher spec than Opta and the other competitors in the space - at the quality we knew we wanted - without far more time, far more money, or both.

But there I was, happily setting up the room with our team as we prepared to officially announce our new baby. One of my favourite things in the world is releasing new products to an audience, but this was special.

A year later, one question I often get asked is why? Why would we take all this risk to go after a market that already existed, and one where one giant company had developed a near monopoly on top quality data?

Because someone needed to do it better.

The need to improve our understanding of football demanded it, and it was pretty clear that none of the major suppliers were going to deliver a better product. I know, because I talked to a number of them about it.

“Hey, what about this?” Silence.
“How about collecting this new thing?” Silence.
“We are a paying customer and have this problem - could you, I dunno, answer your customer service emails?” Silence.

In the end, I came to the conclusion that StatsBomb could do it best. So we did.

And boy was it hard. Like, not from a from a technical perspective - that was fairly straightforward. Collecting data from video has been around for ages. Adapting the software to allow collectors to add new events and qualifiers was not terribly difficult, and we had a great partner in Arqam FC (now part of StatsBomb) to help us pull it off.

But from a design perspective? A process perspective? A quality perspective? Really, really hard. So many difficult choices were made, challenging problems were solved. Many more problems had no solutions, they only had consequences. You can make it this way or that way, but neither answer is optimal. Apparently kids these days call this “adulting.”

“I don’t think we expected this, but you are now our most important data provider.”

That’s a recent quote from one of our Champions League teams, and a huge compliment to the team at StatsBomb and Arqam for what we developed.

A compliment of a different sort is that teams who are on StatsBomb Data right now improved their points totals by 20% versus a year before. Better data = better analysis = better performances. It's something I hoped for when I started this project, but it's been pretty amazing to see it play out in the real world.

As I said, this stuff is hard, and often in ways I didn't even expect. We’re still not perfect, but like the teams that are our customers, we work our asses off every day to get better.

In fact, a lot has happened in a year. Maybe it’s best to review how StatsBomb has changed as a company (and a website) in that time.

Flashback one year: On May 9th, we introduced our new Data to the world. About an hour before our launch, Opta threw this tweet out. What curious timing.

Followed by this one a day later, and a blog explaining their new qualifiers.

Thanks for keeping us on our toes, folks! And for designing a data upgrade that can apparently only be interpreted via 3x3 matrices before disappearing from the world again. This announcement came as a huge relief to us because it proved to be so far inferior to what we had developed that we now knew we had a chance to succeed.

In contrast, StatsBomb customers know how much pressure a shooter is under from exactly how many defenders and the GK, in which locations, on every shot. This information has been available since we launched. We have even documented our research in this area extensively, here, here, and here.

Back to our story… new data also meant we were no longer shackled by restrictions from our old data provider, which meant we could turn StatsBomb.com into a place to post analysis and insight from whomever we wanted, on whatever topics we wanted, five days a week. So that's what we did. We recruited Mike Goodman to both write and develop content, while allowing a new crop of talented writers to show off so many cool new things.

For example, we started to profile "pressures", something we now view as the basic unit of defensive activity and an event that is unique to SB Data. Our research shows having actual pressing data (not derived info, like our competitors) dramatically changes how you evaluate teams and players defensively. Why is Roberto Firmino amazing - he's a striker that doesn't score many goals? How can we better show just what made Burnley's defending in 17-18 so unique? Pressures unlocked this information in a way that simply wasn't available before.

Or how about pass height, which is unique to StatsBomb Data, and is a fascinating indicator of team style. It's also a key component in creating better pass difficulty models, which is a hugely important area of research in a game that is largely comprised of passes.

James Yorke recently wrote about pass footedness, which is also unique to StatsBomb Data. Why does this matter? Because with this information, we built a new passing model that lets teams fully profile the quality of player passing with each foot. Maybe one player is amazing with his right foot, but only attempts 5-10 yard passes with his left? That’s in the data. Maybe your coach demands a two-footed player who can make difficult passes with both feet? The model lets your recruitment department uncover those types of players easily.

And possibly the thing that got us the most attention that we released to StatsBomb IQ in the last year was our Goalkeeper Module. Because our data has the location of the GK and defenders on every shot, we are now able to evaluate GKs via data in a way that was never possible before. Data scientist Derrick Yam used this to question the fee Chelsea spent on Kepa Arrizabalaga at the season’s start, and his framework for GK evaluation was accepted for poster presentations at the massive Sloan Sports Analytics Conference in Boston.

Beyond the public-facing research, we also have done unique and fascinating customer-only research as well. This includes detailing the new expected goals models, more information on GK evaluation, a groundbreaking analysis of [REDACTED] that I hope to be able to talk about in the future, and a recent study of how the Danish Superliga has changed over time, plus how it compares to bigger leagues like the English Premier League and German Bundesliga. This is above and beyond the typical head coach and player research we produce for our consulting customers on a monthly basis.

Behind the scenes, we produce regular white papers for customers, detailing our research, and unlike most companies, we discuss in detail where our research has failed. We think this is hugely valuable for customers to see, partly so they understand what we are working on for the future, and partly so they can learn what approaches to modify or steer clear of. Data science is hard and data scientists are expensive. Saving your customers time by educating them on failed approaches is a hugely valuable service, but one you'll never see out front.

I designed the initial data spec, but I've still been somewhat shocked to learn that there are so many new, useful elements inside of StatsBomb Data that it will take us years to explore it and learn what it has to teach us. However, as noted above, customers are already using it to succeed.

Speaking of teaching, we also recently launched our first analysis courses to help anyone interested in the sport better understand how it works through our research. The introduction course is suitable for literally anyone who likes football, while the Set Pieces courses are geared for coaches and analysts who want to learn more about this phase of the game.

Although it is increasing every year, data use in football is still in its infancy. I decided we needed to get out there and teach the information to the masses, and I think what James and Euan have produced with these courses is both unique and exceptional. If interested, you can find more information here.

So That Was the Past Year, Wrapped Into a Tiny Bow - What’s Next?

We will keep getting better. We recently announced data upgrades for next season, including a video explanation of the new stuff we are collecting and why. We are pretty sure Shot Impact Height will improve the accuracy of expected goals models, so we have incorporated that into our data collection. We have also added body pose information about GKs on every shot and save into the data spec. From a football perspective, GK position on the pitch isn’t just a dot of x,y information, and our data will now convey a lot more about what GKs are actually doing when it comes to shot stopping.

We also have exciting new things coming to StatsBomb IQ, including a tactical suite that will change how coaches and analysts are able to use data to analyse their own teams and their opponents. It’s the culmination of our own work in football combined with years of talking to coaches and analysts about how they look at the game, combined with understanding how data can improve that process. There’s no hype when I say our product will be great, and there is nothing else like it. Expect to see more information on this product as European teams get into their preseason camps.

We will also continue to release free data to the football world. The FIFA Women’s World Cup data will go out to the public daily during the World Cup itself, and we will keep producing FAWSL and NWSL seasonal data for free. And... there will be a new release of free men's data beyond the 2018 World Cup that's already there, but I don’t want to say any more because I don’t want to spoil the fun.

Another thing that will happen this year is that our competitors will continue to try and copy us. That’s just how business works.

They copy, we innovate. They market, we produce. They appear in media…

We change football.

If your team isn’t using StatsBomb products and services right now, you’re already behind. And given how quickly we are releasing new things that help our customers perform better, that is the one thing that will probably not change in the year to come.

--Ted Knutson

CEO, Co-Founder
StatsBomb
ted@statsbomb.com

Set Pieces Remain An Underutilised Gamechanger

This week I was lucky enough to present a comprehensive analysis of the Danish Superliga to an audience of 300 coaches, analysts, and administrators in Danish Football. The report was commissioned to not only analyse how the league has changed over the last five seasons, but also to benchmark it against the German Bundesliga and English Premier League. Our analyst Euan Dewar did a great job on the analysis and preparing the report, and it was fun to once again be in a packed room of football people, discussing data analysis. My understanding is that the entire report will be made available to the public at some point in the future.

StatsBomb do this type of analysis for clubs, federations, and governing bodies fairly regularly, and it’s a huge compliment to be trusted to produce honest, insightful analysis about the game.

One thing that was absolutely clear in the report was that Danish teams remain innovators in one specific area: set pieces. Danish teams score consistently more goals from set pieces than pretty much every other league in the world, including ones with considerably more money and more talent. (For more analysis on this, check out my earlier piece I Think We Broke Denmark.)

Let me also make something else clear - more goals are not being scored off set pieces because the defenses are bad at defending this phase of the game. More goals are being scored because a number of Danish teams are simply better at executing them. And they are better at executing because they do things differently.

What are the differences? First of all, they shoot more often off direct free kicks.

This might seem a basic point - OH GEEZ TAEK MORE SHOTS, SCORE MOAR GOALS RAAAAR - but they also score a higher percentage of those shots. Danish teams convert 8% of their DFKs compared to 6% in the Premier League, and 5.7% in the Bundesliga. That’s a significant gap, and one that seems to suggest there is a lot of slack in execution for teams in the bigger leagues.

Alright, what else?

Danish teams also target and succeed at exploiting different spaces off corners. If you know the better positions of maximum opportunity and are able to deliver balls to those areas, you can score more goals off what is traditionally a low-return phase of the game. (Teams score off corners between 2 and 2.5% across the full data set. We have seen certain teams double or treble that for multiple seasons.)

And…?

Well, remember how Andy Gray mocked Liverpool hiring a long throw coach?

Look ma, nearly free goals! (Approximate value in the Premier League, £2.5M each.)

Only possible in Denmark? Nope:

Find the edges, then exploit them. One team in Liverpool is suddenly scoring a bunch of goals from long throws. The other one hired our favourite long throw coach--Thomas Gronnemark.

Set piece execution is one main reasons Liverpool are having their greatest ever Premier League season. We have Liverpool scoring 17 goals so far in the league and conceding 6 for a goal difference of +11 in this phase of the game. Manchester City are +2 (9 scored, 7 conceded). Without that gap, the goal difference between the two contenders would go from a gap of 8 to 19, and there would likely be no title race.

The same is true further down the table as well. Given how tight the Top 4 race is right now, it’s entirely possible a difference of a few goals off this phase of the game could swing Champions League qualification for next season. When qualification is an automatic passport to tens of millions, and the least an English club will receive this season is a minimum of £86m, any edge to traverse the gap or maintain participation is worth every penny of outlay. We’ll take some time to revisit this once the season ends.

A couple of notes before I wrap this up...

Set Piece Program
We are taking applications from professional teams that want to work with us on set pieces for next season. We only work with a couple of teams on this max every season, and are exclusive to one team per league. If you work for a professional team with significant budget (bringing you goals does not come cheap), please send me an email to ted@statsbomb.com. We will choose who we work with by the end of May, so if your team wants to be in the mix, now is the time.

Set Piece Courses
For everyone else, we have tickets available for three set piece courses in June in New York, London, and Los Angeles. The courses will be taught by me, and cover both process and execution of set pieces from a coaching and analysis perspective.

To my knowledge, no one else in the world teaches a course like this, and certainly no one who works with professional teams. I made the decision to teach this information to interested parties quite simply because I feel the game is ready to change, but needed more talented people with education to carry it out. Part of my commitment to StatsBomb and its audience has been to teach people more about the game and how it operates instead of hoarding the info, and this once again falls squarely under that umbrella.

Links to buy tickets can be found here:

New York – June 2nd

London – June 11th

Los Angeles – July 7th

I hope to see a lot of you this summer.

Ted Knutson
CEO, StatsBomb
ted@statsbomb.com

Header Image Courtesy of the Press Association

Details on Our New Intro to Analytics and Set Piece Courses

A couple of weeks ago, we announced on our social media that we would be launching an Intro to Analytics for Football Professionals course here at our offices in Bath, England.

The idea behind the course is that analytics and data use is becoming more and more important in both the team and media spaces and there are currently a dearth of good places to learn this information from scratch. Coaches need this info. Analysts need this info. Pundits need this info (please jesus, let the pundits realise this). Future coaches and analysts need this info! Thus it makes sense for us to develop teaching material to fill the gap. There's a bit of risk here, because developing a full day of course materials is about a 6-week project for a single analyst, and honestly, we don't know if we're right. What if no one actually wants to attend this course?

On the other hand, it makes a ton of sense for us to teach it. We have been pioneers in this space since 2013, we have our own data for students to leverage, our own cutting edge analytics platform to use during courses, and have actually worked inside of football for teams both very small, and very very large. We also feel like there will be a shortage of qualified analysts for teams to hire as more transition from no data analysis to heavy data analysis, and we need to help pick up the slack.

The initial course offering of thirty slots filled in five days.

Okay then, demand question (mostly) settled.

We also received a flood of questions about when we would offer more courses and where we would offer them (London, Germany, Spain, the U.S., Australia, online)? Baby steps!

After about ten days of trying to find venues that made sense, we have now locked down space to host two fresh classes in London in June.

PLEASE SIGN UP FOR THE INTRODUCTORY COURSE HERE.

Along with the Introductory course we previously announced, we will also begin teaching a new course focused on Set Piece Design and Analysis.

First we broke Denmark. Now we're going to help all of you break the rest of football.

Our Set Pieces offering is a practical course designed for football/soccer coaches and analysts to learn how to get the most out of this undervalued phase of the game. In one day, we will present the building blocks for the success we have had executing set pieces at the professional level.

I don't believe there is anything else like it.

Given how many people ask me on a weekly basis if I can give them more info on how to improve their set pieces, and how many professional clubs have already expressed an interest in this new course, I suspect demand here will be high and spaces will fill quickly.

PLEASE SIGN UP TO THE SET PIECES COURSE HERE.

What's Next?

If the London courses fill quickly, we will begin looking for space to run additional Introduction and Set Piece courses outside the U.K. We will potentially do a U.S. tour this summer in major cities, plus Barcelona and Madrid (en espanol), and somewhere in central Germany, but everything depends on whether there is enough interest in these London courses to expand. You guys seem excited, but as usual, I could be wrong.

Alongside the next set of courses we announce, we will also build a new page on our website to better keep track of our education schedule.

Those of you who listen to our podcast also know that I teased the concept of building a Data-Based Recruitment course that we may do a few times a year, and it's possible we will do something very high end on data infrastructure, data visualisation, and programming somewhere down the road.

Football is in a significant period of change right now, and I'm genuinely happy StatsBomb is at the forefront of that change, while teaching people skills they will need to succeed in the future. Given the feedback we've had about our education initiative thus far, you guys are happy we're here too.

Ted Knutson

CEO, StatsBomb

ted@statsbomb.com

StatsBomb Elevates Their Industry-Leading Football Data Spec Yet Again

On May 9th, 2018 StatsBomb announced our new product, StatsBomb Data. Our football data features massive upgrades to the event data world including

  • Location of defenders and goalkeeper on every shot
  • Defensive pressures
  • Passing footedness
  • Pass Height
  • Ball Receptions

And so much more... On release, StatsBomb Data ended up with 60% more events per match than the competition. Our data is currently collected across 22 leagues and we plan to double the number of leagues we collect over the next 18 months. On the StatsBomb IQ side, we spent much of the last year unlocking the power of StatsBomb Data inside our analytics platform. Customers now have information about player and team defensive pressures where none existed before.

We also released an entire module focused on objective information that helps evaluate Goalkeepers, previously a problematic area of player analysis. Are you going to buy or sell a goalkeeper this summer? Then you really need to be on StatsBomb IQ. StatsBomb Data represents a paradigm shift in the football data industry.

Having been around this industry since 2013, you almost never see significant upgrades in event data specs, but we packaged a decade worth of innovations into our launch product. But that was what we did last year... What have we done for you lately? Not content to already have the best data in this space, we introduced new upgrades.

Shot Impact Height

You know those crosses that are too high, but the attacker goes for the shot anyway and it glances off the top of his head as it’s vaguely looped toward goal? Those look the same in the data as a standing header with perfect contact. They won’t look the same with StatsBomb Data. We have added a z-coordinate to the start of shots so you’ll be able to tell at what height the shooter made contact. By doing this, we get more useful information about each individual chance and another small variable that we think this will improve expected goal model performance. Those of you out there whose jobs do not involve improving the performance of expected goals models are probably like, “Whatever! This is boooooring.” I feel your pain. So how about this?

Goalkeeper Ragdolls

Introducing GK position information on shots has paid huge dividends when it comes to evaluating individual GK performance and positioning. However, we looked at what we were collecting and found a way to improve the information provided about goalkeepers in a massive way.


These are officially termed ragdolls because they are based on the dolls you see in ragdoll physics demos, but throughout design and development we have affectionately nicknamed them skellingtons. They capture the GK position at the start of a shot and at the point of a save/potential save in a way no company ever has before. And we will capture this information on every shot in every league we collect, from the English Premier League all the way down to League Two. These new upgrades plus a couple of other minor ones rolled out at the same time will give our data set twice as much information per game as our competitors. There is no extra charge on the new stuff to StatsBomb Data customers.

These upgrades to the data spec will start rolling out as part of our normal data delivery in March, and will extend backwards through all of our historic data. I think it’s been clear from the start that we’re a bit different from the other data companies out there. Our mission is to find innovative new ways to analyse and visualise the game, and provide our customers an edge over the competition. Watch this space - we’re just getting started.

Ted Knutson CEO, Co-Founder StatsBomb ted@statsbomb.com